21 July 2017
1QFY18 Results Update | Sector: Automobiles
Bajaj Auto
Buy
BSE SENSEX
32,029
S&P CNX
9,915
CMP: INR2,819 TP: INR3,281(+17%)
Motilal Oswal values your support in
the Asiamoney Brokers Poll 2017 for
India Research, Sales and Trading
team. We
request your ballot.
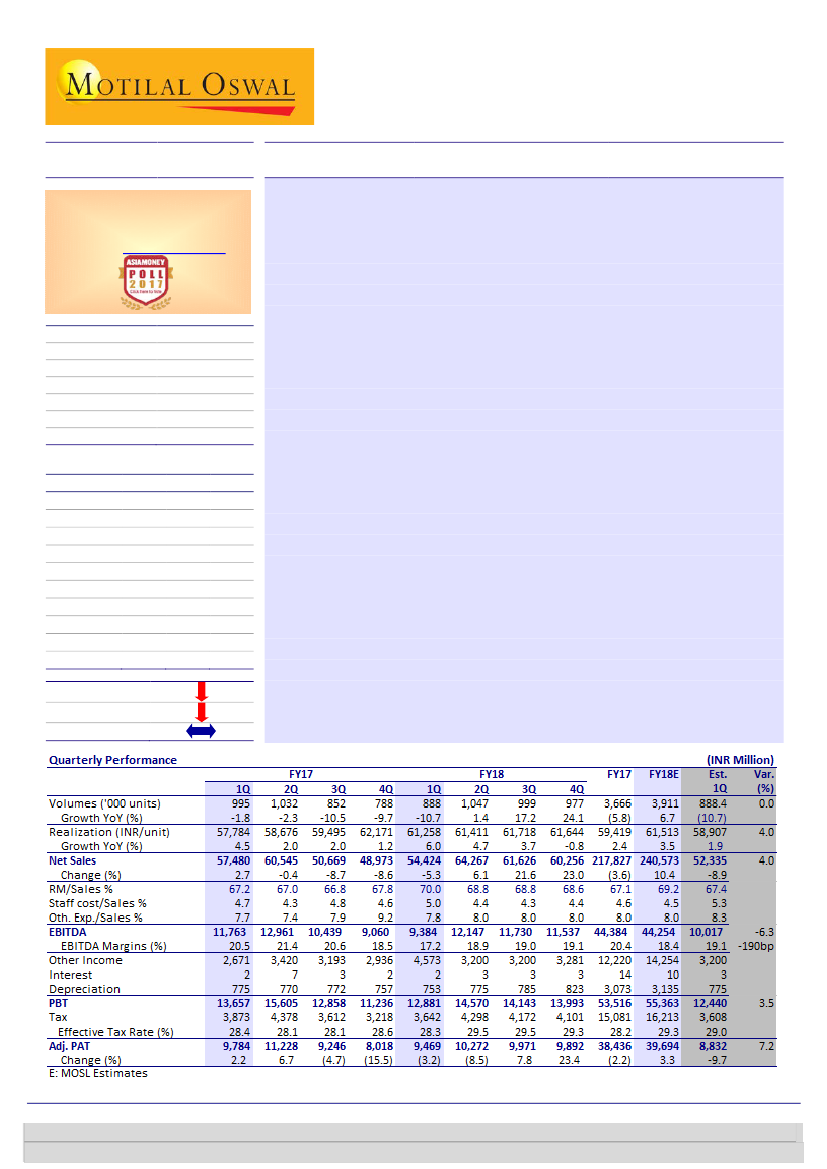
Higher RM cost, negative operating leverage results in 8-year low margins
Volume decline drags revenue; 6% YoY realization growth a surprise:
Net
sales declined 5.3% YoY (grew 11.1% QoQ) to INR54.4b (our estimate:
INR52.3b), as volumes declined 10.7% YoY (grew 12.8% QoQ). In the domestic
market, lower channel inventory and purchase postponement by customers
due to GST impacted wholesale numbers. However, an unexpected ~6% YoY
increase (1.5% QoQ decline) in realization to INR61,258/unit (our estimate:
+2%) aided revenue. Export revenue grew 20.5% YoY to INR24.8b.
EBITDA margin at multi-quarter low on higher RM, operating deleverage:
EBITDA fell 20% YoY to INR9.4b (our estimate: ~INR10b), implying EBITDA
margin of 17.2% (-320bp YoY, -130bp QoQ; our estimate: 19.1%). This was due
to higher RM cost (+280bp YoY, +220bp QoQ) and operating deleverage on
weak domestic volumes. However, adjusted PAT declined just 3.2% to INR9.5b
(our estimate: INR8.8b) due to higher other income. It reported exceptional
cost of INR320m related to GST-related compensation to dealers.
Management commentary:
(a)
Maintained motorcycle industry growth
outlook at 7% in FY18; BJAUT to grow at 10% from July 2017; guided FY18
exports at 1.6m units, (b) Guided EBITDA margin of 19.5-20% v/s 18.3% in
1QFY18, (c) Took price hikes of INR500-1,000/unit in 2W and INR1,500-
2,000/unit in 3W in domestic markets towards the end of May, and indicated a
price hike in exports from July, (d) Aiming at electric 3W launch in two years,
(e) In final stages of announcing a global alliance in 2Ws.
Valuation and view:
We have lowered our EPS estimates by 3-4% for FY18/19
on lower margin assumptions. Valuations at 20.5x/17.2x FY18E/19E standalone
EPS are attractive, considering worst of volumes and margins are behind us.
We value BJAUT at 18x FY19E EPS and add INR214/share for its KTM stake to
arrive at a TP of INR3,281. Maintain
Buy.
Bloomberg
Equity Shares (m)
M.Cap.(INRb)/(USDb)
52-Week Range (INR)
1, 6, 12 Rel. Per (%)
Avg Val, INRm
Free float (%)
BJAUT IN
289
814.6 / 12.7
3122 / 2510
-2/-14/-14
806
50.7
Financials & Valuations (INR b)
2017 2018E 2019E
Y/E Mar
218
241
271
Net Sales
44.2
44.8
53.0
EBITDA
38.3
39.7
47.3
PAT
132
137
164
EPS (INR)
-2.6
3.7
19.2
Gr. (%)
589
648
713
BV/Sh (INR)
25.3
22.2
24.0
RoE (%)
24.6
21.5
23.3
RoCE (%)
21.3
20.5
17.2
P/E (x)
4.8
4.4
4.0
P/BV (x)
Estimate change
TP change
Rating change
Investors are advised to refer through important disclosures made at the last page of the Research Report.
Motilal Oswal research is available on www.motilaloswal.com/Institutional-Equities, Bloomberg, Thomson Reuters, Factset and S&P Capital.
Jinesh Gandhi
(Jinesh@MotilalOswal.com); +91 22 6129 1524
Deep A Shah
(Deep.S@MotilalOswal.com); +91 22 6129 1533
Jigar Shah
(Jigar.Shah@MotilalOswal.com); +91 22 3982 5402

Bajaj Auto
Volume drop drags sales down by ~5.3% YoY; Realization growth better
than estimates
Net sales declined by 5.3% YoY (+11.1% QoQ) to INR54.4b (v/s. est INR52.3b), as
volumes fell 10.7% YoY (+12.8% QoQ).
Realizations increased 6% YoY to ~INR 61.2k (-1.5% QoQ), on account of higher
contribution from premium motorcycles and exports. However this was partially
offset by decline in 3W volumes in domestic market.
Total motorcycle volumes declined 11.1% YoY (+10.7% QoQ) to ~701k units as
domestic motorcycle volume declined 22.3% YoY (-3% QoQ). 2W exports volume
grew 7.8% YoY (-21.4% QoQ).
3W volume declined by ~7.8% YoY (+30.1% QoQ) as domestic volume declined
by ~30.4% YoY (+4.6% QoQ) while exports recovered and grew by ~28.5% YoY
(+65.1% QoQ).
KTM’s domestic volume increased 52.8% YoY, led by healthy response to
recently-launched KTM 250 (sold ~2,300 units) and KTM 390, which has wait list
in the domestic market. BJAUT indicated strong response to KTM in future.
BJAUT’s market share in domestic 2W segment contracted by 250bp YoY to
16.1% (-240bp QoQ). The sharp decline in market share was led by lower
channel inventory push v/s. competition. However retail growth has
outperformed wholesale growth in 1QFY17.
In 3W segment, BJAUT’s market share in Petrol and Alternate fuel segment
remained at 89% while in diesel and cargo segment its market share remain at
~33% and ~17% respectively.
Exhibit 1: Trend in product mix
1QFY18
Motorcycles
Domestic
% of total domestic
Exports
% of total exports
Total Motorcycles
% of total
Three Wheelers
Domestic
% of total domestic
Exports
% of total exports
Total 3Ws
% of total volumes
Total Volumes
426,562
89.1
349,142
85.3
775,714
87.3
52,347
10.9
60,373
14.7
112,720
12.7
888,434
1QFY17
548,880
87.9
323,660
87.3
872,540
87.7
75,204
12.1
46,989
12.7
122,193
12.3
994,733
YoY (%)
-22.3
7.8
-11.1
4QFY17
413,539
89.2
287,478
88.7
701,017
89.0
50,037
10.8
36,573
11.3
86,610
11.0
787,627
QoQ (%)
-10.0
-0.7
10.7
FY17
2,001,391
88.7
1,218,541
86.4
3,219,932
87.8
254,696
11.3
191,236
13.6
445,932
12.2
3,665,864
FY16
1,898,903
88.1
1,458,826
83.9
3,357,729
86.2
255,329
11.9
280,000
16.1
535,329
13.8
3,893,058
YoY (%)
5.4
-16.5
-4.1
-30.4
-28.5
-7.8
-10.7
-6.9
-25.3
-15.7
12.8
-0.2
-31.7
-16.7
-5.8
Source: Company, MOSL
21 July 2017
2

Bajaj Auto
Exhibit 2: Trend in market share
(%)
Segment Wise
Economy
Executive
Executive 100
Executive 125
Premium
Premium excl RE
Dom. Motorcycles
Total Motorcycles
Total Dom. 2W
Total 2W (incl exports)
Dom. 3W
3W (incl exports)
1QFY18
25.3
2.2
0.0
6.9
29.3
42.0
16.1
23.4
10.7
16.5
45.8
57.3
1QFY17
35.1
1.8
0.0
5.9
42.4
55.7
18.6
25.2
11.9
17.0
54.5
59.5
YoY (bp)
-980
40
0
100
-1,310
-1,370
-250
-180
-120
-60
-870
-220
4QFY17
25.5
3.4
0.0
8.7
35.3
50.3
18.5
25.2
11.4
16.5
45.6
55.4
QoQ (bp)
-20
-120
0
-180
-590
-830
-240
-190
-60
0
20
190
FY17
32.2
2.3
0.0
7.7
38.1
52.4
18.0
24.5
11.2
16.2
49.5
56.7
FY16
35.6
3.6
1.3
9.1
36.4
48.6
17.7
26.0
11.4
17.7
47.3
56.7
YoY (%)
-340
-130
-130
-140
170
380
20
-150
-20
-160
210
-10
Source: Company, MOSL
Exhibit 3: Sequential deterioration in domestic realizations
due to unfavorable product mix
Export Realizations
Domestic Realizations
62 59 60 61
62
60 60
57 55 60 60
55
49 54 53
67
55
Exhibit 4: Domestic motorcycle market share to revive as
benefit of new product launch to accrue
Domestic Motorcycle
29
28 27 27
26 26 26
23
Total Motorcycle
24
25 25 25
23 23
27 27 26
23
61 56 56 57 55 60
52 53 50 52 51 53 55 59 55 55 56
20 19
19 19 18
18 18
16 17 15 18 18 18 18
16 16
1Q 2Q 3Q 4Q 1Q 2Q 3Q 4Q 1Q 2Q 3Q 4Q 1Q 2Q 3Q 4Q 1Q
FY14
FY15
FY16
FY17
FY18
1Q 2Q 3Q 4Q 1Q 2Q 3Q 4Q 1Q 2Q 3Q 4Q 1Q 2Q 3Q 4Q 1Q
FY14
FY15
FY16
FY17
FY18
Source: Company, MOSL
Exhibit 5: Domestic product mix worsens QoQ
Economy
Premium <200
11.2
12.8
31.2
11.8
0.3
45.4
3QFY16
40.4
0.0 7.5
39.2
4QFY16
Executive 100
Premium >200
8.7
10.8
43.8
0.0 5.3
42.2
1QFY17
41.4
0.0 4.4
43.4
2QFY17
Executive 125
Premium >300
9.5
11.3
39.2
0.0 6.7
44.5
3QFY17
39.5
0.0
11.0
36.0
4QFY17
6.3
29.1
4.7
8.2
51.5
8.8
31.7
10.5
3.2
45.9
2QFY16
9.3
37.9
0.0 8.4
43.6
1QFY18
1QFY16
Source: Company, MOSL
EBITDA margins decline 320bp YoY (125bp QoQ) to 17.2%; miss estimates
Gross margins contracted 280bp YoY (-220bp QoQ) to 30% due to higher RM
costs. RM cost was higher by 220bp YoY (+220bp QoQ) due to ~110bp impact
due to commodity inflation, 50bp impact of Pantnager excise benefit and ~30bp
impact due to promotion of CT and Platina to take advantage of festive demand.
21 July 2017
3

Bajaj Auto
EBITDA was below estimates at ~INR 9.3b (v/s est ~INR 10b) due to higher RM
costs and operating deleverage.
Consequently, EBITDA margins contracted by 322bp YoY (-126bp QoQ) to 17.2%
(v/s est 19.1%). Automotive business EBIT margin shrank 375bp YoY (-235bp
QoQ) to 15.9%.
Adj PAT came in at ~INR9.5b (v/s est ~INR 8.8b) decline of 3% YoY (-18% QoQ).
The decline in PAT was arrested by higher other income (+71.2% YoY, +55.7%
QoQ) due to dividend from KTM of INR1.35b. Dividend from of KTM is not
expected in 2QFY18.
Exhibit 6: Multi quarter low EBITDA margins at 17.2%
21.9 22.1
18.5
18.9
EBITDA (INR/Unit)
21.7
17.6
18.9
17.7
EBITDA Margins (%)
21.7 21.1 21.5
21.4
20.6
20.5
20.4
18.5
17.2
1Q 2Q 3Q 4Q 1Q 2Q 3Q 4Q 1Q 2Q 3Q 4Q 1Q 2Q 3Q 4Q 1Q
FY14
FY15
FY16
FY17
FY18
Source: Company, MOSL
Key takeaways from Earnings call
The management
guided domestic motorcycle industry growth of ~7%
in FY18.
It expects BJAUT to outperform the industry, with growth of ~10% from July
2017. Though demand remained weak in the first 10-15 days of July, it is likely
to inch up gradually.
Expects domestic 3W industry growth to be 5% in 3-5 years,
led by growth in
cargo segments. Further, factors such as new permits of ~10k units in Delhi,
abolition of permits in Maharashtra, conversion of 2-stroke vehicles to 4-stroke
vehicles in Karnataka, and ban on diesel vehicles in Bangalore would aid growth.
BJUAT guided ~21k units in domestic markets from July. Karnataka, West Bengal
and Delhi markets still work on permit system.
Guided double-digit growth in exports in FY18,
as volume declines in Nigerian
and Sri Lanka have been compensated by Bangladesh, Egypt, Peru, Turkey, Iran,
Tanzania, Kenya and South East Asian markets. Expects exports to clock 1.6m
units in FY18.
Guided for EBITDA margin of 19.5-20% (v/s 18.3% in 1QFY18).
On the profitability front, the management indicated that ~60% of the
portfolio carries EBITDA margin of 20-25%.
Pulsar
family margins remain at
~20%, while executive and entry-level segments are loss-making.
The management indicated commodity inflation impact of ~110bp in 1QFY18,
led by increase in raw material prices. Further, there is an impact of ~50bp due
to Pantnagar excise benefit expiry and ~30bp on higher promotion cost on CT
and Platina to take advantage of festive demand.
BJAUT is in the process of forming an alliance with a global company to spur its
presence in higher end motorcycles. It is likely to sign an agreement soon.
4
21 July 2017

Bajaj Auto
Pulsar
has been losing out to
Apache
in select markets such as Odhisa, West
Bengal, UP and Bihar.
The management expects
V
series volume at 25k units and
Avenger
volume at
15k units per month from September 2017.
It expects KTM sales to increase to
~45k units in FY18 from ~35k in FY17. Increase in advertisement and publicity
for
Dominar
and
Avenger
would elevate volumes in the domestic market.
Tax rate is likely to be 29-30%, as R&D and Pantnagar benefits would be
unavailable.
Spare parts revenue grew ~2% YoY (declined 5.7% QoQ) to INR6.5b. Growth in
spare parts was impacted due to GST.
Channel inventory as of June was low compared to normal inventory of 4-4.5
weeks. Inventory restocking should lift wholesale numbers from July.
Fairly hedged in FY18; the rate would be around INR66.7/USD for the balance
period.
Took price hikes of INR500-1,000/unit in 2W and INR1,500-2,000/unit in 3W in
domestic markets towards the end of May, and indicated a price hike in exports
from July.
Expects motorcycle price increase of INR1k-2k due to ABS/CBS.
Current network of 650 primary dealers and ~2,300 touch points in the domestic
market.
Domestic volume recovery to drive ~13% EPS CAGR:
Recovery in industry demand,
especially in premium segment would drive market share gains for BJAUT. We
expect premium motorcycle segment to grow faster than motorcycle industry. This
coupled with new product launches and operating leverage would drive 13% EPS
CAGR over FY17-20E.
Exports bottomed out, expect recovery on low base:
We believe exports have
bottomed out with volumes settling at ~135k units in the export markets. We expect
export volumes to recover driven by ramp-up in newer markets and low base of
2HFY17. Structurally, export is big opportunity due to low 2 wheeler penetrations in
targeted markets and use of 2 wheeler for public transport. BJAUT best placed
amongst Indian players in the long run due to strong presence.
Deploying accumulated cash a big challenge:
BJAUT has net cash of ~INR132.5b as
of June 2017. With annual FCF generation of over ~INR30b, we see limited avenues
to deploy such cashflows in its existing businesses. While BJAUT might be evaluating
alliances in global markets, there is considerable scope to increase payouts or do
buy-backs.
Maintain Buy with TP of ~INR3,281:
We downgrade our FY18E/FY19E EPS by
4.4%/2.6% to factor in increase in RM costs. We believe worst of volumes and
margins is reflected in 1QFY18, with expected recovery in volumes in domestic as
well as export markets from 2HFY18. Valuations at 20.5x/17.2x FY18E/19E S/A EPS
are attractive. We value BJAUT at 18x FY19E EPS and add INR214/share for its KTM
stake to arrive at a TP of INR3,281. Maintain BUY.
Valuation view
21 July 2017
5

Bajaj Auto
Exhibit 7: Revised estimates
FY18E
Vols ('000 units)
Net Sales
EBITDA
EBITDA Margins (%)
Net Profit
EPS (INR)
Rev
3,911
240,573
44,798
18.6
39,694
137.2
Old
3,911
236,249
47,347
20.0
41,522
143.5
Chg (%)
0.0
1.8
-5.4
-140bp
-4.4
-4.4
Rev
4,292
271,088
52,997
19.5
47,331
163.6
FY19E
Old
4,292
263,975
54,548
20.7
48,594
167.9
Chg (%)
0.0
2.7
-2.8
-110bp
-2.6
-2.6
Source: MOSL
Exhibit 8: BJAUT P/E trading above long term average
implying improving fundamentals
27
22
17
12
7
2
15.1
P/E (x)
18.4
5 Yrs Avg(x)
8 Yrs Avg(x)
19.4
Exhibit 9: BJAUT’s P/BV at below historical average
9.1
7.2
5.3
3.4
1.5
P/B (x)
5 Yrs Avg(x)
5.3
5.1
4.2
8 Yrs Avg(x)
Source: MOSL
Source: MOSL
Exhibit 10: Comparative Valuation
Auto OEM's
Bajaj Auto
Hero MotoCorp
TVS Motor
M&M
Maruti Suzuki
Tata Motors
Ashok Leyland
Eicher Motors
Auto Ancillaries
Bharat Forge
Exide Industries
Amara Raja Batteries
BOSCH
Endurance Tech
CMP
(INR)*
2,819
3,730
572
1,393
7,491
460
106
29,201
1,135
218
833
24,035
886
Rating
Buy
Neutral
Buy
Buy
Buy
Buy
Buy
Buy
Buy
Buy
Buy
Neutral
Buy
TP
(INR)
3,281
3,666
606
1,580
8,483
631
122
31,326
1,330
286
1,073
23,738
1,025
P/E (x)
FY18E FY19E
20.5
17.2
18.8
18.8
35.1
22.1
20.9
17.4
25.6
19.7
14.9
7.2
19.2
14.9
33.9
26.5
30.1
22.6
24.7
37.0
29.0
22.8
18.3
20.6
31.4
22.8
EV/EBITDA (x)
FY18E FY19E
14.6
12.0
12.2
12.1
23.2
15.1
15.0
12.9
15.8
12.5
4.4
2.8
9.6
7.7
27.5
22.7
17.9
14.4
14.1
24.7
14.0
14.3
11.8
11.5
21.0
11.7
RoE (%)
FY18E FY19E
22.2
24.0
36.0
31.0
28.6
35.2
14.1
14.6
20.8
22.8
16.5
27.3
24.5
27.1
40.8
38.0
19.8
14.8
20.4
21.1
22.4
22.3
15.9
20.7
21.9
23.6
Div Yield (%) EPS CAGR (%)
FY18E FY19E
FY17-19E
2.3
2.8
11.2
2.4
2.4
8.4
0.5
0.8
48.5
1.4
1.4
21.3
1.1
1.3
23.6
0.1
0.1
80.2
1.9
2.1
24.4
0.5
0.6
34.0
0.7
1.0
0.6
0.9
0.4
0.9
1.0
0.7
1.1
0.8
37.8
20.8
20.3
27.3
28.6
Source: Company, MOSL
21 July 2017
6

Bajaj Auto
Exhibit 11: Key operating metrics
000 units
Motorcycles (units)
Domestic
Growth (%)
% of total volumes
Exports
Growth (%)
% of total volumes
Total M/Cycles
Growth (%)
% of total volumes
3Ws
Domestic
Growth (%)
% of total volumes
Exports
Growth (%)
% of total volumes
3Ws
Growth (%)
% of total volumes
Total Volumes
Growth (%)
Avg. Net Realn (INR/unit)
Growth (%)
Net Revenues (INR B)
Growth (%)
EBITDA (INR B)
Ebitda margins (%)
EBITDA (INR/Unit)
Growth (%)
PAT (INR B)
EPS
FY12
2,567
6.3
59.0
1,268
30.4
29.1
3,834
13.2
88.2
203
-1.3
4.7
312
35.0
7.2
515
17.9
11.8
4,350
13.7
42,366
3.3
189
18.8
37
19.0
8,552.6
17.3
31
107
FY13
2,464
-4.0
58.1
1,293
2.0
30.5
3,757
-2.0
88.7
226
11.4
5.3
254
-18.7
6.0
480
-6.8
11.3
4,237
-2.6
44,665
5.4
195
3.2
36
18.2
8,579.5
-2.3
30
105
FY14
2,099
-14.8
54.2
1,323
2.3
34.2
3,422
-8.9
88.4
187
-17.3
4.8
261
2.7
6.7
448
-6.7
11.6
3,870
-8.7
48,443
8.5
197
1.2
41
20.4
10,608.9
12.9
32
112
FY15
1,771
-15.6
46.5
1,521
15.0
39.9
3,292
-3.8
86.4
234
25.4
6.1
285
9.2
7.5
519
16.0
13.6
3,811
-1.5
51,853
7.0
211
7.0
41
19.0
10,801.2
0.3
30
105
FY16
1,899
7.2
48.8
1,459
-4.1
37.5
3,358
2.0
86.3
255
8.8
6.5
280
-1.6
7.2
535
3.1
13.7
3,894
2.2
53,697
3.6
222
5.0
48
21.2
12,281.6
16.2
39
136
FY17
2,001
5.4
54.6
1,219
-16.5
33.2
3,220
-4.1
87.8
253
-0.7
6.9
193
-31.2
5.3
446
-16.7
12.2
3,666
-5.8
54,482
1.5
214
-3.5
44
20.3
12,063.3
-7.5
38
132
FY18E
2,106
5.2
53.8
1,340
10.0
34.3
3,446
7.0
88.1
243
-4.0
6.2
222
15.0
5.7
465
4.2
11.9
3,911
6.7
55,743
2.3
236
10.4
45
18.6
11,454.7
1.3
40
137
FY19E
2,291
8.8
53.4
1,501
12.0
35.0
3,793
10.1
88.4
255
5.0
5.9
244
10.0
5.7
499
7.4
11.6
4,292
9.7
56,749
1.8
265
12.2
53
19.5
12,348.5
18.3
47
164
Source: Company, MOSL
21 July 2017
7

Bajaj Auto
Story in charts: Domestic recovery, benefits of new launches key drivers
Exhibit 12: Domestic growth to drive volumes
Volumes ('000 Units)
2.2
(5.8)
54
Growth (%)
6.7
9.7
Exhibit 13: Share of 2W exports to increase gradually
2W - Dom
7
5
34
7
6
40
2W - Exports
7
7
37
3W - Dom
5
7
33
3W - Exports
6
6
34
6
6
35
(1.5)
(8.7)
46
49
55
54
53
FY14
FY15
FY16
FY17
FY18E
FY19E
FY14
FY15
FY16
FY17
FY18E
FY19E
Source: Company, MOSL
Exhibit 14: Volume mix to remain to remain stable
3Ws (Exports)
Others (Dom)
CT100 (Dom)
12
25
16
34
5
7
FY14
13
15
17
40
6
7
FY15
3Ws (Dom)
Pulsar (Dom)
Platina (Dom)
7
10
15
12
6
9
16
16
37
7
7
FY16
33
7
5
FY17
2W Exports
Discover (Dom)
10
12
9
17
35
6
6
FY18E
10
11
9
17
35
6
6
FY19E
Exhibit 15: EBITDA margins to remain healthy
EBITDA (INR m)
21.2
20.4
19.0
EBITDA Margins (%)
20.3
19.5
18.6
FY14
FY15
FY16
FY17
FY18E
FY19E
Source: Company, MOSL
Exhibit 16: Return ratios to increase steadily
RoCE (%)
RoE (%)
Exhibit 17: Dividend payout to remain healthy
Dividend Payout (%)
2.0
Dividend Yield (%)
2.3
1.8
1.8
2.0
2.8
52.2
FY14
FY15
FY16
FY17
FY18E
FY19E
FY14
56.9
FY15
48.7
FY16
50.0
FY17
57.0
FY18E
60.0
FY19E
Source: Company, MOSL
21 July 2017
8

Bajaj Auto
Financials and Valuations
Income Statement
Y/E Mar
Net Sales
Change (%)
EBITDA
EBITDA Margin (%)
Depreciation
EBIT
Interest
Other Income
Extraordinary items
PBT
Tax
Tax Rate (%)
Min. Int. & Assoc. Share
Reported PAT
Adjusted PAT
Change (%)
Y/E Mar
Share Capital
Reserves
Net Worth
Debt
Deferred Tax
Total Capital Employed
Gross Fixed Assets
Less: Acc Depreciation
Net Fixed Assets
Capital WIP
Investments
Current Assets
Inventory
Debtors
Cash & Bank
Loans & Adv, Others
Curr Liabs & Provns
Curr. Liabilities
Provisions
Net Current Assets
Total Assets
2012
195,290
19.1
37,200
19.0
1,456
35,744
222
6,080
-1,340
40,262
10,221
25.4
0
30,041
31,069
18.8
2012
2,894
57,517
60,411
975
484
61,870
33,939
19,143
14,796
417
48,828
46,749
6,785
4,228
16,538
19,197
48,941
27,192
21,749
-2,192
61,870
2013
199,973
2.4
36,353
18.2
1,640
34,713
5
7,955
0
42,662
12,227
28.7
0
30,436
30,436
-2.0
2013
2,894
76,126
79,020
713
1,151
80,883
38,289
20,244
18,044
2,936
64,305
39,502
6,363
7,676
5,589
19,875
43,903
26,478
17,425
-4,401
80,883
2014
201,495
0.8
41,057
20.4
1,796
39,261
5
7,064
0
46,321
13,901
30.0
0
32,420
32,420
6.5
2014
2,894
93,187
96,080
577
1,432
98,089
40,770
20,710
20,060
1,441
85,496
40,479
6,397
7,962
4,955
21,165
49,387
29,650
19,737
-8,908
98,089
2015
216,120
7.3
41,166
19.0
2,674
38,492
65
5,824
-3,403
40,848
12,711
31.1
0
28,137
30,481
-6.0
2015
2,894
104,028
106,922
1,118
1,416
109,455
41,009
21,837
19,172
2,549
91,533
42,368
8,142
7,170
5,862
21,196
46,168
26,248
19,920
-3,800
109,455
2016
225,865
4.5
47,819
21.2
3,072
44,748
11
10,736
0
55,473
16,177
29.2
0
39,297
39,297
28.9
2016
2,894
129,772
132,666
1,886
2,028
136,579
51,572
24,183
27,389
522
102,606
34,348
7,191
7,179
8,176
11,803
28,286
26,680
1,605
6,063
136,580
2017
217,667
-3.6
44,224
20.3
3,073
41,151
14
12,220
0
53,356
15,081
28.3
0
38,276
38,276
-2.6
2017
2,894
167,448
170,341
1,764
3,136
175,242
46,027
26,009
20,018
422
132,606
47,706
7,284
9,533
2,798
28,091
25,509
23,519
1,991
22,197
175,242
2018E
240,573
10.5
44,798
18.6
3,135
41,663
(INR Million)
2019E
271,088
12.7
52,997
19.5
3,474
49,523
10
14,254
0
55,907
16,213
29.0
0
39,694
39,694
3.7
2018E
2,894
184,533
187,427
1,764
4,813
194,004
50,448
29,144
21,304
2,000
152,606
47,911
8,321
10,450
2,721
26,419
29,817
27,736
2,080
18,094
194,004
10
16,225
0
65,738
18,407
28.0
0
47,331
47,331
19.2
2019E
2,894
203,465
206,359
1,764
4,813
212,937
56,448
32,618
23,830
2,000
169,606
51,067
9,367
11,764
2,146
27,790
33,567
31,225
2,342
17,501
212,937
Balance Sheet
(INR Million)
21 July 2017
9

Bajaj Auto
Financials and Valuations
Y/E Mar
Basic (INR)
EPS
Cash EPS
Book Value
DPS
Payout (incl. Div. Tax.)
Valuation(x)
P/E
Price / Book Value
EV/Sales
EV/EBITDA
Dividend Yield (%)
Profitability Ratios (%)
RoE
RoCE
RoIC
Turnover Ratios (%)
Asset Turnover (x)
Debtors (No. of Days)
Inventory (No. of Days)
Creditors (No. of Days)
Leverage Ratios (%)
Net Debt/Equity (x)
Ratios
2012
107.4
112.4
208.8
45.0
48.7
26.3
13.5
3.8
20.2
1.6
56.7
54.5
-973.7
3.2
8
12
36
-0.3
2012
38,228
5,318
797
-11,483
1,473
34,333
-1,159
33,174
-6,557
0
-7,716
0
-2,001
-222
-13,420
-15,644
10,974
5,565
16,539
2013
105.2
110.8
273.1
45.0
49.7
26.8
10.3
3.7
20.5
1.6
43.7
42.6
1195.9
2.5
13
11
34
-0.1
2013
36,353
4,704
-7,319
-12,394
0
21,344
-5,285
16,059
-12,218
0
-17,503
0
324
-5
-15,109
-14,791
-10,950
16,538
5,589
2014
112.0
118.2
332.0
50.0
52.2
25.2
8.5
3.6
17.7
1.8
37.0
36.2
385.6
2.1
14
11
36
0.0
2014
41,057
3,376
4,176
-13,153
0
35,457
-2,547
32,910
-18,862
0
-21,409
0
505
-5
-15,182
-14,682
-634
5,589
4,955
2015
105.3
114.6
369.5
50.0
56.9
26.8
7.6
3.3
17.5
1.8
30.0
29.4
337.6
2.0
12
13
29
0.0
2015
43,510
-1,832
-7,350
-12,854
0
21,473
-2,933
18,540
-1,192
0
-4,125
0
532
-65
-16,909
-16,442
907
4,955
5,862
2016
135.8
146.4
458.5
55.0
48.7
20.8
6.1
3.1
14.8
2.0
32.8
32.0
182.2
1.7
11
11
31
0.0
2016
47,819
12,458
-6,055
-17,655
0
36,568
-2,582
33,986
2,394
0
-188
0
501
-5
-34,337
-33,841
2,539
5,637
8,176
2017
132.3
142.9
588.7
55.0
50.0
21.3
4.8
3.1
15.4
2.0
25.3
24.6
91.3
1.2
15
12
35
0.0
2017
44,224
14,956
-10,762
-15,026
0
33,392
-9,554
23,838
-27,330
0
-36,883
0
127
-6
-2,022
-1,901
-5,392
8,191
2,798
2018E
137.2
148.0
647.7
65.0
57.0
20.5
4.4
2.8
14.8
2.3
22.2
21.5
77.7
1.2
15
12
35
0.0
2018E
44,798
14,254
4,025
-14,536
0
48,542
-6,000
42,542
-20,000
0
-26,000
0
0
-10
-22,608
-22,618
-77
2,798
2,721
2019E
163.6
175.6
713.1
80.0
60.0
17.2
4.0
2.4
12.2
2.8
24.0
23.3
94.0
1.3
15
12
35
0.0
2019E
52,997
16,225
18
-18,407
0
50,833
-6,000
44,833
-17,000
0
-23,000
0
0
-10
-28,399
-28,409
-575
2,721
2,146
Cash Flow Statement
Y/E Mar
Adjusted EBITDA
Non cash opr. exp (inc)
(Inc)/Dec in Wkg. Cap.
Tax Paid
Other operating activities
CF from Op. Activity
(Inc)/Dec in FA & CWIP
Free cash flows
(Pur)/Sale of Invt
Others
CF from Inv. Activity
Inc/(Dec) in Net Worth
Inc / (Dec) in Debt
Interest Paid
Divd Paid (incl Tax) & Others
CF from Fin. Activity
Inc/(Dec) in Cash
Add: Opening Balance
Closing Balance
(INR Million)
21 July 2017
10

Bajaj Auto
Corporate profile
Company description
Bajaj Auto (BJAUT), the flagship of the Bajaj group,
is a leading manufacturer of two-wheelers (~88% of
volumes) and three-wheelers (~12% of volumes). It
is the market leader in three-wheelers, and is the
second largest player in motorcycles and enjoys
leadership in the premium segment. It is also the
largest exporter of two-wheelers and three-
wheelers (~41% of its volumes).
Exhibit 1: Sensex rebased
Source: MOSL/Bloomberg
Exhibit 2: Shareholding pattern (%)
Jun-17
Promoter
DII
FII
Others
49.3
8.3
17.5
24.9
Mar-17
49.3
7.7
17.4
25.6
Jun-16
49.3
8.8
17.2
24.8
Source: Capitaline
Exhibit 3: Top holders
Holder Name
LIFE INSURANCE CORPORATION OF INDIA
JAYA HIND INVESTMENTS PRIVATE LIMITED
MAHARASHTRA SCOOTERS LIMITED
GOVERNMENT PENSION FUND GLOBAL
NIRAJ BAJAJ (As a trustee of Yamuna Trust)
% Holding
5.5
3.3
2.3
1.6
1.3
Source: Capitaline
Note: FII Includes depository receipts
Exhibit 4: Top management
Name
Rahul Bajaj
Madhur Bajaj
Rajiv Bajaj
J Sridhar
Designation
Chairman
Vice Chairman
Managing Director
Company Secretary
Exhibit 5: Directors
Name
Manish Kejriwal
Sanjiv Bajaj
D J Balaji Rao
Gita Piramal
Kantikumar R Podar
Naresh Chandra
Pradeep Shrivastava
Name
Niraj Bajaj
Shekhar Bajaj
D S Mehta
Jamshyd N Godrej
Nanoo Pamnani
P Murari
Source: Capitaline
*Independent
Exhibit 6: Auditors
Name
Dalal & Shah LLP
Shyamprasad D Limaye
Type
Statutory
Secretarial Audit
Exhibit 7: MOSL forecast v/s consensus
EPS
(INR)
FY18
FY19
MOSL
forecast
137.2
163.6
Consensus
forecast
150.0
166.3
Variation (%)
-8.5
-1.7
Source: Bloomberg
Source: Capitaline
21 July 2017
11

Disclosures
This document has been prepared by Motilal Oswal Securities Limited (hereinafter referred to as Most) to provide information about the company (ies) and/sector(s), if any, covered in the report and may be distributed by it
and/or its affiliated company(ies). This report is for personal information of the selected recipient/s and does not construe to be any investment, legal or taxation advice to you. This research report does not constitute an
offer, invitation or inducement to invest in securities or other investments and Motilal Oswal Securities Limited (hereinafter referred as MOSt) is not soliciting any action based upon it. This report is not for public distribution
and has been furnished to you solely for your general information and should not be reproduced or redistributed to any other person in any form. This report does not constitute a personal recommendation or take into
account the particular investment objectives, financial situations, or needs of individual clients. Before acting on any advice or recommendation in this material, investors should consider whether it is suitable for their
particular circumstances and, if necessary, seek professional advice. The price and value of the investments referred to in this material and the income from them may go down as well as up, and investors may realize losses
on any investments. Past performance is not a guide for future performance, future returns are not guaranteed and a loss of original capital may occur.
MOSt and its affiliates are a full-service, integrated investment banking, investment management, brokerage and financing group. We and our affiliates have investment banking and other business relationships with a some
companies covered by our Research Department. Our research professionals may provide input into our investment banking and other business selection processes. Investors should assume that MOSt and/or its affiliates are
seeking or will seek investment banking or other business from the company or companies that are the subject of this material and that the research professionals who were involved in preparing this material may educate
investors on investments in such business . The research professionals responsible for the preparation of this document may interact with trading desk personnel, sales personnel and other parties for the purpose of
gathering, applying and interpreting information. Our research professionals are paid on twin parameters of performance & profitability of MOSt.
MOSt generally prohibits its analysts, persons reporting to analysts, and members of their households from maintaining a financial interest in the securities or derivatives of any companies that the analysts cover.
Additionally, MOSt generally prohibits its analysts and persons reporting to analysts from serving as an officer, director, or advisory board member of any companies that the analysts cover. Our salespeople, traders, and
other professionals or affiliates may provide oral or written market commentary or trading strategies to our clients that reflect opinions that are contrary to the opinions expressed herein, and our proprietary trading and
investing businesses may make investment decisions that are inconsistent with the recommendations expressed herein. In reviewing these materials, you should be aware that any or all of the foregoing among other things,
may give rise to real or potential conflicts of interest. MOSt and its affiliated company(ies), their directors and employees and their relatives may; (a) from time to time, have a long or short position in, act as principal in, and
buy or sell the securities or derivatives thereof of companies mentioned herein. (b) be engaged in any other transaction involving such securities and earn brokerage or other compensation or act as a market maker in the
financial instruments of the company(ies) discussed herein or act as an advisor or lender/borrower to such company(ies) or may have any other potential conflict of interests with respect to any recommendation and other
related information and opinions.; however the same shall have no bearing whatsoever on the specific recommendations made by the analyst(s), as the recommendations made by the analyst(s) are completely independent
of the views of the affiliates of MOSt even though there might exist an inherent conflict of interest in some of the stocks mentioned in the research report
Reports based on technical and derivative analysis center on studying charts company's price movement, outstanding positions and trading volume, as opposed to focusing on a company's fundamentals and, as such, may not match with a report on a
company's fundamental analysis. In addition MOST has different business segments / Divisions with independent research separated by Chinese walls catering to different set of customers having various objectives, risk profiles, investment horizon,
etc, and therefore may at times have different contrary views on stocks sectors and markets.
Unauthorized disclosure, use, dissemination or copying (either whole or partial) of this information, is prohibited. The person accessing this information specifically agrees to exempt MOSt or any of its affiliates or employees
from, any and all responsibility/liability arising from such misuse and agrees not to hold MOSt or any of its affiliates or employees responsible for any such misuse and further agrees to hold MOSt or any of its affiliates or
employees free and harmless from all losses, costs, damages, expenses that may be suffered by the person accessing this information due to any errors and delays. The information contained herein is based on publicly
available data or other sources believed to be reliable. Any statements contained in this report attributed to a third party represent MOSt’s interpretation of the data, information and/or opinions provided by that third party
either publicly or through a subscription service, and such use and interpretation have not been reviewed by the third party. This Report is not intended to be a complete statement or summary of the securities, markets or
developments referred to in the document. While we would endeavor to update the information herein on reasonable basis, MOSt and/or its affiliates are under no obligation to update the information. Also there may be
regulatory, compliance, or other reasons that may prevent MOSt and/or its affiliates from doing so. MOSt or any of its affiliates or employees shall not be in any way responsible and liable for any loss or damage that may
arise to any person from any inadvertent error in the information contained in this report. MOSt or any of its affiliates or employees do not provide, at any time, any express or implied warranty of any kind, regarding any
matter pertaining to this report, including without limitation the implied warranties of merchantability, fitness for a particular purpose, and non-infringement. The recipients of this report should rely on their own
investigations.
This report is intended for distribution to institutional investors. Recipients who are not institutional investors should seek advice of their independent financial advisor prior to taking any investment decision based on this
report or for any necessary explanation of its contents.
Most and it’s associates may have managed or co-managed public offering of securities, may have received compensation for investment banking or merchant banking or brokerage services, may have received any
compensation for products or services other than investment banking or merchant banking or brokerage services from the subject company in the past 12 months.
Most and it’s associates have not received any compensation or other benefits from the subject company or third party in connection with the research report.
Subject Company may have been a client of Most or its associates during twelve months preceding the date of distribution of the research report
MOSt and/or its affiliates and/or employees may have interests/positions, financial or otherwise of over 1 % at the end of the month immediately preceding the date of publication of the research in the securities mentioned
in this report. To enhance transparency, MOSt has incorporated a Disclosure of Interest Statement in this document. This should, however, not be treated as endorsement of the views expressed in the report.
Motilal Oswal Securities Limited is registered as a Research Analyst under SEBI (Research Analyst) Regulations, 2014. SEBI Reg. No. INH000000412
Pending Regulatory inspections against Motilal Oswal Securities Limited:
SEBI pursuant to a complaint from client Shri C.R. Mohanraj alleging unauthorized trading, issued a letter dated 29th April 2014 to MOSL notifying appointment of an Adjudicating Officer as per SEBI regulations to hold inquiry
and adjudge violation of SEBI Regulations; MOSL replied to the Show Cause Notice whereby SEBI granted us an opportunity of Inspection of Documents. Since all the documents requested by us were not covered we have
requested to SEBI vide our letter dated June 23, 2015 to provide pending list of documents for inspection.
List of associate companies of Motilal Oswal Securities Limited -Click
here to access detailed report
Analyst Certification
The views expressed in this research report accurately reflect the personal views of the analyst(s) about the subject securities or issues, and no part of the compensation of the research analyst(s) was, is, or will be directly or
indirectly related to the specific recommendations and views expressed by research analyst(s) in this report. The research analysts, strategists, or research associates principally responsible for preparation of MOSt research
receive compensation based upon various factors, including quality of research, investor client feedback, stock picking, competitive factors and firm revenues
Bajaj Auto
Disclosure of Interest Statement
Analyst ownership of the stock
No
Served as an officer, director or employee -
No
A graph of daily closing prices of securities is available at www.nseindia.com and http://economictimes.indiatimes.com/markets/stocks/stock-quotes
Regional Disclosures (outside India)
This report is not directed or intended for distribution to or use by any person or entity resident in a state, country or any jurisdiction, where such distribution, publication, availability or use would be contrary to law,
regulation or which would subject MOSt & its group companies to registration or licensing requirements within such jurisdictions.
For Hong Kong:
This report is distributed in Hong Kong by Motilal Oswal capital Markets (Hong Kong) Private Limited, a licensed corporation (CE AYY-301) licensed and regulated by the Hong Kong Securities and Futures
Commission (SFC) pursuant to the Securities and Futures Ordinance (Chapter 571 of the Laws of Hong Kong) “SFO”. As per SEBI (Research Analyst Regulations) 2014 Motilal Oswal Securities (SEBI Reg No. INH000000412) has
an agreement with Motilal Oswal capital Markets (Hong Kong) Private Limited for distribution of research report in Kong Kong. This report is intended for distribution only to “Professional Investors” as defined in Part I of
Schedule 1 to SFO. Any investment or investment activity to which this document relates is only available to professional investor and will be engaged only with professional investors.” Nothing here is an offer or solicitation
of these securities, products and services in any jurisdiction where their offer or sale is not qualified or exempt from registration. The Indian Analyst(s) who compile this report is/are not located in Hong Kong & are not
conducting Research Analysis in Hong Kong.
For U.S.
Motilal Oswal Securities Limited (MOSL) is not a registered broker - dealer under the U.S. Securities Exchange Act of 1934, as amended (the"1934 act") and under applicable state laws in the United States. In addition MOSL is
not a registered investment adviser under the U.S. Investment Advisers Act of 1940, as amended (the "Advisers Act" and together with the 1934 Act, the "Acts), and under applicable state laws in the United States.
Accordingly, in the absence of specific exemption under the Acts, any brokerage and investment services provided by MOSL, including the products and services described herein are not available to or intended for U.S.
persons.
This report is intended for distribution only to "Major Institutional Investors" as defined by Rule 15a-6(b)(4) of the Exchange Act and interpretations thereof by SEC (henceforth referred to as "major institutional investors").
This document must not be acted on or relied on by persons who are not major institutional investors. Any investment or investment activity to which this document relates is only available to major institutional investors
and will be engaged in only with major institutional investors. In reliance on the exemption from registration provided by Rule 15a-6 of the U.S. Securities Exchange Act of 1934, as amended (the "Exchange Act") and
interpretations thereof by the U.S. Securities and Exchange Commission ("SEC") in order to conduct business with Institutional Investors based in the U.S., MOSL has entered into a chaperoning agreement with a U.S.
registered broker-dealer, Motilal Oswal Securities International Private Limited. ("MOSIPL"). Any business interaction pursuant to this report will have to be executed within the provisions of this chaperoning agreement.
The Research Analysts contributing to the report may not be registered /qualified as research analyst with FINRA. Such research analyst may not be associated persons of the U.S. registered broker-dealer, MOSIPL, and
therefore, may not be subject to NASD rule 2711 and NYSE Rule 472 restrictions on communication with a subject company, public appearances and trading securities held by a research analyst account.
For Singapore
Motilal Oswal Capital Markets Singapore Pte Limited is acting as an exempt financial advisor under section 23(1)(f) of the Financial Advisers Act(FAA) read with regulation 17(1)(d) of the Financial Advisors Regulations and is a
subsidiary of Motilal Oswal Securities Limited in India. This research is distributed in Singapore by Motilal Oswal Capital Markets Singapore Pte Limited and it is only directed in Singapore to accredited investors, as defined in
the Financial Advisers Regulations and the Securities and Futures Act (Chapter 289), as amended from time to time.
In respect of any matter arising from or in connection with the research you could contact the following representatives of Motilal Oswal Capital Markets Singapore Pte Limited:
Varun Kumar
Varun.kumar@motilaloswal.com
Contact : (+65) 68189232
Office Address:21 (Suite 31),16 Collyer Quay,Singapore 04931
BAJAJ AUTO
21 July 2017
Motilal Oswal Tower, Level 9, Sayani Road, Prabhadevi, Mumbai 400 025
Phone: +91 22 3982 5500 E-mail: reports@motilaloswal.com
Motilal Oswal Securities Ltd
12