24 July 2017
Motilal Oswal values your support in the
Asiamoney Brokers Poll 2017 for India
Research, Sales and Trading team.
We
request your ballot.
Today’s top research idea
Reliance Industries: Standalone EBITDA/PAT largely in line
v
RIL reported standalone financials in line with expectation. However, GRM of
USD11.9/bbl was higher than our estimate. RIL's GRM has shown strong
resilience towards weak crack spreads, narrowing light-heavy differential and
narrowing Brent -dubai differential due to better yield/crude optimization &
risk management. Petrochem has also shown improvement in margin due to
rise of 69% QoQ delta in PP, 5% QoQ rise in PE delta and almost doubling of
SBR & PBR deltas. Commissioning of ROGC would be done in next 45-60days
while petcoke gasifier is expected to be commissioned fully by Mar-18.
v
RIL announced launch of its Jio phone which is targeting current pool of 530m
feature phone users. Current paid subscriber base has improved to 100m.
Going further, Telecom would be a major driver of stock performance.
Market snapshot
Equities - India
Close
Chg .%
Sensex
32,029
0.4
Nifty-50
9,915
0.4
Nifty-M 100
18,262
-0.2
Equities-Global
Close
Chg .%
S&P 500
2,473
0.0
Nasdaq
6,388
0.0
FTSE 100
7,453
-0.5
DAX
12,240
-1.7
Hang Seng
10,787
-0.6
Nikkei 225
20,100
-0.2
Commodities
Close
Chg .%
Brent (US$/Bbl)
47
-2.7
Gold ($/OZ)
1,248
0.9
Cu (US$/MT)
5,971
0.8
Almn (US$/MT)
1,892
0.0
Currency
Close
Chg .%
USD/INR
64.3
-0.2
USD/EUR
1.2
1.2
USD/JPY
111.8
-0.5
YIELD (%)
Close
1MChg
10 Yrs G-Sec
6.4
0.0
10 Yrs AAA Corp
7.5
0.0
Flows (USD b)
21-Jul
MTD
FIIs
0.0
0.2
DIIs
0.0
0.3
Volumes (INRb)
21-Jul
MTD*
Cash
342
286
F&O
5,736
5,502
Note: YTD is calendar year, *Avg
YTD.%
20.3
21.1
27.2
YTD.%
10.4
18.7
4.3
6.6
14.8
5.2
YTD.%
-14.5
7.6
8.1
11.0
YTD.%
-5.2
10.4
-4.6
YTDchg
-0.1
-0.1
YTD
8.7
3.6
YTD*
285
4,975
Research covered
Cos/Sector
Telecom
Reliance Inds.
Bajaj Auto
United Spirits
Avenue Supermarts
Britannia Industries
Ashok Leyland
MRPL
Divi's Lab
Indian Bank
Dewan Hsg. Fin.
JK Bank
Persistent System
Zensar Tech.
Results Expectation
Key Highlights
RJio’s big-bang VoLTE feature phone launch to expand its target market
Standalone EBITDA/PAT largely in line; GRMs at USD11.9/bbl
Higher RM cost, negative operating leverage results in 8-year low margins
Highway ban impact greater than expected
Revenue, EBITDA and PAT post strong growth
Well positioned in a high-potential market
EBITDA margins disappoint led by increased costs
EBITDA impacted by inventory loss; core GRM at USD7.07/bbl
Regulatory issues impacted revenues
Focus on core operating parameters continues; Asset quality improves
Growth surprises positively; re-rating to continue
Balance sheet clean up phase; PAT positive after 3 quarters
A stern test of our margin recovery thesis
Legacy pressures offset Digital pivot
ACEM | BHIN | DELTA | HDFCB | IHFL | INFOE | LTI | MMFS | TCOM | Z
Piping hot news
ONGC not to make open offer post HPCL acquisition
v
ONGC will not be required to make an open offer to minority shareholders of
HPCL after buying out government’s 51.11 per cent stake as the deal won’t
trigger takeover norms as did the IOC-IBP merger in 2002, a senior
government official said.
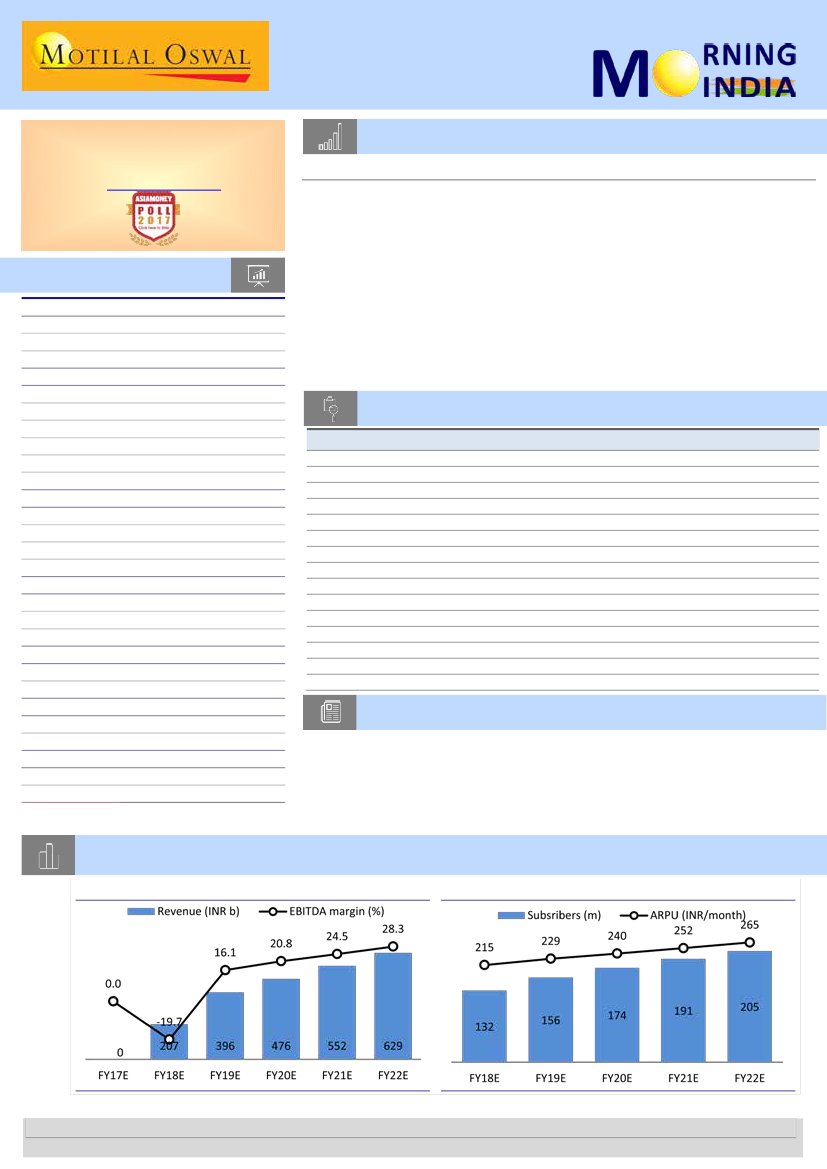
Chart of the Day: RJio’s big-bang VoLTE feature phone launch to expand its target market
Exhibit 1:
Revenues & margin to soar
Exhibit 2:
Subscribers & ARPU trends
Research Team (Gautam.Duggad@MotilalOswal.com)
Motilal Oswal research is available on www.motilaloswal.com/Institutional-Equities, Bloomberg, Thomson Reuters, Factset and S&P Capital.
Investors are advised to refer through important disclosures made at the last page of the Research Report.

In the news today
Kindly click on textbox for the detailed news link
1
Debtors have filed over 33% of
insolvency cases
Essar Steel tried to stay insolvency
proceedings against it by moving
the Gujarat High Court. But not all
Indian companies think along
similar lines…
2
Reliance Jio phone: Bharti Airtel, Vodafone, Idea eye unequal
competition; major setback in store
The Volte 4G feature phone launch by Reliance Jio Infocomm will place the
incumbents like Bharti Airtel, Vodafone, and Idea Cellular at a great
disadvantage in the fresh competition which has emerged in the telecom
market. Jio has a fully-4G Volte network and therefore can provide
unlimited voice calls on its feature phones for free. This is not the case
with incumbents, who largely have GSM network which cannot support
unlimited (free) voice calls and also suffers from data capability...
3
After covering the entire country,
the south-west monsoon was
active over the western, central
and eastern parts of the country in
the last few days…
Monsoon in India: Much relief
for nation, rains widespread,
crop sowing satisfactory
4
Colgate can't brush off
Ramdev's Patanjali effect,
admits CEO
In a first, ColgateBSE 0.65 %
Palmolive’s global CEO Ian Cook
named Indian rival Patanjali while
talking to investors about the
need to respond to changing
consumer preferences in India
where the toothpaste giant
recorded its steepest market
share fall in a decade last year…
5
Telcos have red-flagged attempts
by 'some participants' to push for
the scrapping of an inter-network
charge by citing an affidavit filed
by the regulator in the Supreme
Court six years ago …
Telecom companies cite 6 year
old affidavit to red flag request
to scrap IUC
6
Blackstone Group plans to set
up an ARC in India
If Blackstone Group indeed sets up
an ARC, it will be the latest among
foreign private equity investors
who have spotted the opportunity
in stressed assets…
7
PEs build $4-billion war chest
for bad assets
Last week, different Benches of
the National Company Law
Tribunal (NCLT) admitted
bankruptcy proceedings against
Electrosteel Steels, Alok Industries
and Monnet Ispat & Energy. These
were all under the Insolvency and
Bankruptcy Code (IBC) that took
effect last year. PEs have build $4-
billion war chest for bad assets...
2
24 July 2017

Sector Update | 21 July 2017
Telecom
RJio’s big-bang VoLTE feature phone launch to expand its target
market
Device offerings and ARPU-accretive plans indicate limited market
disruption
n
n
n
n
n
In line with its previous strategy, RJio has launched VoLTE feature phone with ARPU-
accretive plan at INR153 (unlimited voice and data). This, in our view, may expand the
market, but challenge the incumbents to match its value offerings. Key positive for
RJio remains its widened target market, from 300m smartphone users to overall 800m
unique subscribers.
We do not expect the launch to cause major industry disruption over the long term.
We believe RJio’s VoLTE device offers limited value proposition for voice-only
subscribers having current average ARPU of INR70-80.
RJio’s feature phone launch, however, may attract entry-level data consumers, given
the wide pricing gap of ~4x between prevailing feature phone and smartphone ARPUs.
Besides this, it may act as a stepping stone for smartphone migration (for 4G usage).
We believe small operators (which hold majority of the second SIM, deal-hunting
users) are at the highest risk of losing subscribers to RJio post the device launch.
Larger operators too may see market share risk until they launch VoLTE network,
potentially in the next 10-12 months.
We have revised RJio’s DCF-based value/share to INR260 from INR110 on the back of
higher subscriber growth, driving 15%/46% revenue/EBITDA revision in FY19E.
Limited price disruption
n
n
n
n
RJio has priced the VoLTE device at INR1,500 (entirely refundable after three
years), which is nearly 50-70% higher than the price of feature phones currently
available in the market. Additionally, there are no bundled offerings.
The dual-SIM handset with 2G capability and three-year lock-in for refund may
pose a challenge for RJio to retain customers for a long period (subscribers may
continue to use services of their primary operator via the dual SIM facility).
Additionally, the VoLTE feature phone is offering unlimited voice and data at
ARPU of INR153, which is double the prevailing feature phone ARPU of INR70-
80, according to industry estimates.
RJio’s VoLTE ARPU floor may not go significantly below its current offerings as it
may increase the proportion of inter-connect costs. This highlights that RJio
continues its previous strategy of ARPU accretion in the industry. We see this as
a major positive for RJio as well as the industry as a whole.
Value proposition high for entry-level data subscribers
n
We believe RJio’s VoLTE device offers limited value proposition for voice-only
subscribers having current average ARPU of INR70-80. Voice services see
relatively mature usage at average 400-500 MOUs, and thus, may not see high
elasticity. Additionally, incumbents can match the voice offerings, given the
current low feature phone ARPU.
24 July 2017
3

n
n
We believe RJio’s data/digital offerings to feature phone users may be a good
value proposition for entry-level data subscribers. Besides this, it may act as a
stepping stone for smartphone migration (for 4G usage). This, in our view, is
because RJio’s INR153 plan allows to bridge the gap of ~4x between prevailing
feature phone and smartphone ARPUs. Thus, it should attract fresh low-hanging
data subscribers.
We do not see the risk of downtrading by smartphone users due to VoLTE
feature phone’s low data handling capability and small screen size. This may
limit data usage despite unlimited data offering, and accelerate faster migration
to smartphone.
RJio’s target market expands with data-enabled VoLTE device
n
n
n
n
We believe the launch of VoLTE device is a key positive for RJio as it expands its
target market from current 300m smartphone users to overall 800m unique
subscribers. This is likely to accelerate its subscriber growth.
Additionally, the INR153 price plan reduces the risk of high IUC-led operating
cost. Even if there is about 90% off-net calling on 400-500 MOUs, the IUC cost
will be restricted to INR50-60/subscriber.
We believe this may also act as a key support to ARPU levels, as any further
ARPU reduction in the quest for higher subscriber market share may become
economically unviable.
We have revised our subscriber estimates by 22%/18% for FY18/19E, leading to
15%/46% increase in FY19E revenue/EBITDA to INR396b/INR64b. We expect
RJio to add ~40m out of the current 89m active subscribers, as per TRAI, led by
VoLTE feature phone consumption.
Smaller operators vulnerable to subscriber share loss
n
n
n
n
We continue to believe that smaller operators (which have a larger proportion
of second-SIM, deal-hunting subscribers) are highly vulnerable to RJio’s price
plans. This is evident from April/May’ 17 subscriber data, which highlighted
active subscriber gains for Bharti, but significantly higher subscriber churn for
smaller operators.
For incumbents, particularly Bharti, the launch of feature phone by RJio may
prolong the risk of subscriber retention over the next 10-12 months, as it may
not have any value proposition for feature phone subscribers looking for low-
ARPU data consumption.
Our channel checks indicate that VoLTE network launch may accelerate among
large operators, but this may take about 10-12 months (this poses a risk of
market share dilution).
We continue preferring Bharti, given its strong network position, which should
allow earnings accretion as the current hyper-competitive market settles. Idea
remains vulnerable in the near term, given its weak competitive footing.
However, over a three-year period, its improved competitive position and
synergy gains should support the stock price.
24 July 2017
4

Update | 21 July 2017
Telecom
Vodafone’s revenue growth stabilizes
Unlimited usage plans drive high volume growth at stable ARPUs
n
Wireless revenue stabilizes after two quarters of decline:
Vodafone India’s
wireless revenue grew 1% QoQ (declined 15% YoY) to INR89b. Revenue
stabilized after last two quarters of 6-7% QoQ decline. ARPU dropped 1% QoQ
(and 20% YoY) to INR141. Launch of commercial offerings by RJio has arrested
the revenue decline, as subscriber usage is recovering. This has offset the ARPU
decline seen on the back of unlimited usage fixed-price plans.
Voice revenue stabilizes:
Voice revenue stabilized, with a 1% QoQ growth to
INR67.6b, led by 1.4% subscriber growth to 212m, partly offset by voice ARPU
decline of 1% to INR107.
Data volumes record significant leap:
Data revenue grew just 0.4% QoQ to
INR21.3b, 24% of total revenue. Data volumes grew 84% QoQ, steered by
unlimited usage plans. The monthly data usage per customer surged 78% QoQ
to 1.1GB, but this was offset by 45% QoQ decline in data price to INR90/GB.
Expect sequentially stable revenue for Bharti and Idea in 1QFY18:
Vodafone’s
sequentially steady revenue indicates that incumbent telcos like Bharti and Idea
should also see revenue stabilization in 1QFY18, on the back of voice and data
volume recovery, partly offset by the decline in ARPUs due to unlimited
offerings.
Capex to be postponed to FY19:
The Vodafone-Idea merger is expected to
conclude by FY18. Until then, we expect both Vodafone and Idea to soften capex
spending. Our channel checks indicate that post-merger, both network
restructuring and fresh capex will accelerate, as complementary networks of
both the companies will be synergized.
Expect market share dilution until the merger:
We continue to believe that
both Vodafone and Idea operate on weak competitive footing. Until the merger,
it might be challenging for them to retain their market share. However, beyond
FY19, better data network should strengthen their competitive position and
arrest market share dilution.
FY15
2Q
97
-0.6
187
-3.1
174
2.3
80
-3.7
FY16
2Q
99
-2.2
178
-3.2
188
1.5
76
-3.9
FY17
2Q
103
-2.3
171
-3.1
201
0.7
76
-3.4
FY18
1Q
89
0.7
141
-1.1
212
1.4
68
0.8
n
n
n
n
n
Exhibit 1:
Vodafone: Key Performance Indicators
Particulars
India Wireless (INR b)
Growth (QoQ)
ARPU (INR)
Growth (QoQ)
Subscriber base (m)
growth
Voice revenues (INR b)
growth (QoQ)
1Q
97
3.1
193
0.5
170
2
83
1.2
3Q
100
3.5
189
1.1
179
2.8
82
2.3
4Q
100
0.2
184
-2.7
184
2.9
81
-0.6
1Q
102
1.5
184
-0.2
185
0.9
79
-2.3
3Q
100
0.6
175
-1.6
194
2.9
76
0
4Q
104
3.9
177
1.1
198
2.2
79
3.8
1Q
105
1
176
-0.3
199
0.7
79
-0.5
3Q
96
-6.3
158
-7.5
205
2
72
-5
4Q
88
-8
142
-9.9
209
2.1
67
-6.9
Source: MOSL, Company
24 July 2017
5

Reliance Industries
BSE SENSEX
32,029
S&P CNX
9,915
21 July 2017
1QFY18 Results Update | Sector: Oil & Gas
CMP: INR1,586
TP: INR1,499 (-5%)
Neutral
Motilal Oswal values your support in
the Asiamoney Brokers Poll 2017 for
India Research, Sales and Trading
team. We
request your ballot.
Standalone EBITDA/PAT largely in line; GRMs at USD11.9/bbl
Reliance Industries’ (RIL) 1QFY18 standalone EBITDA rose 7% YoY (+3% QoQ) to INR116b,
largely in line with our estimate of INR118.5b. Reported PAT rose 9% YoY (flat QoQ) to
INR81.9b, in line with our estimate of INR82.9b. Reported GRM stood at USD11.9/bbl
(est. of USD10) and refining throughput at 17.3mmt (est. of 17.5mmt).
§
Bloomberg
Equity Shares (m)
M.Cap.(INRb)/(USDb)
52-Week Range (INR)
1, 6, 12 Rel. Per (%)
Avg Val, INRm
Free float (%)
RIL IN
3,240
4,589/ 68.8
1592 / 932
10/36/42
11542
55.0
§
§
Financials & Valuations (INR b)
Y/E March
2017 2018E
Net Sales
2,420 3,283
EBITDA
433
532
Net Profit
314
376
Adj. EPS (INR)
96.7 115.5
EPS Gr. (%)
14.6
19.5
BV/Sh. (INR)
974 1,083
RoE (%)
11.6
12.3
RoCE (%)
9.1
10.4
Payout (%)
13.3
14.4
Valuations
P/E (x)
16.4
13.7
P/BV (x)
1.6
1.5
EV/EBITDA (x)
14.2
10.0
EV/Sales (x)
2.5
1.6
2019E
3,774
573
417
128.1
10.9
1,204
12.3
10.9
14.4
12.4
1.3
8.3
1.3
§
§
§
Estimate change
TP change
Rating change
Standalone - Quarterly Earning Model
Y/E March
Net Sales
YoY Cha nge (%)
Tota l Expendi ture
EBITDA
Ma rgi ns (%)
Depreci a ti on
Interes t
Other Income
PBT
Ta x
Ra te (%)
Adj PAT
YoY Cha nge (%)
Ma rgi ns (%)
Key Assumptions
Refi ni ng throughput (mmt)
GRM (USD/bbl )
Petchem EBITDA/tonne (USD/MT)
Petchem vol umes (mmt)
E: MOSL Es ti ma tes
§
EBITDA in line:
Refining EBIT stood at INR64b (-3% YoY, +2% QoQ). 1QFY18 GRM
stood at USD11.9/bbl v/s USD11.5/bbl in 1QFY17 and 4QFY17. GRM was much
higher, despite weakening in gasoline/diesel cracks and lower light-heavy and
Brent-Dubai spreads, due to better yield/crude optimization and risk management.
Petchem EBIT was INR40b (+37% YoY, +15% QoQ), with margin of 16.5% coming in
ahead of 13.7% in 4QFY17, primarily due to strengthening PP and PE deltas.
Expect no further delays in core projects:
Management guided for full
commissioning of the ROGC project in another 45-60 days. No change in
commissioning schedule of petcoke gasifier; expecting by 4QFY18.
Domestic E&P continues to shrink:
E&P EBIT stood at -INR2.3b v/s INR480m in
1QFY17 and -INR780m in 4QFY17. KG-D6 gas production stood at 6.4mmscmd (-
27% YoY, -14% QoQ). Shale gas production was down to 34.7bcfe (-22% YoY,-11%
QoQ) due to temporary shut-in at several wells.
Jio capex reaches INR2t:
Capex to date has reached INR2t, with INR210b spent in
1QFY18 and expected INR20b in next 3-4 quarters. Jio’s paid subscribers reached
100m. The company is expected to report RJio financials from 2QFY18.
1QFY18 capex at INR250b:
Consol. gross debt was INR2t with cash of INR721b.
Net debt stood at INR2.5t, including suppliers’ credit and deferred spectrum
liabilities.
Raise estimates:
For the last few quarters, RIL’s GRM has shown great resilience to
(a) weakness in product crack spreads, (b) narrowing of light-heavy and Brent-
Dubai differentials. The same has been possible through aggressive risk
management, crude and yield optimization. On account of this resilience, we raise
our GRM estimate to USD11.2/11.4/bbl v/s USD10.2/10.4/bbl earlier for FY18/19.
Valuation view:
On FY19E basis, the stock trades at 12.4x adj. SA EPS of INR128
and EV/EBITDA of 8.3x. Our SOTP-based fair value stands at INR1,499/share.
Maintain
Neutral.
FY17
2Q
3Q
595,770 618,060
-2.0
9.3
490,220 512,020
105,550 106,040
17.7
17.2
20,290 20,770
6,330
9,310
22,800 30,250
101,730 106,210
24,690 25,990
24
24
77,040 80,220
17.4
11.1
12.9
13.0
18.0
10.1
314.4
2.1
17.8
10.8
329.4
2.0
4Q
671,460
34.4
558,660
112,800
16.8
24,090
2,350
13,710
100,070
18,560
19
81,510
11.4
12.1
17.5
11.5
313.7
2.1
1Q
642,170
20.0
526,280
115,890
18.0
21,580
7,880
19,180
105,610
23,650
22
81,960
8.6
12.8
17.3
11.9
349.4
2.2
FY18E
2QE
3QE
861,603
886,224
44.6
43.4
724,198
745,153
137,405
141,071
15.9
15.9
27,456
27,456
9,355
9,355
25,685
25,685
126,280
129,946
27,782
28,588
22
22
98,498
101,358
27.9
26.3
11.4
11.4
17.5
11.0
300.0
2.9
17.5
11.0
300.0
3.0
FY17
4QE
892,829
33.0
754,771
138,059
15.5
27,456
9,355
25,685
126,933
27,925
22
99,008
21.5
11.1
17.5
11.0
280.0
3.0
2,420,250
3.8
1,987,690
432,560
17.9
84,650
27,230
87,090
407,770
93,520
23
314,250
14.6
13.0
70.1
11.0
315.3
8.1
(INR Million)
FY18E 1QFY18 Var v/s
Est. Est. (%)
3,282,826 574,944
11.7
35.6
7.5
2,750,401 456,421
15.3
532,425 118,523
-2.2
16.2
20.6
103,948 27,456
-21.4
35,944
9,355
-15.8
96,235 24,600
-22.0
488,769 106,313
-0.7
107,945 23,389
1.1
22
22
380,824 82,924
-1.2
21.2
9.9
11.6
14.4
69.8
11.2
307.4
11.1
17.5
10.0
350.0
2.5
-1.1
18.7
-0.2
-10.9
1Q
534,960
-18.7
426,790
108,170
20.2
19,500
9,240
20,330
99,760
24,280
24
75,480
19.5
14.1
16.8
11.5
303.8
1.9
24 July 2017
6

21 July 2017
1QFY18 Results Update | Sector: Automobiles
Bajaj Auto
Buy
BSE SENSEX
32,029
Bloomberg
Equity Shares (m)
M.Cap.(INRb)/(USDb)
52-Week Range (INR)
1, 6, 12 Rel. Per (%)
Avg Val, INRm
Free float (%)
S&P CNX
9,915
BJAUT IN
289
814.6 / 12.7
3122 / 2510
-2/-14/-14
806
50.7
CMP: INR2,819
TP: INR3,281(+17%)
n
Higher RM cost, negative operating leverage results in 8-year low margins
Volume decline drags revenue; 6% YoY realization growth a surprise:
Net
sales declined 5.3% YoY (grew 11.1% QoQ) to INR54.4b (our estimate:
INR52.3b), as volumes declined 10.7% YoY (grew 12.8% QoQ). In the domestic
market, lower channel inventory and purchase postponement by customers
due to GST impacted wholesale numbers. However, an unexpected ~6% YoY
increase (1.5% QoQ decline) in realization to INR61,258/unit (our estimate:
+2%) aided revenue. Export revenue grew 20.5% YoY to INR24.8b.
EBITDA margin at multi-quarter low on higher RM, operating deleverage:
EBITDA fell 20% YoY to INR9.4b (our estimate: ~INR10b), implying EBITDA
margin of 17.2% (-320bp YoY, -130bp QoQ; our estimate: 19.1%). This was due
to higher RM cost (+280bp YoY, +220bp QoQ) and operating deleverage on
weak domestic volumes. However, adjusted PAT declined just 3.2% to INR9.5b
(our estimate: INR8.8b) due to higher other income. It reported exceptional
cost of INR320m related to GST-related compensation to dealers.
Management commentary:
(a)
Maintained motorcycle industry growth
outlook at 7% in FY18; BJAUT to grow at 10% from July 2017; guided FY18
exports at 1.6m units, (b) Guided EBITDA margin of 19.5-20% v/s 18.3% in
1QFY18, (c) Took price hikes of INR500-1,000/unit in 2W and INR1,500-
2,000/unit in 3W in domestic markets towards the end of May, and indicated a
price hike in exports from July, (d) Aiming at electric 3W launch in two years,
(e) In final stages of announcing a global alliance in 2Ws.
Valuation and view:
We have lowered our EPS estimates by 3-4% for FY18/19
on lower margin assumptions. Valuations at 20.5x/17.2x FY18E/19E standalone
EPS are attractive, considering worst of volumes and margins are behind us.
We value BJAUT at 18x FY19E EPS and add INR214/share for its KTM stake to
arrive at a TP of INR3,281. Maintain
Buy.
Financials & Valuations (INR b)
2017 2018E 2019E
Y/E Mar
218
241
271
n
Net Sales
44.2
44.8
53.0
EBITDA
38.3
39.7
47.3
PAT
132
137
164
EPS (INR)
-2.6
3.7
19.2
Gr. (%)
589
648
713
BV/Sh (INR)
25.3
22.2
24.0
RoE (%)
24.6
21.5
23.3
RoCE (%)
21.3
20.5
17.2
n
P/E (x)
4.8
4.4
4.0
P/BV (x)
Estimate change
TP change
Rating change
n
24 July 2017
7

RESULTS
FLASH
20 July 2017
Q1FY18 Results Update | Sector: Consumer
United Spirits
Neutral
BSE SENSEX
32,029
S&P CNX
9,915
CMP: INR2709
n
n
We will revisit our estimates
post earnings call/management
interaction.
Highway ban impact greater than expected; Prestige and Above volumes
decline 9.7% YoY, overall volumes down 18.9%
Conference Call Details
Date:
24 July 2017
Time:
10.00 AM IST
Dial-in details:
+91 22 3960 0651
th
n
n
Financials & Valuations (INR b)
Y/E Mar
2017 2018E
Sales
85.5
93.4
EBITDA
9.8
11.8
PAT
3.9
5.4
EPS (INR)
26.7
37.4
EPS Gr. (%)
87.1
39.7
BV/Sh.(INR)
133.4
193.7
RoE (%)
21.3
19.3
RoCE (%)
11.8
13.8
Payout (%)
0.0
0.0
Valuations
P/E (x)
94.1
67.3
P/BV (x)
18.9
13.0
EV/EBITDA (x) 37.0
30.2
Div. Yield (%)
0.0
0.0
2019E
107.8
14.4
7.5
51.8
38.7
263.0
19.7
15.7
0.0
n
n
n
n
48.5
n
9.6
n
24.4
0.0
n
n
n
UNSP posted standalone net sales decline of 12.7% YoY (est.flat sales) to INR
17.8b with 18.9% decline in volumes YoY (est.9% decline).
Management attributed sales decline to highway ban and one off impact of
operating model changes. The management expects the impact of highway ban
in 2QFY18 and 3QFY18 as well, albeit to a lesser extent compared to 1QFY18.
Gross sales declined 0.6% YoY to INR58.2b with excise duty as a percentage of
sales up 420bps YoY to 69.4%. There has been increased tax and excise levies in
Maharashtra and West Bengal.
Overall 1QFY18 volumes declined 18.9% YoY to 18.0m cases - Popular Segment
declined 25.6% YoY to 9.6m cases while Prestige and above segment volumes
declined 9.7% YoY to 8.4m cases.
In 1QFY18, Net sales of Prestige and above portfolio declined 8% YoY while
Popular segment sales declined by 20% YoY in this period.
Gross margin improved 270bp YoY to 46.0% due to improved mix.
Adspends were up 90bp YoY to 9.1% of sales.
EBITDA margin however declined by 170 bps YoY to 8.8% (est9.0%) despite
sharp gross margin improvement. Staff costs increased 50 bp YoY and other
expenses increased by 290bp YoY to 18.7% of sales. EBITDA margin decline was
because of sharp sales decline due to highway ban even as the company
continued to invest in the business.
EBITDA declined 26.2% YoY to INR1.57b (est. INR 1.82b).
Interest costs declined 31.7% YoY to INR703m led by debt reduction and
favourable rates.
PBT was INR859m versus expectation of INR 1.3b. Other income was
significantly lower than expectations at INR309m vs expectations of INR 691m
Tax rates were lower than expected at 25.8% versus expectation of 33%.
Adjusted PAT declined 23.4% YoY to INR637m (est. 13.1% growth to INR869m).
24 July 2017
8

RESULTS
FLASH
Avenue Supermarts
TP: INR804(-12%)
Neutral
20 July 2017
Q1FY18 Results Update | Sector: Retail
BSE SENSEX
32,029
S&P CNX
9,915
CMP: INR914
n
n
Revenue, EBITDA and PAT post strong growth; in-line with estimates;
But
margins declined 50bp led by higher raw material costs
DMART’s 1QFY18 revenue grew 35.7% YoY to INR35.9b as against INR26.5b in
1QFY17, in-line with our estimate of INR35.6b.
EBITDA margin contracted 50bp YoY to 8.4% in 1QFY18 from 8.9% in 1QFY17,
in-line with our estimate of 8.4%, however the transition into GST regime
witnessed minimal migration challenges.
Accordingly, adj. PAT grew from INR1,184m in 1QFY17 to INR1,748m (est.
INR1,775m) in 1QFY18, growing 47.6%. The sharp increase in PAT was led by
higher other income which grew from INR49m in 1QFY17 to INR228m in
1QFY18.
Valuation and view:
We will revisit our estimates post the discussion with
management. Outlook on growth, especially same store sales growth, would be
keenly watched. Based on current estimates, it trades at 12.8/17.9x FY18/19E
EPS. Maintain
Neutral.
Financials & Valuations (INR b)
Y/E Mar
2017 2018E
Net Sales
119.0
163.1
EBITDA
9.8
13.7
NP
4.8
8.0
EPS (INR)
7.7
12.8
EPS Gr. (%)
34.5
67.2
BV/Sh. (INR)
61.6
70.5
RoE (%)
17.9
19.4
RoCE (%)
14.2
16.7
119.1
71.2
P/E (x)
14.8
13.0
P/BV (x)
2019E
217.9
n
18.7
11.2
17.9
39.3
n
83.0
23.3
23.4
51.1
11.0
Quarterly Performance
Y/E March
Net Sales
YoY Change (%)
Total Expenditure
EBITDA
Margins (%)
Depreciation
Interest
Other Income
PBT before EO expense
PBT
Tax
Rate (%)
MI & Profit/Loss of Asso. Cos.
Reported PAT
Adj PAT
YoY Change (%)
Margins (%)
E: MOSL Estimates
1Q
26,524
-
24,176
2,348
8.9
288
281
49
1,828
1,828
643
35.2
0
1,184
1,184
-
4.5
FY17
2Q
FY18
FY17
FY18E
(INR Million)
FY18E
Var
(%)
1
3Q
4Q
1Q
2QE
3QE
4QE
1QE
33,394 31,106 35,981 39,118 45,749 42,616 118,977 163,464 35,650
-
40.6
35.7
-
37.0
37.0
38.6
37.4
30,511 29,029 32,949 35,464 41,678 39,633 109,165 149,723 32,641
2,883 2,077 3,032 3,654 4,072 2,983
9,812 13,741 3,009
8.6
6.7
8.4
9.3
8.9
7.0
8.2
8.4
8.4
314
354
337
380
410
450
1,278
1,577
365
310
308
243
0
0
0
1,220
243
0
85
99
228
46
46
46
286
367
46
2,344
2,344
825
35.2
0
1,519
1,519
-
4.5
1,515
1,515
548
36.2
0
967
967
47.4
3.1
2,680
2,680
932
34.8
0
1,748
1,748
47.6
4.9
3,320
3,320
1,129
34.0
0
2,191
2,191
5.6
3,708
3,708
1,261
34.0
0
2,447
2,447
61.1
5.3
2,579
2,579
877
34.0
0
1,702
1,702
76.1
4.0
7,600
7,600
2,683
35.3
129
4,788
4,788
49.5
4.0
12,287
12,287
4,199
34.2
0
8,088
8,088
68.9
4.9
2,690
2,690
915
34.0
0
1,775
1,775
5.0
1
0
0
-2
-2
24 July 2017
9

21 July 2017
Annual Report Update
| Sector:
Consumer
Britannia
Buy
BSE SENSEX
32,029
S&P CNX
9,915
CMP: INR3,832
TP: INR4,450 (+16%)
Well positioned in a high-potential market
Scouting for more growth opportunities to stay ahead of competition
Key takeaways from Britannia’s (BRIT) FY17 annual report:
n
Considerable investments toward R&D in recent years leading to the
launch of a slew of products
n
Exhibited massive improvements in distribution, particularly direct
distribution
n
Ambitious expansion plans signify management’s confidence on long-term
growth prospects, despite near-term challenges
n
Massive growth opportunity in each of its key product categories, such as
biscuits, cakes, rusks and other adjacencies
n
Company sees potential for joint ventures and distribution tie-ups
n
Stock Info
Bloomberg
Equity Shares (m)
52-Week Range (INR)
1,6,12 Rel. Perf. (%)
M.Cap. (INR b)
M.Cap. (USD b)
Avg Val ( INRm)
Free float (%)
BRIT IN
120.0
3841/2776
5/6/20
459.5
6.8
569
49.3
Financials Snapshot (INR b)
Y/E Dec
2017 2018E
Net Sales
89.6 101.5
EBITDA
11.9
13.8
PAT
8.8
10.3
EPS (INR)
73.7
85.4
Gr. (%)
7.3
16.0
BV/Sh (INR)
224.7 272.4
RoE (%)
36.9
34.4
RoCE (%)
31.1
28.7
P/E (x)
52.0
44.9
P/BV (x)
17.1
14.1
Shareholding pattern (%)
As On
Promoter
DII
FII
Others
Mar-17
50.7
11.7
16.0
21.6
Dec-16
50.7
11.0
17.4
20.9
2019E
118.7
17.2
12.7
105.5
23.5
335.0
34.7
29.5
36.3
11.4
n
Mar-16
50.7
20.8
6.5
22.0
FII Includes depository receipts
Existing categories offer high-growth potential:
(1)
Biscuits:
Low per capita
consumption in India and premiumization are likely to present attractive
growth opportunities, in our view. This is expected to be driven by the
company’s efforts on R&D, distribution expansion, understanding of
consumer behavior, and large-scale capacity expansion. (2)
Cakes:
This
segment is dominated by unorganized players. Thus, BRIT’s capabilities on
innovation/achieving longer shelf life for its products without compromising
on quality place it well to take share away from unorganized names,
especially post GST implementation. (3)
Rusks:
The company is well
positioned to eat into the share of unorganized players in this segment too,
driven by its efforts on innovation, market leadership and manufacturing
scale. We note that both the cakes and rusks categories can also leverage
significantly on BRIT’s wide distribution reach of 4.7m outlets (including
1.55m outlets direct reach) in the biscuits segment.
Focus on R&D, distribution/manufacturing expansion to pay off:
(1) BRIT’s
investment in R&D (including a new R&D center commissioned in FY17), is
paying off handsomely both in terms of new product launches and potential
entry into adjacencies. (2) Distribution expansion has been massive, with its
direct reach doubling over the past three years (overall reach of 4.7m
outlets at end-FY17, including 0.7m outlets added over the past year). (3)
BRIT added eight new lines at five of its plants across south and west India in
FY17, with more capacities being set up in FY18 at Guwahati (Assam),
Ranjangaon (Maharashtra) and Mundra SEZ. This is indicative of
management’s confidence on the long-term growth prospects. To grow its
business, the company incurred capex of INR2.6b in FY17, which is likely to
increase to INR3.5b in FY18.
24 July 2017
10

Stock Performance (1-year)
n
n
n
Working capital increase, higher other assets hurt operating cash flows:
Compared to consolidated sales growth of 13.3% in FY17, inventory increase
stood at 50% (+3 days to 22 days) and other assets growth at 57% to INR14b.
Higher inventory can be partly attributed to import of wheat to take advantage
of cheaper global rates and a sharp reduction in import duty on wheat by the
Indian government last year. Other assets increased due to (i) advances paid on
such contracts and (2) rise in inter-corporate deposits of Wadia Group company,
Bombay Dyeing (offers attractive coupon of 12%, but is not part of best
practices, especially considering the increase in ICD amounting to INR2.5b to
this entity).
Other points worth considering:
(1) Sale of all the shares owned so far by CEO
Varun Berry, (2) absence of disclosure of segment-wise sales break-up in the
FY17 annual report, unlike in the previous years, (3) company no more providing
data on material cost break-up for key commodities and (4) company no longer
sharing data on ad expenses in the quarterly numbers. We note that it is not
mandatory to provide sales/material cost break-up as per regulatory norms, but
best practices demand maintenance of previous high disclosure standards. Also,
the annual report highlights as much as 14% YoY reduction in ad spend in FY17.
This in itself is not a worry as the reduction was largely due to conservatism on
adspend in 2HFY17 following demonetization. However, it means that out of
INR1.55b costs savings YoY in FY17, INR611m (~40%) came from
advertisements, which is unlikely to sustain, in our view. Encouragingly, the
company’s targeted costs saving in FY18 is 40% higher than FY17 levels without
much help from adspend reduction.
Valuation and view:
We are enthused by investments in R&D, distribution
expansion and capacity increase, all of which are essential building blocks for
strong revenue growth. Targeted entry into adjacencies and a slew of potential
strategic tie-ups (leveraging on its enviable and consistently improving
distribution reach, R&D capabilities and marketing skills) present another leg of
growth. There are no changes to our forecasts. We maintain
Buy
with a target
price of INR4,450 (40x June 2019E EPS, 15% premium to three-year average).
24 July 2017
11

RESULTS
FLASH
Ashok Leyland
TP: INR122
BUY
24 July 2017
Results Flash | Sector: Automobiles
BSE SENSEX
29,859
S&P CNX
9,285
CMP: INR86
n
We will revisit our estimates
post earnings call/management
interaction.
EBITDA margins disappoint led by increased costs
Revenues were in line at INR42.4b (est. of INR42.8b), -0.5% YoY (-36% QoQ).
n
Growth in revenues was led by realization growth of 8.9% YoY (+7% QoQ) to
INR1.49b, led by price hikes.
n
However, the benefit of higher realizations was offset by volume decline of
~8.6% YoY (-40% QoQ) to 28.45k units due to pre-buying ahead of BS-IV
emission norms implementation (effective 1 April), postponement in purchase
ahead of GST implementation, and limited availability of BS-IV components
from vendors.
n
AL’s market share increased by 360bp YoY to 34.7% in the domestic M&HCV
segment, and by 96bp YoY to 8.1% in the LCV segment (as of 1QFY18). AL
indicated that the success of iEGR technology for BS-IV vehicles is one of the
drivers of market share gains.
n
EBITDA margin contracted 410bp YoY (-380bp QoQ) to 7.2%, led by an increase
in staff cost (+192bp YoY), RM costs (+76bp YoY) and other operating expenses
(+142bp YoY).
n
AL reported aggregate exceptional loss of ~INR126m.
n
Higher tax led to adj. PAT decline of 59% YoY (-72% QoQ) to ~INR1.2b (est. of
INR2.1b).
Key questions for the management
n
Update on CV demand post GST
n
RM cost guidance and possibility of price hikes to mitigate the impact of the same
n
Update on Hinduja Foundries and its profitability
Valuation and view:
We will revisit our estimates post the earnings call. The stock
trades at 18.7x/14.5x FY18/19E EPS. We have a
Buy
rating with a TP of ~INR122.
FY17
2Q
3Q
33,446 32,838
-10.5
6.2
1,382
1,375
4.0
3.4
46,224 45,163
-6.9
9.8
67.8
69.4
8.0
8.7
12.6
11.8
40,859 40,621
5,365
4,542
11.6
10.1
316
258
339
453
4,146
2,396
0
0
4,146
2,396
1,202
778
29.0
32.5
2,944
1,618
14
-26
FY18
2Q
3Q
40,246 42,591
20.3
29.7
1,480
1,488
7.1
8.2
59,578 63,364
28.9
40.3
70.5
70.6
7.1
7.1
11.0
11.7
52,802 56,666
6,776
6,699
11.4
10.6
425
475
300
225
5,476
5,509
0
0
5,476
5,509
1,533
1,542
28.0
28.0
3,943
3,966
34
145
FY17
FY18E
4Q
57,483 145,066 168,804
20.7
3.4
16.4
1,531
1,380
1,501
10.2
2.3
8.7
88,001 200,187 253,321
33.0
5.7
26.5
71.3
69.7
70.6
5.0
7.6
6.9
11.1
11.6
11.6
76,868 178,161 225,653
11,133 22,025 27,669
12.7
11.0
10.9
546
1,363
1,830
313
1,554
1,204
9,634 16,809 22,376
0
3,508
0
9,634 13,301 22,376
2,697
1,070
6,265
-
8.0
28.0
6,744 13,447 16,111
58
11.6
19.8
FY17
1QE
28,484
-8.6
1,501
9.8
42,755
0.4
69.8
9.2
11.0
38,485
4,269
10.0
375
375
2,869
0
2,869
803
28.0
2,066
-29.0
Var.
(%)
0.0
-0.9
-0.9
-40bp
110bp
200bp
-28.3
-280bp
2.4
-2.3
-39.7
-44.1
Conference Call Details
Date:
24 July 2017
Time:
10.00 AM IST
Dial-in details:
186030131313
th
Financials & Valuations (INR b)
2017 2018E
Y/E Mar
Net Sales
200.2 253.3
EBITDA
22.0
27.7
NP
13.4
16.1
EPS (INR)
4.6
5.5
EPS Gr. (%)
8.1
19.8
BV/Sh. (INR)
20.9
24.0
RoE (%)
23.3
24.5
RoCE (%)
21.8
21.6
P/E (x)
22.4
18.7
P/BV (x)
4.9
4.3
2019E
288.8
32.4
20.8
7.1
29.1
28.4
27.1
24.7
14.5
3.6
Quarterly Performance
(INR Million)
Total Volumes (nos)
Growth %
Realizations (INR '000)
% change
Net operating revenues
Change (%)
RM/sales %
Staff/sales %
Other exp/sales %
Total Cost
EBITDA
EBITDA Margins(%)
Other Income
Interest
PBT before EO Item
EO Exp/(Inc)
PBT
Tax
Effective Tax Rate (%)
Adj. PAT
Change (%)
1Q
31,165
10.7
1,367
-0.9
42,588
9.7
68.7
8.4
11.6
37,768
4,820
11.3
385
338
4,154
0
4,154
1,246
30.0
2,908
130
4Q
47,617
8.5
1,390
2.1
66,179
10.8
71.9
6.2
10.8
58,880
7,299
11.0
404
423
6,114
3,508
2,605
-2,157
-
4,279
-16
1Q
28,484
-8.6
1,488
8.9
42,378
-0.5
69.4
10.3
13.0
39,317
3,061
7.2
384
366
1,730
126
1,605
492
30.7
1,199
-59
-41.9
E: MOSL Estimates
24 July 2017
12

21 July 2017
1QFY18 Results Update | Sector: Oil & Gas
MRPL
BSE SENSEX
32,029
Bloomberg
Equity Shares (m)
M.Cap.(INRb)/(USDb)
52-Week Range (INR)
1, 6, 12 Rel. Per (%)
Avg Val, INRm
Free float (%)
MRPL IN
EBITDA impacted by inventory loss; core GRM at USD7.07/bbl
1,753
n
MRPL’s 1QFY18 EBITDA of INR5.8b (excl. forex gain of INR315m; -52% YoY, -
236.8 / 3.5
63% QoQ) came in significantly below our estimate of INR7.5b due to
143 / 74
inventory loss of INR4.4b (USD2.33/bbl) and higher opex (USD3.3/bb) due to
-3/7/43
shut down. While interest cost came in at INR1.1b (est. of INR1.2b, -26%
186
11.4
YoY, -12% QoQ), depreciation stood at INR1.6b (est. INR1.9b; -4% YoY/QoQ).
2019E
488.2
40.3
20.6
11.7
n
24.4
73.7
17.0
13.6
10.8
1.7
n
S&P CNX
9,915
CMP: INR127
TP: INR113(-11%)
Downgrade to Sell
Financials & Valuations (INR b)
Y/E Mar
2017 2018E
Net Sales
432.1
433.3
EBITDA
47.1
35.3
PAT
25.9
16.5
EPS (INR)
14.8
9.4
Gr. (%)
95.1 (36.2)
BV/Sh (INR)
57.5
64.7
RoE (%)
31.4
15.5
RoCE (%)
19.6
11.6
P/E (x)
8.6
13.4
P/BV (x)
2.2
2.0
Estimate change
TP change
Rating change
n
Other income of INR204m (-91% YoY, -45% QoQ) missed our estimate of
INR584m. Effective tax rate stood at 29.5% v/s 33% in 4QFY17 and 37% in
1QFY17. Adj. PAT of INR2.3b (-67% YoY, -73% QoQ) was significantly below
our estimate of INR3.3b.
Core GRM at USD7.07/bbl:
Including the inventory impact, the company
reported GRM of USD4.74/bbl (est. of USD5.5) in 1QFY18 v/s USD5.29/bbl in
the year-ago period. Core GRM stood at USD7.07/bbl v/s benchmark
Singapore GRM of USD6.4/bbl. Inventory loss stood at USD2.33/bbl in
1QFY18 v/s gain of USD4.72/bbl in 1QFY17.
Crude throughput stood at 3.98mmt
(-6% YoY, -3% QoQ), implying 106%
utilization in the quarter, as against throughput of 3.66mmt (98% utilization)
in 1QFY17.
Valuation and view:
We believe that the refinery should be able to report
GRM of USD6.2/6.5/bbl in FY18/19. The stock trades at 10.8x FY19E EPS of
INR11.7 and EV of 5.8x FY19E EBITDA. We value the stock at EV of 5.5x
FY19E EBITDA to arrive at a fair value of INR97/share for the standalone
refinery and add INR16 for OMPL. Our fair value stands at INR113. Peak
valuations leave no room for upside, in our view.
Downgrade to Sell.
FY18
2QE
3QE
4QE
109,409 110,241 111,074
9.7
-3.9
-16.7
9,737
9,809
9,881
8.9
8.9
8.9
1,896
1,896
1,896
1,263
1,263
1,263
579
579
579
7,157
7,228
7,300
0
0
0
7,157
7,228
7,300
2,385
2,409
2,433
33
33
33
4,771
4,819
4,867
4,771
4,819
4,867
14.7
-14.9
-44.1
4.4
4.4
4.4
4.0
6.4
4.0
6.4
4.0
6.4
FY17
432,079
9.0
47,076
10.9
6,788
5,188
4,232
39,332
-15,973
55,305
18,877
34
36,428
25,907
98.3
6.0
16.3
6.0
(INR Million)
FY18E
FY18 Var. vs
1QE
est
433,349 106,126
-3%
0.3
25.9
35,253
7,562 -23%
8.1
7.1
7,325
1,896 -14%
4,864
1,263 -15%
1,941
584 -65%
25,005
4,987 -33%
0
0
25,005
4,987 -33%
8,207
1,662 -41%
33
33
16,798
3,325 -30%
16,798
3,325 -30%
-35.2
-53.7
3.9
3.1
16.0
6.6
4.0
5.5
-1%
27%
Standalone - Quarterly earning model
Y/E March
Net Sales
YoY Change (%)
EBITDA
Margins (%)
Depreciation
Interest
Other Income
PBT before EO expense
Extra-Ord expense
PBT
Tax
Rate (%)
Reported PAT
Adj. PAT
YoY Change (%)
Margins (%)
Key Assumptions
Refining throughput (mmt)
Core GRM (USD/bbl)
E: MOSL Estimates
1Q
84,288
-25.5
12,206
14.5
1,703
1,459
2,295
11,340
0
11,340
4,155
37
7,185
7,185
36.0
8.5
3.7
5.3
FY17
2Q
3Q
4Q
99,690 114,753 133,349
-2.5
30.1
43.5
7,855 11,476 15,540
7.9
10.0
11.7
1,681
1,702
1,703
1,115
1,395
1,219
926
636
375
5,984
9,015 12,993
0
0 -15,973
5,984
9,015 28,966
1,826
3,355
9,542
31
37
33
4,159
5,660 19,424
4,159
5,660
8,713
-146.5
91.8
-35.5
4.2
4.9
6.5
4.0
5.5
4.4
5.1
4.2
8.1
1Q
102,624
21.8
5,827
5.7
1,637
1,074
204
3,320
0
3,320
980
30
2,340
2,340
-67.4
2.3
4.0
7.1
24 July 2017
13

24 July 2017
1QFY18 Results Update | Sector: Healthcare
Divi’s Lab
Neutral
BSE SENSEX
32,029
Bloomberg
Equity Shares (m)
M.Cap.(INRb)/(USDb)
52-Week Range (INR)
1, 6, 12 Rel. Per (%)
Avg Val, INRm
Free float (%)
S&P CNX
9,915
DIVI IN
Regulatory issues impacted revenues
265.5
n
Revenues declined 18%YoY (~16% miss), while EBITDA of INR2.4b was 23%
191.4 / 3.0
below our estimate. EBITDA margin contracted ~1010bpYoY to 29.8% due
1,380 / 533
lower turnover and remediation expense related to import alert at unit II.
10/-18/-55
PAT of INR1.8b (-42%YoY) was ~25% below our estimate. Sales was
1162.0
47.9
impacted by INR1.5b during the quarter due to time required for setting up
CMP: INR721
TP: INR680 (-6%)
Financials & Valuations (INR b)
2017 2018E
Y/E Mar
Net Sales
40.5
37.4
EBITDA
14.3
12.1
PAT
10.5
8.9
EPS (INR)
39.7
33.6
Gr. (%)
-5.3
-15.4
BV/Sh (INR)
176.5
195.0
RoE (%)
23.5
18.1
RoCE (%)
23.3
18.0
P/E (x)
18.2
21.5
P/BV (x)
4.1
3.7
2019E
42.6
14.9
10.6
40.0
19.2
217.0
19.4
19.4
18.0
3.3
n
n
Estimate change
TP change
Rating change
n
n
protocols and procedures for release of export shipment as specified in the
import alert by the US FDA.
Guides for minimal impact from Unit-2 import alert:
DIVIS expects loss of
<5% of sales due to the Unit-2 import alert. Divis has already hired a third-
party consultant to enact remediation measures and help the company to
prepare for Unit-1 inspection. We have witnessed with DRRD and SUNP that
batch-by-batch testing of products leads to a delay in supplies and an
increase in cost.
Unit-1 US FDA inspection is due:
Unit-1 accounts for 35% of total revenue
&its exposure to the US market stands at ~11% of total revenues. This plant
was last inspected in June 14, and an inspection is due over the coming few
days. It will be critical for the company to come out clear in the USFDA
inspection (particularly since the FDA had cited data integrity issues in Unit-
2).
Buyback/special dividend could be near-term trigger:
Divis has cash of
~INR17b. There is a possibility of a buyback/ special dividend (like DRRD) in
the near term, which could provide near-term support to the stock price.
Regulatory concerns a big overhang in near term; Maintain Neutral:
We
retain our Neutral rating with revised target price of INR680 (v/s INR600
earlier), as we increase our target multiple to 17x from 15x earlier on back of
recent positive development on regulatory front (relief on majority of
products and removal of import alert under clause 99-32.
FY18E
2QE
3QE
9,918 9,888
0.0
3.0
3,223 3,214
32.5
32.5
512
512
5
5
345
345
3,051 3,041
3,051 3,041
717
715
23.5
23.5
2,334 2,326
-23.0 -13.3
23.5
23.5
2,334 2,326
FY17 FY18E
FY18E
1QE
9,748
-3.1
3,168
32.5
350
5
250
3,063
3,063
720
23.5
2,343
-22.4
24.0
2,343
Quarterly Performance
Y/E March
FY17
1Q
2Q
3Q
4Q
Net Op Revenue
10,060 9,918 9,600 10,631
YoY Change (%)
24.7
3.1 12.7
-2.8
EBITDA
4,016 3,680 3,777 3,585
Margins (%)
39.9 37.1 39.3 33.7
Depreciation
301
308 310
314
Interest
4
4
4
10
Other Income
184
226 215
245
PBT before EO Income
3,896 3,595 3,678 3,505
PBT
3,896 3,595 3,678 3,505
Tax
878
565 996
912
Rate (%)
22.5 15.7 27.1 26.0
Adj PAT
3,018 3,030 2,683 2,593
YoY Change (%)
23.1
2.5
8.8 -19.5
Margins (%)
30.0 30.5 27.9 24.4
Reported PAT
3,018 2,239 2,683 2,593
E: MOSL Estimates; Quarterly numbers are standalone
(INR M)
1Q
8,212
-18.4
2,448
29.8
323
5
297
2,417
2,417
652
27.0
1,765
-41.5
21.5
1,765
4QE
9,366 40,547 37,384
-11.9
7.6 -7.8
3,265 14,267 12,150
34.9 35.2 32.5
507 1,233 1,855
6
23
22
393
870 1,379
3,144 13,882 11,653
3,144 13,882 11,653
655 3,350 2,738
20.8 24.1 23.5
2,489 10,533 8,914
-4.0 -5.1 -15.4
26.6 26.0 23.8
2,489 10,533 8,914
Var.
(%)
-15.8
-22.7
-21.1
-24.6
-24.6
24 July 2017
14

21 July 2017
1QFY18 Results Update | Sector: Financials
Indian Bank
Buy
BSE SENSEX
32,029
Bloomberg
Equity Shares (m)
M.Cap.(INRb)/(USDb)
52-Week Range (INR)
1, 6, 12 Rel. Per (%)
Avg Val, INRm
Free float (%)
S&P CNX
9,915
INBK IN
480
130.7 / 1.9
365 / 144
7/17/106
304
17.9
CMP: INR329
n
TP: INR382(+16%)
Focus on core operating parameters continues; Asset quality improves
INBK reported PAT of INR3.7b (in-line) v/s INR3.2m in 1QFY17, led by strong
total income of INR21.1b (+26% YoY led by 48% YoY growth in other income)
and controlled opex (11% YoY, -5% QoQ). Provisioning was 52% higher than
estimate at INR7.2b, as PCR increased 350bp QoQ to 61.65%.
Gross slippages increased 14% QoQ, but strong recoveries and upgrades at
INR3.5b (v/s INR201m in 4QFY17) led to net slippage ratio of 1.1%, the lowest
in seven quarters. Absolute GNPA declined 2% QoQ, while GNPA/NNPA fell
26bp/34bp QoQ to 7.21%/4.05%. Calculated PCR improved to 45.7%. Total
stressed book stood at 8.5% of net advances.
Overall loan book grew 1%/4% QoQ/YoY to INR1.29b. The bank cut down on its
corporate book exposure, with the share of corporate loans declining 200bp
YoY to 49%. With a comfortable capital position (CET1 11.7%), the bank is well
poised to grow its loan book.
Calculated NIM expanded 27bp QoQ to 2.94% (28bp higher than estimate),
driven by lower CoF (5.48% v/s 6.24% YoY), partially offset by lower yield on
advances (8.8% v/s 9.25%). NIM is expected to improve further with
moderation in interest reversals (INR450m in 1QFY18).
Valuation and view:
Focus on balance sheet consolidation and core operating
parameters has led to improving earnings, despite challenging macros.
Capitalization is best-in-class with CET 1 ratio of 11.7%. The bank is planning a
FPO to reduce GoI shareholding to 75%. Improvement in loan growth is
expected to drive operating leverage in the ensuing years. We expect RoAs/RoE
to be the best among PSBs at 0.7%/11.2% (FY19E). Maintain
Buy
with a target
price of INR382 (1x FY19E BV) based on RI model.
n
Financials & Valuations (INR b)
Y/E March
2018E 2019E 2020E
NII
58.7 65.1 74.5
OP
44.8 46.2 50.2
NP
16.5 18.4 20.3
EPS (INR)
34.4 38.3 42.3
EPS Gr. (%)
17.6 11.4 10.3
BV/Sh. (INR)
327
357
389
ABV/Sh (INR)
245
273
306
RoE (%)
10.9 11.2 11.3
RoA (%)
0.7
0.7
0.7
Div. Payout (%)
23.2 23.2 23.2
Valuations
P/E (x)
9.6
8.6
7.8
P/ BV (x)
1.0
0.9
0.8
P/ABV (x)
1.3
1.2
1.1
Div. Yield (%)
2.1
2.3
2.6
n
n
n
24 July 2017
15

21 July 2017
1QFY18 Results Update | Sector: Financials
Dewan Housing
Buy
BSE SENSEX
32,029
Bloomberg
Equity Shares (m)
M.Cap.(INRb)/(USDb)
52-Week Range (INR)
1, 6, 12 Rel. Per (%)
Avg Val, INRm
Free float (%)
S&P CNX
9,915
DEWH IN
313
143.4 / 2.2
479 / 214
-3/50/95
905
60.8
CMP: INR458
n
TP: INR630 (+38%)
Growth surprises positively; re-rating to continue
Dewan Housing Finance’s (DEWH) 1QFY18 PAT grew 29% YoY to INR2.61b. Strong
AUM growth, YoY reduction in C/I ratio and continued decline in cost of funds
were key highlights of the quarter.
Disbursement growth of 33% YoY, the strongest in 13 quarters, led to AUM
growth of 5.6% QoQ/22.5% YoY in the quarter. We expect DEWH to maintain this
growth rate, given the large untapped opportunity and the sufficient capital it has
to support this growth.
Loan mix was largely unchanged, though there was a 70bp sequential increase in
the share of builder loans. We expect the share of builder loans to continue
increasing at this pace for the remainder of the year, post which it should remain
stable.
The liability mix was largely stable sequentially. Reduction in cost of funds
continues (12bp QoQ), albeit at a slower pace than in the past few quarters.
Opex grew 15% YoY to INR1.6b, resulting in 280bp reduction in the calculated C/I
ratio to 25.3%. We expect prudent cost rationalization to continue over the next
2-3 years. This would be the key driver for strong PAT growth over the medium
term, in our view.
Asset quality was stable. However, credit costs increased 84% YoY to INR830m.
Valuation and view:
DEWH continues capitalizing on its mortgage lending
expertise in an underpenetrated market. Its focuses on being a core mortgage
finance player, as evident from its divestment of non-core assets (such as the life
insurance business). Also, with management’s commitment toward lowering
operating cost, we believe the company has enough room to reduce its C/I ratio
by 200-300bp over the next few years. We believe its gradual transformation to a
core mortgage player with strong growth and healthy return ratios would result in
further re-rating. We upgrade FY18/19 EPS estimates by 2%/4% to factor in
stronger revenue growth.
Buy
with a TP of INR630 (2.0x FY19E BVPS).
n
Financials & Valuations (INR b)
Y/E March
2017 2018E
NII
15.1
19.3
PPP
16.2
21.2
Adj. PAT
9.3
11.8
EPS (INR)
29.6
37.7
EPS Gr. (%)
18.5
27.4
BV (INR)
252
282
RoAA (%)
1.2
1.2
RoE (%)
14.4
14.1
Payout (%)
15.7
17.4
Valuations
P/E (x)
15.5
12.1
P/BV (x)
1.8
1.6
P/ABV (x)
1.8
1.6
Div. Yield (%)
0.9
1.2
2019E
24.9
26.7
14.7
47.1
24.9
321
1.3
15.6
17.4
9.7
1.4
1.4
1.5
n
n
n
n
n
24 July 2017
16

RESULTS
FLASH
17 July 2017
Results Flash | Sector: Financials-Banks
J&K Bank
Neutral
BSE SENSEX
32,029
S&P CNX
9,915
CMP: INR84
n
TP: INR89
We will revisit our estimates
post earnings call/management
interaction.
Balance sheet clean up phase; PAT positive after 3 quarters
Conference Call Details
Date:
24 July 2017
Time:
03:30pm IST
Dial-in details:
+91-22-3960 0818
th
Financials & Valuations (INR b)
2018E 2019E
Y/E Mar
NII
27.1
30.3
OP
13.0
14.3
NP
2.1
4.3
EPS (INR)
4.0
8.2
EPS Gr. (%)
NA 106.3
BV/Sh. (INR)
113.8 120.0
RoE (%)
5.8
7.0
RoA (%)
0.4
0.4
P/E (x)
21.2
10.3
P/BV (x)
0.7
0.7
2020E
34.5
16.5
6.0
11.5
40.6
128.7
9.2
0.5
7.3
0.7
JKBK reported PAT of INR302m in 1QFY18 (+32% YoY on a low base), after 3
consecutive quarters of losses. Adjusted for DTAs recognized against higher
than required provisions, PAT came in at INR2.7b.
n
Strong recoveries and upgrades at INR1.9b helped partly offset slippages of
INR5.1b (22% decline from INR6.5b in 4Q). Gross and net slippage ratio stood
at 4.1%/2.5% vs 5.2%/2.8% in 4Q. Focus on increasing PCR led to 7% sequential
decline in NNPAs (4.3% v/s 4.6% in 4Q) with increase in reported PCR to
70.26% from 66.9% in 4Q. GNPA stood at 10.6%. Std. restructured loans stood
at INR55.5b (11% of loans). S4A book stood at INR2.45b at the end of the
quarter.
n
NII grew ~13% YoY (+9% QoQ) led sharp improvement in NIMs to 3.7% (+20bp
QoQ, +32bp YoY) even as loan book was flat YoY and declined 2% QOQ. NIM
improved on the back of 37bp/36bp QoQ/YoY increase in spreads.
n
Total income growth of 6%/10% QoQ/YoY was partially offset by opex growth
of 13% YoY (-10% QoQ on a one-off high base), resulting in 33%/5% QoQ/YoY
PPoP growth.
n
Other highlights:
(1)
Loan growth was flat YoY (2% decline QoQ; share of J&K
State loans stood at ~51% v/s 50% in FY17,
(2)
CASA ratio stood at 50.9% (-
80bp QoQ).
(3)
Tier 1/CAR stood at 9.16%/11.1%
Valuation and view:
While we like the management’s focus on clean-up of balance
sheet, continued high stress additions and high proportion of restructured book
remain a cause for concern. Recoveries/resolutions in non J&K State corporate
portfolio (19% NPA) will be a significant trigger for the bank. We will revise our
estimates post concall.
FY17
2Q
16,857
10,443
6,414
-7.6
1,309
7,723
3,967
3,756
NA
9,921
-6,165
-141
0
-6,024
NA
3.37
4.0
11.9
45.1
68.0
56.8
11.3
FY18
2Q
3Q
16,878
17,283
10,359
10,773
6,519
6,510
1.6
11.7
1,312
1,276
7,831
7,786
4,752
4,865
3,079
2,921
-18.0
-0.3
2,064
2,139
1,015
782
345
266
0
0
670
516
NA
NA
6.6
7.3
67.6
57.4
10.6
16.9
5.6
67.3
58.8
10.4
FY17
4Q
17,156
10,236
6,921
5.7
1,398
8,318
4,953
3,365
21.8
2,491
874
297
0
577
NANA
12.0
12.0
68.7
59.7
10.0
66,858
41,739
25,119
-7.3
4,929
30,048
17,105
12,943
-22.4
28,003
-15,060
1,263
-16,323
3.3
-0.8
4.4
51.7
68.7
60.0
11.2
(INR M)
FY18
68,121
41,049
27,072
7.8
5,087
32,159
19,109
13,050
0.8
9,480
3,570
-877
2,382
2,065
NA
3.7
12.0
12.0
51.9
68.7
59.7
10.0
Quarterly Performance
Y/E March
Interest Income
Interest Expense
Net Interest Income
% Change (YoY)
Other Income
Net Income
Operating Expenses
Operating Profit
% Change (YoY)
Other Provisions
Profit before Tax
Tax Provisions
Extraordinary items
Net Profit
% Change (YoY)
Operating Parameters
NIM (Reported, %)
Loan Growth (%)
Deposit Growth (%)
CASA Ratio (%)
CD ratio (%)
Asset Quality
Gross NPA (INR b)
Gross NPA (%)
1Q
16,724
10,398
6,326
-9.0
1,167
7,493
4,000
3,493
-23.8
3,137
356
127
0
229
-85.6
3.38
12.9
10.8
43.1
70.8
47.1
9.3
3Q
16,495
10,666
5,830
-13.5
1,207
7,037
4,106
2,930
-25.1
7,263
-4,332
653
0
-4,986
NA
2.99
-3.5
15.3
47.4
60.8
57.1
11.8
4Q
16,782
10,232
6,550
1.2
1,246
7,795
5,032
2,764
-27.4
7,683
-4,919
624
0
-5,543
NA
3.50
-0.8
4.4
51.7
68.7
60.0
11.2
1Q
16,803
9,681
7,122
12.6
1,102
8,224
4,539
3,685
5.5
2,787
898
-1,785
2,382
302
31.9
3.70
-0.2
4.0
50.9
67.9
56.4
10.8
24 July 2017
17

Persistent System
BSE SENSEX
32,029
Bloomberg
Equity Shares (m)
M.Cap.(INRb)/(USDb)
52-Week Range (INR)
1, 6, 12 Rel. Per (%)
Avg Val, INRm
Free float (%)
S&P CNX
9,915
PSYS IN
80
52.5 / 0.8
710 / 501
-6/-14/-12
87
69.3
20 July 2017
Q1FY18 Results Update | Sector: Technology
CMP: INR657
n
TP: INR750(+14%)
Buy
A stern test of our margin recovery thesis
Financials & Valuations (INR b)
2017 2018E 2019E
Y/E Mar
28.8
31.1
35.0
Net Sales
4.7
5.1
5.9
EBITDA
3.1
3.5
4.2
PAT
37.7
43.3
52.0
EPS (INR)
1.4
15.0
20.0
Gr. (%)
244.5 254.1 264.3
BV/Sh (INR)
17.0
17.9
20.7
RoE (%)
16.7
16.0
17.1
RoCE (%)
17.1
14.8
12.4
P/E (x)
2.6
2.5
2.4
P/BV (x)
n
n
n
Estimate change
TP change
Rating change
n
1QFY18 was all about margin contraction:
Persistent Systems’ (PSYS) 1QFY18
revenue of USD113m (+3.6% QoQ, in line) lost relevance to sharp 360bp QoQ
contraction in EBITDA margin to 14.3%, significantly below our estimate of
16.5%. This 220bp miss naturally challenged our thesis of margin recovery-led
earnings growth in the company. Net income grew 3.2% QoQ to INR751m, in
line with our estimate of INR758m. This was facilitated by forex gains of
INR183m.
A plethora of factors led to margin disappointment:
The following factors
contributed to 1QFY18 margin contraction: [1] currency (120bp), [2] onsite
revenue mix shift and investments in new partnerships (90bp), [3] lower
offshore utilization (40bp), [4] visa and costs related to Parx acquisition (70bp),
[5] upfront investment in sales team (30bp) and [5] change in bad debt
provisions (40bp). Part offset came from healthy growth in IT Services revenue.
Services segment took over from Digital:
Onsite mix shift was a contributor to
revenue growth during the quarter, as volume growth was 1.8% QoQ. High
flying Digital segment declined 1.3% QoQ, whereas Services saw growth of 5%
QoQ during the quarter. PSYS cited the brakes on Digital as quarterly
aberration and should resume. Alliance segment was strong (+9% QoQ),
whereas Accelerite dropped from USD10.5m to USD9.4m.
Focus on shifting to solutions:
PSYS continues to strive to break away from the
linearity of revenue growth and headcount additions, even beyond its IP-led
revenues segment. This is reflected in its technical headcount addition of 0.5%
YoY and utilization improvement of 1.7%, as against 9.2% YoY growth in linear
revenues and 8% growth in overall revenues.
Valuation and view:
While 1Q margin miss was a definite dent, we note that a
large part of the same was driven by higher investments in sales, and some of
the GPM impacts (visa and acquisition costs, utilization) are addressable in the
near term. PSYS remains intent on driving growth through solutions, which will
help margins and maintain our thesis of bottoming out of profitability in FY17 –
difference being that we expect expansion in FY19 and FY18 margins to remain
flat YoY. We expect FY17-19 USD revenue/earnings CAGR of 11/15%. Our price
target of INR750 discounts forward earnings by 14x. Maintain
Buy.
3Q
110.0
4.6
7,455
5.9
25.9
36.3
20.4
1,187
15.9
10.7
318
26.7
819
11.4
5.7
10.2
9,229
78.9
15.8
28.4
4Q
109.0
-0.9
7,271
-2.5
7.4
36.1
18.2
1,302
17.9
12.5
143
19.9
842
2.8
4.2
9.1
9,460
77.8
15.7
27.6
1Q
113.0
3.6
7,280
0.1
3.7
34.3
20.0
1,044
14.3
9.0
368
26.3
751
-10.8
2.5
9.4
9,401
77.2
27.2
FY18E
2Q
3Q
117.9
123.9
4.3
5.1
7,660
8,115
5.2
5.9
8.8
8.8
35.4
37.4
19.2
19.2
1,218
1,461
15.9
18.0
10.6
13.1
234
299
25.0
25.0
787
1,019
4.8
29.5
7.0
24.4
9.8
12.7
9,537
9,593
78.0
78.5
26.7
28.0
FY17
4Q
121.9
-1.6
8,044
-0.9
10.6
34.9
18.3
1,330
16.5
11.5
287
25.0
910
-10.6
8.1
11.4
9,724
78.5
26.4
429
22.0
28,784
24.5
35.7
19.5
4,653
16.2
11.0
958
24.1
3,129
5.2
37.7
9,460
76.5
28.0
FY18E
477
11.1
31,099
8.0
35.5
19.3
5,052
16.2
11.1
1,188
25.3
3,467
10.8
43.3
9,724
77.7
27.1
Est. Var. (% /
1QFY18
bp)
112.7
0.2
3.4
25bp
7,269
0.2
0.0
15bp
3.6
16bp
35.2
-89bp
18.7
126bp
1,198
-12.9
16.5
-215bp
11.1 -213bp
206
78.9
25.0
758
-1.0
-9.9
nm
3.5
nm
9.5
9,741
-3.5
78.5 -130bp
28.4
-118bp
Quarterly Performance (Consolidated)
Y/E March
(Consolidated)
Revenue (USD m)
QoQ (%)
Revenue (INR m)
QoQ (%)
YoY (%)
GPM (%)
SGA (%)
EBITDA
EBITDA Margin (%)
EBIT Ma rgi n (%)
Other i ncome
ETR (%)
PAT
QoQ (%)
YoY (%)
EPS (INR)
Headcount
Uti l excl . tra i nees (%)
Attri ti on (%)
IP rev. proporti on(%)
1Q
104.8
4.3
7,018
3.6
40.2
34.7
19.6
1,058
15.1
10.2
253
24.3
733
-9.3
9.0
9.2
9,389
75.3
16.7
28.2
FY17
2Q
105.2
0.4
7,040
0.3
29.7
35.5
19.8
1,108
15.7
10.5
243
25.3
735
0.3
2.3
9.2
9,305
74.2
15.9
27.8
24 July 2017
18

Zensar Technologies
BSE SENSEX
32,029
Bloomberg
Equity Shares (m)
M.Cap.(INRb)/(USDb)
52-Week Range (INR)
1, 6, 12 Rel. Per (%)
Avg Val, INRm
Free float (%)
S&P CNX
9,915
ZENT IN
45
37.6 / 0.6
1136 / 790
-7/-28/-34
33
51.3
20 July 2017
Q1FY18 Results Update | Sector: Technology
CMP: INR830
n
TP: INR950(+15%)
Buy
Legacy pressures offset Digital pivot
Revenue growth led by Keystone:
ZENT’s 1QFY18 revenue grew 2.5% QoQ CC,
as against our estimate of +5.3%. The quarter also included incremental
revenue of ~USD5m from the integration of Keystone, implying organic
revenue decline of ~2%. Pressure in the organic business was led by ramp-
down in Oracle ATG implementations, delays in the Manufacturing vertical
deal ramp-ups, and conscious rationalizing of the RoW portfolio.
Margin uptick capped despite exercise of levers:
EBITDA margin expanded
230bp QoQ to 10.2% post a drastic 600bp contraction seen in the previous
quarter. Full recovery was not seen in margins, despite the presence of several
one-off costs in the previous quarter, improved utilization (+400bp) and higher
offshoring (+300bp). Led by the overall operational miss, PAT at INR472m was
down 36.3% YoY, compared to our estimate of INR558m (-26.8% YoY).
Sluggishness to span another couple of quarters:
In the near term, we expect
continued moderate growth led by active pruning of long-tail accounts, project
delays and pressures emerging out of the Oracle ATG ecosystem. On the other
hand, impending wage hike, continued investments in S&M and capability
building, and restructuring in the MVS business will keep profitability
expansion in check.
Valuation view:
ZENT’s Digital pivot (36.3% of revenues) contrasts issues in
other parts of the portfolio (MVS, Manufacturing vertical ex hi tech), leading us
to cut revenue estimates for FY18/19E by 4-5%. Additionally, investments and
restructuring expenses drive EPS cut of 16/6%. Our thesis of clean-up
completion by FY17 took a hit due to pressure in Oracle ATG from ORCL’s cloud
push and the overhaul of front-end in the US. Improvement in ZENT’s
performance will now likely commence only in FY19, which will also limit
triggers to valuations. We maintain
Buy
with a revised price target of INR950—
discounting forward EPS by 13x.
4Q
112
-4.9
7,433
-0.4
27.7
19.9
585
7.9
6.2
-228
45.5
104
-87.0
-85.2
2.3
8,524
79.2
34.5
1Q
114
2.2
7,367
-2.5
27.6
17.4
748
10.2
7.7
203
32.0
472
354.7
-36.3
10.5
8,567
83.2
37.5
FY18E
2Q
117
2.6
7,626
-1.0
26.9
16.0
831
10.9
8.6
166
29.0
536
13.7
-23.8
11.9
8,642
83.0
37.0
FY17
3Q
120
2.2
7,854
-0.1
27.8
15.0
1,003
12.8
10.5
164
29.0
658
22.7
-17.8
14.6
8,892
82.0
36.5
4Q
122
2.0
8,071
8.6
27.9
15.0
1,040
12.9
10.6
154
29.0
676
2.7
551.7
15.0
8,942
81.0
35.8
459
1.4
30,556
3.1
29.3
16.8
3,819
12.5
10.9
241
31.6
2,349
-24.1
52.1
8,524
79.7
33.2
FY18E
474
3.2
30,918
1.2
27.5
15.8
3,622
11.7
9.4
686
29.6
2,343
-0.3
51.9
8,942
82.3
36.7
Est.
1QFY18 Var. (% / bp)
118
-3.4
5.9
-362bp
7,610
-3.2
-0.2
-230bp
28.8
-118bp
17.0
44bp
896
-16.5
11.8
-162bp
10.4
-267bp
28
635.8
29.0
558
-15.5
157.2
19747bp
-26.8
-948bp
12.4
8,724
-1.8
81.0
220bp
34.2
326bp
Financials & Valuations (INR b)
Y/E Mar
2017 2018E
Net Sales
30.6
30.9
EBITDA
3.8
3.6
PAT
2.3
2.3
EPS (INR)
52.1
51.9
Gr. (%)
-23.7
-0.3
BV/Sh (INR)
325.9 364.8
RoE (%)
17.2
15.0
RoCE (%)
23.2
17.7
P/E (x)
15.9
16.0
P/BV (x)
2.5
2.3
n
2019E
35.5
4.8
3.2
70.0
34.9
418.3
17.9
21.8
11.8
2.0
n
Estimate change
TP change
Rating change
n
Quarterly Performance (Consolidated)
Y/E March
Revenue (USD m)
QoQ (%)
Revenue (INR m)
YoY (%)
GPM (%)
SGA (%)
EBITDA
EBITDA Margin (%)
EBIT Margin (%)
Other income
ETR (%)
PAT
QoQ (%)
YoY (%)
EPS (INR)
Headcount
Utilization (%)
Offshore rev. (%)
1Q
114
3.1
7,554
7.2
29.1
15.4
1,037
13.7
12.3
198
32.6
741
5.4
-2.8
16.4
8,238
79.8
31.2
FY17
2Q
116
1.8
7,703
1.8
30.1
15.6
1,111
14.4
12.8
70
29.6
704
-5.0
-22.9
15.6
8,316
80.1
33.8
3Q
118
1.3
7,865
3.9
30.2
16.4
1,085
13.8
12.3
201
30.2
800
13.7
11.9
17.7
8,564
79.5
33.5
24 July 2017
19

June 2017 Results Preview | Sector: Cement
Ambuja Cements
Bloomberg
Equity Shares (m)
M. Cap. (INR b)/(USD b)
52-Week Range (INR)
1,6,12 Rel Perf. (%)
ACEM IN
1985.3
494 / 8
282 / 191
4 / 0 / -16
CMP: INR249
TP: INR291 (+17%)
Buy
Financial Snapshot (INR Billion)
Y/E DEC
2016 2017E 2018E 2019E
Sales
EBITDA
NP
Adj. EPS (INR)
EPS Gr. (%)
BV/Sh. (INR)
RoE (%)
RoCE (%)
Payout (%)
Valuations
P/E (x)
P/BV (x)
EV/EBITDA (x)
EV/Ton (USD)
35.5
1.8
20.8
166
23.9
1.7
17.5
157
21.2
1.6
14.4
145
17.2
1.6
11.4
133
91.6
15.8
9.7
4.9
-10.6
96.4
5.1
6.9
29.6
101.7
17.7
14.4
7.3
48.5
102.0
7.3
7.5
22.6
113.7
20.9
16.3
8.2
12.8
107.9
7.8
8.1
28.6
128.3
26.6
20.1
10.1
23.6
111.9
9.2
9.5
60.2
n
Dispatches in 2QCY17 are estimated to increase 5% YoY to 6.15mt
led by healthy growth both in North and West markets which
constitute ~80% of its focus markets. Average realizations are
expected to increase by 10% QoQ to INR4,633/ton due to strong
pricing uptick in western region. Revenue is estimated at INR28.5b
(+12% YoY).
n
EBITDA margin is expected to be 21% (+6.5pp QoQ, -2.0pp YoY).
EBITDA/ton is estimated at ~INR 968 (+INR362 QoQ, -INR26 YoY).
n
Adjusted PAT is estimated to increase 6% YoY to INR4.2b due to
weak profitability.
n
The stock trades at P/E of 25x on CY18E earnings+, 14x CY18E
EV/EBITDA and CY18E EV/ton of USD134. Maintain Buy.
Key issues to watch out for:
Ø
Volume growth recovery and outlook.
Ø
Cement pricing outlook and sustainability.
Ø
Cost curve trend in CY17.
Quarterly Performance
Y/E December
Sales Volume (m ton)*
YoY Change (%)
Realization (INR/ton)
YoY Change (%)
QoQ Change (%)
Net Sales
YoY Change (%)
EBITDA
Margins (%)
Depreciation
Interest
Other Income
PBT before EO Item
Rate (%)
Reported Profit
Adj PAT
YoY Change (%)
1Q
5.97
9.9
4,032
-9.7
-6.2
24,060
-0.8
4,255
17.7
3,830
188
1,303
1,541
69.4
535
471
-85.2
CY16
2Q
5.85
-1.7
4,344
3.7
7.7
25,412
1.9
5,813
22.9
1,511
205
1,368
5,465
26.9
3,995
3,995
76.5
3Q
4.58
-6.5
4,376
2.3
0.7
20,043
-4.3
2,760
13.8
1,595
192
2,503
3,477
20.3
2,770
2,770
80.4
4Q
5.09
-7.1
4,316
0.4
-1.4
21,967
-6.8
2,947
13.4
1,563
136
755
2,003
14.3
1,627
1,717
18.1
1Q
6.02
0.9
4,208
4.4
-2.5
25,334
5.3
3,651
14.4
1,460
377
1,310
3,124
21.1
2,465
2,465
423.7
CY17
2QE
6.15
5.1
4,633
6.7
10.1
28,495
12.1
5,953
20.9
1,470
150
1,300
5,633
25.0
4,225
4,225
5.7
3Q
5.10
11.4
4,533
3.6
-2.2
23,120
15.4
3,743
16.2
1,500
150
2,700
4,793
24.0
3,643
3,643
31.5
4QE
5.55
9.0
4,466
3.5
-1.5
24,784
12.8
4,378
17.7
1,464
-88
1,690
4,693
13.1
4,078
4,078
137.5
(INR Million)
CY16
21.49
-1.2
4,263
-1.0
91,604
7.7
15,755
17.2
8,501
715
6,837
13,376
27.5
9,703
9,703
14.4
CY17E
22.82
6.2
4,458
4.6
101,733
5.2
17,725
17.4
5,894
589
7,000
18,243
21.0
14,412
14,412
48.5
24 July 2017
20

June 2017 Results Preview | Sector: Telecom
Bharti Infratel
Bloomberg
Equity Shares (m)
M. Cap. (INR b)/(USD b)
52-Week Range (INR)
1,6,12 Rel Perf. (%)
BHIN IN
1896.7
761 / 12
413 / 283
8 / -3 / -2
n
CMP: INR401
n
TP: INR440 (+10%)
Buy
We expect consolidated revenue to grow 11.8% YoY (and 1.9%
QoQ) to INR35.9b.
Consolidated rental revenue is likely to reach INR22.4b, up 2.7%
QoQ and 9% YoY. We expect energy and other reimbursements to
grow 0.6% QoQ.
We expect consolidated EBITDA to decline 3% QoQ to INR15.3b.
EBITDA margin is likely to drop 200bp QoQ to 42.7% despite 3.1%
rental EBITDA growth owing to a seasonal fall of 62% in energy
EBITDA.
We expect PAT to grow 27% QoQ to INR7.8b.
Bharti Infratel trades at EV/EBITDA of 10.5x FY18E and 9.2x
FY18E. Maintain Buy.
Financial Snapshot (INR Billion)
Y/E March
2017 2018E 2019E 2020E
Net Sales
EBITDA
Adj. NP
AdjEPS INR
Gr. (%)
BV/Sh (INR)
RoE (%)
RoCE (%)
Payout (%)
Valuations
P/E (x)
P/BV (x)
EV/EBITDAx
Div. Yld (%)
27.2
4.8
12.6
4.0
23.5
4.2
11.1
1.0
20.9
3.6
9.8
1.0
19.6
3.2
8.8
1.0
134.2
59.0
27.5
14.9
25.3
83.7
16.2
13.2
125.0
148.8
64.3
31.7
17.2
15.6
96.3
19.1
14.2
27.0
161.7
69.1
35.8
19.3
12.7
111.0
18.7
13.6
24.0
174.2
74.1
39.1
20.6
6.7
124.3
17.7
13.1
21.9
n
n
n
Key monitorables
Ø
Consolidated co-location additions (we expect a steady ~5,500 in line
with the high tenancy addition in 2HFY17).
Ø
Consolidated revenue per sharing operator (expected to remain flat
due to tenancy renewal risks).
Quarterly Performance
Y/E March
(Consolidated)
Revenue from operations
YoY Change (%)
Total Expenditure
EBITDA
Margins (%)
Depreciation
Interest
Other Income
PBT
Tax
Rate (%)
Reported PAT
Adj PAT
YoY Change (%)
Margins (%)
1Q
32,106
6.9
18,159
13,947
43.4
5,648
-1,281
352
9,932
2,369
23.9
7,563
7,563
71.0
23.6
FY17
2Q
3Q
32,919 34,007
8.3
9.5
18,421 19,206
14,498 14,801
44.0
43.5
5,629
5,664
-2,472
-947
333
357
11,674 10,441
3,936
4,237
33.7
40.6
7,738
6,204
7,738
6,204
30.8
25.3
23.5
18.2
4Q
35,204
10.6
19,481
15,723
44.7
5,684
287
414
10,166
4,200
41.3
5,966
5,966
-17.0
16.9
1QE
35,886
11.8
20,569
15,317
42.7
5,814
-1,981
0
11,484
3,905
34.0
7,580
7,580
0.2
21.1
FY18
2QE
3QE
36,796 37,628
11.8
10.6
21,023 21,391
15,774 16,238
42.9
43.2
5,957
6,108
-1,981
-1,981
0
0
11,797 12,111
4,011
4,118
34.0
34.0
7,786
7,993
7,786
7,993
0.6
28.8
21.2
21.2
FY16
(INR Million)
FY17
FY18E
4QE
38,464 123,314 134,237 148,774
9.3
5.7
8.9
10.8
21,486 69,205 75,268 84,469
16,978 54,109 58,969 64,306
44.1
43.9
43.9
43.2
6,248 22,235 22,626 24,128
-1,981
-1,847
-4,414
-7,925
0
2,048
1,455
0
12,711 35,769 42,212 48,104
4,322 13,293 14,742 16,355
34.0
37.2
34.9
34.0
8,389 22,476 27,470 31,748
8,389 22,476 27,470 31,748
40.6
12.8
22.2
15.6
21.8
18.2
20.5
21.3
24 July 2017
21

June 2017 Results Preview | Sector: Others
Delta Corp
Bloomberg
Equity Shares (m)
M. Cap. (INR b)/(USD b)
52-Week Range (INR)
1,6,12 Rel Perf. (%)
DELTA IN
231.6
36 / 1
218 / 89
-1 / 15 / 45
n
CMP: INR155
n
TP: INR215 (+38%)
Buy
We expect revenue to grow 8.6% YoY to INR1,180m, driven by the
casino business in Goa and Sikkim.
EBITDA margin is likely to remain flat at 38.1%, and EBITDA is
expected to grow 8% YoY to INR450m.
Net profit is likely to increase 50% YoY to INR255m. Buy.
Financial Snapshot (INR Billion)
Y/E March
2017 2018E 2019E 2020E
Sales
EBITDA
Adj. PAT
Adj. EPS (INR)
EPS Gr. (%)
BV/Sh.(INR)
RoE (%)
RoCE (%)
Payout (%)
Valuations
P/E (x)
P/BV (x)
EV/EBITDA (x)
Div. Yield (%)
50.8
3.9
24.1
0.2
27.3
2.6
15.2
0.8
21.7
2.4
11.6
0.8
18.2
2.2
9.0
0.9
4.5
1.6
0.7
3.1
125.5
39.7
8.1
9.6
13.2
6.4
2.4
1.5
5.7
86.0
59.3
12.1
12.6
25.4
7.8
3.1
1.9
7.2
26.0
64.9
11.5
11.8
21.9
9.5
3.8
2.3
8.5
19.3
71.7
12.5
19.1
19.7
n
Key issues to watch for
Ø
Increase in visitations in Goa and ramp-up of Sikkim casino.
Ø
Expansion plans and integration of online business.
Quarterly Performance Consolidated
Y/E March
Net Sales
YoY Change (%)
Total Expenditure
EBITDA
Margins (%)
Depreciation
Interest
Other Income
PBT before EO expense
Extra-Ord expense
PBT
Tax
Rate (%)
Minority Interest & P&L of Asso. Cos.
Reported PAT
Adj PAT
YoY Change (%)
Margins (%)
E: MOSL Estimates
1Q
1,087
34.6
671
415
38.2
91
87
9
246
-46
292
85
29.2
4
202
170
2,539.9
15.6
FY17
2Q
3Q
1,343
1,036
43.8
3.4
776
723
567
313
42.2
30.2
93
89
87
82
11
11
399
152
2
5
397
91
22.9
-16
322
323
494.1
24.1
147
40
27.2
6
101
105
-9.4
10.1
4Q
1,081
5.3
737
344
31.8
87
94
19
182
0
181
64
35.4
3
114
114
-29.3
10.5
1QE
1,180
8.6
730
450
38.1
94
37
26
344
0
344
89
26.0
0
255
255
50.1
21.6
FY18
2QE
3QE
1,630
1,745
21.4
68.5
941
1,138
689
607
42.3
34.8
105
112
33
30
36
43
587
508
0
0
587
153
26.0
0
435
435
34.4
26.7
508
122
24.0
0
386
386
269.3
22.1
4QE
1,844
70.5
1,191
653
35.4
112
30
76
587
0
587
141
24.0
0
446
446
291.7
24.2
(INR Million)
FY17
FY18E
4,547
21.2
2,907
1,640
36.1
361
350
49
978
42
936
280
29.9
2
654
683
118.8
15.0
6,399
40.7
3,999
2,400
37.5
423
130
180
2,027
0
2,027
507
25.0
3
1,518
1,518
122.1
23.7
24 July 2017
22

July 2017 Results Preview | Sector: Financials - Banks
HDFC Bank
Bloomberg
Equity Shares (m)
M. Cap. (INR b)/(USD b)
52-Week Range (INR)
1,6,12 Rel Perf. (%)
HDFCB IN
2562.6
4233 / 65
1716 / 1159
1 / 22 / 27
CMP: INR1,652
n
n
TP: INR1,885 (+15%)
Buy
Financial Snapshot (INR b)
Y/E MARCH
2017 2018E 2019E 2020E
NII
331.4 388.6 461.7 554.4
OP
257.3 300.5 358.4 432.2
NP
145.5 172.0 203.4 240.9
NIM (%)
4.7
4.5
4.4
4.4
EPS (INR)
56.8
67.1
79.4
94.0
EPS Gr. (%)
16.7
18.2
18.3
18.4
BV/Sh. (INR)
349 387.2 448.1 520.2
ABV/Sh. (INR)
344 381.0 440.0 509.3
RoE (%)
17.9
18.2
19.0
19.4
RoA (%)
1.9
1.8
1.8
1.7
Payout (%)
23.4
23.4
23.4
23.4
Valuations
P/E(X)
29.1
24.6
20.8
17.6
P/BV (X)
4.7
4.3
3.7
3.2
P/ABV (X)
4.8
4.3
3.8
3.2
Div. Yield (%)
0.7
0.8
1.0
1.1
n
n
n
n
Loan growth will be strong at 21% YoY (at least ~2x system growth).
Deposit growth will be healthy at ~18% YoY, led by CASA inflows.
COF decline would help to negate the impact of declining yields
environment, and we expect HDFCB to report only a marginal
contraction in margins of ~9bp and report strong NIM of 4.7%. NII is
expected to grow at 19% YoY.
Other income is expected to moderate to ~12% YoY, factoring in
lower trading gains. Fee income is expected to remain healthy. Tie-
up with new banca partners will drive fee income growth.
Opex growth would be lower than total income growth at ~14%
YoY, aided by strong digital initiatives of the bank and the focus on
cutting excess flab (headcount reduced by ~10k in 2HFY17).
Healthy PPoP growth would lead to 19% YoY PAT growth, largely in
line with 20% growth trend exhibited by the bank in the last few
years. Asset quality is expected to remain stable with GNPA at ~1.1.
HDFCB trades at 3.7x FY19E BV and 20.8x FY19E EPS. Comfort on
earnings (~18% CAGR over FY17-20) remains high. Maintain Buy.
Key issues to watch for
Ø
Performance in retail loan/SME portfolio, especially in CV/CE.
Ø
Trends in digital banking/payments and various initiatives; overall B/S
growth outlook and economic recovery.
uarterly Performance
Net Interest Income
% Change (Y-o-Y)
Other Income
Net Income
Operating Expenses
Operating Profit
% Change (Y-o-Y)
Other Provisions
Profit before Tax
Tax Provisions
Net Profit
% Change (Y-o-Y)
Operating Parameters
NIM (Cal, %)#
4.7
4.5
4.6
4.8
Deposit Growth (%)
18.5
16.7
21.1
17.8
Loan Growth (%)
23.2
18.1
13.4
19.4
Tax Rate (%)
34.6
34.5
34.4
33.7
Asset Quality
Gross NPA (INR B)
49.2
50.7
52.3
58.9
Gross NPA (%)
1.0
1.0
1.1
1.1
E: MOSL Estimates; * Reported on total assets; # Cal. on interest earning assets
1Q
77,814
21.8
28,066
105,881
47,689
58,192
20.0
8,667
49,525
17,136
32,389
20.2
FY17
2Q
3Q
79,936
83,091
19.6
17.6
29,010
31,427
108,945 114,518
48,700
48,425
60,246
66,093
19.5
15.2
7,490
7,158
52,756
58,935
18,202
20,281
34,553
38,653
20.4
15.1
4Q
90,551
21.5
34,463
125,014
52,220
72,794
26.9
12,618
60,176
20,275
39,901
18.3
1QE
92,916
19.4
31,491
124,407
54,478
69,929
20.2
12,200
57,729
19,339
38,389
18.5
4.7
17.8
21.4
33.5
64.4
1.1
FY18E
2QE
3QE
94,860
97,711
18.7
17.6
33,208
35,275
128,068 132,986
56,373
56,358
71,695
76,628
19.0
15.9
10,200
8,000
61,495
68,628
20,601
22,990
40,894
45,637
18.4
18.1
4.6
18.8
23.6
33.5
70.0
1.1
4.5
16.8
30.9
33.5
75.6
1.2
4QE
103,090
13.8
40,492
143,582
61,349
82,233
13.0
11,414
70,818
23,724
47,094
18.0
4.5
22.0
22.0
33.5
81.1
1.2
(INR Million)
FY17
331,392
20.1
122,965
454,357
197,033
257,324
20.5
35,933
221,391
75,894
145,497
18.3
4.6
17.8
19.4
34.3
58.9
1.1
FY18
388,578
17.3
140,465
529,042
228,559
300,484
16.8
41,814
258,669
86,654
172,015
18.2
4.6
22.0
22.0
33.5
81.1
1.2
24 July 2017
23

June 2017 Results Preview | Sector: Financials
Indiabulls Housing
Bloomberg
Equity Shares (m)
M. Cap. (INR b)/(USD b)
52-Week Range (INR)
1,6,12 Rel Perf. (%)
IHFL IN
421.3
443 / 7
1187 / 616
-7 / 46 / 38
n
n
n
CMP: INR1,050 TP: INR1,300 (+24%)
n
Buy
We expect strong loan growth to continue, driven by retail home
loans. We estimate 2% QoQ and 32% YoY loan growth.
Total income should grow 35% YoY to INR16b.
Expenses (including provisions) are likely to grow 39% YoY.
Asset quality is expected to remain stable. In 4QFY17, GNPAs were
at 0.85% and NNPAs at 0.36%.
PAT is likely to grow 37% YoY to INR8.6b during the quarter.
The stock trades at 3.2x FY18E and 2.8x FY19E BV. Maintain Buy.
Financial Snapshot (INR b)
Y/E March
2017 2018E 2019E 2020E
Net Fin inc
39.9 52.6 66.5 79.5
PPP
45.5 60.2 76.3 92.4
EPS (INR)
69.0 88.9 113.9 137.0
EPS Gr. (%)
24.0 28.8 28.1 20.3
BV/Sh. (INR)
288
325
372
429
RoA on AUM (%)
3.1
3.1
3.2
3.0
RoE (%)
25.5 29.0 32.7 34.2
Payout (%)
52.5 50.0 50.0 50.0
Valuations
P/E (x)
15.2 11.8
9.2
7.7
P/BV (x)
3.6
3.2
2.8
2.4
P/ABV (x)
3.6
3.2
2.8
2.4
Div. Yield (%)
3.4
4.2
5.4
6.5
n
n
Key issues to watch for
Ø
AUM growth trend and growth guidance post demonetization.
Ø
Movement in incremental spreads and margins, especially given
the sharp home loan rate cuts.
Ø
Asset quality trends in the corporate and loans against property
segments.
Quarterly Performance
Y/E March
Income from operations
Other Income
Total income
Y-o-Y Growth (%)
Interest expenses
Net Income
Y-o-Y Growth (%)
Operating Expenses
Profit before tax
Y-o-Y Growth (%)
Tax Provisions
Net Profit
Minority Int
Net Profit after MI
Y-o-Y Growth (%)
E: MOSL Estimates
1Q
23,720
2,255
25,975
28.3
14,109
11,866
33.9
3,116
8,750
26.4
2,401
6,349
-49
6,301
23.2
(INR Million)
FY17
2Q
25,098
3,651
28,749
28.0
16,279
12,470
24.6
3,258
9,212
24.3
2,352
6,861
-18
6,843
23.2
3Q
25,859
4,186
30,045
30.2
16,329
13,716
26.8
3,658
10,058
24.9
2,555
7,502
13
7,515
24.7
4Q
29,314
2,935
32,249
21.8
17,391
14,858
15.6
5,160
9,698
9.0
1,325
8,373
32
8,405
24.4
1QE
29,754
4,072
33,826
30.2
17,826
16,000
34.8
4,331
11,668
33.3
3,034
8,635
25
8,610
36.6
FY18E
2QE
30,349
4,072
34,421
19.7
18,271
16,149
29.5
4,458
11,691
26.9
3,040
8,651
25
8,626
26.1
3QE
31,866
4,072
35,938
19.6
19,002
16,936
23.5
4,354
12,582
25.1
3,271
9,310
25
9,285
23.6
4QE
35,508
4,072
39,580
22.7
19,740
19,840
33.5
5,033
14,808
52.7
3,850
10,958
25
10,933
30.1
FY17
103,990
13,027
117,017
26.8
64,108
52,910
24.4
15,192
37,718
20.5
8,633
29,085
-22
29,064
24.0
FY18E
127,477
16,288
143,764
22.9
74,839
68,925
30.3
18,176
50,749
34.5
13,195
37,554
100
37,454
28.9
24 July 2017
24

June 2017 Results Preview | Sector: Others
Info Edge
Bloomberg
Equity Shares (m)
M. Cap. (INR b)/(USD b)
52-Week Range (INR)
1,6,12 Rel Perf. (%)
INFOE IN
126.4
128 / 2
1127 / 752
12 / 1 / 6
CMP: INR1,038 TP: 1,050 (+1%)
n
n
n
Buy
Financial Snapshot (INR b)
Y/E March
2016 2017 2018E 2019E
Sales
EBITDA
PAT
EPS (INR)
EPS Gr. (%)
BV/Sh. (INR)
RoE (%)
RoCE (%)
Payout (%)
Valuation
P/E (x)
EV/EBITDA (x)
EV/Sales (x)
91.6
77.9
15.5
66.3
47.0
13.3
51.3
38.6
11.6
45.5
32.6
10.1
7.1
1.4
1.2
11.3
-17.2
8.1
8.1
42.9
8.0
2.3
2.0
15.7
38.2
10.2
10.2
22.8
9.2
2.8
2.5
20.3
29.2
11.9
11.9
26.4
10.5
3.2
2.8
22.9
12.8
n
n
12.3
12.3
31.2
n
143.6 162.7 177.6 193.4
We expect standalone revenue to grow 10.4% YoY to INR2.2b.
Recruitment segment (~75% of business) is estimated to grow
13.5% YoY to INR1.63b.
We estimate real estate portal, 99acres.com’s revenue at
INR279m (flat YoY), and matrimonial portal, Jeevansathi.com’s
revenue at INR158m (up 5% YoY).
Revenue growth in Naukri.com has been under pressure because
of a policy change with respect to the sales incentive structure;
we expect normalization in 1HFY18. 99acres.com continues to be
impacted by the slowdown in the real estate market and
uncertainty around RERA.
Our EBITDA margin estimate for the quarter stands at 29%
compared to 30.3% in the previous quarter, and 24.2% in 1QFY17.
Consequently, we expect PAT of INR587m (up 32.2% YoY).
Key issues to watch for
Ø
Impact of consolidation in the real estate segment, and outlook
on ad spends, given the state of competitive dynamics
Ø
Traction in the recruitment business from segments other than
IT
Ø
Commentary around monetization in Zomato.com
Standalone Quarterly Performance
Y/E March
Revenues
YoY (%)
Salary costs
Ad and Promotion costs
Other Expenses
Operating Profit
Margins (%)
Other Income
Depreciation
PBT bef. Extra-ordinary
Provision for Tax
ETR (%)
PAT bef. Minority
EOI
Adjusted PAT
YoY (%)
EPS (INR)
E: MOSL Estimates
1Q
1,976
13.1
963
258
277
478
24.2
243
60
661
217
32.9
444
0
444
54.9
3.6
FY17
2Q
2,100
20.6
915
221
269
695
33.1
248
62
881
254
28.8
627
174
801
136.0
5.1
3Q
1,861
7.3
938
184
268
471
25.3
250
63
658
187
28.4
471
0
471
116.7
3.9
4Q
2,084
8.0
936
217
300
632
30.3
113
56
689
320
46.5
369
-40
329
-15.6
2.7
1QE
2,182
10.4
997
251
301
633
29.0
252
59
826
239
29.0
587
0
587
32.2
4.9
FY18E
2QE
2,306
9.8
1,022
277
304
704
30.5
222
61
865
251
29.0
614
0
614
-23.3
5.1
3QE
2,329
25.1
1,046
279
307
697
29.9
230
63
863
250
29.0
613
0
613
30.0
5.1
4QE
2,432
16.7
1,070
292
319
750
30.9
238
65
923
268
29.0
655
0
655
99.3
5.4
(INR Million)
FY17
FY18E
8,021
12.6
3,752
881
1,114
2,275
28.4
855
241
2,889
978
33.9
1,911
134
2,045
65.7
15.4
9,249
15.3
4,135
1,099
1,231
2,783
30.1
942
248
3,477
1,008
29.0
2,469
0
2,469
20.7
20.5
24 July 2017
25

June 2017 Results Preview | Sector: Technology
L&T Infotech
Bloomberg
Equity Shares (m)
M. Cap. (INR b)/(USD b)
52-Week Range (INR)
1,6,12 Rel Perf. (%)
Financial Snapshot (INR b)
y/e march
2017 2018E
Sales
EBITDA
PAT
EPS (INR)
EPS Gr. (%)
BV/Sh.
(INR)
RoE (%)
RoCE (%)
Payout (%)
Valuation
P/E (x)
P/BV (x)
EV/EBITDA
(x)
Div Yld (%)
14.2
5.0
10.7
1.2
13.4
3.9
9.9
1.5
12.1
3.1
8.6
1.6
11.3
2.6
7.4
1.8
65.0
12.3
9.7
55.5
5.9
159.5
40.4
42.7
17.5
70.1
12.8
10.3
59.1
6.6
204.4
32.5
33.0
20.0
LTI IN
170.5
134 / 2
840 / 595
1/-4/-
n
n
CMP: INR790
n
TP: INR850 (8%)
Buy
2019E
78.3
14.2
11.4
65.1
10.0
253.9
28.4
30.6
20.0
2020E
86.2
15.6
12.2
69.8
7.3
306.9
24.9
28.2
20.0
n
n
n
LTI witnessed strong growth throughout FY17, led by sustained
ramp-up of deals. Even in 4QFY17, broad-based momentum led
to 2.4% QoQ CC growth.
Given the ramp-up schedule, and visibility lent by new deal wins,
revenue growth is expected to be strong 2QFY18 onwards.
However, 1Q is expected to be moderated, with CC growth of
1.4% QoQ. Cross-currency tailwind of 80bp is expected to lead to
USD revenue growth of 2.2% QoQ.
We expect EBITDA margin to decline by 160bp QoQ to 17.4%,
given the increased S&M investments, INR appreciation and visa
expenses.
Our PAT estimate for the quarter is INR2.4b, which implies 5.5%
QoQ decline, largely led by lower margins.
The stock trades at 13.4x FY18E and 12.1x FY19E earnings. Buy.
Key issues to watch for
Ø
Deal wins and ramp-up schedule for FY18.
Ø
Margin trajectory, going forward, given the increased
investments.
Ø
Growth in Digital.
Quarterly Performance
Y/E March
Revenue (USD m)
QoQ (%)
Revenue (INR m)
YoY (%)
GPM (%)
SGA (%)
EBITDA
EBITDA Margin (%)
EBIT Margin (%)
Other income
ETR (%)
PAT
QoQ (%)
YoY (%)
EPS (INR)
Headcount
Util incl. trainees (%)
Attrition (%)
Offshore rev. (%)
E: MOSL Estimates
1Q
231
0.6
15,550
16.6
35.3
15.7
3,050
19.6
16.9
372
21.2
2,359
3.2
35.1
13.5
19,292
77.4
19.5
51.9
FY17
2Q
3Q
240
245
3.7
2.3
16,020
16,667
9.1
12.1
35.4
34.3
16.4
16.2
3,044
3,020
19.0
18.1
16.1
15.3
365
597
21.0
21.2
2,326
2,481
-1.4
6.7
21.3
10.5
13.3
14.2
21,074
20,605
78.7
78.1
18.5
18.1
51.2
52.3
4Q
254
3.7
16,772
7.7
35.8
16.8
3,190
19.0
16.5
503
22.3
2,547
2.7
11.4
14.6
21,023
78.3
16.9
51.3
1QE
260
2.2
16,735
7.6
34.7
17.3
2,912
17.4
14.3
689
22.0
2,406
-5.5
2.0
13.7
21,443
76.5
47.7
FY18E
2QE
266
2.4
17,277
7.8
34.2
16.5
3,058
17.7
14.7
748
22.0
2,566
6.6
10.3
14.7
21,763
77.5
48.2
FY17
3QE
272
2.4
17,829
7.0
35.1
16.5
3,317
18.6
15.7
598
22.0
2,651
3.3
6.8
15.1
22,033
78.0
47.7
4QE
276
1.4
18,216
8.6
35.5
16.5
3,465
19.0
16.2
547
22.0
2,727
2.9
7.1
15.6
22,253
78.5
47.9
970
9.3
65,009
11.2
35.2
16.3
12,303
18.9
16.2
1,837
21.4
9,711
5.9
55.5
21,023
7807.5
48.3
(INR m)
FY18E
1,074
10.7
70,057
7.8
34.9
16.7
12,751
18.2
15.3
2,583
22.0
10,350
6.6
59.1
22,253
77.6
47.8
24 July 2017
26

June 2017 Results Preview | Sector: Financials
Mahindra Fin. Serv.
Bloomberg
Equity Shares (m)
M. Cap. (INR b)/(USD b)
52-Week Range (INR)
1,6,12 Rel Perf. (%)
MMFS IN
565.0
199 / 3
405 / 244
-9 / 11 / -14
CMP: INR352
n
n
n
n
n
n
TP: INR415 (+18%)
Buy
Financial Snapshot (INR b)
Y/E March
2017 2018E 2019E 2020E
NII
33.2 38.0 43.4 50.8
PPP
19.3 22.1 25.3 30.2
PAT
4.0
7.7
9.2 11.1
EPS (INR)
7.1 13.6 16.4 19.7
BV/Sh.(INR)
114.6 122.7 132.3 144.0
ABV/Sh (INR)
94.8 99.2 107.5 118.5
RoA on AUM (%)
1.0
1.7
1.7
1.8
RoE (%)
6.3 11.4 12.8 14.2
Payout (%)
39.8 41.0 41.0 41.0
Valuations
P/E (x)
49.7 26.0 21.5 17.9
P/BV (x)
3.1
2.9
2.7
2.4
P/ABV (x)
3.7
3.5
3.3
3.0
Div. Yield (%)
0.8
1.3
1.6
2.0
There has been a pick-up in growth in the quarter. We expect
3.5%/15% QoQ/YoY AUM growth in the quarter.
NII is likely to increase 26% YoY (due to the low base in 1QFY17).
We expect 15% growth in operating expenses, resulting in 400bp
YoY reduction in the C/I ratio 43.5%.
Asset quality is likely to deteriorate sequentially, but this is a
seasonal phenomenon.
We factor in INR2.5b provisions in 1QFY18 v/s INR3.6b in 4QFY17
and INR2.2b in 1QFY17.
The stock trades at 2.9x FY18E and 2.7x FY19E BV. Maintain Buy.
Key issues to watch for
Ø
Management commentary on performance of rural areas.
Ø
Commentary on pick-up in the CV cycle.
Ø
Asset quality trend in the wake of good monsoon.
Ø
Margin and growth trends.
Ø
Performance of subsidiaries.
Quarterly Performance
Y/E March
Operating Income
Other Income
Total income
YoY Growth (%)
Interest Expenses
Net Income
Operating Expenses
Operating Profit
YoY Growth (%)
Provisions
Profit before Tax
Tax Provisions
Net Profit
YoY Growth (%)
Cost to Income Ratio (%)
Provisions/Operating Profits (%)
Tax Rate (%)
E: MOSL Estimates
1Q
13,664
93
13,757
0.5
6,910
6,847
3,260
3,587
-22.1
2,245
1,341
472
870
-2.2
47.6
62.6
35.2
FY17
2Q
3Q
14,916 14,904
241
130
15,157 15,035
5.4
6.7
7,086
7,441
8,071
7,593
3,567
3,645
4,504
3,949
-10.5
-11.2
3,042
4,190
1,462
-241
514
-85
948
-156
-35.1 -123.3
44.2
48.0
67.5
106.1
35.2
35.2
FY18E
4Q
18,255
173
18,427
9.1
7,137
11,290
4,037
7,252
6.7
3,614
3,638
1,298
2,341
-36.8
35.8
49.8
35.7
1Q
15,759
200
15,959
16.0
7,331
8,628
3,755
4,873
35.9
2,500
2,373
835
1,538
76.8
43.5
51.3
35.2
2Q
16,444
200
16,644
9.8
7,575
9,069
4,107
4,961
10.1
2,200
2,761
972
1,789
88.7
45.3
44.3
35.2
3Q
16,786
200
16,986
13.0
7,789
9,197
4,197
5,000
26.6
2,600
2,400
845
1,555
-1,094.7
45.6
52.0
35.2
4Q
19,527
227
19,754
7.2
7,850
11,904
4,650
7,255
0.0
2,974
4,281
1,507
2,774
18.5
39.1
41.0
35.2
(INR Million)
FY17
61,739
636
62,375
5.6
28,574
33,801
14,509
19,292
-7.6
13,091
6,202
2,198
4,003
-40.5
42.9
67.9
35.4
FY18
68,516
827
69,343
11.2
30,545
38,798
16,709
22,089
14.5
10,274
11,817
4,159
7,658
91.3
43.1
46.5
35.2
24 July 2017
27

June 2017 Results Preview | Sector: Telecom
Tata Communications
Bloomberg
Equity Shares (m)
M. Cap. (INR b)/(USD b)
52-Week Range (INR)
1,6,12 Rel Perf. (%)
TCOM IN
285.0
197 / 3
784 / 430
-6 / -7 / 27
n
CMP: INR690
n
TP: INR811 (+18%)
Buy
Tata Communications’ core revenue is expected to decline 1%
QoQ (8% YoY) to INR42.7b on weak voice and data revenues.
Data revenue is likely to fall 1% QoQ to INR27.8b, adjusting for
the impact of sale of Singapore data center business.
Core EBITDA is likely to grow 11% QoQ to INR5.6b on the back of
140bp improvement in EBITDA margin to 13.1%.
Data EBITDA is expected to grow 21% QoQ to INR4.7b, led by
310bp improvement in data EBITDA margin to 21%.
The stock trades at an EV/EBITDA of 11.7x FY18E and 8.3x FY19E.
Financial Snapshot (INR Million)
Y/E March
2017 2018E 2019E 2020E
Net Sales
EBITDA
Adj. NP
AdjEPS (INR)
BV/Sh(INR)
RoE (%)
RoCE (%)
RoIC
Valuations
P/E (x)
P/BV (x)
EV/EBITDA(x)
Div. Yield (%)
481.0
-50.9
10.9
0.6
28.7
13.4
12.5
0.6
73.2
11.3
11.7
0.6
24.2
7.7
8.3
0.6
205.5
31.0
0.4
1.6
-14.7
-91.6
0.9
1.0
176.2
24.1
7.4
26.0
55.9
126.2
9.7
9.4
175.4
25.3
2.9
10.2
-60.7
66.1
16.7
4.1
5.8
188.8
34.2
8.8
30.8
202.1
96.9
37.8
8.9
15.2
n
n
Adj.EPSGr(%) 1,986.6 1,573.9
n
Key monitorables
Ø
Data revenue performance (we expect 1% QoQ degrowth).
Ø
Data EBITDA margin (we expect ~310bp QoQ improvement).
Cons. Quarterly Earning Model
Y/E March
Net Sales
YoY Change (%)
Total Expenditure
EBITDA
Margins (%)
Depreciation
Interest
Other Income
PBT before EO expense
Extra-Ord expense
PBT
Tax
Rate (%)
Minority Interest & P&L of Asso.Cos.
Reported PAT
Adj PAT
YoY Change (%)
Margins (%)
1Q
50,317
-2.9
41,690
8,627
17.1
5,378
1,721
608
2,136
920
1,216
793
65.2
6
418
738
70.5
1.5
FY17
2Q
45,091
-12.1
38,466
6,625
14.7
4,644
960
728
1,750
0
1,750
899
51.4
6
845
845
1,303.7
1.9
3Q
43,601
-14.5
37,910
5,691
13.1
4,677
999
909
924
0
924
923
99.9
-7
7
7
-96.6
0.0
4Q
42,937
-16.5
37,914
5,024
11.7
4,677
780
1,012
578
10,633
-10,055
-192
1.9
-40
-9,824
607
132.4
1.4
1QE
42,664
-15.2
37,091
5,573
13.1
4,757
724
341
433
0
433
143
33.0
-13
302
302
-59.0
0.7
FY18
2QE
3QE
43,409 44,187
-3.7
1.3
37,356 37,632
6,054
6,554
13.9
14.8
4,757
4,757
711
698
345
354
930
1,453
0
0
930
1,453
307
479
33.0
33.0
-13
-13
636
986
636
986
-24.7 13,223.9
1.5
2.2
4Q
45,100
5.0
38,003
7,097
15.7
4,757
685
358
2,012
0
2,012
664
33.0
-13
1,361
1,361
124.3
3.0
(INR Million)
FY17E
FY18E
176,197
-14.3
152,138
24,059
13.7
18,658
3,672
3,603
5,332
11,553
-6,221
2,364
-38.0
-51
-8,534
7,409
1,573.9
4.2
188,759
7.6
154,550
34,209
18.1
20,397
2,792
2,022
13,042
0
13,042
4,304
33.0
-51
8,789
8,789
202.1
4.7
24 July 2017
28

Zee Entertainment
Bloomberg
Equity Shares (m)
M. Cap. (INR b)/(USD b)
52-Week Range (INR)
1,6,12 Rel Perf. (%)
Z IN
960.4
522 / 8
589 / 382
4 / -10 / 21
n
CMP: INR492
n
TP: INR585 (+19%)
Buy
Financial Snapshot (INR Billion)
Y/E MARCH
2017 2018E 2019E 2020E
Net Sales
EBITDA
Adj. NP
Adj. EPS (INR)
Adj. EPS Gr. (%)
EPS ex-&TV (INR)
RoE (%)
RoCE (%)
Div. Payout (%)
Valuations
P/E (x)
P/E ex-&TV (x)
EV/EBITDA (x)
Div. Yield (%)
21.3
20.5
23.5
0.5
31.6
30.6
21.1
0.5
26.5
27.4
18.1
0.6
22.8
24.0
15.1
0.6
64.3
19.3
12.2
23.1
149.4
24.0
24.7
23.1
10.8
66.2
21.3
14.9
15.6
-32.6
16.1
23.6
19.4
16.1
76.7
25.2
17.8
18.6
19.2
17.9
23.7
20.0
16.2
89.2
30.4
20.7
21.5
16.1
20.5
23.0
20.7
13.9
n
n
n
n
n
We expect advertising revenue to grow 6% YoY to INR9.66b. Ex-
sports, ad revenue is expected to grow 9% YoY. GST is expected to
have a transient impact on ad spends for June.
The network seems to be on track in fixing the low fresh
programming hours, with the launch of
Aisi Dewangee
on Zee TV,
Chupke
and
India’a Asli Champion
on &TV in 1Q.
While on a reported basis, subscription revenue is likely to decline
YoY, like-to-like, domestic subscription revenue is expected to grow
11% to INR3.43b.
Total revenue is expected to decline 5% YoY to INR14.94b.
We expect EBITDA margin hold up YoY at 31.3% (similar levels as
1QFY16 Ex-sports margins of 31.3%).
Adjusted PAT is expected to grow ~66% YoY to INR3.61b.
Our revised TP is INR585 (32x FY19E EPS (ex-&TV) plus INR22/share
towards &TV DCF less INR12/share towards preference share
liability). The stock trades at 31.4 FY18E and 26.3x FY18E EPS. Buy.
YoY ad growth (we expect 6%).
Like-to-like YoY domestic subscription (we expect 11% growth).
Key things to watch for
Ø
Ø
Quarterly Performance
Y/E March
Advertsing Revenue
Subscription Revenue
Other Sales and Services
Net Sales
Change (%)
Prog, Transmission & Direct Exp
Staff Cost
Selling and Other Exp
EBITDA
Change (%)
EBITDA margin (%)
Depreciation
Finance cost
Other Income
Fair Value through P&L
Extraordinary items
PBT
Tax
Effective Tax Rate (%)
PAT
Minority Interest/Associates
Adj PAT after MI & Extra-Ordinary
gains/losses
Change (%)
1Q
9,120
5,282
1,315
15,716
17.3
6,575
1,499
3,110
4,532
45.6
28.8
251
75
734
-1,132
3,807
1,626
42.7
2,181
12
2,170
-11.0
FY17
2Q
3Q
9,592
9,554
5,833
5,935
1,529
902
16,954
16,391
23.0
3.4
7,688
7,035
1,533
1,419
2,841
2,780
4,892
5,158
36.4
20.1
28.9
31.5
336
249
86
90
432
525
-829
-714
4,074
1,634
40.1
2,440
56
2,384
-16.2
4,630
2,081
44.9
2,549
41
2,508
8.6
4Q
8,469
5,580
1,231
15,280
0.4
6,527
1,593
2,474
4,687
14.0
30.7
316
1,122
549
470
12,234
16,503
1,464
8.9
15,039
-103
2,908
28.4
1QE
9,667
4,353
920
14,941
-4.9
5,906
1,464
2,892
4,678
3.2
31.3
323
100
1,138
FY18
2QE
3QE
10,359
10,987
5,004
6,250
1,071
902
16,434
18,139
-3.1
10.7
6,320
6,952
1,611
1,778
3,143
3,416
5,361
5,993
9.6
16.2
32.6
33.0
329
334
100
100
670
797
5,393
1,780
33.0
3,613
2
3,611
66.4
5,602
1,849
33.0
3,753
2
3,751
57.4
6,357
2,098
33.0
4,259
2
4,257
69.7
(INR Million)
FY17
4QE
9,323
36,735
6,093
22,630
1,238
4,978
16,654
64,342
9.0
10.7
6,712
27,825
1,632
6,043
3,055
11,205
5,255
19,269
12.1
27.3
31.6
29.9
334
1,152
772
1,372
831
2,240
-2,205
12,234
4,980
29,015
1,643
6,804
33.0
23.5
3,337
22,211
1
7
3,336
14.7
9,969
8.0
24 July 2017
29

In conversation
1. Expect loan growth to pick up in Q2: can fin homes; SK Hota,
MD
n
n
n
n
In a position to hold on to fresh approvals like last years.
Enquiries have improved, so there is certainly a positive signal as far as the loan
book growth or the fresh approvals are concerned.
Q2 should be better quarter because there is some clarity emerging as far as
Real Estate Regulatory Authority (RERA) and other things are concerned
Asset quality is the forte of Can Fin Homes and confident that it will not be an
issue for the company going forward.
2. Attempt is to bring down gross NPA to 5%, says Indian Bank;
Kishor Kharat, MD & CEO
n
n
n
In 5:25 have roughly around 11 accounts amounting to Rs 1,315 crore, under
strategic debt restructuring (SDR) there were 14 accounts of Rs 1,613 crore and
under S4A have four accounts roughly around Rs 230 crore.
In this quarter there is no new addition to anyone of these
On gross NPA front, endeavour is to bring down gross non-performing asset
(NPA) below 5 percent.
3. Hopeful of better topline growth due to diversity in product
mix: HIL; Dhirup Roy Choudhary, MD & CEO
n
n
n
n
n
Going forward to see a much better diversity in product mix which will get
growth in the topline
GST should help us in consolidating our business
Farmers’ loan waiver could also have a significant contribution towards positive
growth for HIL.
GST rates for roofing has come down from 28 percent to 18 percent and now it
is at par with the steel sheet which gives a great competition to our cement
fibre roofing solutions. That is a very positive way going forward for HIL
Unorganised segment will get consolidated and the market share will get split
between the organised sector.
4. Hope to better 5% ad revenue growth going forward: DB Corp;
Girish Agarwaal, Promoter & Director
n
n
n
n
Happy with the 5 percent ad revenue growth in spite of GST impact and 35
percent EBITDA margin improvement in print in the quarter gone by. Would aim
for a higher growth going forward
Education, automobile and healthcare were the key contributors to the ad
revenue growth and would continue to do so. Real estate will see a bounce back
in coming quarters.
The fall in ad revenues in the digital space was a conscious decision of removing
irritant advertising
The digit ad revenues were down 1.5 percent in the quarter at Rs 12.3 crore.
24 July 2017
30

From the think tank
1. More steel to lenders
n
Counter-intuitive as it might seem, Essar Steel may actually have done a favour
to the fledgling Insolvency and Bankruptcy Code by challenging the Reserve
Bank of India and State Bank of India in the Gujarat High Court, which the latter
has now dismissed. The embattled steelmaker had challenged RBI’s direction to
the lenders to start insolvency proceedings against the company. Essar Steel
argued that it was not given an opportunity by the central bank to present its
case before its name was included in the list of 12 borrowers that was referred
to the National Company Law Tribunal (NCLT) for commencement of insolvency
proceedings. The company had argued before the court that it was in the
process of revival now having repaid ₹3,467 crore between April 2016 and June
2017 out of its massive outstanding debt of ₹45,000 crore. Its operating
parameters had improved and the company was in talks with banks and
therefore ought to have been given time to complete restructuring the debt.
2. Agrarian crisis: the challenge of a small farmer economy
n
The rising frequency of farmers’ agitations in Tamil Nadu, Maharashtra, Madhya
Pradesh and elsewhere and the high incidence of farmer’s suicides are
symptoms of a deep malaise in rural India. But beyond scanning the morning
headlines, urban India has barely noticed. So long as growth keeps chugging
along at 6% plus and food prices remain stable, urban India doesn’t really care.
This complacency about the misfortunes of Bharat is quite dangerous.
Agriculture is still the core of our food security. With over 1.3 billion mouths to
feed, imports will not solve our problem if there is a severe drought and food
shortage. Those old enough will recall the desperate years of 1964-65 and 1965-
66. Moreover, though agriculture now accounts for less than 15% of gross
domestic product (GDP), it is still the main source of livelihood for nearly half
our population. It was, therefore, reassuring to see Nitin Gadkari candidly
recognize in a recent TV interview that there is a crisis in Indian agriculture. But
what are the roots of this crisis? And what is the way forward? I can only outline
the answers to these critical questions in this short column.
3. Jobs creation: how to make housing the growth sweet spot,
power up employment
n
Job creation will be India’s single biggest priority over the next 20-30 years. One
of the major sectors that will always be at the forefront of the economic
landscape of India is the housing sector. Over 150 industries are connected to
the construction, sale and occupancy of homes, plus each rupee invested in
housing adds an overall Rs2.84 to GDP. Yet, housing and construction’s biggest
strength lies in its labour-intensity: as per a 2014 NCAER study, more than 99%
of the jobs in the housing sector are informal in nature. For a country with 800
million-plus unskilled and semi-skilled citizens, this statistic is gold dust. It isn’t
surprising then, that housing has finally captured the imagination of policy
makers. In FY16, 11 housing finance licences were awarded; in the 2017 budget,
affordable housing received infrastructure status; and key government schemes
now aim to address India’s housing shortage. Home loans are gradually
becoming cheaper.
31
24 July 2017

4. Ease of exiting business: how non viable firms continue to
hurt the economy
n
n
The World Bank’s Ease of Doing Business framework comprises of nine
parameters, one of which is business exit/insolvency. This highlights the
significance of exits in a market. Ease of doing business needs to unequivocally
address all three stages of a firm, ie, starting, sustaining and exiting of a
business. India ranks 136 out of 169 in resolving insolvency. In Mumbai,
insolvency is resolved in seven years with a recovery rate of 15.1 cents on the
dollar, while in Delhi insolvency is resolved in seven years with a recovery rate of
14.6 cents on the dollar.
The above data vindicates those who have constantly argued that ease of
shutting businesses is of paramount and equal importance. Ease of Doing
Business is not only about the effortless and rapid emergence of new businesses
in an economy. It is also concerned about the ease of “exiting” business. Exit is
an inevitable truth of any business cycle, and we need to equip the system to
enable seamless exits. Investors and entrepreneurs need to be offered a round-
trip framework for doing business.
International
5. Putting aside protocol spells danger for Donald Trump
n
When news broke this week about President Donald Trump having a second,
unreported meeting with Russian president Vladimir Putin at the G20 summit in
Hamburg on July 7, some wondered what the fuss was all about. Why can’t two
presidents engage one another in conversation when they are attending the
same dinner? What is so wrong about that? Well, international summits are not
wedding receptions. World leaders do not wander from table to table, making
small talk. Summits and the meals accompanying them are highly
choreographed and scripted events and for good reason.
24 July 2017
32

Click excel icon
for detailed
valuation guide
Rs
Valuation snapshot
P/E (x)
P/B (x)
FY17 FY18E FY17 FY18E
29.9
22.4
21.3
43.4
50.7
19.8
47.0
37.9
32.8
26.6
21.8
25.5
45.8
30.3
23.4
48.6
28.7
35.2
27.9
35.6
24.4
30.0
19.7
20.1
32.7
NM
37.2
44.7
13.1
21.6
29.2
27.0
NM
18.7
38.6
11.2
NM
25.4
976.1
20.2
107.6
48.2
37.2
24.7
15.5
58.5
35.0
16.5
29.2
19.4
24.8
18.7
19.5
30.1
36.9
19.2
33.5
29.2
17.8
22.4
18.6
20.7
24.9
25.7
15.0
35.0
22.3
22.7
23.3
34.8
21.5
25.4
19.3
17.2
25.3
19.1
30.8
29.5
10.0
17.4
23.2
8.8
11.3
11.7
9.2
9.9
8.8
15.4
16.2
6.3
13.1
34.0
18.9
20.7
12.4
47.9
32.4
12.8
21.3
15.4
5.5
4.9
4.8
6.4
8.3
3.1
16.3
7.2
3.3
3.7
7.3
3.2
2.8
6.3
2.7
11.3
4.9
2.4
2.9
2.5
2.3
4.9
2.2
1.4
4.7
0.8
4.8
4.7
1.1
3.4
3.3
1.1
0.7
0.7
0.5
1.1
0.4
0.9
1.4
0.5
0.9
9.2
4.4
4.2
1.8
17.5
6.5
4.0
3.4
3.5
4.7
4.3
4.3
5.6
7.3
2.7
11.8
6.0
2.8
3.3
6.2
2.9
2.5
5.4
2.3
9.0
4.2
2.2
2.3
2.4
1.9
4.4
2.1
1.3
4.1
0.7
4.3
4.1
1.0
2.9
3.0
1.0
0.7
0.7
0.5
1.0
0.4
0.8
1.3
0.5
0.9
7.5
3.6
3.5
1.6
14.4
5.9
3.5
3.0
2.9
ROE (%)
FY17 FY18E FY19E
20.3
23.3
25.3
16.2
15.8
16.9
40.3
20.8
10.6
14.0
35.7
14.2
6.4
20.3
9.8
25.6
17.1
6.9
10.8
8.9
9.9
17.9
10.2
7.2
15.4
-27.0
13.8
12.3
9.5
18.9
11.4
4.1
-6.7
4.2
1.4
10.1
-8.4
3.6
-0.2
2.7
0.9
21.7
15.1
18.1
14.4
32.5
19.3
25.5
12.4
19.4
20.4
24.5
23.3
19.8
21.1
15.1
40.8
22.4
17.3
14.8
36.0
14.1
10.8
20.8
16.5
28.6
19.0
10.1
11.4
7.1
10.2
18.2
9.4
7.9
17.3
4.0
15.0
14.9
10.8
18.0
12.8
11.9
6.1
6.2
5.8
10.6
4.6
5.6
8.7
8.1
6.7
24.3
20.9
18.5
13.9
33.0
18.3
29.0
15.3
20.6
20.7
27.1
24.5
22.3
21.9
17.8
38.0
23.6
18.3
15.9
31.0
14.6
11.5
22.8
27.3
35.2
22.6
15.4
11.8
10.1
10.5
19.0
10.1
8.8
18.5
7.0
16.3
17.5
12.7
19.5
14.4
13.2
9.0
9.1
7.3
11.1
5.4
7.5
10.0
10.5
8.2
25.9
21.6
18.9
15.3
32.8
17.4
32.7
17.5
19.7
Company
Automobiles
Amara Raja
Ashok Ley.
Bajaj Auto
Bharat Forge
Bosch
CEAT
Eicher Mot.
Endurance Tech.
Escorts
Exide Ind
Hero Moto
M&M
Mahindra CIE
Maruti Suzuki
Tata Motors
TVS Motor
Aggregate
Banks - Private
Axis Bank
DCB Bank
Equitas Hold.
Federal Bank
HDFC Bank
ICICI Bank
IDFC Bank
IndusInd
J&K Bank
Kotak Mah. Bk
RBL Bank
South Indian
Yes Bank
Aggregate
Banks - PSU
BOB
BOI
Canara
IDBI Bk
Indian Bk
OBC
PNB
SBI
Union Bk
Aggregate
NBFCs
Bajaj Fin.
Bharat Fin.
Cholaman.Inv.&F
n
Dewan Hsg.
GRUH Fin.
HDFC
Indiabulls Hsg
L&T Fin Holdings
LIC Hsg Fin
Reco
Buy
Buy
Buy
Buy
Neutral
Buy
Buy
Buy
Neutral
Buy
Neutral
Buy
Not Rated
Buy
Buy
Buy
CMP
(INR)
839
103
2,815
1,135
24,011
1,848
28,858
891
656
217
3,680
1,383
245
7,528
465
571
TP
% Upside
EPS (INR)
(INR) Downside FY17 FY18E FY19E
1,073
122
3,359
1,330
23,738
2,100
31,326
1,025
731
286
3,666
1,625
-
8,483
666
606
28
18
19
17
-1
14
9
15
11
32
0
17
13
43
6
28.0
4.6
132.3
26.2
473.1
93.3
613.8
23.5
20.0
8.2
169.1
54.3
5.4
248.6
19.8
11.7
33.8
40.5
5.5
7.1
144.6 169.1
37.7
49.7
649.9 766.2
96.2
131.3
861.2 1,102.9
30.5
38.8
36.9
45.7
9.7
11.9
198.2 198.7
66.7
79.9
9.9
11.8
292.6 379.7
30.9
64.3
16.3
25.9
Neutral
540
Neutral
195
Buy
168
Buy
117
Buy
1,703
Buy
301
Neutral
60
Buy
1,568
Neutral
84
Buy
999
Under Review 531
Buy
29
Buy
1,579
500
192
207
134
1,885
340
62
1,800
89
1,153
-
34
2,121
-7
-2
23
14
11
13
3
15
6
15
19
34
15.4
7.0
4.7
4.8
56.8
15.3
3.0
47.9
-31.3
26.8
11.9
2.2
73.0
23.8
8.4
4.8
5.5
67.1
15.6
3.5
61.9
4.4
32.4
18.0
2.9
90.7
40.3
10.4
7.4
6.8
79.4
17.9
4.2
76.8
8.0
41.0
24.2
3.7
114.6
Buy
Neutral
Neutral
Neutral
Buy
Neutral
Buy
Buy
Neutral
162
155
351
59
329
150
158
290
155
212
147
360
49
357
150
184
362
162
31
-5
3
-16
9
0
16
25
5
6.0
-14.8
18.8
1.5
29.3
-31.6
6.2
0.3
7.6
18.4
13.7
30.1
6.4
33.2
17.1
10.3
17.9
24.6
22.5
22.0
47.0
8.6
38.0
21.4
14.5
23.3
34.5
Buy
Neutral
Buy
1,618
781
1,137
1,800
800
1,300
530
450
-
1,300
180
750
11
2
14
16
-5
14
18
1
33.6
21.0
46.0
29.6
8.1
46.8
69.0
5.2
38.2
47.6
41.3
55.0
37.0
9.9
50.7
88.9
7.2
47.9
62.9
53.0
66.4
45.4
12.1
55.9
113.9
9.6
53.8
Buy
458
Neutral
476
Under Review 1,642
Buy
1,138
Buy
153
Neutral
740
24 July 2017
33

Company
Reco
Manappuram
Not Rated
M&M Fin.
Buy
Muthoot Fin
Buy
PFC
Neutral
Repco Home
Buy
REC
Neutral
Shriram
City
Buy
Union
STF
Buy
Aggregate
Capital Goods
ABB
Sell
Bharat Elec.
Buy
BHEL
Sell
Blue Star
Neutral
CG Cons. Elec.
Buy
CG Power & Indu. Sell
Cummins
Buy
GE T&D
Neutral
Havells
Neutral
K E C Intl
Neutral
L&T
Buy
Pennar Eng.
Not Rated
Siemens
Neutral
Solar Ind
Neutral
Suzlon Energy
Not Rated
Thermax
Sell
Va Tech Wab.
Buy
Voltas
Sell
Aggregate
Cement
Ambuja Cem.
Buy
ACC
Neutral
Birla Corp.
Buy
Dalmia Bharat
Buy
Grasim Inds.
Neutral
India Cem
Neutral
J K Cements
Buy
JK Lakshmi Ce
Buy
Ramco Cem
Buy
Orient Cem
Buy
Prism Cem
Buy
Shree Cem
Buy
Ultratech
Buy
Aggregate
Consumer
Asian Paints
Neutral
Britannia
Buy
Colgate
Buy
Dabur
Neutral
Emami
Buy
Godrej Cons.
Neutral
GSK Cons.
Sell
HUL
Buy
ITC
Neutral
CMP
(INR)
105
354
453
128
798
183
2,346
964
TP
% Upside
EPS (INR)
(INR) Downside FY17 FY18E FY19E
-
8.6
10.8
12.5
415
17
7.1
13.6
16.4
550
22
29.5
41.0
43.3
117
-9
25.7
27.2
30.2
936
17
29.1
35.8
42.5
134
-27
31.4
35.0
40.4
2,900
1,340
24
39
84.3
55.6
132.8
78.5
171.2
98.5
P/E (x)
P/B (x)
FY17 FY18E FY17 FY18E
12.1
9.7
2.7
2.4
50.0
26.1
3.1
2.9
15.3
11.0
2.8
2.4
5.0
4.7
0.9
0.8
27.4
22.3
4.4
3.7
5.8
5.2
1.1
0.9
27.8
17.3
19.8
74.2
24.7
67.5
52.4
43.7
20.9
38.0
57.1
48.3
24.7
27.9
17.5
76.4
43.4
30.2
30.0
21.0
32.2
35.4
54.3
47.4
32.2
68.1
15.6
37.1
29.2
66.7
24.8
NM
351.4
46.0
43.5
36.8
55.0
52.0
50.4
41.8
41.4
50.8
35.0
59.0
34.4
17.7
12.3
16.5
65.2
23.9
40.8
37.9
37.3
37.5
34.5
52.8
42.2
22.9
25.1
13.7
56.1
39.5
21.7
28.4
17.5
32.0
31.2
36.6
34.4
23.1
39.6
14.9
22.4
24.3
40.7
21.7
34.6
33.0
38.9
45.6
31.0
50.0
44.8
41.7
39.1
38.9
44.0
32.8
50.5
31.1
3.1
1.9
3.3
9.4
5.1
1.1
8.5
23.8
1.3
7.5
8.1
8.8
4.8
3.3
1.8
7.1
8.0
-1.8
4.1
3.3
5.0
4.0
2.8
3.7
2.2
4.7
1.7
1.3
3.9
3.9
4.4
3.3
6.1
8.7
4.8
3.6
14.6
17.1
22.8
11.0
14.2
12.3
7.4
37.6
7.8
2.7
1.7
2.9
8.2
3.9
1.1
8.0
17.2
1.2
6.9
7.4
7.9
4.1
3.1
1.6
6.1
6.9
-1.9
3.7
2.9
4.5
3.6
2.6
3.6
2.1
4.2
1.5
1.2
3.4
3.6
3.7
3.1
5.3
7.3
4.4
3.3
14.0
15.7
21.6
9.4
11.9
9.6
7.2
36.3
7.7
FY17
24.0
6.3
19.4
17.9
17.4
19.9
11.7
11.7
16.9
12.7
20.6
1.6
18.0
76.4
6.2
21.2
12.4
18.2
21.2
12.2
10.2
9.3
19.8
NM
14.3
16.3
18.0
11.2
5.1
7.9
7.5
7.2
11.5
3.4
14.4
6.0
19.2
-3.2
1.8
20.2
11.6
9.7
28.5
36.9
50.4
28.4
35.8
24.6
22.2
65.6
23.5
ROE (%)
FY18E
25.9
11.4
23.2
17.0
18.1
19.1
16.2
14.7
17.8
12.6
16.5
2.7
21.7
53.4
3.4
20.7
14.7
18.6
19.2
12.6
11.6
11.0
18.6
-8.8
13.7
17.7
14.7
11.6
7.3
10.6
9.2
11.3
10.9
5.5
15.0
9.2
18.6
9.2
17.2
20.4
10.1
10.5
28.6
36.5
53.2
26.0
33.4
24.5
22.1
73.1
24.8
FY19E
26.9
12.8
21.4
16.8
18.2
19.1
18.1
16.3
17.9
15.8
16.8
3.4
30.1
49.8
4.2
23.5
16.4
20.7
20.9
13.4
12.6
13.7
19.9
-11.0
12.9
17.5
14.9
12.7
7.8
13.1
12.2
13.1
13.9
7.2
17.2
13.8
19.1
12.6
22.0
21.3
14.0
12.9
30.6
38.3
60.3
26.3
34.1
23.0
22.4
82.8
26.3
1,461
171
145
675
204
86
1,007
327
462
293
1,179
124
1,361
895
19
927
609
498
1,200
200
100
610
240
65
1,110
320
455
250
1,340
-
1,355
825
-
850
800
400
-18
17
-31
-10
17
-24
10
-2
-2
-15
14
0
-8
-8
31
-20
19.7
6.9
2.1
12.9
4.7
4.1
26.5
5.7
9.6
11.9
42.3
7.1
17.8
20.6
0.6
30.8
28.9
15.5
22.4
7.2
3.6
17.8
5.5
2.3
29.2
6.2
10.9
12.8
47.1
9.1
24.3
22.6
0.9
32.7
34.9
15.6
31.6
8.1
4.7
26.6
6.6
4.5
36.0
7.6
13.8
16.4
54.0
11.2
33.3
28.2
1.0
34.0
39.8
17.6
265
1,711
946
2,641
1,061
209
983
464
675
160
122
17,688
4,179
291
1,622
1,205
3,162
1,384
219
1,287
553
823
178
145
21,052
4,936
10
-5
27
20
30
5
31
19
22
11
19
19
18
4.9
36.1
29.4
38.8
67.9
5.6
33.7
7.0
27.3
-1.6
0.3
384.4
96.1
7.3
49.8
40.9
66.7
71.2
9.3
40.4
11.4
31.1
4.6
3.7
454.7
91.5
8.2
65.0
58.9
87.1
102.6
12.9
53.5
19.2
37.5
7.0
5.6
575.2
138.8
1,156
3,832
1,070
303
1,100
959
5,464
1,159
289
1,240
4,450
1,335
315
1,265
930
4,500
1,285
280
7
16
25
4
15
-3
-18
11
-3
21.0
73.7
21.2
7.2
26.5
18.9
156.1
19.6
8.4
23.1
85.5
25.7
7.7
28.3
21.8
166.3
22.9
9.3
27.4
105.4
31.1
9.1
33.9
25.0
181.9
27.3
10.3
24 July 2017
34

Company
Jyothy Lab
Marico
Nestle
Page Inds
Parag Milk
Pidilite Ind.
P&G Hygiene
Prabhat Dairy
United Brew
United Spirits
Aggregate
Healthcare
Alembic Phar
Alkem Lab
Ajanta Pharma
Aurobindo
Biocon
Cadila
Cipla
Divis Lab
Dr Reddy’s
Fortis Health
Glenmark
Granules
GSK Pharma
IPCA Labs
Jubilant Life
Lupin
Sanofi India
Sun Pharma
Syngene Intl
Torrent Pharma
Aggregate
Logistics
Allcargo Logistics
Blue Dart
Concor
Gateway
Distriparks
Gati
Transport Corp.
Aggregate
Media
Dish TV
D B Corp
Den Net.
Hind. Media
HT Media
Jagran Prak.
PVR
Siti Net.
Sun TV
Zee Ent.
Aggregate
Metals
Reco
Neutral
Neutral
Sell
Buy
Neutral
Neutral
Buy
Not Rated
Neutral
Neutral
CMP
(INR)
384
329
6,816
16,798
254
804
8,051
136
814
2,709
TP
% Upside
(INR) Downside
405
5
360
9
5,990
-12
20,195
20
240
-6
835
4
9,082
13
-
850
4
2,415
-11
FY17
11.2
6.3
118.0
238.7
3.6
16.7
144.9
3.5
8.7
26.7
EPS (INR)
FY18E FY19E
8.9
11.0
6.9
8.4
118.6 139.5
317.0 400.0
7.4
12.3
18.4
21.2
155.8 181.6
3.5
6.4
9.7
14.7
37.4
51.8
P/E (x)
P/B (x)
FY17 FY18E FY17 FY18E
34.2
42.9
6.4
6.6
52.4
47.4 18.3 15.6
57.8
57.4 21.8 20.1
70.4
53.0 28.1 22.2
70.6
34.2
3.3
3.0
48.0
43.6 12.5 10.1
55.6
51.7 45.9 36.6
38.5
39.1
1.9
1.9
93.6
83.9
9.3
8.6
101.3 72.5 20.3 14.0
46.5
41.6 12.8 11.9
25.0
23.4
25.1
19.0
39.2
37.2
35.6
18.2
38.0
15.8
17.7
19.6
73.8
29.9
20.3
19.3
32.3
22.1
37.0
23.0
25.4
18.0
43.5
31.1
39.0
14.9
18.9
29.7
79.0
18.4
NM
10.9
11.4
16.2
66.5
NM
32.4
24.0
40.5
26.4
22.3
22.1
16.4
38.6
29.7
28.4
20.4
26.0
77.5
16.2
17.3
48.8
22.5
15.9
19.7
31.2
22.9
29.9
22.4
23.7
14.5
34.3
30.1
24.8
7.8
15.2
25.2
54.9
15.9
NM
10.0
10.7
14.2
47.2
NM
28.3
35.6
30.3
5.4
5.0
8.3
4.7
5.3
8.5
3.6
4.1
3.7
1.7
4.4
3.6
15.9
2.5
3.4
3.9
5.5
3.8
7.5
5.4
4.4
2.7
19.3
3.3
2.3
2.0
2.9
3.6
16.9
4.3
1.5
1.9
0.8
2.4
6.6
3.6
8.1
9.2
6.0
4.7
4.3
6.3
3.7
4.9
7.0
3.3
3.7
3.1
1.5
3.5
2.5
19.4
2.3
2.9
3.4
5.2
3.6
6.1
4.7
3.9
2.4
14.7
3.1
2.2
1.8
2.5
3.4
12.9
3.9
1.6
1.6
0.7
2.3
5.8
3.7
7.4
7.7
5.4
FY17
21.1
36.7
39.0
40.0
5.9
28.2
45.3
5.2
10.4
21.3
27.6
23.0
23.4
37.7
28.3
13.6
24.8
10.2
23.5
9.6
11.3
24.7
21.1
21.5
8.6
18.1
22.0
17.1
18.5
22.2
25.3
17.5
12.6
50.5
10.8
5.9
12.4
16.7
12.2
24.1
25.5
-12.0
19.0
7.1
17.6
10.4
-23.5
25.0
24.7
14.7
ROE (%)
FY18E
15.1
35.5
36.4
42.0
9.1
25.6
78.9
4.9
10.7
19.3
28.7
19.0
20.7
32.2
25.5
12.6
25.7
11.5
19.0
13.2
2.0
21.6
17.7
39.7
10.5
19.5
18.2
16.6
16.1
22.5
22.4
16.4
17.2
48.6
10.6
9.1
19.4
17.8
13.4
26.8
25.7
-5.3
17.3
6.9
16.4
13.2
-2.0
26.3
23.6
17.8
FY19E
18.4
38.1
39.0
42.8
13.4
24.0
74.0
8.5
14.6
19.7
29.6
20.4
21.0
29.9
22.3
15.6
27.2
12.8
19.2
14.9
5.3
20.9
18.8
54.4
12.7
19.6
19.4
18.1
17.9
20.7
24.2
17.4
17.8
46.8
11.8
11.1
25.4
18.6
15.0
327.5
26.5
0.7
17.3
6.4
17.2
17.7
6.9
30.2
23.7
22.7
Neutral
Neutral
Buy
Buy
Sell
Buy
Neutral
Neutral
Neutral
Buy
Neutral
Buy
Neutral
Neutral
Buy
Buy
Buy
Buy
Not Rated
Buy
540
1,774
1,464
748
400
528
566
721
2,760
164
697
142
2,538
480
750
1,143
4,171
577
482
1,272
510
1,900
2,028
850
300
510
500
600
2,600
240
800
200
2,700
480
905
1,475
4,820
650
-
1,450
-6
7
39
14
-25
-3
-12
-17
-6
47
15
41
6
0
21
29
16
13
14
21.6
75.7
58.4
39.3
10.2
14.2
15.9
39.7
72.6
10.3
39.3
7.2
34.4
16.1
37.0
59.2
129.1
26.1
13.0
55.2
20.5
79.7
66.1
45.7
10.4
17.8
20.0
35.4
106.2
2.1
42.9
8.2
51.9
21.3
47.1
57.9
133.6
25.2
16.1
56.8
25.5
95.0
79.6
50.0
14.4
23.2
25.0
39.8
143.0
6.1
51.7
11.5
60.1
28.5
56.7
72.0
160.6
30.8
18.0
71.4
Buy
Not Rated
Neutral
Buy
Not Rated
Not Rated
177
4,457
1,181
266
124
321
228
-
1,236
313
-
-
29
5
18
9.8
102.5
38.0
6.8
8.4
16.9
12.2
129.9
39.2
10.7
15.9
21.0
14.3
163.2
45.8
13.6
23.9
25.9
Buy
Buy
Neutral
Buy
Neutral
Buy
Buy
Neutral
Neutral
Buy
78
376
79
283
85
175
1,366
26
806
554
105
450
90
350
90
225
1,588
32
860
585
35
20
14
24
6
29
16
24
7
6
1.0
20.4
-8.6
25.9
7.4
10.8
20.5
-1.8
24.9
23.1
1.4
23.6
-2.7
28.3
7.9
12.3
28.9
-0.1
28.5
15.6
4.0
27.5
0.3
33.6
8.1
14.0
45.1
0.5
35.9
18.6
24 July 2017
35

Company
Hindalco
Hind. Zinc
JSPL
JSW Steel
Nalco
NMDC
SAIL
Vedanta
Tata Steel
Aggregate
Oil & Gas
BPCL
GAIL
Gujarat Gas
Gujarat St. Pet.
HPCL
IOC
IGL
MRPL
Oil India
ONGC
PLNG
Reliance Ind.
Aggregate
Retail
Jubilant Food
Titan Co.
Aggregate
Technology
Cyient
HCL Tech.
Hexaware
Infosys
KPIT Tech
L&T Infotech
Mindtree
Mphasis
NIIT Tech
Persistent Sys
Tata Elxsi
TCS
Tech Mah
Wipro
Zensar Tech
Aggregate
Telecom
Bharti Airtel
Bharti Infratel
Idea Cellular
Tata Comm
Aggregate
Utiltites
Coal India
CESC
JSW Energy
Reco
Buy
Sell
Buy
Buy
Neutral
Buy
Sell
Buy
Neutral
CMP
(INR)
214
280
137
214
71
123
62
268
553
TP
% Upside
EPS (INR)
(INR) Downside FY17 FY18E FY19E
308
44
16.2
21.8
26.1
246
-12
15.1
24.4
32.2
190
39
-20.9 -17.2
2.4
281
31
14.8
19.0
22.6
70
-1
3.7
3.8
4.2
180
47
10.0
12.1
12.2
37
-41
-6.2 -10.6
-4.2
311
16
19.7
22.6
26.9
583
6
37.9
49.6
65.6
P/E (x)
P/B (x)
FY17 FY18E FY17 FY18E
13.3
9.8
1.6
1.4
18.5
11.5
1.7
1.6
NM
NM
0.4
0.4
14.5
11.3
2.3
2.0
19.2
18.8
1.3
1.3
12.3
10.1
1.7
1.6
NM
NM
0.7
0.8
13.6
11.9
3.7
3.9
14.6
11.1
1.7
1.5
19.2
14.7
1.6
1.5
9.7
16.7
37.3
19.7
9.0
8.8
26.9
8.6
14.6
10.0
18.1
16.4
12.1
125.2
60.1
64.0
17.3
15.1
17.8
15.6
10.6
13.8
19.4
14.8
14.3
17.4
29.9
18.7
12.8
16.9
15.9
16.6
37.0
27.6
NM
25.2
39.6
17.6
17.3
17.3
12.7
14.3
22.6
15.7
12.4
10.6
24.4
12.5
10.1
9.5
23.9
14.6
12.4
84.6
52.8
55.0
15.0
14.7
15.8
15.4
11.9
13.0
16.8
13.6
12.8
15.0
24.7
18.6
12.8
15.8
15.6
16.5
70.0
23.9
NM
64.3
129.0
14.9
11.4
21.2
3.0
1.7
6.4
2.2
2.8
1.8
5.5
2.2
0.8
1.0
3.8
1.6
1.6
10.3
11.4
11.0
2.8
3.8
4.3
3.2
1.6
4.8
3.2
2.0
1.9
2.7
9.4
5.6
2.1
2.7
2.3
3.8
2.4
4.9
1.3
11.7
2.7
6.6
1.8
1.1
2.6
1.6
5.2
2.0
2.4
1.6
4.7
1.9
0.7
0.9
3.4
1.5
1.5
9.4
10.4
10.1
2.5
3.8
3.8
2.9
1.5
3.8
3.1
2.3
1.8
2.6
7.5
5.9
1.9
2.6
2.1
3.8
2.4
4.3
1.6
9.9
2.7
6.6
1.6
1.0
FY17
14.0
9.7
-7.9
17.3
7.2
12.4
-6.7
24.4
15.7
8.2
32.4
9.6
17.8
11.6
32.4
21.2
21.0
31.4
5.7
10.1
23.2
11.6
13.3
8.2
20.6
17.2
16.2
27.5
26.5
22.0
14.3
40.4
16.8
13.2
13.7
17.0
37.1
32.6
18.4
16.9
15.5
22.9
6.7
16.2
-1.6
126.2
6.9
37.8
10.5
6.3
ROE (%)
FY18E
15.2
14.6
-5.4
18.7
7.0
15.0
-12.6
32.0
14.3
10.3
21.7
11.3
25.3
13.1
20.6
15.8
20.6
16.5
7.5
9.9
15.1
11.7
11.9
11.1
20.6
18.4
16.6
25.2
25.3
20.0
13.0
32.5
17.3
14.2
14.4
18.1
33.7
31.1
16.0
16.1
14.2
22.9
3.4
19.1
-15.3
16.7
2.1
44.5
14.4
4.9
FY19E
15.4
17.9
0.8
19.0
7.5
15.5
-5.5
35.1
16.8
13.2
22.3
11.8
28.0
14.0
20.0
15.8
19.6
16.9
7.8
10.8
26.4
11.5
12.4
14.0
21.6
19.2
17.3
25.8
23.5
19.8
14.2
28.4
20.1
16.1
15.4
20.8
32.3
33.5
16.9
16.1
17.2
22.2
6.1
18.7
-20.8
37.8
4.2
47.0
13.9
4.8
Neutral
Sell
Sell
Neutral
Buy
Neutral
Neutral
Neutral
Buy
Buy
Buy
Neutral
467
377
762
174
367
380
1,143
127
282
165
206
1,586
511
340
697
168
420
459
1,070
113
305
195
259
1,262
9
-10
-9
-3
14
21
-6
-11
8
19
26
-20
48.3
22.6
20.4
8.8
40.7
43.0
42.5
14.8
19.3
16.4
11.4
96.7
36.7
26.3
33.7
11.0
29.5
36.0
46.8
10.2
27.9
17.4
8.6
108.9
43.5
29.8
46.5
13.1
32.6
40.0
51.9
11.8
30.1
19.7
17.6
118.8
Sell
Neutral
1,253
543
850
545
-32
0
10.0
9.0
14.8
10.3
20.7
12.1
Buy
Buy
Neutral
Buy
Neutral
Buy
Sell
Neutral
Neutral
Buy
Buy
Neutral
Buy
Neutral
Buy
531
905
244
980
126
767
484
576
543
657
1,681
2,491
395
286
830
600
960
235
1,200
140
850
450
600
540
740
1,607
2,350
465
270
1,020
13
6
-3
22
11
11
-7
4
0
13
-4
-6
18
-6
23
30.6
59.8
13.7
62.9
11.9
55.5
24.9
38.9
38.0
37.7
56.3
133.4
30.9
16.9
52.1
35.4
61.4
15.4
63.7
10.6
59.1
28.7
42.3
42.3
43.9
68.0
133.6
31.0
18.1
53.2
41.9
66.7
16.7
69.5
13.1
65.1
32.9
46.2
48.7
52.3
80.4
147.7
36.2
19.1
72.5
Buy
Buy
Buy
Buy
411
410
92
656
430
440
110
811
5
7
20
24
11.1
14.9
-1.1
26.0
5.9
17.2
-9.7
10.2
10.9
19.3
-11.2
30.8
Buy
Buy
Buy
262
899
67
315
1,140
85
20
27
27
14.9
51.9
3.9
17.6
78.6
3.2
18.6
86.0
3.1
24 July 2017
36

Company
NTPC
Power Grid
Tata Power
Aggregate
Others
Arvind
Avenue
Supermarts
Bata India
Castrol India
Century Ply.
Coromandel Intl
Delta Corp
Dynamatic Tech
Eveready Inds.
Interglobe
Indo Count
Info Edge
Inox Leisure
Jain Irrigation
Just Dial
Kaveri Seed
Kitex Garm.
Manpasand
MCX
Monsanto
Navneet
Education
PI Inds.
Piramal Enterp.
SRF
S H Kelkar
Symphony
TTK Prestige
V-Guard
Wonderla
Reco
Buy
Buy
Sell
CMP
(INR)
164
215
83
TP
% Upside
EPS (INR)
(INR) Downside FY17 FY18E FY19E
198
20
13.0
13.4
16.2
242
12
14.2
17.6
20.6
68
-18
5.2
6.4
6.7
P/E (x)
P/B (x)
FY17 FY18E FY17 FY18E
12.6
12.3
1.4
1.3
15.1
12.2
2.3
2.0
16.1
13.1
1.9
1.7
15.0
13.2
2.3
2.1
29.9
119.1
42.9
30.0
33.1
26.0
56.0
35.2
25.5
27.0
11.9
64.3
81.9
19.7
21.8
33.5
14.6
60.6
45.4
31.5
22.2
22.8
40.2
17.6
37.3
57.0
48.4
50.7
51.2
29.5
71.2
36.9
28.4
29.3
19.8
30.1
21.1
22.7
21.4
11.7
49.8
34.0
14.4
20.7
20.4
12.2
38.0
40.3
25.9
18.3
22.7
28.0
17.5
31.5
38.4
46.3
40.4
30.0
2.7
14.8
5.6
34.0
9.0
4.4
4.3
4.9
8.2
22.2
3.6
6.2
4.7
1.7
2.9
4.3
3.9
3.8
4.2
8.9
5.5
6.4
3.8
2.8
4.8
21.2
8.7
12.1
4.7
2.5
13.0
5.0
30.5
7.4
3.8
2.9
4.0
6.6
19.9
2.7
5.7
4.2
1.6
2.6
4.7
3.2
3.5
4.0
8.0
4.7
5.2
3.5
2.5
4.3
18.6
7.9
9.9
4.2
FY17
11.5
16.2
11.2
15.2
10.3
17.9
13.9
115.2
31.1
17.5
8.1
15.1
37.7
86.2
34.8
10.2
5.9
8.6
14.8
13.6
29.8
7.3
10.2
31.6
26.8
32.8
9.8
16.6
13.7
43.3
19.5
27.4
9.5
ROE (%)
FY18E
10.9
17.5
13.9
16.1
8.8
19.4
14.4
113.3
27.7
20.6
12.1
20.7
32.3
98.0
26.4
11.9
12.5
11.7
13.4
21.6
28.6
8.5
10.2
32.5
27.8
25.4
13.0
14.7
14.5
51.6
18.0
26.9
14.8
FY19E
12.3
17.8
12.1
16.8
11.8
23.3
15.8
106.1
29.6
21.6
11.5
24.3
31.6
136.2
23.5
12.3
16.2
14.8
13.7
26.0
27.6
13.5
14.5
34.5
28.2
23.8
16.4
16.7
15.6
54.5
20.7
28.8
17.5
Neutral
Neutral
Under Review
Buy
Neutral
Under Review
Buy
Buy
Buy
Neutral
Buy
Buy
Sell
Under Review
Neutral
Buy
Buy
Buy
Buy
Buy
Buy
Buy
Buy
Buy
Buy
Sell
Neutral
Neutral
Buy
370
914
580
410
288
433
171
2,380
328
1,242
155
1,008
273
109
381
638
270
769
1,128
2,718
172
761
2,916
1,512
270
1,349
6,387
181
358
359
804
-
527
323
-
215
3,334
368
1,283
200
1,050
240
-
465
755
394
927
1,300
3,295
226
952
3,044
1,816
287
1,288
5,281
167
393
-3
-12
29
12
26
40
12
3
29
4
-12
22
18
46
21
15
21
31
25
4
20
6
-5
-17
-8
10
12.4
7.7
13.5
13.6
8.7
16.6
3.1
67.6
12.9
46.0
13.0
15.7
3.3
5.5
17.5
19.1
18.6
12.7
24.8
86.2
7.8
33.4
72.6
85.9
7.2
23.7
132.1
3.6
7.0
12.5
12.8
15.7
14.4
9.8
21.8
5.7
112.9
14.4
57.9
13.2
20.3
8.0
7.6
18.5
31.3
22.1
20.3
28.0
105.1
9.4
33.4
104.1
86.3
8.6
35.1
137.8
4.5
11.9
18.1
17.9
19.4
15.0
12.9
26.1
7.2
166.7
17.5
91.6
15.4
22.9
12.0
10.0
21.1
37.7
26.2
30.9
42.2
126.7
11.3
38.1
144.6
109.2
10.3
42.9
176.1
6.0
16.0
24 July 2017
37

MOSL Universe stock performance
Company
Automobiles
Amara Raja
Ashok Ley.
Bajaj Auto
Bharat Forge
Bosch
CEAT
Eicher Mot.
Endurance Tech.
Escorts
Exide Ind
Hero Moto
M&M
Mahindra CIE
Maruti Suzuki
Tata Motors
TVS Motor
Banks - Private
Axis Bank
DCB Bank
Equitas Hold.
Federal Bank
HDFC Bank
ICICI Bank
IDFC Bank
IndusInd
J&K Bank
Kotak Mah. Bk
RBL Bank
South Indian
Yes Bank
Banks - PSU
BOB
BOI
Canara
IDBI Bk
Indian Bk
OBC
PNB
SBI
Union Bk
NBFCs
Bajaj Fin.
Bharat Fin.
Cholaman.Inv.&Fn
Dewan Hsg.
GRUH Fin.
HDFC
Indiabulls Hsg
L&T Fin.Holdings
LIC Hsg Fin
Manappuram
M&M Fin.
Muthoot Fin
PFC
Repco Home
REC
STF
Shriram City Union
1 Day (%)
0.7
-2.6
-0.1
0.1
-0.1
1.1
-1.2
0.5
-0.6
-0.8
-1.3
-0.7
0.0
0.5
1.0
-0.3
0.0
0.8
-0.4
-1.3
-0.3
0.2
-1.5
0.4
-0.7
1.9
-1.4
1.2
0.5
-0.1
2.4
-0.4
1.1
-0.5
0.7
0.9
-0.1
0.7
1.8
0.5
-0.4
-3.8
-1.4
-0.6
-1.8
0.1
-1.4
2.9
-1.2
-1.7
1.1
-1.7
-0.5
0.4
0.9
1M (%)
-0.4
10.1
-0.2
-2.8
-1.2
-1.1
4.7
-0.7
-8.7
-3.7
-2.4
-0.2
2.1
3.6
1.6
4.7
6.4
-6.5
7.5
0.4
0.2
3.5
5.7
4.9
-11.5
0.7
3.6
-3.1
10.2
-3.3
12.7
-0.7
3.8
9.5
1.1
8.2
0.1
2.1
14.3
8.5
1.8
-0.4
6.8
0.9
1.6
4.5
-4.2
11.7
2.5
-1.5
-1.4
-9.4
-1.3
-3.5
-2.3
12M (%)
-4.3
6.5
1.8
56.0
-1.9
110.6
46.6
161.2
24.1
12.7
-3.6
35.9
70.5
-5.3
90.1
0.4
95.5
-3.2
92.4
38.7
26.5
19.9
37.9
24.3
31.3
47.7
36.8
6.2
44.3
43.4
-17.7
122.0
33.5
27.8
28.7
18.1
85.7
2.3
13.7
110.4
63.6
23.2
59.4
104.3
47.3
39.7
11.6
64.8
23.8
-4.3
83.5
-17.5
23.2
Company
Capital Goods
ABB
Bharat Elec.
BHEL
Blue Star
CG Cons. Elec.
CG Power & Inds Sol.
Cummins
GE T&D
Havells
K E C Intl
L&T
Pennar Eng.
Siemens
Solar Ind
Suzlon Energy
Thermax
Va Tech Wab.
Voltas
Cement
Ambuja Cem.
ACC
Birla Corp.
Dalmia Bharat
Grasim Inds.
India Cem
J K Cements
JK Lakshmi Ce
Ramco Cem
Orient Cem
Prism Cem
Shree Cem
Ultratech
Consumer
Asian Paints
Britannia
Colgate
Dabur
Emami
Godrej Cons.
GSK Cons.
HUL
ITC
Jyothy Lab
Marico
Nestle
Page Inds
Parag Milk
Pidilite Ind.
P&G Hygiene
Prabhat Dairy
United Brew
United Spirits
Healthcare
Alembic Phar
Alkem Lab
Ajanta Pharma
Aurobindo
Biocon
1 Day (%)
0.2
-0.7
-1.0
3.1
-0.9
0.0
3.8
0.5
-0.3
-0.4
-0.6
-0.2
-0.4
1.7
3.5
-0.8
-0.4
1.4
1.2
-0.3
0.4
-0.4
-1.2
-0.2
0.3
0.0
-0.6
-1.8
-1.6
-1.0
0.9
-0.1
1.1
0.7
0.3
1.6
0.3
0.1
0.5
-0.4
1.3
1.1
-0.6
-0.2
2.6
0.7
0.4
-1.3
-0.7
0.3
-3.2
-1.5
-0.1
-0.4
-1.0
1M (%)
-3.0
1.3
6.3
6.1
-7.1
0.5
10.3
-3.9
-4.2
19.3
0.8
-7.7
2.1
9.3
2.4
-1.6
-16.8
6.5
10.2
3.5
4.7
4.1
12.3
-3.5
0.1
-6.4
-2.8
9.4
4.4
1.7
4.0
0.0
4.4
-3.0
5.2
-2.5
-1.8
1.9
3.1
-6.7
-0.1
4.1
0.7
3.0
16.6
-1.7
0.6
5.4
4.0
16.6
1.6
-5.2
-4.4
14.1
18.8
12M (%)
15.0
38.1
3.8
47.5
36.1
18.8
14.1
-7.9
26.7
109.4
13.7
-29.9
2.8
33.0
5.8
2.3
3.8
48.9
-0.3
0.6
73.5
96.3
29.9
82.0
39.3
10.7
19.4
-6.6
17.4
8.2
14.9
11.1
36.0
11.4
-0.5
-2.1
19.0
-15.0
27.3
15.1
32.4
18.6
-0.3
23.8
-23.6
10.3
27.3
41.8
4.5
14.0
-7.7
14.3
-9.6
-5.4
71.1
24 July 2017
38

MOSL Universe stock performance
Company
Cadila
Cipla
Divis Lab
Dr Reddy’s
Fortis Health
Glenmark
Granules
GSK Pharma
IPCA Labs
Jubilant Life
Lupin
Sanofi India
Sun Pharma
Syngene Intl
Torrent Pharma
Logistics
Allcargo Logistics
Blue Dart
Concor
Gateway Distriparks
Gati
Transport Corp.
Media
Dish TV
D B Corp
Den Net.
Hind. Media
HT Media
Jagran Prak.
PVR
Siti Net.
Sun TV
Zee Ent.
Metals
Hindalco
Hind. Zinc
JSPL
JSW Steel
Nalco
NMDC
SAIL
Vedanta
Tata Steel
Oil & Gas
BPCL
GAIL
Gujarat Gas
Gujarat St. Pet.
HPCL
IOC
IGL
MRPL
Oil India
ONGC
PLNG
Reliance Ind.
Retail
Jubilant Food
Titan Co.
1 Day (%)
0.1
-1.0
-3.2
0.5
4.1
-1.5
-2.4
-0.4
0.2
1.0
-2.0
-0.4
-0.9
-0.9
-0.3
-0.6
-0.7
-0.1
-1.6
-0.6
-1.2
-5.9
0.4
-0.1
1.1
-0.6
1.3
-1.3
-0.8
-2.7
3.0
0.2
-0.3
-3.1
-0.2
1.2
-0.6
-0.8
-0.6
-0.6
0.0
-0.4
-0.6
0.9
0.0
1.6
1.8
0.4
0.2
-0.8
-0.2
3.8
-3.5
2.5
1M (%)
1.4
4.7
11.9
2.8
-16.1
10.8
2.4
3.2
1.9
7.4
4.4
-3.4
9.2
4.3
6.3
0.8
4.0
-0.8
2.9
-7.4
5.2
-0.7
0.0
-6.1
4.1
3.9
-4.0
-13.8
-13.8
-5.0
9.9
9.0
12.6
9.6
7.1
12.2
10.1
9.1
12.6
6.8
7.1
2.4
-4.1
5.4
4.1
-6.8
4.8
2.0
-1.7
-0.4
-7.3
11.9
35.2
3.9
12M (%)
41.7
9.8
-39.0
-23.7
-9.2
-18.1
-1.3
-25.0
-0.8
132.6
-32.2
-7.6
-27.4
12.7
-12.7
-5.4
-25.4
2.3
-6.0
-28.8
50.5
-20.7
-7.4
-10.0
3.8
7.9
-2.6
25.0
-31.3
97.8
22.4
60.4
45.0
101.9
33.1
48.4
27.8
33.6
70.6
52.5
21.5
28.6
36.8
36.4
42.4
46.4
86.5
58.3
0.4
10.9
41.0
57.6
9.7
33.0
Company
Technology
Cyient
HCL Tech.
Hexaware
Infosys
KPIT Tech
L&T Infotech
Mindtree
Mphasis
NIIT Tech
Persistent Sys
Tata Elxsi
TCS
Tech Mah
Wipro
Zensar Tech
Telecom
Bharti Airtel
Bharti Infratel
Idea Cellular
Tata Comm
Utiltites
Coal India
CESC
JSW Energy
NTPC
Power Grid
Tata Power
Others
Arvind
Avenue Super.
Bata India
Castrol India
Century Ply.
Coromandel Intl
Delta Corp
Dynamatic Tech
Eveready Inds.
Interglobe
Indo Count
Info Edge
Inox Leisure
Jain Irrigation
Just Dial
Kaveri Seed
Kitex Garm.
Manpasand
MCX
Monsanto
Navneet Educat.
PI Inds.
Piramal Enterp.
SRF
S H Kelkar
Symphony
TTK Prestige
V-Guard
Wonderla
1 Day (%)
1.8
2.2
-0.6
1.1
-2.5
-2.1
-0.1
-0.1
-0.6
-0.1
-0.6
1.9
0.9
6.5
2.2
-2.0
1.1
-3.1
-1.7
2.7
0.0
2.2
-0.6
-1.6
0.7
-2.6
0.6
1.4
1.1
0.3
0.8
5.2
-0.5
-1.4
0.0
-2.6
-1.7
5.6
-0.3
0.8
-1.3
-1.2
3.4
2.5
0.6
-1.4
-0.4
-1.0
-0.2
-0.5
3.3
-0.2
-0.4
0.3
1M (%)
4.6
7.2
-5.6
3.8
2.6
-7.1
-6.9
-3.1
-6.4
-3.6
3.9
3.5
1.0
11.9
-4.7
12.3
10.4
13.9
-12.8
4.6
0.1
3.6
2.8
4.6
1.8
-3.3
11.7
9.8
-1.4
-4.1
0.5
3.3
-5.0
-7.0
-0.6
-16.2
3.7
-3.4
1.0
-6.7
0.4
-2.4
-4.4
2.6
-2.9
-6.8
-6.1
1.5
-7.4
-5.6
-0.1
-3.6
-1.4
-4.8
12M (%)
9.2
24.8
10.5
-9.3
-7.6
10.0
-14.6
6.3
16.5
3.5
1.2
-0.4
-21.6
5.7
-17.9
12.1
16.5
-12.8
43.7
-21.3
51.2
-16.1
6.1
32.4
17.7
19.7
2.7
-0.4
25.5
85.1
89.5
-7.0
23.9
31.2
-12.2
17.9
8.0
55.7
-31.8
59.8
-22.5
9.9
10.2
10.1
84.1
2.9
81.4
10.7
15.8
13.2
34.9
79.8
-10.9
24 July 2017
39

NOTES
24 July 2017
40

THEMATIC/STRATEGY RESEARCH GALLERY

REPORT GALLERY
RECENT INITIATING COVERAGE REPORTS
Rs

DIFFERENTIATED PRODUCT GALLERY

Disclosures
This document has been prepared by Motilal Oswal Securities Limited (hereinafter referred to as Most) to provide information about the company (ies) and/sector(s), if any, covered in the report and may be distributed by it and/or its
affiliated company(ies). This report is for personal information of the selected recipient/s and does not construe to be any investment, legal or taxation advice to you. This research report does not constitute an offer, invitation or
inducement to invest in securities or other investments and Motilal Oswal Securities Limited (hereinafter referred as MOSt) is not soliciting any action based upon it. This report is not for public distribution and has been furnished to
you solely for your general information and should not be reproduced or redistributed to any other person in any form. This report does not constitute a personal recommendation or take into account the particular investment
objectives, financial situations, or needs of individual clients. Before acting on any advice or recommendation in this material, investors should consider whether it is suitable for their particular circumstances and, if necessary, seek
professional advice. The price and value of the investments referred to in this material and the income from them may go down as well as up, and investors may realize losses on any investments. Past performance is not a guide for
future performance, future returns are not guaranteed and a loss of original capital may occur.
MOSt and its affiliates are a full-service, integrated investment banking, investment management, brokerage and financing group. We and our affiliates have investment banking and other business relationships with a some
companies covered by our Research Department. Our research professionals may provide input into our investment banking and other business selection processes. Investors should assume that MOSt and/or its affiliates are
seeking or will seek investment banking or other business from the company or companies that are the subject of this material and that the research professionals who were involved in preparing this material may educate investors
on investments in such business . The research professionals responsible for the preparation of this document may interact with trading desk personnel, sales personnel and other parties for the purpose of gathering, applying and
interpreting information. Our research professionals are paid on twin parameters of performance & profitability of MOSt.
MOSt generally prohibits its analysts, persons reporting to analysts, and members of their households from maintaining a financial interest in the securities or derivatives of any companies that the analysts cover. Additionally, MOSt
generally prohibits its analysts and persons reporting to analysts from serving as an officer, director, or advisory board member of any companies that the analysts cover. Our salespeople, traders, and other professionals or affiliates
may provide oral or written market commentary or trading strategies to our clients that reflect opinions that are contrary to the opinions expressed herein, and our proprietary trading and investing businesses may make investment
decisions that are inconsistent with the recommendations expressed herein. In reviewing these materials, you should be aware that any or all of the foregoingamong other things, may give rise to real or potential conflicts of interest.
MOSt and its affiliated company(ies), their directors and employees and their relatives may; (a) from time to time, have a long or short position in, act as principal in, and buy or sell the securities or derivatives thereof of companies
mentioned herein. (b) be engaged in any other transaction involving such securities and earn brokerage or other compensation or act as a market maker in the financial instruments of the company(ies) discussed herein or act as an
advisor or lender/borrower to such company(ies) or may have any other potential conflict of interests with respect to any recommendation and other related information and opinions.; however the same shall have no bearing
whatsoever on the specific recommendations made by the analyst(s), as the recommendations made by the analyst(s) are completely independent of the views of the affiliates of MOSt even though there might exist an inherent
conflict of interest in some of the stocks mentioned in the research report Reports based on technical and derivative analysis center on studying charts company's price movement, outstanding positions and trading volume, as
opposed to focusing on a company's fundamentals and, as such, may not match with a report on a company's fundamental analysis. In addition MOST has different business segments / Divisions with independent research
separated by Chinese walls catering to different set of customers having various objectives, risk profiles, investment horizon, etc, and therefore may at times have different contrary views on stocks sectors and markets.
Unauthorized disclosure, use, dissemination or copying (either whole or partial) of this information, is prohibited. The person accessing this information specifically agrees to exempt MOSt or any of its affiliates or employees from,
any and all responsibility/liability arising from such misuse and agrees not to hold MOSt or any of its affiliates or employees responsible for any such misuse and further agrees to hold MOSt or any of its affiliates or employees free
and harmless from all losses, costs, damages, expenses that may be suffered by the person accessing this information due to any errors and delays. The information contained herein is based on publicly available data or other
sources believed to be reliable. Any statements contained in this report attributed to a third party represent MOSt’s interpretation of the data, information and/or opinions provided by that third party either publicly or through a
subscription service, and such use and interpretation have not been reviewed by the third party. This Report is not intended to be a complete statement or summary of the securities, markets or developments referred to in the
document. While we would endeavor to update the information herein on reasonable basis, MOSt and/or its affiliates are under no obligation to update the information. Also there may be regulatory, compliance, or other reasons that
may prevent MOSt and/or its affiliates from doing so. MOSt or any of its affiliates or employees shall not be in any way responsible and liable for any loss or damage that may arise to any person from any inadvertent error in the
information contained in this report. MOSt or any of its affiliates or employees do not provide, at any time, any express or implied warranty of any kind, regarding any matter pertaining to this report, including without limitation the
implied warranties of merchantability, fitness for a particular purpose, and non-infringement. The recipients of this report should rely on their own investigations.
This report is intended for distribution to institutional investors. Recipients who are not institutional investors should seek advice of their independent financial advisor prior to taking any investment decision based on this report or for
any necessary explanation of its contents.
Most and it’s associates may have managed or co-managed public offering of securities, may have received compensation for investment banking or merchant banking or brokerage services, may have received any compensation
for products or services other than investment banking or merchant banking or brokerage services from the subject company in the past 12 months.
Most and it’s associates have not received any compensation or other benefits from the subject company or third party in connection with the research report.
Subject Company may have been a client of Most or its associates during twelve months preceding the date of distribution of the research report
MOSt and/or its affiliates and/or employees may have interests/positions, financial or otherwise of over 1 % at the end of the month immediately preceding the date of publication of the research in the securities mentioned in this
report. To enhance transparency, MOSt has incorporated a Disclosure of Interest Statement in this document. This should, however, not be treated as endorsement of the views expressed in the report.
Motilal Oswal Securities Limited is registered as a Research Analyst under SEBI (Research Analyst) Regulations, 2014. SEBI Reg. No. INH000000412
Pending Regulatory inspections against Motilal Oswal Securities Limited:
SEBI pursuant to a complaint from client Shri C.R. Mohanraj alleging unauthorized trading, issued a letter dated 29th April 2014 to MOSL notifying appointment of an Adjudicating Officer as per SEBI regulations to hold inquiry and
adjudge violation of SEBI Regulations; MOSL replied to the Show Cause Notice whereby SEBI granted us an opportunity of Inspection of Documents. Since all the documents requested by us were not covered we have requested to
SEBI vide our letter dated June 23, 2015 to provide pending list of documents for inspection.
List of associate companies of Motilal Oswal Securities Limited -Click
here to access detailed report
Analyst Certification
The views expressed in this research report accurately reflect the personal views of the analyst(s) about the subject securities or issues, and no part of the compensation of the research analyst(s) was, is, or will be directly or
indirectly related to the specific recommendations and views expressed by research analyst(s) in this report. The research analysts, strategists, or research associates principally responsible for preparation of MOSt research receive
compensation based upon various factors, including quality of research, investor client feedback, stock picking, competitive factors and firm revenues
Disclosure of Interest Statement
Analyst ownership of the stock
Served as an officer, director or employee
Companies where there is interest
No
No
A graph of daily closing prices of securities is available at www.nseindia.com and http://economictimes.indiatimes.com/markets/stocks/stock-quotes
Regional Disclosures (outside India)
This report is not directed or intended for distribution to or use by any person or entity resident in a state, country or any jurisdiction, where such distribution, publication, availability or use would be contrary to law, regulation or which
would subject MOSt& its group companies to registration or licensing requirements within such jurisdictions.
For Hong Kong:
This report is distributed in Hong Kong by Motilal Oswal capital Markets (Hong Kong) Private Limited, a licensed corporation (CE AYY-301) licensed and regulated by the Hong Kong Securities and Futures
Commission (SFC) pursuant to the Securities and Futures Ordinance (Chapter 571 of the Laws of Hong Kong) “SFO”. As per SEBI (Research Analyst Regulations) 2014 Motilal Oswal Securities (SEBI Reg No. INH000000412) has
an agreement with Motilal Oswal capital Markets (Hong Kong) Private Limited for distribution of research report in Kong Kong. This report is intended for distribution only to “Professional Investors” as defined in Part I of Schedule 1 to
SFO. Any investment or investment activity to which this document relates is only available to professional investor and will be engaged only with professional investors.” Nothing here is an offer or solicitation of these securities,
products and services in any jurisdiction where their offer or sale is not qualified or exempt from registration. The Indian Analyst(s) who compile this report is/are not located in Hong Kong & are not conducting Research Analysis in
Hong Kong.
Motilal Oswal Securities Limited (MOSL) is not a registered broker - dealer under the U.S. Securities Exchange Act of 1934, as amended (the"1934 act") and under applicable state laws in the United States. In addition MOSL is not a
registered investment adviser under the U.S. Investment Advisers Act of 1940, as amended (the "Advisers Act" and together with the 1934 Act, the "Acts), and under applicable state laws in the United States. Accordingly, in the
absence of specific exemption under the Acts, any brokerage and investment services provided by MOSL, including the products and services described herein are not available to or intended for U.S. persons.
This report is intended for distribution only to "Major Institutional Investors" as defined by Rule 15a-6(b)(4) of the Exchange Act and interpretations thereof by SEC (henceforth referred to as "major institutional investors"). This
document must not be acted on or relied on by persons who are not major institutional investors. Any investment or investment activity to which this document relates is only available to major institutional investors and will be
engaged in only with major institutional investors. In reliance on the exemption from registration provided by Rule 15a-6 of the U.S. Securities Exchange Act of 1934, as amended (the "Exchange Act") and interpretations thereof by
the U.S. Securities and Exchange Commission ("SEC") in order to conduct business with Institutional Investors based in the U.S., MOSL has entered into a chaperoning agreement with a U.S. registered broker-dealer, Motilal Oswal
Securities International Private Limited. ("MOSIPL"). Any business interaction pursuant to this report will have to be executed within the provisions of this chaperoning agreement.
The Research Analysts contributing to the report may not be registered /qualified as research analyst with FINRA. Such research analyst may not be associated persons of the U.S. registered broker-dealer, MOSIPL, and therefore,
may not be subject to NASD rule 2711 and NYSE Rule 472 restrictions on communication with a subject company, public appearances and trading securities held by a research analyst account.
For Singapore
Motilal Oswal Capital Markets Singapore Pte Limited is acting as an exempt financial advisor under section 23(1)(f) of the Financial Advisers Act(FAA) read with regulation 17(1)(d) of the Financial Advisors Regulations and is a
subsidiary of Motilal Oswal Securities Limited in India. This research is distributed in Singapore by Motilal Oswal Capital Markets Singapore Pte Limited and it is only directed in Singapore to accredited investors, as defined in the
Financial Advisers Regulations and the Securities and Futures Act (Chapter 289), as amended from time to time.
In respect of any matter arising from or in connection with the research you could contact the following representatives of Motilal Oswal Capital Markets Singapore Pte Limited:
Varun Kumar
Varun.kumar@motilaloswal.com
Contact : (+65) 68189232
Office Address:21 (Suite 31),16 CollyerQuay,Singapore 04931
For U.S
13 December 2016
Motilal Oswal Tower, Level 9, Sayani Road, Prabhadevi, Mumbai 400 025
Phone: +91 22 3982 5500 E-mail: reports@motilaloswal.com
Motilal Oswal Securities Ltd
20