25 July 2017
Motilal Oswal values your support in the
Asiamoney Brokers Poll 2017 for India
Research, Sales and Trading team.
We
request your ballot.
Today’s top research theme
THEMATIC | Radio: Well tuned to flourish
v
Over the past 18 months, the Indian radio industry has witnessed a 66% increase in
the number of channels to reach 407, led by phase-III auctions and phase-II license
renewals. This is likely to drive radio industry revenue CAGR of 16% over CY16-21E,
~1.4x of traditional media (ex-digital). Also, despite the evolution of the digital
medium, radio remains a stable advertising medium globally, backed by its localized
and interactive content.
v
Entertainment Network India Limited (ENIL)/Music Broadcast’s (MBL) with market
shares of 30%/14% have strong execution capabilities. Inventory addition should help
ENIL/MBL to record revenue growth of 16%/15% and EBITDA CAGR of 30%/20% over
FY17-20. RoIC too will improve to 20%/25% by FY20, led by improving EBITDA margins
and asset turns. Overall, their FCF yield should improve to ~5% by FY20.
v
We initiate coverage on ENIL with a Neutral rating and a TP of INR 928, assigning 20x
on FY19E EBITDA of INR2.1b. We initiate coverage on MBL with Buy rating and a TP of
INR 469, assigning 18x EV/EBITDA on FY19E EBITDA of INR1.3b.
Market snapshot
Equities - India
Close
Chg .%
Sensex
32,246
0.7
Nifty-50
9,966
0.5
Nifty-M 100
18,304
0.2
Equities-Global
Close
Chg .%
S&P 500
2,470
-0.1
Nasdaq
6,411
0.4
FTSE 100
7,378
-1.0
DAX
12,209
-0.3
Hang Seng
10,821
0.3
Nikkei 225
19,976
-0.6
Commodities
Close
Chg .%
Brent (US$/Bbl)
48
1.8
Gold ($/OZ)
1,257
0.7
Cu (US$/MT)
5,995
0.4
Almn (US$/MT)
1,891
-0.1
Currency
Close
Chg .%
USD/INR
64.3
0.0
USD/EUR
1.2
0.0
USD/JPY
110.7
-0.9
YIELD (%)
Close
1MChg
10 Yrs G-Sec
6.4
0.0
10 Yrs AAA Corp
7.5
0.0
Flows (USD b)
24-Jul
MTD
FIIs
-0.1
0.2
DIIs
0.1
0.4
Volumes (INRb)
24-Jul
MTD*
Cash
306
287
F&O
5,488
5,501
Note: YTD is calendar year, *Avg
YTD.%
21.1
21.8
27.5
YTD.%
10.3
19.1
3.3
6.3
15.2
4.5
YTD.%
-13.0
8.4
8.5
10.9
YTD.%
-5.2
10.4
-5.4
YTDchg
-0.1
-0.1
YTD
8.6
3.7
YTD*
286
4,978
Research covered
Cos/Sector
Radio
HDFC Bank
Avenue Supermarts
Zee Entertainment
Ambuja Cement
Indiabulls Hsg Fin
United Spirits
Ashok Leyland
Cummins India
Info Edge
D B Corp
J&K Bank
Metals Weekly
Results Flash
Results Expectation
Key Highlights
(Thematic) Well tuned to flourish
Stellar performance on all fronts
Results in-line; geographical expansion to drive growth
Ad performance in-line
Sharp pricing improvement drives multi-year-high EBITDA/t
Strong growth, stable performance overall
Highway alcohol sale ban to impact volumes over coming quarters
Higher staff cost, one-off costs, negative operating leverage hurt EBITDA margin
Infrastructure spend to drive domestic growth
Ahead of estimates, but uncertainty clouds near term
In-line quarter; maintain estimates and target price
Balance sheet clean-up phase
Chinese export steel prices continue to trend higher
BHIN| MMFS | TCOM | LTI | DELTA
APNT | AXSB | BHARTI | GETD | GLXO | HMCL | PIDI | VEDL
Piping hot news
DoT, Finance Ministry to ease burden of debt-laden telecom sector
v
The Department of Telecommunications (DoT) and the finance ministry have
broadly agreed on relief measures for the debt-laden telecom sector…
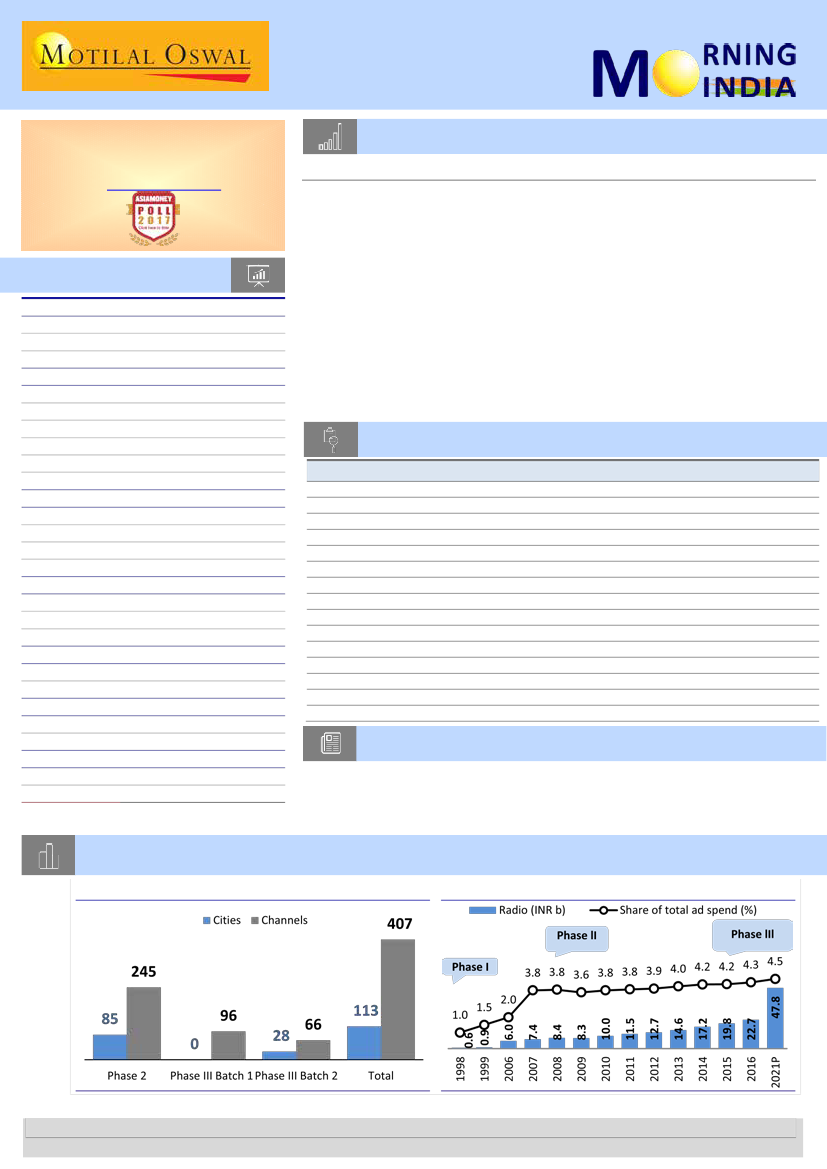
Chart of the Day: Radio – Well tuned to flourish
Phase-III –Total number of channels increased by two thirds
Strong growth expected with addition of new licenses
Research Team (Gautam.Duggad@MotilalOswal.com)
Motilal Oswal research is available on www.motilaloswal.com/Institutional-Equities, Bloomberg, Thomson Reuters, Factset and S&P Capital.
Investors are advised to refer through important disclosures made at the last page of the Research Report.

In the news today
Kindly click on textbox for the detailed news link
1
ITC increased cigarette prices by 4-
8% on Monday, a week after the
GST Council imposed a cess to
make up for lower tax incidence
under the new regime on a class
of goods tagged as sin products.
Premium brands like Classic and
Gold Flake Kings have…
2
Tax base widens to 6.26 cr in 2016-17: CBDT
Income taxpayer base moved up substantially to 6.26 crore at the end of
the last fiscal, from nearly 4 crore earlier, CBDT Chairman Sushil Chandra
said today. Clearing the air on disclosure of bank account details of non-
resident Indians (NRIs), expats, as well as foreigners with investments in
private equity in India, Chandra also said that such accounts need to be
disclosed only when a refund is due to the assessee...
ITC increases prices of
cigarette by 4-8% as a result of
higher tax
3
IMF keeps India GDP growth
forecast unchanged at 7.2% for
2017-18
IMF’s World Economic Outlook
report has predicted India GDP
growth rate at 7.2% for 2017-18
and 7.7% for 2018-19, even as it
sees World GDP growth rate at
3.5% in 2017 and 3.6% in 2018…
4
Reliance Jio row: Bharti Airtel
chief Sunil Mittal questions
Trai over IUC on international
calls
5
Indian Overseas Bank, Central
Bank of India downgraded by
Moody’s, says Centre’s
support likely lower than
assumed
Even as the Trai and the
incumbent telcos are locked in an
intense debate over interconnect
usage charge for domestic calls,
Sunil Bharti Mittal, chairman of
Bharti Group, has pointed that the
regulator not debating IUC for
international calls means…
6
SEBI may curb excessive
derivative speculation to boost
tax collection
Capital market regulator SEBI is
seeking major changes to the
structure of equity trading in
India, evidently driven by the
government’s recent realisation
that it may be losing chunks of tax
revenues due to a high
concentration of equity trading
volumes in the derivative
segment…
25 July 2017
7
Indian Railways station
redevelopment scheme to
offer over 144 acres of land to
developers
The Indian Railways, under its
massive station redevelopment
programme, is set to offer more
than 144 acres of land with its 23
stations for commercial
development...
Moody’s Investors Service on
Monday downgraded long-term
bank deposit ratings of two public
sector banks and said that the
introduction of policies like the
Financial Resolution and Deposit
Insurance Bill suggests that the
extent of the government’s …
2

Radio| Well tuned to flourish
Radio
Well tuned to flourish
n
n
n
Radio industry to grow at ~16%
next 5 years
Radio (INR b)
60
40
20
0
Growth
30%
20%
10%
0%
-10%
n
n
Over the past 18 months, the Indian radio industry has witnessed a 66% increase in the
number of channels to reach 407, led by phase-III auctions and phase-II license
renewals. The launch of these channels over the last six months is likely to drive radio
industry revenue CAGR of 16% over CY16-21E, ~1.4x of traditional media (ex-digital).
Despite the evolution of the digital medium, radio remains a stable advertising medium
globally, backed by its localized and interactive content. Notably, radio operators have
introduced digital radio to mitigate the risk of losing share to digital medium. We
believe the radio listenership base in India is likely to increase going forward, driven by
(i) wider footprint and (ii) phase-III-led content differentiation avenues.
Entertainment Network India Limited (ENIL)/Music Broadcast’s (MBL) heavy upfront
investment of INR7.1b/3.4b in phase-III auctions and phase II renewals led to single-
digit return ratios in FY17. However, ENIL/MBL are expected to reach RoIC of 20%/25%
by FY20, led by improving EBITDA margins and asset turns.
Large operators like ENIL/MBL with market shares of 30%/14% have strong execution
capabilities. Inventory addition should help ENIL/MBL to record revenue growth of
16%/15% and EBITDA CAGR of 30%/20% over FY17-20.
We initiate coverage on ENIL with a Neutral rating and a TP of INR 928, assigning 20x
on FY19E EBITDA of INR2.1b, led by its healthy growth and market leadership. We
initiate coverage on MBL with Buy rating and a TP of INR 469, assigning 18x EV/EBITDA
on FY19E EBITDA of INR1.3b, as we believe the company should improve its market
share led by an increasing listenership base.
Asset monetization phase to improve sector RoIC
Phase-III opens up growth opportunities
The Indian radio industry has witnessed significant inventory (advertising time)
growth over the past 18 months. Notably, over this period, the number of radio
channels in the country increased 66% to 407 from 245, while the total number of
cities with presence of private FM operators has grown to 113 from 85. This has led
to steady growth in advertising time in an otherwise inventory-starved radio
industry. Additionally, the renewal of Phase-II licenses in FY16 for 15 years has
provided much-needed clarity on long-term business continuity and mitigated the
risk of high license cost. Also, we note that the radio industry’s current share of
India’s overall ad pie at ~4% has grown from 1.5% during the Phase-I period. The
new frequencies should increase the ad share further, helping catch up with the
world average of 7% and the US’ 11% (ex-digital). With significant inventory
addition, radio (market size of INR23b in CY16) is likely to emerge as the fastest
growing ad market (+16%, 1.4x of the traditional ad market, over CY16-21E, ex-
digital) in India.
Well tuned to flourish
Radio:
Digital unlikely to hurt radio market
+91 22 2261291565
Al i asgar.shakir@MotilalOswal.com
Please click here for video
link
25 July 2017
Radio is largely associated with music/songs in India. With the advent of various
digital platforms, IPods/MP3 players, etc., it was widely expected that the need to
listen to radio would reduce over time. However, we note that radio listenership
and ad market has grown consistently, with radio operators bringing in interactive
RJ talk shows, local city updates and other interesting programs to the table, giving
listeners a feeling of two-way communication. A similar trend is observed globally –
3

Content Differentiation and
Interactive medium
provides radio an edge over
digital media
radio remains a stable advertising medium in most developed markets, despite the
advent of the digital platforms (~7% share of the total ad pie). We believe that the
radio listenership base is likely to improve in India, with (i) an increase in the
number of cities under radio coverage and (ii) content differentiation (multiple
frequencies, allowance of news/current affairs). Also, with increasing internet
penetration, radio operators have started introducing digital radio (offering music of
different genre, mood, artist and time period). We note that due to the lack of
listeners and a viable revenue model in the digital medium, radio operators for now
are only offering limited content (music). However, as digital medium evolves, we
believe the operators should expand their offering to include localized content, RJ
talks, etc., to de-risk their businesses.
ENIL, MBL: Strong execution capability, leadership position to drive
industry-leading revenue growth
CAGR FY17-
20E
Revenue
EBITDA
PAT
ENIL
(%)
16
30
43
MBL
(%)
15
20
41
Entertainment Network India Limited (ENIL) and Music Broadcast (MBL) remain the
top two players in the radio space, with market shares of 30% and 14%, respectively.
At 13% and 17%, ENIL and MBL’s revenue growth has remained resilient over the
last five years. ENIL added 42 stations over the last two years to be the largest
operator with 73 channels (excluding three Oye FM stations), while MBL added 11
channels to take its total channel count to 39. Fresh inventory with the launch of
new channels is likely to help ENIL/MBL record revenue growth of 16%/15% over
the next three years (FY17-20E). Additionally, operating leverage from an inherent
fixed cost structure and networking of new channels are expected to drive profit
margins. We thus expect EBITDA/PAT CAGR (FY17-20) of 30%/43% for ENIL and
20%/41% for MBL.
Heavy lifting concluded; asset monetization mode (RoIC, FCF)
Phase-III has seen overall INR13b cumulative investment in upfront license cost,
which is ~60% of the private FM market size. ENIL and MBL have spent >INR7b and
INR3.4b, respectively, toward Phase-III license acquisition, set-up cost and renewal
of Phase-II licenses (i.e. nearly 60-70% of their balance sheet size). This has resulted
in their RoCE and RoEs plummeting from average 20-25% to currently below cost of
capital. However, incremental maintenance capex should be a meager INR50-60m,
driving steep FCF and RoIC growth. We expect ENIL and MBL to reach RoIC of
20%/25% by FY20, led by improving EBITDA margins and asset turns. Also, their FCF
yield should improve to ~5%, with FCF generation of INR4.3b for ENIL and INR2.6b
for MBL over the next three years (FY17-20).
Meagre incremental
maintenance capex will
drive FCF and RoIC growth
post the huge investments
in phase III
FCF and PAT growth for ENIL
FCF growth
PAT growth (%)
Valuation: ENIL (Neutral); MBL (Buy) – it’s a three-year story
Global radio companies with low-single-digit growth garner ~10-12x EV/EBITDA on a
one-year forward basis. At current price, ENIL is trading at EV/EBITDA of 25x/20x
and P/E of 70x/45x for FY18E/19E. The company’s strong execution capability is
evident from its intact leadership position (30% market share over the last 10 years),
despite operating in a homogeneous product market. We assign 20x on FY19E
EBITDA of INR2.1b, arriving at a target price of 928, which is 2% above CMP. We
initiate coverage with a
Neutral
recommendation. ENIL is expected to witness
super-normal growth over FY18-20, RoIC recovery to ~20% and high FCF generation
25 July 2017
4

with FCF yield of 5%. Subsequently, if we assign 15x EV/EBITDA on weighted-average
1QFY22E EBITDA of INR3.6b, we arrive at a target price of 1,270/share. Including the
valuation of the three ‘Oye’ FM stations (which may be acquired by March’18) of
INR51/share, the combined TP is INR 1,321, implying 45% upside over a three-year
period (+15% annually). We think the current price captures large portion of ENIL’s
growth potential.
MBL is trading at EV/EBITDA of 13x/10x and P/E of 22x/17x for FY18/19E. The
company is trading at ~30-35% discount to ENIL in terms of FY19E EV/EBITDA,
despite its healthy growth and RoIC/FCF potential. We believe there is strong
likelihood of shrinking of this discount. We value the company at 18x EV/EBITDA on
FY19E EBITDA of INR1.3b, arriving at a TP of INR469/share, ~29% upside from the
CMP of INR365. We initiate coverage with
Buy.
The high multiple is provided to
capture the super-normal EBITDA/PAT CAGR opportunity of 20%/41% over the next
three years (FY17-20). MBL’s growth is a three-year story, as RoIC is likely to recover
from current 13% to 25% over the next three years. Subsequently, if we assign 15x
EV/EBITDA on weighted average 1QFY22E EBITDA of INR1.9b, we arrive at a TP of
626/share, implying 72% upside over a three-year period.
25 July 2017
5

24 July 2017
1QFY18 Results Update | Sector: Financials
HDFC Bank
Buy
BSE SENSEX
32,246
Bloomberg
Equity Shares (m)
M.Cap.(INRb)/(USDb)
52-Week Range (INR)
1, 6, 12 Rel. Per (%)
Avg Val, INRm
Free float (%)
S&P CNX
9,966
CMP: INR1,735
TP: INR2,000(+15%)
HDFCB IN
Stellar performance on all fronts
2,553
n
HDFCB’s 1QFY18 PAT grew 20% YoY (2% miss) to INR38.9b, driven by 29%
3,236.6 / 47.5
YoY PPoP growth (3% beat), partly offset by provisions. HDFCB delivered
1318 / 929
robust loan growth, strong cost control, QoQ improvement in margins and
2/5/11
best-in-class asset quality.
1782
78.7
n
Loans grew 5% QoQ and 23% YoY to INR5.81t. Incremental growth in
2020E
576.0
464.5
253.6
4.5
99.0
20.5
527.1
522.4
20.2
1.8
23.4
17.5
3.3
3.3
1.1
Financials & Valuations (INR b)
Y/E MARCH
2018E 2019E
NII
400.9 479.4
OP
321.7 387.3
NP
174.8 210.4
NIM (%)
4.7
4.6
EPS (INR)
68.2
82.1
EPS Gr. (%)
20.2
20.4
BV/Sh. (INR)
388.2 451.2
ABV/Sh. (INR)
381.7 447.8
RoE (%)
18.8
19.6
RoA (%)
1.8
1.8
Payout (%)
23.4
23.4
Valuations
P/E(X)
25.4
21.1
P/BV (X)
4.5
3.8
P/ABV (X)
4.5
3.9
Div. Yield (%)
0.8
0.9
n
n
n
n
1QFY18 was driven by retail loans (75% incremental share; 66% of overall
loans). In retail loans (+3.5% QoQ, +25% YoY), the main drivers were
business banking/personal loans, which grew 8%/11% QoQ and 27%/37%
YoY.
Fee income picked up in the quarter (+30% YoY). However, adjusted for one-
off fee income from OMCs and exceptionally strong credit card sales, fee
income growth came in at ~18%-20%.
CASA growth was strong at 29% YoY, led by 26% YoY SA growth and 34% YoY
CA growth. CASA ratio stood at 44%, down 400bp from one-off high of 48%
in 4QFY17.
Asset quality stays robust, with
NSL at 54bp.
However, HDFCB incurred
increased provisioning for NPAs resulting from farm loan waivers and also
from additional provisions created against stressed sectors.
Valuation and view:
HDFCB is well positioned in the current environment,
with 44% CASA ratio, opportunities for significant loan market share gains
and least asset quality risk. With tier 1 capital of 13.6%, strong capacity amid
the moderate growth cycle and significant digitization initiatives, the bank is
well placed to benefit from the expected pick-up in the economic growth
cycle. RoE is expected to be ~19-20% in FY18-20.
We arrive at an SOTP-
based valuation of INR2,000 for the bank (4x June 2019E BV for the bank at
INR1,900 and INR100 for subsidiaries) and maintain Buy.
25 July 2017
6

RESULTS
FLASH
Bharti Infratel
BSE SENSEX
32,246
S&P CNX
9,966
24 July 2017
Results Flash | Sector: Telecom
CMP: INR406
n
n
n
n
n
n
n
n
n
n
n
n
n
TP: INR435
Buy
We will revisit our estimates
post earnings call/management
interaction.
Rental revenue/EBITDA up 3.5%/5.5% QoQ
Pro forma consolidated revenue rose 10% YoY (flat QoQ) to INR35.2b, missing
estimate by 2%.
Pro forma consolidated rental revenue remained steady at INR22.6b (+9.8%
YoY, +3.5% QoQ), marginally above estimate.
Energy revenue declined 5.4% QoQ (+10% YoY) to INR12.6b, a seasonal trend
but it missed estimate by 6%.
Consolidated co-location at 218,401 rose 11% YoY (+4% QoQ), 1% above
estimate.
Colocation adds stood at 7,795, significantly higher than est. of +5,536 and also
+5,673 in the last quarter.
We expect co-location adds to remain high over the next four quarters, given
telcos’ healthy data rollout plans.
Total number of towers stood at 90,837 (+192 QoQ).
Consolidated EBITDA rose 12.9% YoY (+0.2% QoQ) to INR15.8b, 2.8% ahead of
estimate of INR15.3b, due to better-than-expected rental EBITDA.
Consolidated EBITDA margin of 44.7% expanded 125bp YoY (flat QoQ; ~200bp
ahead of our estimate).
Rental EBITDA at INR15.2b was up 11.7% YoY (+5.5% QoQ), with rental margin
up 130bp QoQ to 67%.
Energy EBITDA at INR600m was up 54% YoY (-56% QoQ), with energy margin at
4.7% (+140bp YoY, -550bp QoQ).
Capex stood at INR5.7b v/s our full-year estimate of INR17b.
PAT of INR6.6b dropped 12.2% YoY (+11.3% QoQ), largely due to high taxes.
Conference Call Details
Date:
25
th
July 2017
Time:
02:30pm IST
Dial-in details:
+91-22-4444 9999
Financial Snapshot (INR Billion)
Y/E March
FY17 FY18E FY19E
Net Sales
134.2 146.6 159.4
EBITDA
59.0 66.1 71.1
NP
27.5 33.4 37.7
EPS (INR)
14.9 18.0 20.4
EPS Gr. (%)
25.3 21.5 12.9
BV/Sh. (INR)
83.7 97.0 112.7
RoE (%)
16.2 20.0 19.4
RoCE (%)
13.2 14.8 14.1
Payout (%)
125.0 25.7 22.8
Valuations
P/E (x)
27.3 22.5 19.9
P/BV (x)
4.8
4.2
3.6
EV/EBITDA (x)
12.7 10.8
9.5
Div. Yield (%)
3.9
1.0
1.0
EV/Sales (x)
5.6
4.9
4.2
Valuation and view:
We will revisit our estimates the post earnings call. At CMP of
INR406, the stock trades at 10.7x/9.4x on FY18/19 EBITDA. We have a
Buy
rating
on the stock with a target price of INR435.
25 July 2017
7

Avenue Supermarts
BSE SENSEX
32,246
Bloomberg
Equity Shares (m)
M.Cap.(INRb)/(USDb)
52-Week Range (INR)
1, 6, 12 Rel. Per (%)
Avg Val, INRm
Free float (%)
Financials & Valuations (INR b)
Y/E Mar
Net Sales
EBITDA
PAT
EPS (INR)
Gr. (%)
BV/Sh (INR)
RoE (%)
RoCE (%)
P/E (x)
P/BV (x)
2017
2018E
2019E
24 July 2017
1QFY18 Results Update | Sector: Retail
S&P CNX
9,966
CMP: INR919
TP: INR882(-4%)
Neutral
DMART IN
n
624
570.4 / 8.8
964 / 559
11/-/-
-
-
Results in-line; geographical expansion to drive growth
119.0
9.8
4.8
7.7
34.5
61.6
17.9
14.2
119.8
14.9
163.1
13.6
7.9
12.7
65.8
70.5
19.3
16.5
72.3
13.0
217.9
n
18.5
11.0
17.6
38.7
82.8
23.0
23.2
52.1
n
11.1
Estimate change
TP change
Rating change
n
In-line revenue, EBITDA and PAT:
DMART reported overall revenue of
INR35.9b (est. of INR35.6b) in 1QFY18, as against INR26.5b in 1QFY17,
marking growth of 35.7%. EBITDA margin contracted 50bp from 8.9% in
1QFY17 to 8.4% (est. 8.4%) in 1QFY18 on account of minor migration
challenges into the GST regime and higher employee expenses (increase in
manpower for new stores added in 4QFY17). EBITDA stood at INR3b (est. of
INR3b), as against INR2.3b in 1QFY17 (up 29%). Accordingly, adj. PAT grew
47.6% from INR1,184m in 1QFY17 to INR1,748m (est. INR1,775m) in
1QFY18. The sharp increase in PAT was led by higher other income (up from
INR49m in 1QFY17 to INR228m in 1QFY18).
Minor impact of GST during transition:
DMART witnessed margin
contraction of 50bp YoY to 8.4% in 1QFY18 on account of the transitional
impact of GST. However, migration challenges into the GST regime have
been minimal for the company, with only supplies from certain vendors
expected to see short-term disruptions. On the consumer front, the
company did not witness any impact on sales/footfall during the transition
and neither any impact is expected post GST, indicating that the
consumption levels have not changed.
Store addition to pick up in 2HFY18:
DMART added only one store (in
Punjab) in 1QFY18, keeping growth of total trading area muted at 4.1m sq.ft.
However, going by the trend, the company adds majority of its stores in the
second half of the year (2HFY17 witnessed addition of 19 stores; 90.5% of
the annual store addition). The company is expected to expand its footprint
in geographies where it has limited presence, and further add ~24 stores in
FY18, in line with its business strategy.
Valuation and view:
1QFY18 has witnessed robust growth of 35.7% for
DMART. We expect future growth on similar lines, as, in our view, same-
store sales growth is expected to follow the historical trend and continue at
+20% levels. We expect sales and PAT CAGR of 33% and 45%, respectively,
over FY17-20E. However, valuation at present largely captures future
earnings growth, as evident from the continuous run-up in the stock price
since listing. Therefore, we maintain our
Neutral
rating with a TP of INR882
(downside of 4%).
25 July 2017
8

Zee Entertainment
BSE SENSEX
32,246
Bloomberg
Equity Shares (m)
M.Cap.(INRb)/(USDb)
52-Week Range (INR)
1, 6, 12 Rel. Per (%)
Avg Val, INRm
Free float (%)
S&P CNX
9,966
24 July 2017
1QFY18 Results Update | Sector: Media
CMP: INR550
TP: INR630 (+15%)
Buy
Z IN
960
n
463.9 / 6.8
589 / 429
5/-3/2
1052
56.9
2019E
76.7
n
27.0
18.2
18.9
28.4
18.0
24.5
20.7
29.1
30.6
n
19.0
0.5
Ad performance in-line; subscription surprises positively
Operational performance exceeds expectations:
1QFY18 EBITDA grew 7%
YoY to INR4.84b (3.5% above estimate of INR4.68b). Revenue exceeded our
expectation, led by better-than-expected subscription income and other sales
& services. While revenue declined 2% YoY, it was up 10% YoY to INR15.4b
(3% above our estimate of INR14.94b) on like-to-like basis (ex-sports). Despite
the EBITDA beat, PAT missed estimate by 24% to INR2.5b (+16% YoY). This
was a function of (i) lower-than-expected net other income and (ii) MTM
losses on preference liability and higher-than-expected tax outgo.
Domestic ad growth largely in-line:
Headline ad revenue grew 6% YoY to
INR9.65b (in-line), of which domestic ads contributed INR9.1b (8% YoY; est.
of INR9b).Domestic ad revenue (ex-sports and RBNL) grew 6.9% to INR8.7b.
Softness in ad growth was on expected lines, as advertisers pulled the plug
in June as primary sales suffered in the run up to GST roll-out. Management
expects July to be soft too. International ad revenue fell 18% YoY to
INR578m (est. of INR663m) as international biz was bogged down by
continuation of certain region-specific issues and currency appreciation.
Subscription surprises positively; margins in-line:
Ex-sports, domestic
subscription grew 14.5% YoY to INR3.78b (10% above our estimate of
INR3.43b) and international subscription (ex-sports) remained largely flat YoY
at INR1b (est. of INR0.93b). On a reported basis, domestic and international
subscription declined 9% YoY each. Management is confident of mid-teen
growth in domestic subscription over the next three years – we have modeled
+17%/20% in FY19/FY20. Non-sports margin remained largely flat YoY at
31.4% (in-line). Programming cost on a reported basis declined 11% YoY to
INR5.86b (in-line) due to absence of sports-related content payouts.
Valuation and view:
We expect ad growth to revert to normal post 2Q. We
revise our EPS estimates by 2%/3% for FY19/FY20 to factor in higher
margins, and revise our TP to INR630 (prior: INR585) as we roll over our
valuations to 32x June FY19 EPS (ex-&TV), plus INR27 toward &TV DCF value
less INR11.5 toward pref. share liability. Maintain
Buy.
Financials & Valuations (INR b)
Y/E MARCH
2017 2018E
Net Sales
64.3
66.4
EBITDA
19.3
21.6
NP
12.2
14.1
EPS (INR)
23.1
14.7
EPS Gr. (%)
149.4
-36.2
EPS ex-&TV, INR
24.0
15.3
RoE (%)
24.7
22.6
RoCE (%)
23.1
18.5
P/E (x)
23.8
37.3
P/E ex-&TV (x)
23.0
36.0
EV/EBITDA (x)
26.4
23.5
Div. Yield (%)
0.5
0.5
Estimate change
TP change
Rating change
n
25 July 2017
9

Ambuja Cements
BSE SENSEX
32,246
Bloomberg
Equity Shares (m)
M.Cap.(INRb)/(USDb)
52-Week Range (INR)
1, 6, 12 Rel. Per (%)
Avg Val, INRm
Free float (%)
S&P CNX
9,966
ACEM IN
1,985.7
531.8 / 8.3
282 / 191
7/2/-15
683
36.9
24 July 2017
2QCY17 Results Update | Sector: Cement
CMP: INR268
n
TP: INR308 (+15%)
Buy
Sharp pricing improvement drives multi-year-high EBITDA/t
Moderate volume growth:
2QCY17 standalone revenue of INR28.23b (+12%
YoY) came in only marginally below our estimate of INR28.49b, led by strong
realization improvement to INR4,651 (+7.6% YoY, +10.5% QoQ; largely in line
with est. of INR4,663) on sharp price increases in the western market (~38% of
ACEM volumes). Volumes increased 3.8% YoY, led by healthy growth in the
east and north markets.
Healthy pricing drives multi-quarter-high EBITDA/t:
EBITDA increased 6% YoY
to INR6.13b, translating into margin of 21.7% (+7.3pp QoQ, -1pp QoQ).
EBITDA/ton increased 2% YoY to INR1,010 (+INR404/t QoQ) due to a sharp
increase in pricing. Other income declined 51% YoY due to receipt of ACC’s
dividend in 2QCY16. Hence, PBT declined 8% YoY to INR5.47b. PAT fell 13% YoY
to INR3.92b due to higher tax rate of 28%.
Unitary cost higher by 9% YoY:
Unitary cost rose 9% YoY to INR3,641/tonne in
2QCY17, led by 8%/16% increase in freight/power & fuel cost. P&F cost/t rose
4% QoQ due to higher petcoke prices.
Valuation and view:
While ACEM’s growth potential remains muted due to its
limited expansion, we believe better utilization headroom in the faster-growing
regions (north and west) should offer some resilience. ACEM’s core strengths
are intact, and its presence in the north and west markets could lead to
meaningful realization improvement. Additionally, the proposed merger of
ACEM and ACC could drive further cost synergies. The stock trades at 15x/12
CY18E/CY19E EV/EBITDA and USD157/ton on CY19 capacity. Maintain
Buy
with
a TP of INR308/share (15% upside).
Financials & Valuations (INR b)
Y/E Dec
2016 2017E 2018E
n
Sales
91.6 102.0 113.0
EBITDA
15.8
18.0
21.8
NP
9.7
13.8
16.3
Adj. EPS (INR)
4.9
7.0
8.2
EPS Gr. (%)
-10.6
42.2
18.4
BV/Sh. (INR)
96.4 101.7 107.6
RoE (%)
5.1
7.0
7.9
n
RoCE (%)
6.9
7.2
8.1
P/E (x)
37.8
26.6
22.5
P/BV (x)
1.9
1.8
1.7
Estimate change
TP change
Rating change
n
25 July 2017
10

24 July 2017
Indiabulls Housing Finance
BSE SENSEX
32,246
Bloomberg
Equity Shares (m)
M.Cap. (INR b) / (USD b)
52-Week Range (INR)
1, 6, 12 Rel. Per (%)
12M Avg. Val (INR M)
Free float (%)
S&P CNX
9,966
IHFL IN
421.3
486.6/7.6
1187 / 616
1/36/41
1838
76.4
1QFY18 Results Update | Sector:
Financials
CMP: INR1,155
n
TP: INR1,350 (+17%)
Buy
Strong growth, stable performance overall
Indiabulls Housing Finance's (IHFL) PAT grew 23% YoY to INR7.8b (8% below
our estimate), mainly driven by lower-than-estimated income on investments.
Core operating performance was robust, with strong AUM growth (+33% YoY),
stable spreads and a decline in C/I ratio.
Management alluded to strong growth witnessed in the home loan segment,
especially the mass housing segment. Disbursements were up 39% YoY in
home loans. Yields continue to remain under pressure (down 14bp QoQ and
94bp YoY to 11.49%). However, due to the sharp decline in cost of funds,
reported spreads remained intact at 3.24%. Management continues to guide
for incremental spreads in the range of 2.75-3% and book spreads of 3-3.25%.
We believe the company will continue delivering at the higher end of its guided
range over the foreseeable future.
The share of home loans in the overall book inched up 100bp to 57%.
Management reiterated its guidance of 66% share of home loans by FY20.
The liability mix continued to evolve in favor of NCDs. Management plans to
raise bulk of incremental funding from NCDs, taking the share of NCDs to 60%
by FY20 (currently 52%).
Valuation and view:
IHFL's transformation from a diversified lender to a
focused mortgage player has yielded returns, with RoE/RoA improving from
3%/0.8% in FY09 to 26%/3.4% in FY17. Focus on core mortgage loans and
market share gains should drive AUM growth of 29% over the next three years.
Also, capital consumption will be lower, with a gradual shift toward individual
home loans and increased sell-downs. IHFL is among the lowest-levered HFCs.
Asset quality trend is likely to remain stable. While we marginally increase our
AUM growth estimates, we cut overall EPS estimates for FY18/19 by 4%/5% to
factor in lower investment income. Maintain
Buy
with a TP of INR1,350 (3.7x
FY19E P/B).
n
Financials & Valuations (INR b)
Y/E March
2017 2018E 2019E
Net Fin inc
39.9 54.4 67.3
PPP
45.5 57.4 72.4
EPS (INR)
69.0 86.3 108.4
EPS Gr. (%)
24.0 25.0 25.6
BV/Sh. (INR)
288
324
368
RoA on AUM (%)
3.1
3.0
3.0
RoE (%)
25.5 28.2 31.3
Payout (%)
52.5 50.0 50.0
Valuations
P/E (x)
16.7 13.4 10.7
P/BV (x)
4.0
3.6
3.1
P/ABV (x)
4.0
3.6
3.1
Div. Yield (%)
3.1
3.7
4.7
n
n
n
25 July 2017
11

24 July 2017
Q1FY18 Results Update | Sector: Consumer
United Spirits
Neutral
BSE SENSEX
32,246
Bloomberg
Equity Shares (m)
M.Cap.(INRb)/(USDb)
52-Week Range (INR)
1, 6, 12 Rel. Per (%)
Avg Val, (INR m)
Free float (%)
S&P CNX
9,966
UNSP IN
145.3
303.7 / 4.7
2773 / 1775
14/2/-6
1129
41.5
CMP: INR2,641
n
TP: INR2,525 (-4%)
Highway alcohol sale ban to impact volumes over coming quarters
UNSP’s standalone revenue declined 12.7% YoY (est. flat) to INR17.8b
in
1QFY18, with volumes down 18.9% YoY (est. of -9%). According to
management, adjusted for operating model changes, sales were down 7% YoY.
Trade down-stocking in anticipation of highway ban also impacted sales by 3-
4%. Gross sales declined 0.6% YoY to INR58.2b, with excise duty as % of sales
up 420bp YoY to 69.4%. Overall 1Q volumes fell 18.9% YoY to 18m cases.
Popular volumes fell 25.6% YoY to 9.6m cases, while Prestige and above
volumes declined 9.7% YoY to 8.4m cases.
Gross margin expanded 270bp YoY to 46%,
driven by price increases in some
states (not disclosed), productivity initiatives, and a change in mix. EBITDA
margin, however, shrunk 160bp YoY to 8.8% (est. of 9.0%), despite sharp gross
margin improvement, as adspend, staff costs and other expenses increased
90bp, 50bp and 290bp YoY to 9.1%, 9.3% and 18.7% of sales, respectively.
EBITDA declined 26.2% YoY to INR1.57b (est. of INR1.82b).
Interest costs declined 31.7% YoY to INR703m, led by debt reduction and
favorable rates. Tax rates were lower at 25.8% v/s expectation of 33%.
Adjusted PAT declined 23.4% YoY to INR637m (est. of +13.1% to INR869m).
Conference call highlights:
1) Management expects to recoup the margin loss
(on account of GST) over a period of 2-3 years. 2) Company has taken price
increases in certain states; Telangana yet to take hike.
Valuation and view:
The impact of highway ban was greater than expected,
leading to 7.6%/0.6% reduction in FY18/FY19E EPS. Longer-term margin
growth potential remains intact (mainly led by continued mix improvements),
but the trajectory is likely to be affected by extent of GST impact on EBITDA
margins – management has not yet provided clarity on this. Valuations remain
fair, given the risks emanating from a host of factors like (i) GST impact on
profitability, (ii) highway ban and (iii) prohibitions of various degrees
announced by some states over the past two years. We maintain
Neutral
on
the stock with a DCF-based target price of INR2,525.
Financials & Valuation (INR b)
Y/E Mar
2017 2018E
Total Income
85.5
87.4
EBITDA
9.8
10.5
PAT
3.9
5.0
EPS (INR)
26.7
34.5
EPS Gr. (%)
87.1
29.1
BV/Sh.(INR)
133.4 191.4
RoE (%)
21.3
18.0
RoCE (%)
11.8
12.4
P/E (x)
98.8
76.5
P/BV (x)
19.8
13.8
Estimate change
TP change
Rating change
2019E
100.8
n
13.8
7.5
51.5
49.3
254.1
20.3
15.4
n
51.3
10.4
n
n
25 July 2017
12

24 July 2017
1QFY18 Results Update | Sector: Automobiles
Ashok Leyland
Buy
BSE SENSEX
32,246
Bloomberg
Equity Shares (m)
M.Cap.(INRb)/(USDb)
52-Week Range (INR)
1, 6, 12 Rel. Per (%)
Avg Val, INRm
Free float (%)
S&P CNX
9,966
AL IN
2,927
301.4 / 4.7
110 / 74
9/-1/-8
1075
48.7
CMP: INR103
n
TP: INR118(+15%)
Higher staff cost, one-off costs, negative operating leverage hurt EBITDA
margin
Price increase offsets sharp decline in volumes:
AL’s revenue declined 0.5%
YoY (36% QoQ) to INR42.4b (in-line). The 8.6% YoY (40% QoQ) decline in
volumes to 28.45k units was offset by 8.9% YoY (7% QoQ) increase in
realization to INR1.49m (v/s our estimate of INR1.5m). AL took price increase
of 10-14% to offset BS-4 and commodity cost pressures.
Higher staff cost, one-offs, negative operating leverage impact margins:
EBITDA margin declined 410bp YoY (380bp QoQ) to 7.2% (v/s our estimate of
10%), led by increase in staff cost, one-off marketing costs and negative
operating leverage. EBITDA declined 36.5% YoY (58% QoQ) to INR3.06b (v/s
our estimate of INR4.27b), translating into 59% YoY decline in adjusted PAT to
INR1.2b (v/s our estimate of INR2.07b).
Key takeaways from conference call:
(a)
Outlook
– expects strong recovery in
volumes from August 2017; (b) Planning price
increase
of 1% from August
2017; (c) Exports to grow at 25% in FY18; (d) Planning to double warranty to
four years across product range; (e) Capex for FY18 at ~INR5b + Investments in
subsidiaries and JVs; (f) Spare parts business grew 34% YoY and contributed
~6% to sales; targeting to increase spares contribution to 10-15% in few years;
(g) Operating working capital under control at 8 days.
Valuation and view:
We downgrade FY18/FY19E EPS by 14%/9%, as we (a)
lower margins by 70bp/30bp, and (b) increase depreciation. We value AL at
~INR118 [9x June 2019E EV/EBITDA (in-line with LPA) + INR11/share for stake
in HLF post 20% HoldCo discount]. Maintain
Buy.
FY18
2Q
3Q
40,246 42,591
20.3
29.7
1,480
1,488
7.1
8.2
59,578 63,364
28.9
40.3
70.5
70.6
7.1
7.1
11.0
11.7
52,802 56,666
6,776
6,699
11.4
10.6
425
475
300
225
5,476
5,509
0
0
5,476
5,509
1,533
1,542
28.0
28.0
3,943
3,966
34
145
FY17
FY18E
(INR Million)
FY18
Var.
1QE
(%)
28,484
0.0
-8.6
1,501
-0.9
9.8
42,755
-0.9
0.4
69.8 -40bp
9.2 110bp
11.0 200bp
38,485
4,269
-28.3
10.0 -280bp
375
2.4
375
-2.3
2,869
-39.7
0
2,869
-44.1
803
28.0
2,066
-41.9
-29.0
Financials & Valuations (INR b)
Y/E March
2017 2018E 2019E
Sales
200.2 252.4 292.2
EBITDA
22.0
25.8
31.8
NP
13.3
15.1
20.4
Adj. EPS (INR)
4.6
5.2
7.0
EPS Gr. (%)
8.0
13.6
34.7
BV/Sh. (INR)
20.9
23.7
27.9
RoE (%)
23.1
23.2
27.0
RoCE (%)
21.8
20.5
24.7
P/E (x)
22.6
19.9
14.8
EV/EBITDA (x)
13.5
10.8
8.3
n
n
n
Quarterly Performance
1Q
31,165
10.7
1,367
-0.9
42,588
9.7
68.7
8.4
11.6
37,768
4,820
11.3
385
338
4,154
0
4,154
1,246
30.0
2,908
130
FY17
2Q
3Q
33,446 32,838
-10.5
6.2
1,382
1,375
4.0
3.4
46,224 45,163
-6.9
9.8
67.8
69.4
8.0
8.7
12.6
11.8
40,859 40,621
5,365
4,542
11.6
10.1
316
258
339
453
4,146
2,396
0
0
4,146
2,396
1,202
778
29.0
32.5
2,944
1,618
14
-26
4Q
47,617
8.5
1,390
2.1
66,179
10.8
71.9
6.2
10.8
58,880
7,299
11.0
404
423
6,114
3,508
2,605
-2,157
-
4,279
-16
1Q
28,484
-8.6
1,488
8.9
42,378
-0.5
69.4
10.3
13.0
39,317
3,061
7.2
384
366
1,730
126
1,605
492
30.7
1,199
-59
4Q
57,483 145,066 168,804
20.7
3.4
16.4
1,531
1,380
1,501
10.2
2.3
8.7
88,001 200,187 253,321
33.0
5.7
26.5
71.3
69.7
70.6
5.0
7.6
6.9
11.1
11.6
11.6
76,868 178,161 225,653
11,133 22,025 27,669
12.7
11.0
10.9
546
1,363
1,830
313
1,554
1,204
9,634 16,809 22,376
0
3,508
0
9,634 13,301 22,376
2,697
1,070
6,265
-
8.0
28.0
6,744 13,447 16,111
58
11.6
19.8
Total Volumes (nos)
Growth %
Realizations (INR '000)
% change
Net operating revenues
Change (%)
RM/sales %
Staff/sales %
Other exp/sales %
Total Cost
EBITDA
EBITDA Margins(%)
Other Income
Interest
PBT before EO Item
EO Exp/(Inc)
PBT
Tax
Effective Tax Rate (%)
Adj. PAT
Change (%)
E: MOSL Estimates
25 July 2017
13

24 July 2017
Annual Report
Update
| Sector:
Capital Goods
Cummins
Buy
BSE SENSEX
32,246
S&P CNX
9,966
CMP: INR1,028
TP: INR1,200 (+17%)
Infrastructure spend to drive domestic growth
Key takeaways from FY17 annual report
n
Domestic market revival to be driven by infrastructure segment investments
n
Expanding product portfolio to cater to incremental global and local demand
n
Healthy free cash flow generation led by working capital cycle improvement
Domestic market revival driven by infra investments by the government;
has identified new opportunities in exports
Stock Info
Bloomberg
Equity Shares (m)
52-Week Range (INR)
1,6,12 Rel. Perf. (%)
M.Cap. (INR b)
M.Cap. (USD b)
Equity Shares (m)
Avg Val ( INR m)
Free float (%)
KKC IN
277.2
952/423
6/27/53
285.0
4.4
277.2
275
49.0
Financials Snapshot (INR b)
Y/E Mar
2017 2018E 2019E
Net Sales
50.8
56.6
65.5
EBITDA
8.0
9.1
11.4
Adj PAT
7.3
8.1
10.0
EPS (INR)
26.5
29.2
36.0
EPS Gr. (%)
-2.6
10.1
23.4
BV/Sh. (INR)
135.0 146.2 160.1
RoE (%)
21.2
20.7
23.5
RoCE (%)
20.0
19.8
22.5
P/E (x)
38.8
35.2
28.6
P/BV (x)
7.6
7.0
6.4
Shareholding pattern (%)
Jun-17 Mar-17 Jun-16
As On
Promoter
DII
FII
Others
51.0
21.1
15.0
12.9
51.0
20.9
15.0
13.2
51.0
19.4
16.3
13.3
Cummins (KKC) will continue to benefit from the government’s ongoing
investments in infrastructure and the implementation of GST reforms. Moreover,
with revival in the global economy, exports should also revive.
n
Power Generation:
The government’s renewed push on infra and industrial
development should drive demand for DG sets. KKC sees new opportunity as a
supplier of rail under-cars and also sees strong demand in FY18 from the Indian
Navy/Coast Guard alongside other defense opportunities.
n
Industrial:
KKC retains its leadership in construction equipment segments like
excavators, wheel loaders, road machinery equipment, and water well rigs.
n
Distribution:
The company continues to see good growth, driven by healthy
orders for spare parts, improving penetration of service contracts, and demand
for engines from key accounts.
n
Exports:
KKC is strongly positioned, as global markets recover. It has identified
opportunities to supply additional parts to Cummins’ various Engine Plants and
Part Distribution Centers, globally.
Plans to focus on ‘fit for market’ solutions and expansion of product range
to serve local and global markets
n
n
n
n
KKC plans to develop ‘fit for market’ solutions to meet upcoming emission
regulations, and local and rural market needs.
It also plans to focus on technological innovation to add value to products in
the areas of alternate fuels, recycle/re-use, and hybrid engines.
It intends to expand the existing product range to serve the local and global
market needs
KKC is focusing on providing energy-efficient solutions to reduce the carbon
footprint and improve recyclability
Valuation and view
Over the years, KKC has developed (a) a strong product portfolio with superior
technology to meet domestic demand, (b) a wide distribution network to provide
superior after sales service, and (c) cost-effective products to maintain leadership
in a fiercely competitive market. Given strong infrastructure push, initial signs of
pick-up in the power genset segment, and expected revival in the export segment
from 2HFY18, we maintain our Buy rating, with the target price of INR1,200 (32x
June 2019E EPS; 10% premium to 5-year average). The stock trades at 39x FY17E
EPS of INR26.5, 35x FY18E EPS of INR29.2, and 29x FY19E EPS of 36.0.
14
FII Includes depository receipts
25 July 2017

RESULTS
FLASH
24 July 2017
1QFY18 Results Update | Sector:
Financials
Mahindra Financial Services
BSE SENSEX
32,246
Bloomberg
Equity Shares (m)
M.Cap.(INRb)/(USDb)
52-Week Range (INR)
1, 6, 12 Rel. Per (%)
Avg Val, INRm
Free float (%)
S&P CNX
9,966
MMFS
565.0
192.1 /3.0
405 / 244
4/-14/-2
-
-
CMP: INR364
Operating performance strong, strengthening the balance sheet
n
n
Financials & Valuations (INR b)
Y/E March
2017 2018E 2019E
NII
33.2 38.0 43.4
PPP
19.3 22.1 25.3
PAT
4.0
7.7
9.2
EPS (INR)
7.1 13.6 16.4
BV/Sh.(INR)
114.6 122.7 132.3
ABV/Sh (INR)
94.8 99.2 107.5
RoA on AUM (%)
1.0
1.7
1.7
RoE (%)
6.3 11.4 12.8
Payout (%)
39.8 41.0 41.0
Valuations
P/E (x)
51.7 27.0 22.4
P/BV (x)
3.2
3.0
2.8
P/ABV (x)
3.9
3.7
3.4
Div. Yield (%)
0.8
1.3
1.6
n
n
n
n
Mahindra & Mahindra Financial Services (MMFS) had a strong quarter on the operating
front. However, its 1QFY18 PAT missed estimate by a wide margin due to higher credit
costs. The company increased its provisioning on loans, which were overdue for more
than 24 months, resulting in INR834m incremental provisioning in the quarter.
Value of assets financed increased 16% YoY in 1QFY18 – fourth consecutive quarter
of 15%+ YoY growth.
This comes after a span of over 12 quarters of sluggish growth,
caused by a variety of external factors. We believe the worst is behind, and expect
sustained pick-up in growth over the medium term. Consequently, reported AUM
increased 14% YoY. The product mix remained largely unchanged.
GNPL ratio increased 150bp QoQ, but declined 20bp YoY to 10.5%.
The sequential
increase, which is seasonal, is much lower than that witnessed in the past three
years.
Asset quality data from the past 10 years suggest that in a good economic cycle,
the 4Q-to-1Q GNPL increase is ~50-100bp, while in a bad cycle, it goes to as high as
250+bp. We believe that with improvement in the overall rural cycle, this number is
likely to decline further, given improvement in asset quality.
In order to maintain 100% provision on loans that are more than 24 months due,
MMFS incurred a provisioning cost of INR834m, based on its assessment of underlying
collateral.
As a result, PCR was largely stable at 60-62%. The sequential PCR decline of
mere 130bp is the lowest 4Q-to-1Q decline in the past 11 years (average decline –
600bp). We view this shoring-up of provisions as a positive sign as it strengthens the
balance sheet, despite the negative impact on profitability.
The borrowing mix continues to evolve in favor of market borrowings (its share
increased from 58% to 63% sequentially).
Valuation and view:
The business environment for MMFS seems to be getting better.
After several quarters of sluggish disbursement growth, MMFS has finally delivered
four consecutive quarters of 15%+ growth. Asset quality data too give early signs of a
revival. We like the fact that the company chooses to improve balance sheet quality
over near-term profitability. The company’s long-term prospects remain strong. MMFS
remains highly levered to growth and asset quality. With the environment getting
better, this would have a multiplier effect on the return ratios. We look to revise our
estimates and target price post the concall on 25 July 2017.
25 July 2017
15

RESULTS
FLASH
Tata Communications
TP: INR811
Buy
24 July 2017
Results Flash | Sector: Telecom
BSE SENSEX
32,246
S&P CNX
9,966
CMP: INR646
n
n
n
n
n
We will revisit our estimates
post earnings call/management
interaction.
Core EBITDA in line with expectation
Core revenue at INR43.1b was up 0.4% QoQ (-3.3% YoY), marginally better than
our expectation.
Core EBITDA of INR5.6b increased 12.6% QoQ (-15.6% YoY), in line with
expectation.
PAT stood at INR1b (v/s loss of INR11b in 4QFY17), better than our estimate of
INR624m.
Data revenue of INR27.8b was flat QoQ, up 4.6% YoY (in-line).
Data EBITDA of INR4.7b was up 23% QoQ (-14.9% YoY; in-line). Data EBITDA
margin of 17% jumped 330bp QoQ (-390bp YoY).
Traditional revenue (contributing 71% of revenue) declined 1% QoQ in INR
terms to INR19.7b. Traditional EBITDA grew 18% QoQ to INR5.7b. Rupee
appreciated 4% QoQ, pulling down dollar revenues.
Voice revenue at INR15.3b was up 1.3% QoQ (+14.9% YoY), 3% above estimate.
Voice EBITDA at INR876m dropped 22.7%/19.1% on QoQ/YoY.
Capex for 1QFY18 was USD51m v/s INR63m in 1QFY17 on the back of sale of
data center and Neotel.
Net debt increased USD54m to USD1.2b, largely due to dividend payment and
the bonus payment to employees.
After last quarters of multiple one-offs, the recovery has been slow due to
currency appreciation and high operating cost owning to revamp in internal
restructuring.
Conference Call Details
Date:
25
th
July 2017
Time:
04:00pm IST
Dial-in details:
+91-22 3960 0854
Financials & Valuations (INR b)
INR million
FY17 FY18E FY19E
Sales
176.2 177.1 190.3
EBITDA
24.1 24.7 32.7
NP
7.4
2.4
7.7
EPS (Rs)
26.0
8.3 27.2
EPS Growth (%) 1,573.9 -68.2 229.0
BV/Share (Rs)
55.9 64.1 91.3
P/E (x)
24.8 78.2 23.8
P/BV (x)
11.6 10.1
7.1
EV/EBITDA (x)
11.3 10.8
7.8
EV/Sales (x)
1.5
1.5
1.3
RoE (%)
126.2 13.8 35.0
RoCE (%)
9.7
3.6
8.1
RoIC (%)
9.4
5.1 13.6
n
n
n
n
n
Valuation and view:
We will revisit our estimates post the earnings call. At CMP of
INR646, the stock trades at 11.2.x/7.8x on FY18/19 EBITDA. We have a
Buy
rating
on the stock with a TP of INR811.
25 July 2017
16

RESULTS
FLASH
24 July 2017
Results Flash | Sector: Technology
L&T Infotech
Buy
BSE SENSEX
27836.51
S&P CNX
8615.25
CMP: INR763
TP: INR850(+11%)
We will revisit our estimates
post earnings call/management
interaction.
In-line revenue despite some pockets of weakness
Margins below estimate; PAT beat led by higher Other Income
n
LTI’s 1QFY18 revenue grew 2% QoQ to USD259m. In CC terms, revenue growth
was 1.5% QoQ, in line with our estimate.
n
Gross profit margin declined by 200bp QoQ to 33.8%, 90bp miss to our
estimate of 34.7%. EBITDA margin declined by 230bp QoQ to 16.8%, below our
estimate of 17.4%. The margin decline was led by currency, aggressive hiring,
visa expenses and increased S&M expenses.
n
PAT at INR2,673m (+4.9% QoQ) beat estimates of INR2,406m on account of
higher Other Income. Other Income at INR1,084m was 57% higher than our
estimate of INR689m.
Conference Call Details
Date:
25 July 2017
Time:
11:00 IST
Dial-in details:
+91-22-3938 1006
th
Financials & Valuations (INR b)
Y/E Mar
2017 2018E
Net Sales
65.0
69.7
EBITDA
12.3
12.0
NP
9.7
10.1
EPS (INR)
55.5
58.0
EPS Gr. (%)
5.9
4.5
BV/Sh. (INR)
159.5
203.5
RoE (%)
40.4
31.9
RoCE (%)
42.7
31.1
Payout (%)
17.5
20.0
Div. Yield
1.2
1.5
2019E
Strength seen in IMS and Digital
77.4
n
In terms of verticals, growth in Energy & Utilities (6.7% QoQ CC), CPG, Retail &
13.1
Pharma (5.4% QoQ CC), High-Tech, Media & Entertainment (4.2% QoQ CC) and
10.5
Others (54.4% QoQ CC) bettered company average. BFS growth of 1.0% QoQ
60.2
CC remains resilient tracking at 19% YoY CC.
3.8
249.2
n
On a sequential basis, weakness was seen in the top 6-10 clients, which saw a
26.6
11% QoQ decline. Other weak areas included Manufacturing (13% decline) and
28.1
Europe (5% decline).
20.0
n
In terms of services, the key drivers were IMS (12.5% QoQ CC) and Analytics, AI
1.5
& Cognitive (4.5% QoQ CC) and Enterprise Integration & Mobility (6.3% QoQ
CC).
Quarterly Performance (Consolidated)
Y/E March
Revenue (USD m)
QoQ (%)
Revenue (INR m)
YoY (%)
GPM (%)
SGA (%)
EBITDA
EBITDA Margin (%)
EBIT Ma rgi n (%)
Other i ncome
ETR (%)
PAT
QoQ (%)
YoY (%)
EPS (INR)
Headcount
Uti l i ncl . tra i nees (%)
Attri ti on (%)
Offs hore rev. (%)
1Q
231
0.6
15,550
16.6
35.3
15.7
3,050
19.6
16.9
372
21.2
2,359
3.2
35.1
13.5
19,292
77.4
19.5
51.9
Valuation and view:
We will revisit our estimates post earnings call. Outlook on
growth, especially in BFS, and on profitability would be keenly watched. Based on
current estimates, it trades at 13.2/12.7x FY18/19E EPS. Maintain
Buy.
4Q
254
3.7
16,772
7.7
35.8
16.8
3,190
19.0
16.5
503
22.3
2,547
2.7
11.4
14.6
21,023
78.3
16.9
51.3
1Q
259
2.0
16,707
7.4
33.8
17.0
2,799
16.8
14.4
1,084
23.4
2,673
4.9
13.3
15.3
22,321
77.7
53.2
FY18E
2Q
3Q
266
270
2.5
1.6
17,268 17,684
7.8
6.1
33.4
33.8
16.5
16.5
2,915
3,065
16.9
17.3
13.9
14.4
764
611
22.0
22.0
2,467
2,464
-7.7
-0.1
6.0
-0.7
14.1
14.1
22,641 22,911
77.5
78.0
52.2
52.5
FY17
4Q
274
1.4
18,065
7.7
34.3
16.5
3,212
17.8
14.9
562
22.0
2,541
3.1
-0.2
14.5
23,131
78.5
52.7
970
9.3
65,009
11.2
35.2
16.3
12,303
18.9
16.2
1,837
21.4
9,711
5.9
55.5
21,023
7807.5
48.3
FY18E
1,069
10.2
69,725
7.3
33.8
16.6
11,990
17.2
14.4
3,020
22.4
10,144
4.5
58.0
23,131
77.9
52.6
Est.
1QFY18
260
2.2
16,735
7.6
34.7
17.3
2,912
17.4
14.3
689
22.0
2,406
-5.5
2.0
13.7
21,443
76.5
47.7
Var. (% /
bp)
(0.2)
(18)
(0.2)
(18)
(92)
(28)
(3.9)
(65)
9
57.3
11.1
1,048
1,131
4.1
120
548
FY17
2Q
3Q
240
245
3.7
2.3
16,020 16,667
9.1
12.1
35.4
34.3
16.4
16.2
3,044
3,020
19.0
18.1
16.1
15.3
365
597
21.0
21.2
2,326
2,481
-1.4
6.7
21.3
10.5
13.3
14.2
21,074 20,605
78.7
78.1
18.5
18.1
51.2
52.3
25 July 2017
17

24 July 2017
Q1FY18 Results Update | Sector: Technology
Info Edge India
Buy
BSE SENSEX
32,246
Bloomberg
Equity Shares (m)
M.Cap.(INRb)/(USDb)
52-Week Range (INR)
1, 6, 12 Rel. Per (%)
Avg Val, INRm
Free float (%)
S&P CNX
9,966
CMP: INR984
TP: INR1,130 (+15%)
INFOE IN
n
121
119.4 / 1.9
1127 / 752
-4/-3/-2
78
57.6
n
Ahead of estimates, but uncertainty clouds near term
1Q beat on 99acres surprise and cost containment:
INFOE’s 1QFY18 standalone
revenue grew 12.6% YoY to INR2,225m (2% beat). While revenue growth in the
Recruitment business showed 10.4% YoY growth (est. of + 13.5%), real estate
portal 99acres.com grew 12.6% YoY, well ahead of our flat revenue estimate.
EBITDA grew 47.2% YoY (11% beat) on the back of a stable cost base (+1.1% YoY).
Risks to near-term growth in key business segments:
INFOE cited that growth
in Recruitment fell below its own expectations for the quarter, and the muted
outlook in IT Services hiring keeps the prospects uncertain for now. Even in the
real estate sector, weakness in the underlying market is compounded by
confusion following the impact of RERA. This may be followed by some
consolidation of the smaller builders and brokers once RERA takes full effect.
Competition at bay for now:
INFOE’s traffic share in Naukri.com was a healthy
74% excluding Indeed and 60% including Indeed. While Google recently
launched its AI-powered job search engine, INFOE expects it to first battle it out
with Indeed in the US, and while it continues to keep a close watch, business
fundamentals at present are not getting challenged by competitive pressures.
Similarly, the launch of UberEats affected Zomato’s traffic share for a fortnight
and online ordering for a month after launching, but both those metrics are
back in place, reinstating Zomato’s dominance in the category.
Valuation view:
Our standalone estimates for FY18/19 saw only marginal
upgrades after 1Q beat, which was offset by a tepid near-term outlook. We
expect INFOE to leverage any growth opportunity on offer from macro tailwind
in Recruitment and Real Estate segments. The situation with respect to hiring in
the IT Services sector remains a risk (~40% of recruitment revenues). We see
Naukri.com (pick-up in economic growth), 99acres.com (lower competitive
intensity) and Zomato.com (focus on driving monetization and profitability) as
the key drivers of valuation at INFO. Our SOTP-based price target of INR1,130
implies 15% upside. Maintain
Buy.
4Q
2,084
8.0
936
217
300
632
30.3
113
56
689
320
46.5
369
-40
329
-15.6
2.7
1Q
2,225
12.6
991
254
276
703
31.6
264
54
913
270
29.6
642
0
642
44.8
5.2
FY18E
2Q
3Q
2,313
2,327
10.2
25.0
1,016
1,041
278
279
279
281
741
725
32.0
31.2
264
258
56
58
948
925
281
274
29.6
29.6
667
651
0
0
667
651
-16.7
38.1
5.4
5.3
FY17
4Q
2,424
16.3
1,066
291
291
776
32.0
266
60
982
291
29.6
691
0
691
110.1
5.6
8,021
12.6
3,752
881
1,114
2,275
28.4
855
241
2,889
978
33.9
1,911
134
2,045
65.7
15.4
FY18E
9,289
15.8
4,114
1,102
1,127
2,946
31.7
1,052
230
3,768
1,116
29.6
2,652
0
2,652
29.7
21.6
1QFY18
2,182
10.4
997
251
301
633
29.0
252
59
826
239
29.0
587
0
587
32.2
4.9
bp)
2.0
220bp
-0.6
1.3
-8.3
11.1
260bp
4.7
-7.8
10.5
13.1
60bp
9.4
Financials & Valuations (INR b)
2017 2018E
Y/E Mar
8.0
9.3
Net Sales
2.3
2.9
EBITDA
1.9
2.7
PAT
15.7
21.8
EPS (INR)
38.2
38.8
Gr. (%)
162.7
179.8
BV/Sh (INR)
10.2
12.7
RoE (%)
10.2
12.7
RoCE (%)
62.8
45.2
P/E (x)
6.0
5.5
P/BV (x)
2019E
10.5
3.4
3.0
24.7
13.4
197.3
13.1
13.1
39.8
5.0
n
Estimate change
TP change
Rating change
n
Quarterly Performance (Standalone)
Y/E March
Revenues
YoY (%)
Sa l a ry cos ts
Ad a nd Promoti on cos ts
Other Expens es
Operating Profit
Ma rgi ns (%)
Other Income
Depreci a ti on
PBT bef. Extra-ordinary
Provi s i on for Ta x
ETR (%)
PAT bef. Minority
EOI
Adjusted PAT
YoY (%)
EPS (INR)
1Q
1,976
13.1
963
258
277
478
24.2
243
60
661
217
32.9
444
0
444
54.9
3.6
FY17
2Q
3Q
2,100
1,861
20.6
7.3
915
938
221
184
269
268
695
471
33.1
25.3
248
250
62
63
881
658
254
187
28.8
28.4
627
471
174
0
801
471
136.0
116.7
5.1
3.9
6.9
25 July 2017
18

24 July 2017
1QFY18 Results Update | Sector: Media
D B Corp
Buy
BSE SENSEX
32,246
Bloomberg
Equity Shares (m)
M.Cap. (INR b) / (USD b)
52-Week Range (INR)
1, 6, 12 Rel. Per (%)
Avg Val (INR m)
Free float (%)
S&P CNX
9,966
DBCL IN
183.4
66/1.0
448 / 345
-6/-16/-25
138
30.1
CMP: INR372
n
TP: INR450 (+21%)
In-line quarter; maintain estimates and target price
Operational performance largely in-line:
DBCL’s 1QFY18 EBITDA grew 3%
YoY to INR1.86b, (largely in-line; our estimate: INR1.85b). Revenue grew 4%
YoY to INR5.94b (in-line) as better than expected print ad revenue made up
for the circulation disappointment. PAT grew 6% to INR1.1b (our estimate:
INR1.12b).
Ad growth healthier than expected:
Print ad
revenue grew 4.5% YoY to
INR3.9b (our estimate: INR3.85b), despite the high base of 1QFY17 (20% ad
growth) and the impact of impending GST implementation on print ad
industry. While HMVL saw flat ad revenue, DBCL’s ad growth seems healthy.
The ad growth run rate pre-GST (April and May) was 7.5-8%. We have
modeled 9% CAGR in ad revenue over FY17-19.
Circulation growth moderates, falls short of expectations:
Circulation
revenue grew 5% YoY to INR1.23b (our estimate: INR1.27b). Growth was
largely led by yield improvement in mature markets. The management
intends to rev up circulation growth, given that the ad environment is
improving. We have modeled 9% CAGR in circulation over FY17-19.
Margins contract by 40bp; largely in-line:
Margins declined 40bp YoY to
31.4% (our estimate: 31.1%), despite higher-than-expected RM and SG&A
costs. Lower-than-expected employee costs more than cushioned the spike
in RM and SG&A expenses. RM costs grew 6.8% YoY (price-led) to INR1.71b
(our estimate: INR1.69b), constituting 28.7% of revenue.
Maintain Buy rating, target price:
We maintain our PAT estimates, which
factor in 9% CAGR in ad/circulation revenue. DBCL trades at 15.8x FY18E and
13.6x FY19E EPS. Maintain
Buy,
with a target price of INR450 (16x FY19E
EPS; 11% discount to average P/E of 18x since listing).
(INR Million)
FY18E
24,366
8.6
17,131
7,235
12.7
29.7
896
43
321
6,617
2,250
34.0
4,367
0
4,367
16.6
Financials & Valuation (INR Billion)
Y/E MAR
2017 2018E 2019E
Net Sales
22.4 24.4 26.5
EBITDA
6.4
7.2
8.1
Adj. Net Profit
3.7
4.4
5.1
Adj. EPS (INR)
20.4 23.7 27.6
Adj. EPS Gr. (%)
25.8 16.5 16.1
BV/Sh (INR)
86.7 97.4 109.8
RoE (%)
25.5 25.8 26.6
RoCE (%)
23.0 24.1 25.0
P/E (x)
18.4 15.8 13.6
P/BV (x)
4.3
3.9
3.4
Estimate change
TP change
Rating change
n
n
n
n
Quarterly Performance
Y/E March
Sales
YoY (%)
Operating Expenses
EBITDA
YoY (%)
EBITDA margin (%)
Depreciation
Interest
Other Income
PBT
Tax
Effective Tax Rate (%)
PAT
Minority Interest
Adj PAT
YoY (%)
1Q
5,704
20.5
3,892
1,812
48.7
31.8
211
34
41
1,608
568
35.3
1,040
0
1,040
56.5
FY17
2Q
5,287
10.6
3,782
1,505
33.6
28.5
216
6
41
1,325
440
33.2
885
0
885
47.3
3Q
6,273
7.1
4,290
1,982
6.1
31.6
218
30
36
1,771
590
33.3
1,181
0
1,181
10.6
4Q
5,171
0.6
4,049
1,122
-1.7
21.7
218
5
51
950
309
32.5
641
0
641
-0.2
1Q
5,942
4.2
4,079
1,863
2.8
31.4
220
16
70
1,698
597
35.1
1,101
0
1,101
5.9
FY18
2Q
5,692
7.7
4,204
1,488
-1.1
26.1
225
9
84
1,338
450
33.6
889
0
889
0.4
FY17
3Q
7,094
13.1
4,527
2,567
29.5
36.2
227
9
84
2,415
811
33.6
1,604
0
1,604
35.8
4Q
5,636
9.0
4,321
1,315
17.2
23.3
224
9
84
1,166
392
33.6
774
0
774
20.7
22,435
9.4
16,013
6,422
19.9
28.6
863
74
170
5,654
1,907
33.7
3,747
0
3,747
25.9
25 July 2017
19

24 July 2017
1QFY18 Results Update | Sector: Financials
J&K Bank
Neutral
BSE SENSEX
32,246
Bloomberg
Equity Shares (m)
M.Cap.(INRb)/(USDb)
52-Week Range (INR)
1, 6, 12 Rel. Per (%)
Avg Val, INRm
Free float (%)
S&P CNX
9,966
JKBK IN
484.9
35.2/0.5
96 / 55
-4/26/19
104
43.6
CMP: INR91
n
TP: INR91 (+0%)
Balance sheet clean-up phase; PAT turns positive after three quarters
JKBK reported PAT of INR302m in 1QFY18 (+32% YoY on a low base), after
three consecutive quarters of losses. Adjusted for excess provisions made by
the bank (which it created from DTAs recognized), PAT came in at INR2.7b.
Slippages of INR5.1b (22% decline from INR6.5b in 4Q) were partly offset by
strong recoveries and upgrades of INR1.9b. Gross/net slippage ratio stood at
4.1%/2.5% v/s 5.2%/2.8% in 4QFY17. Steep provisioning helped increase PCR,
leading to a 7% QoQ decline in NNPAs (4.3% v/s 4.6% of advances in 4Q), with
an increase in reported PCR to 70.26% from 66.9% in 4Q. GNPA stood at 10.6%.
Standard restructured loans stood at INR55.5b (11% of loans). S4A book stood
at INR2.45b at the end of the quarter.
NII grew ~13% YoY (+9% QoQ), led by sharp improvement in NIM to 3.7%
(+20bp QoQ, +32bp YoY), even as loan book was flat YoY and declined 2% QoQ.
NIM improved on the back of 37bp/36bp QoQ/YoY increase in spreads, as the
bank’s cost of funds declined 22bp/65bp QoQ/YoY.
Total income growth of 6%/10% QoQ/YoY was partially offset by opex growth
of 13% YoY (-10% QoQ on one-off high base), resulting in 33%/5% QoQ/YoY
PPoP growth.
Other highlights:
(1)
Loan growth was flat YoY (-2% QoQ; share of J&K State
loans stood at ~51% v/s 50% in FY17.
(2)
CASA ratio stood at 50.9% (-80bp
QoQ).
(3)
Tier 1/CAR stood at 9.16%/11.1%.
Valuation and view:
While we like management’s focus on clean-up of balance
sheet, continued high stress additions and high proportion of restructured
book remain a cause for concern. Recoveries/resolutions in non-J&K state
corporate portfolio (19% NPA) will be a significant trigger for the bank.
Maintain
Neutral.
n
Financials & Valuations (INR b)
Y/E March
2018E 2019E 2020E
NII
28.0
30.3
34.6
OP
14.0
14.4
16.5
NP
2.0
4.3
6.0
n
NIM (%)
3.6
3.5
3.5
EPS (INR)
3.8
8.2
11.6
EPS Gr. (%)
NA 115.2
40.3
BV/Sh. (INR)
111.8 118.0 126.8
ABV/Sh. (INR)
88.4 100.1 113.9
n
RoE (%)
3.5
7.2
9.4
RoA (%)
0.2
0.4
0.5
P/E(X)
21.9
10.2
7.3
n
P/BV (X)
0.8
0.7
0.7
n
25 July 2017
20

RESULTS
FLASH
24 July 2017
Results Flash | Sector: Entertainment
Delta Corp
Buy
BSE SENSEX
32,246
S&P CNX
9,966
CMP: INR174
n
n
TP: INR215(-23%)
We will revisit our estimates
post earnings call/management
interaction.
Financials & Valuations (INR b)
Y/E Mar
2017 2018E
Net Sales
4.5
6.4
EBITDA
1.6
2.4
NP
0.7
1.5
EPS (INR)
3.1
5.7
EPS Gr. (%)
125.5
86.0
BV/Sh. (INR)
39.7
59.3
RoE (%)
8.1
12.1
RoCE (%)
9.6
12.6
P/E (x)
57.0
30.6
P/BV (x)
4.4
2.9
Revenue beats, but PAT misses estimate
DELTA reported overall revenue of INR1,286m (est. of INR1,180m), as against
INR1,087m in 1QFY17, marking growth of 18.4%.
EBITDA margin shrunk 300bp YoY to 35.2% in 1QFY18 (est. of 38.1%). EBITDA
stood at INR453m (est. INR450m), as against INR415m in 1QFY17.
Consequently, adjusted PAT stood at INR211m in 1QFY18 (est. INR255m), as
against INR170m in 1QFY17, on account of income from exceptional items of
INR18m.
Gaming revenue grew 20% YoY to INR1,157m, while there was marginal growth
of 4% YoY in hospitality revenue to INR175m.
Valuation and view:
We will revisit our estimates post the discussion with
management. Amalgamation of Gauss Network with the company and the Goa
government’s decision of bringing offshore casino operations on land would be
keenly watched. Based on current estimates, it trades at 5.7/7.2x FY18/19E
EPS. Maintain
Buy.
2019E
n
7.8
3.1
1.9
7.2
n
26.0
64.9
11.5
11.8
n
24.3
2.7
Consolidated - Quarterly Earning Model
Y/E March
Net Sales
YoY Change (%)
Total Expenditure
EBITDA
Margins (%)
Depreciation
Interest
Other Income
PBT before EO expense
Extra-Ord expense
PBT
Tax
Rate (%)
Minority Interest &
Profit/Loss of Asso. Cos.
Reported PAT
Adj PAT
YoY Change (%)
Margins (%)
E: MOSL Estimates
1Q
1,087
34.6
671
415
38.2
91
87
9
246
-46
292
85
29.2
4
202
170
2,539.9
15.6
FY17
2Q
3Q
1,343
1,036
43.8
3.4
776
723
567
313
42.2
30.2
93
89
87
82
11
11
399
152
2
5
397
91
22.9
-16
322
323
494.1
24.1
147
40
27.2
6
101
105
-9.4
10.1
4Q
1,081
5.3
737
344
31.8
87
94
19
182
0
181
64
35.4
3
114
114
-29.3
10.5
1Q
1,286
18.4
833
453
35.2
89
70
37
332
-18
350
127
36.1
1
223
211
24.4
16.4
FY18
2QE
3QE
1,630
1,745
21.4
68.5
941
1,138
689
607
42.3
34.8
105
112
33
30
36
43
587
508
0
0
587
153
26.0
0
435
435
34.4
26.7
508
122
24.0
0
386
386
269.3
22.1
FY17
4QE
1,844
70.5
1,191
653
35.4
112
30
76
587
0
587
141
24.0
0
446
446
291.7
24.2
4,547
21.2
2,907
1,640
36.1
361
350
49
978
42
936
280
29.9
2
654
683
118.8
15.0
FY18E
6,399
40.7
3,999
2,400
37.5
423
130
180
2,027
0
2,027
507
25.0
3
1,518
1,518
122.1
23.7
(INR Million)
FY18
Var
1QE
%
1,180
9
8.6
730
450
1
38.1
94
37
26
344
-4
0
344
89
26.0
0
255
255
50.1
21.6
2
-12
-17
25 July 2017
21

24 July 2017
Metals Weekly
Chinese export steel prices continue to trend higher
n
n
n
n
n
Indian steel: Long product (TMT Mumbai) prices were unchanged WoW. Sponge iron prices were up ~2%
WoW while domestic scrap prices were up ~5% WoW. Domestic iron ore and pellet prices were unchanged.
Domestic HRC prices were unchanged, but import price offers were up ~2% WoW.
Raw Materials: Iron ore prices (China cfr) were up ~2% WoW. Chinese iron ore port inventories were
unchanged. Thermal coal prices were up ~2% WoW. Coking coal prices were up ~4% WoW on strong buying
activity in China. China pellet import prices were up ~1% WoW, as premium over iron ore remains strong.
Europe: HRC prices were up ~3% WoW, second consecutive week of increase. EU steel spreads improved on
higher steel prices, offset partly by increase in iron ore and coking coal. CIS export HRC prices were up ~1%
WoW. Rotterdam scrap prices were up ~1% WoW.
China: local HRC prices were up ~1% WoW, while rebar prices were down ~1% WoW. Steel inventories are
declining. Export HRC/rebar prices were up ~2/1% WoW, respectively. The mill spreads are at multiyear high.
Base metals: Aluminum (cash LME) was unchanged. Zinc (cash LME) was unchanged while lead was down ~2%
WoW. Copper was up ~2% WoW. Crude oil (Brent) prices were down ~2% WoW.
25 July 2017
22

June 2017 Results Preview | Consumer
Asian Paints
Bloomberg
Equity Shares (m)
M. Cap. (INR b)/(USD b)
52-Week Range (INR)
1,6,12 Rel Perf. (%)
APNT IN
959.2
1064 / 16
1230 / 850
-4 / 5 / -4
n
CMP: INR1,109
n
TP: INR1,240 (+12%)
Neutral
We expect revenues to grow 2% YoY to INR37.1b in 1QFY18, with
flattish volumes in the domestic decorative business.
We note that crude prices have been flat YoY and are actually
down 8% QoQ in 1QFY18. The magnitude of price movement in
crude derivatives is lower vis-à-vis crude prices. Gross margin is,
however, likely to contract 300bp YoY to 44.2% in 1QFY18, mostly
due to an unfavorable base.
Operating margin to contract 200bp to 20.6% in 1QFY18.
We thus estimate 6% PAT decline for 1QFY18.
The stock trades at 40.4x FY19E EPS of INR27.4; Maintain Neutral.
Financial Snapshot (INR b)
y/e March
2017 2018E 2019E 2020E
Sales
EBITDA
Adj. PAT
Adj. EPS.INR
EPS Gr. (%)
BV/Sh.(INR)
RoE (%)
RoCE (%)
Payout (%)
Valuations
P/E (x)
P/BV (x)
EV/EBITDA
(x) Yield (%)
Div.
52.7
14.0
34.2
1.1
47.9
13.4
30.8
1.2
40.4
11.5
26.0
1.2
33.4
9.5
21.5
1.2
152.9 175.7 206.4 242.8
30.2
20.2
21.0
8.7
79.3
28.5
24.3
47.6
33.5
22.2
23.1
10.0
82.7
28.6
24.9
49.7
39.6
26.3
27.4
18.6
30.6
27.0
41.9
47.3
31.8
33.2
20.9
31.1
28.0
34.7
n
n
n
96.7 116.4
Key issues to watch for:
Ø
Volume growth trends and demand scenario in urban and rural
geographies.
Ø
Demand outlook for industrial paints.
Ø
Outlook for raw materials/pricing actions.
Quarterly Performance (Consolidated)
Y/E March
Dom Deco Volume Growth %
Net Sales
Change (%)
Raw Material/PM
Gross Profit
Gross Margin (%)
Operating Expenses
% of Sales
EBITDA
Margin (%)
Change (%)
Interest
Depreciation
Other Income
PBT
Tax
Effective Tax Rate (%)
PAT before Minority
Minority Interest
Adjusted PAT
E: MOSL Estimates
1Q
11.0
36,374
9.1
19,191
17,183
47.2
8,981
24.7
8,203
22.6
20.9
64
855
719
8,003
2,603
32.5
5,400
50
5,351
FY17
2Q
3Q
12.0
2.0
37,633
39,370
9.6
2.6
20,876
22,045
16,758
17,325
44.5
44.0
9,628
9,562
25.6
24.3
7,130
7,763
18.9
19.7
17.3
-1.2
60
92
844
855
791
415
7,017
7,231
2,207
2,465
31.5
34.1
4,810
4,766
51
104
4,759
4,662
4Q
10.0
39,525
7.8
22,194
17,330
43.8
10,211
25.8
7,119
18.0
2.1
90
835
701
6,895
2,205
32.0
4,690
-106
4,796
1QE
0.0
37,101
2.0
20,688
16,414
44.2
8,789
23.7
7,625
20.6
-7.0
64
983
805
7,383
2,289
31.0
5,094
50
5,045
FY18
2QE
15.0
45,160
20.0
25,502
19,657
43.5
11,779
26.1
7,878
17.4
10.5
60
970
886
7,734
2,398
31.0
5,337
51
5,286
3QE
15.0
47,244
20.0
26,218
21,026
44.5
11,710
24.8
9,316
19.7
20.0
92
983
464
8,705
2,699
31.0
6,006
104
5,902
4QE
10.0
46,217
16.9
25,321
20,896
45.2
12,260
26.5
8,636
18.7
21.3
471
954
795
8,006
2,482
31.0
5,524
-426
5,950
(INR Million)
FY17
8.8
152,902
7.1
84,306
68,596
44.9
38,381
25.1
30,214
19.8
9.1
306
3,388
2,626
29,146
9,480
32.5
19,666
98
20,162
FY18
11.0
175,723
14.9
97,729
77,994
44.4
44,539
25.3
33,455
19.0
10.7
687
3,890
2,951
31,829
9,867
31.0
21,962
-222
22,184
25 July 2017
23

December 2015 Results Preview | Sector: Financials
June 2017 Results Preview | Sector: Financials - Banks
Axis Bank
Bloomberg
Equity Shares (m)
M. Cap. (INR b)/(USD b)
52-Week Range (INR)
1,6,12 Rel Perf. (%)
AXSB IN
2395.1
1219 / 19
638 / 425
0 / -5 / -21
n
CMP: INR509
n
TP: INR500 (-2%)
Neutral
Financial Snapshot (INR b)
Y/E March
2017 2018E 2019E 2020E
NII
OP
NP
NIM (%)
EPS (INR)
EPS Gr. (%)
BV/Sh. (INR)
RoE (%)
RoA (%)
Payout (%)
Valuations
P/E(X)
P/BV (X)
P/ABV (X)
Div. Yield (%)
33.1
2.2
2.5
1.0
21.4
2.1
2.3
1.0
12.6
1.8
2.1
1.2
9.9
1.6
1.7
1.5
180.9
175.8
36.8
3.6
15.4
-55.5
226.7
6.9
0.6
32.5
199.4
177.2
57.0
3.5
23.8
54.9
244.6
217.0
10.1
0.9
25.2
232.5
203.0
96.5
3.4
40.3
69.3
277.8
246.2
15.4
1.2
17.6
276.6
240.5
123.3
3.3
51.5
27.8
320.2
295.9
17.2
1.3
17.6
n
ABV/Sh. (INR) 203.3
n
n
We expect AXSB to report ~10% loan growth, driven by continued
strong growth in the retail and SME segments. Overall deposit
growth will continue to be strong at 19%, given a relatively low base
of 1QFY17 (pre-demon).
Yield on loans would remain under pressure following MCLR
cuts/aggressive competition in the refinance market. Margins are
expected to moderate marginally by ~10bp QoQ to 3.6%, coming
off a strong 4Q when margins had expanded 25bp QoQ. Margins
will also be impacted by stress additions.
Current watch-list stands at INR112b (2.2% of customer assets) and
is expected to be done away with completely in FY18. While
slippages should moderate in 1Q, we expect them to remain at
elevated levels (4.5% annualized slippage ratio), leading to high
credit costs.
We estimate PAT at INR12.4b v/s INR15.6b in 1QFY17 (v/s INR12.3b
in 4Q), subdued on a YoY basis owing to high NPA provisioning.
AXSB trades at 1.8x FY19E BV and 12.6x FY19E EPS. Neutral.
Key issues to watch for
Ø
Quantum of corporate slippages from watch-list and any revision in the
size of the same.
Ø
Quantum of loans rescheduled under 5:25, SDR and S4A.
(INR Million)
Quarterly Performance
Net Interest Income
% Change (Y-o-Y)
Other Income
Net Income
Operating Expenses
Operating Profit
% Change (Y-o-Y)
Other Provisions
Profit before Tax
Tax Provisions
Net Profit
% Change (Y-o-Y)
Operating Parameters
NIM (Cal, %)
Deposit Growth (%)
Loan Growth (%)
Tax Rate (%)
Asset Quality
Gross NPA (INR b)
Gross NPA (on cust. assets, %)
E: MOSL Estimates
1Q
45,169
11.4
27,383
72,552
27,858
44,694
9.2
21,172
23,522
7,967
15,555
-21.4
3.8
16.3
21.2
33.9
95.5
2.5
FY17
2Q
45,139
11.1
25,397
70,535
29,534
41,002
13.0
36,227
4,774
1,584
3,191
-83.3
3.7
17.3
18.5
33.2
163.8
4.2
3Q
43,337
4.1
34,002
77,339
30,937
46,402
16.4
37,958
8,444
2,649
5,796
-73.4
3.5
9.6
10.1
31.4
204.7
5.2
4Q
47,286
3.9
30,132
77,418
33,670
43,747
-0.5
25,813
17,935
5,684
12,251
-43.1
3.7
15.8
10.1
31.7
212.8
5.0
1QE
47,965
6.2
26,145
74,110
32,421
41,689
-6.7
23,000
18,689
6,261
12,428
-20.1
3.6
19.3
10.3
33.5
228.6
5.8
FY18E
2QE
3QE
48,918
50,107
8.4
15.6
28,432
30,430
77,350
80,537
34,606
35,810
42,745
44,728
4.3
-3.6
23,000
23,000
19,745
21,728
6,614
7,279
13,130
14,449
311.5
149.3
3.6
17.9
12.6
33.5
243.1
5.9
3.5
26.9
20.8
33.5
252.7
5.8
4QE
52,454
10.9
35,560
88,014
39,955
48,059
9.9
22,537
25,522
8,550
16,972
38.5
3.5
20.0
20.0
33.5
260.1
5.6
FY17
180,931
7.5
116,913
297,844
121,999
175,845
9.2
121,170
54,676
17,883
36,793
-55.3
3.6
15.8
10.1
32.7
212.8
5.0
FY18
199,444
10.2
120,567
320,011
142,791
177,220
0.8
91,537
85,683
28,704
56,979
54.9
3.5
20.0
20.0
33.5
260.1
5.6
25 July 2017
24

June 2017 Results Preview | Sector: Telecom
Bharti Airtel
Bloomberg
Equity Shares (m)
M. Cap. (INR b)/(USD b)
52-Week Range (INR)
1,6,12 Rel Perf. (%)
BHARTI IN
3997.3
1516 / 23
401 / 284
2 / 4 / -13
n
CMP: INR379
n
TP: INR430 (+13%)
Buy
Financial Snapshot (INR Billion)
Y/E March
2017 2018E 2019E 2020E
Net Sales
EBITDA
Adj. NP
AdjEPS(INR)
AdjEPS Gr(%)
BV/Sh (INR)
RoE (%)
RoCE (%)
Payout (%)
Valuations
P/E (x)
P/BV (x)
EV/EBITDA x
Div. Yld (%)
34.5
2.3
7.3
0.3
65.2
2.2
7.5
0.3
35.3
2.1
6.6
0.3
24.8
1.9
5.5
0.3
954.7
353.3
44.4
11.1
-6.4
168.8
6.7
5.4
12.7
927.4 1,025.5 1,129.5
324.0
23.5
5.9
-47.1
173.4
3.4
4.7
20.5
367.7
43.4
10.9
84.7
183.1
6.1
5.5
11.1
417.0
61.7
15.4
42.2
197.3
8.1
6.4
7.8
n
n
n
We expect consolidated revenue to decline 0.6% QoQ (and 14.6%
YoY) to INR218.1b. We expect India wireless revenue to decline
1.3% QoQ (and 14.9% YoY) to INR128.1b and Africa revenue to
decline 1.9% QoQ to INR49.5b.
Consolidated EBITDA margin is likely to decline 160bp QoQ to
34.2%, led by 180bp contraction in India wireless margin to
35.1%, partly offset by 50bp expansion in Africa EBITDA margin to
27%.
Consolidated net profit is expected to fall 42% QoQ (85% YoY) to
INR2.2b.
We expect India wireless ARPU to decline 3.5% QoQ (and 22.3%
YoY) to INR152.1, with voice ARPU shrinking 2% QoQ and data
ARPU declining 7% QoQ.
Bharti trades at an EV/EBITDA of 7.5x FY18E and 6.6x FY19E.
Maintain Buy.
Key monitorables
Ø
Consolidated revenue (expect 0.6% decline QoQ).
Ø
India wireless revenue (expected to decline 1.3% QoQ).
Ø
Consolidated EBITDA margin (expected at 34.2%; -180bp QoQ).
Ø
India wireless EBITDA margin (expected at 35.1%; -180bp QoQ).
Consolidated - Quarterly Earning Model
Y/E March
Gross Revenue
YoY Change (%)
Total Expenditure
EBITDA
Margins (%)
Depreciation
Interest
Other Income
PBT before EO expense
Extra-Ord expense
PBT
Tax
Rate (%)
Minority Interest & P&L of Asso.Cos.
Reported PAT
Mobile ARPU (INR/month)
QoQ Growth (%)
Mobile MOU/sub/month
QoQ Growth (%)
Mobile Traffic (B Min)
QoQ Growth (%)
Mobile RPM (INR)
QoQ Growth (%)
E: MOSL Estimates
1Q
255,465
7.9
159,985
95,480
37.4
50,402
19,399
2,787
28,466
3,536
24,930
10,089
40.5
222
14,619
195.7
0.8
414.2
-0.2
315
2.2
0.47
1.0
FY17
2Q
3Q
246,515 233,357
3.4
-3.0
152,113 148,542
94,402 84,815
38.3
36.3
49,560 48,350
19,057 19,356
1,568
3,487
27,353 20,596
66
2,040
27,287 18,556
11,136 11,841
40.8
63.8
1,544
1,678
14,607
5,037
187.9
172.0
-4.0
-8.4
405.9
418.8
-2.0
3.2
313
330
-0.5
5.4
0.46
0.41
-2.0
-11.3
4Q
1QE
219,346 218,059
-12.1
-11.5
140,746 143,397
78,600
74,661
35.8
34.2
49,418
52,063
19,162
21,197
2,494
2,336
12,514
3,737
6,055
0
6,459
3,737
1,753
1,308
27.1
35.0
972
253
3,734
2,176
157.6
152.1
-8.4
-3.5
470.8
477.8
12.4
1.5
381
396
15.5
3.7
0.33
0.32
-18.5
-4.9
FY18
2QE
3QE
4QE
227,901 236,517 244,955 954,683 927,431
-2.3
7.8
NA
335.2
NA
148,886 153,458 157,665 601,386 603,407
79,014
83,059
87,290 353,297 324,024
34.7
35.1
35.6
37.0
34.9
52,063
52,063
52,063 197,730 208,252
21,197
21,197
21,197
76,974 84,789
2,336
2,336
2,336
10,336
9,342
8,089
12,134
16,365
88,929 40,325
0
0
0
11,697
0
8,089
12,134
16,365
77,232 40,325
2,831
4,247
5,728
34,819 14,114
35.0
35.0
35.0
45.1
35.0
547
821
1,108
4,416
2,729
4,711
7,066
9,530
37,997 23,482
159.6
166.4
171.7
192.9
177.0
4.9
4.2
3.2
-2.6
-8.2
482.6
497.1
502.1
409.1
425.6
1.0
3.0
1.0
18.0
4.0
405
422
431
1,171
1,340
2.4
4.2
2.2
-96.7
14.4
0.33
0.33
0.34
0.47
0.42
3.9
1.2
2.2
-17.5
-11.8
(INR Million)
FY17
FY18E
25 July 2017
25

June 2017 Results Preview | Sector: Capital Goods
GE T&D
Bloomberg
Equity Shares (m)
M. Cap. (INR b)/(USD b)
52-Week Range (INR)
1,6,12 Rel Perf. (%)
GETD IN
256.1
87 / 1
384 / 277
-3 / -5 / -19
n
CMP: INR339
n
TP: INR320 (-6%)
Neutral
Financial Snapshot (INR b)
Y/E March
2017 2018E 2019E 2020E
Net Sales
40.5 46.5 50.1 54.5
EBITDA
2.2
4.2
5.0
5.8
Adj. PAT
1.5
2.3
2.7
3.4
EPS (INR)
5.7
8.9 10.6 13.4
EPS Gr. (%)
325.3 56.0 18.5 26.7
BV/Sh. (INR)
40.3 45.9 52.5 60.8
RoE (%)
12.4 20.7 21.5 23.7
RoCE (%)
15.7 24.5 27.1 30.5
Payout (%)
31.4 31.4 31.4 31.4
Valuations
P/E (x)
P/BV (x)
EV/EBITDA (x)
EV/ Sales (x)
Div Yield (%)
59.0
8.4
40.8
2.2
0.5
37.8
7.4
21.3
1.9
0.8
31.9
6.4
17.4
1.8
1.0
26.6
5.9
15.5
1.7
1.2
n
We expect GETD to register revenue growth of 11% YoY to
INR11.1b in 1QFY18. Revenue growth would be driven by
execution of the Champa-Kurukshetra Phase-II project, which is
expected to be commissioned by 2QFY18.
We expect operating profit of INR500m in 1QFY18, as against
INR21m in 1QFY17. Gross margin is likely to expand 280bp to
30.5% from 27.8% in 1QFY17.
GETD is expected to book net profit of INR215m, as against
INR360m in 1QFY17. Maintain
Neutral.
Key issues to watch
Ø
Progress in the Champa-Kurukshetra Phase-II project.
Quarterly Performance
Y/E March
Sales
Change (%)
EBITDA
Change (%)
As of % Sales
Depreciation
Interest
Other Income
PBT
Tax
Effective Tax Rate (%)
Reported PAT
Change (%)
Adj. PAT
Change (%)
1Q
8,546
11.6
21
-70.3
0.2
217
226
326
-2,425
-455
18.8
-1,970
-2,041.0
360
254.6
FY17
2Q
8,340
-4.4
339
-50.1
4.1
220
239
435
315
109
34.6
206
-43.0
206
-43.0
3Q
11,623
62.8
722
-235.7
6.2
221
343
522
679
236
34.7
443
-215.4
443
-215.4
4Q
11,963
26.9
1,097
81.7
9.2
224
344
177
705
244
34.6
461
70.9
461
70.9
1Q
9,500
11.2
500
2,258.5
5.3
237
171
214
307
92
30.0
215
-110.9
215
-40.4
FY18
2Q
3Q
9,700
13,021
16.3
12.0
528
1,375
55.5
90.5
5.4
10.6
237
237
194
260
214
214
311
1,092
93
328
30.0
30.0
218
764
5.8
72.5
218
764
5.8
72.5
4Q
14,282
19.4
1,802
64.2
12.6
237
220
214
1,560
468
30.0
1,092
136.7
1,092
136.7
(INR Million)
FY17
40,521
22.7
2,230
-9.0
5.5
873
589
427
1,195
508
42.5
687
0.0
687
2.0
FY18
46,502
14.8
4,204
-9.0
9.0
873
589
427
3,169
508
16.0
2,661
0.0
2,661
2.0
25 July 2017
26

GSK Pharma
Bloomberg
Equity Shares (m)
M. Cap. (INR b)/(USD b)
52-Week Range (INR)
1,6,12 Rel Perf. (%)
GLXO IN
84.7
214 / 3
3540 / 2309
3 / -25 / -42
CMP: INR2,527 TP:INR2,700(7%)
Neutral
Financial Snapshot (INR Billion)
Y/E MARCH
2017 2018E 2019E 2020E
Sales
EBITDA
NP
EPS (INR)
EPS Gro. (%)
BV/Sh. (INR)
RoE (%)
RoCE (%)
Valuations
P/E (x)
P/BV (x)
EV/EBITDA
(x)
D. Yield (%)
73.5
15.8
60.0
2.9
48.6
19.3
41.2
2.9
42.1
22.9
33.9
2.9
38.9
22.9
30.5
2.9
29.3
3.5
2.9
34.4
-22.2
159.5
21.5
19.1
32.8
5.1
4.4
51.9
51.2
131.0
39.7
35.7
36.7
6.2
5.1
60.1
15.6
54.4
49.7
41.1
6.9
5.5
64.9
8.0
58.7
58.6
110.5 110.5
n
In 1QFY18, we expect GlaxoSmithKline Pharmaceuticals (GLXO) to
report modest 12% YoY increase in revenues to INR7.7b.
n
EBITDA is expected to increase ~73% YoY to INR1.2b due to
expansion in margin by 560bp to 15.8%.
n
Decline in EBITDA margin will impact adj. PAT, which is expected to
decline ~2% YoY to INR881m. Growth and profitability are expected
to gradually improve with volume ramp-up in key NLEM products.
n
We believe GLXO has strong parent support, superior brand
portfolio (competitive advantage), high payout ratio (>100%) and
industry-leading return ratios (RoCE of ~50%). We maintain our
Neutral rating with a target price of INR2,700 @ 45x FY19E PER.
Key issues to watch out
Ø
New product introductions in FY18E.
Ø
Market performance of products impacted by DPCO 2013.
Quarterly performance
Y/E March
(Standalone)
Net Sales
YoY Change (%)
Total Expenditure
EBITDA
Margins (%)
Depreciation
Other Income
PBT before EO Expense
Tax
Rate (%)
Adjusted PAT
YoY Change (%)
Margins (%)
Extra-Ord Expense
Reported PAT
1Q
6,852
10.2
6,150
702
10.2
54
441
1,090
386
35.4
705
-26.4
10.3
-18
723
FY17
2Q
7,829
11.8
6,584
1,245
15.9
66
343
1,522
536
35.2
987
-4.5
12.6
-2
988
3Q
6,893
-5.4
6,543
350
5.1
66
319
603
252
41.8
351
-57.8
5.1
-179
530
4Q
7,634
11.3
6,469
1,165
15.3
78
351
1,438
570
39.6
869
-3.3
11.4
-259
1,127
1QE
7,674
12.0
6,462
1,213
15.8
74
506
1,645
584
35.5
1,061
50.6
13.8
0
1,061
FY18E
2QE
8,768
12.0
7,383
1,385
15.8
74
506
1,817
645
35.5
1,172
18.8
13.4
0
1,172
3QE
7,720
12.0
6,500
1,220
15.8
74
506
1,652
586
35.5
1,065
203.8
13.8
0
1,065
4QE
8,606
12.7
7,331
1,276
14.8
74
506
1,708
606
35.5
1,102
26.8
12.8
0
1,102
(INR million)
FY17
FY18E
29,265
6.8
25,810
3,455
11.8
264
1,463
4,655
1,744
37.5
2,911
-22.2
9.9
-457
3,368
32,769
12.0
27,675
5,094
15.5
296
2,024
6,822
2,422
35.5
4,400
51.2
13.4
0
4,400
25 July 2017
27

June 2017 Results Preview | Sector: Automobiles
Hero MotoCorp
Bloomberg
Equity Shares (m)
M. Cap. (INR b)/(USD b)
52-Week Range (INR)
1,6,12 Rel Perf. (%)
HMCL IN
199.7
739 / 11
3880 / 2844
-3 / 6 / 3
CMP: INR3,700
TP:INR3,666 (-1%)
Neutral
Financial Snapshot (INR b)
Y/E March
2017 2018E 2019E 2020E
Sales
EBITDA
NP
Adj. EPS (INR)
EPS Gr. (%)
BV/Sh. (INR)
RoE (%)
RoCE (%)
Payout (%)
Valuations
P/E (x)
P/BV (x)
EV/EBITDA (x)
Div. Yield (%)
21.9
7.3
14.6
2.3
18.7
6.2
12.1
2.4
18.6
5.4
12.0
2.4
16.9
4.7
10.8
2.4
284.7 323.9 348.8 382.3
46.3
33.8
6.9
35.7
34.5
57.8
54.1
39.6
17.2
36.0
34.7
52.2
54.0
39.7
0.3
31.0
30.0
52.1
59.1
43.8
10.0
29.6
28.8
47.3
169.1 198.2 198.7 218.6
506.3 596.1 686.3 794.8
n
Volume increased 6% YoY (and 14% QoQ) to 1.84m units, led by
gradual recovery post demonetization impact and stocking of
inventory to meet festive demand starting next month.
n
Realization would increase by 2% YoY (flat QoQ) to
INR43,267/unit. We estimate negative impact of INR100 per unit
due to discount and compensation related to GST.
n
Net revenue should grow 8% YoY (and 14% QoQ) to INR80b.
n
EBITDA margin is expected to increase by 25bp YoY (and 156bp
QoQ) to 16.9% led by lower RM and operating leverage befits.
n
EBITDA is likely to grow 10% YoY (and 25% QoQ) to ~INR13.5b.
n
We expect PAT to increase 10% YoY (and 16% QoQ) to INR9.7b.
n
We keep FY18E EPS unchanged while we reduce FY19E EPS by
1.3%. The stock trades at 18.7x FY18E and 18.6x FY19E EPS;
maintain
Neutral.
Key issues to watch
Ø
Update on demand environment (especially rural areas) at the retail
level and channel inventory.
Ø
Ø
Ø
Cost related to dealer compensation for ITC loss due to GST.
Guidance on export plans and new launches along with timelines.
Update on cost saving initiatives.
Quarterly Performance
Y/E March (INR m)
Total Volumes ('000 nos)
Growth YoY (%)
Net Realization
Growth YoY (%)
Net Op Revenues
Change (%)
RM Cost (% sales)
Staff Cost (% sales)
Other Exp (% sales)
EBITDA
EBITDA Margins (%)
Other Income
Interest
Depreciation
PBT
Effective Tax Rate (%)
Adj. PAT
Growth (%)
E: MOSL Estimates
1Q
1,745
6.1
42,391
1.0
73,989
7.2
67.1
4.5
11.7
12,301
16.6
1,204
15
1,152
12,337
28.4
8,831
18.1
FY17
2Q
1,823
15.8
42,755
-1.1
77,963
14.5
66.5
4.6
11.4
13,689
17.6
1,524
16
1,193
14,004
28.3
10,042
27.7
3Q
1,473
-12.8
43,202
1.1
63,646
-11.9
64.9
5.9
12.3
10,797
17.0
1,319
15
1,249
10,853
28.9
7,720
-2.7
4Q
1,622
-5.8
43,375
-0.5
70,352
-6.3
67.3
4.7
12.7
10,776
15.3
1,182
15
1,353
10,590
20.9
8,378
0.5
1QE
1,849
6.0
43,267
2.1
80,016
8.1
66.5
4.6
12.0
13,505
16.9
1,250
6
1,350
13,399
27.4
9,732
10.2
FY18E
2QE
1,970
8.0
43,483
1.7
85,661
9.9
66.3
4.8
12.0
14,556
17.0
1,400
7
1,360
14,589
27.4
10,596
5.5
3QE
1,795
21.8
43,700
1.2
78,442
23.2
66.0
5.1
12.2
13,096
16.7
1,500
6
1,370
13,220
27.4
9,602
24.4
4QE
1,822
12.3
43,809
1.0
79,800
13.4
66.0
4.9
12.8
12,989
16.3
1,700
26
1,382
13,281
27.4
9,646
15.1
(INR Million)
FY17
6,664
0.5
42,729
-0.4
284,750
0.1
66.8
4.9
12.1
46,348
16.3
5,224
61
4,927
46,585
27.5
33,771
6.9
FY18E
7,436
11.6
43,562
1.9
323,919
13.8
66.2
4.8
12.2
54,146
16.7
5,850
45
5,462
54,489
27.4
39,576
17.2
25 July 2017
28

June 2017 Results Preview | Consumer
Pidilite Industries
Bloomberg
Equity Shares (m)
M. Cap. (INR b)/(USD b)
52-Week Range (INR)
1,6,12 Rel Perf. (%)
PIDI IN
512.7
420 / 6
837 / 569
4 / 18 / 0
CMP: INR820
n
n
n
TP: INR835 (+2%)
Neutral
Financial Snapshot (INR b)
Y/E March
2017 2018E 2019E 2020E
Sales
EBITDA
Adj. PAT
Adj. EPS (INR)
EPS Gr. (%)
BV/Sh.(INR)
RoE (%)
RoCE (%)
Payout (%)
Valuations
P/E (x)
P/BV (x)
EV/EBITDA (x)
Div. Yield (%)
49.0
12.7
32.6
0.6
44.5
10.3
28.8
0.4
38.7
8.4
24.7
0.4
33.5
6.9
21.0
0.4
56.2
12.6
8.6
16.7
6.7
64.5
28.2
26.8
29.2
63.7
14.1
9.5
18.4
10.2
79.4
25.6
24.6
16.3
73.9
16.1
10.9
21.2
14.8
24.0
23.2
14.2
85.7
18.6
12.6
24.5
15.8
22.8
22.1
12.2
n
We expect Pidilite’s (PIDI) revenue to grow by 2% YoY, led by 2%
volume growth in Consumer and Bazaar segment.
EBITDA margin is expected to contract 150bp YoY to 23.6%.
We expect EBITDA and PAT to decline by 4% and 6% YoY,
respectively.
While we like the business franchise and the long-term growth
prospects, fair valuations at 38.7x FY19E EPS of INR21.2 keep us
Neutral on the stock.
97.1 118.1
Key issues to watch for:
Ø
Volume growth in Fevicol.
Ø
Outlook for VAM prices.
Ø
Outlook for industrial and construction chemical segments.
Ø
Progress on Elastomer project (if any).
Quarterly Performance (Consolidated)
Y/E March
Net Sales
YoY Change (%)
Total Expenditure
EBITDA
Margins (%)
Depreciation
Interest
Other Income
PBT before EO expense
Extra-Ord expense
PBT
Tax
Rate (%)
Adj PAT
YoY Change (%)
Margins (%)
E: MOSL Estimates
1Q
15,694
6.8
11,750
3,943
25.1
258
35
241
3,891
4
3,887
1,174
30.2
2,717
16.4
17.3
FY17
2Q
14,177
7.5
10,951
3,225
22.8
303
26
324
3,220
11
3,209
912
28.4
2,309
12.4
16.3
3Q
13,344
-0.3
10,477
2,866
21.5
295
30
272
2,814
0
2,814
793
28.2
2,020
1.5
15.1
4Q
12,954
4.9
10,375
2,579
19.9
296
48
286
2,520
0
2,520
971
38.5
1,549
-7.5
12.0
1QE
16,008
2.0
12,226
3,782
23.6
270
32
193
3,672
3,672
1,120
30.5
2,552
-6.1
15.9
FY18
2QE
16,303
15.0
12,513
3,791
23.3
318
24
259
3,708
3,708
1,131
30.5
2,577
11.6
15.8
3QE
16,012
20.0
12,573
3,439
21.5
310
27
218
3,321
3,321
1,013
30.5
2,308
14.2
14.4
4QE
15,388
18.8
12,331
3,058
19.9
318
37
204
2,907
2,907
887
30.5
2,021
30.5
13.1
(INR Million)
FY17
56,168
4.8
43,570
12,598
22.4
1,151
139
1,123
12,430
4
12,430
3,851
31.0
8,579
6.7
15.3
FY18E
63,711
13.4
49,642
14,070
22.1
1,217
119
874
13,608
0
13,608
4,151
30.5
9,458
10.2
14.8
25 July 2017
29

June 2017 Results Preview | Sector: Metals
Vedanta
Bloomberg
Equity Shares (m)
M. Cap. (INR b)/(USD b)
52-Week Range (INR)
1,6,12 Rel Perf. (%)
VEDL IN
3717.0
1014 / 16
278 / 85
-2 / 36 / 197
CMP:INR272
n
TP: INR250 (-8%)
Neutral
Financial Snapshot (INR Billion)
Y/E March
2017 2018E 2019E 2020E
Sales
EBITDA *
NP
Adj. EPS (INR)
EPS Gr (%)
BV/Sh. (INR)
RoE (%)
RoCE (%)
Payout (%)
Valuation
P/E (x)
P/BV
EV/EBITDA,
x*
Div. Yield (%)
15.5
1.4
7.2
8.3
10.7
1.5
6.5
6.0
10.1
1.5
5.8
6.6
9.4
1.6
5.3
6.9
162.7
9.7
12.4
154.2
722.3
175.5
56.3
15.1
809
195.5
81.9
22.0
45.5
157.8
13.7
13.9
77.4
888
213.0
86.5
23.3
5.7
153.1
15.0
14.7
79.5
958
226.1
93.3
25.1
7.8
150.2
16.5
15.2
77.5
We estimate VEDL’s EBITDA to increase 49% YoY to INR51.3b,
driven by zinc and aluminum. Adj. PAT is estimated to increase
125% YoY to INR13.8b.
n
By segments:
n
Aluminum:
EBITDA is estimated to increase by 125% YoY to
INR5.9b, driven by higher LME (up USD339/t YoY to USD1,909/t)
and volumes (up 42% YoY to 324kt), partly offset by increase in
alumina and carbon product costs.
n
Zinc:
EBITDA is estimated to increase by 109% YoY to INR23.6b on
higher volumes and LME.
n
Iron ore:
EBITDA is estimated to decline by 40% YoY to INR2.2b,
driven by lower pig iron realization.
n
Power:
EBITDA is estimated to decline by 37% YoY to INR2.4b on
shut-down at Talwandi Saboo.
n
Copper:
EBITDA is down 19% YoY to INR4.4b on lower Tc/Rcs.
Volumes are estimated to be unchanged YoY at 100kt.
Key issues to watch for:
Ø
Progress on ramp-up of 1.25mtpa smelter.
Ø
Movement in base metal prices.
Quarterly Performance (Consolidated)
Y/E March
Net Sales
Change (YoY %)
Total Expenditure
EBITDA
Copper
Aluminum
Iron ore
Power
Zinc-India
Zinc-International
Oil&Gas
Change (YoY %)
As % of Net Sales
Finance cost
DD&A
Other Income
PBT (before EO item)
EO exp. (income)
PBT (after EO item)
Total Tax
% Tax
Reported PAT
Profit from Associates
Minority interest
Adjusted PAT
Change (YoY %)
1Q
144,371
-15.2
109,975
34,396
5,410
2,660
3,730
3,870
11,309
2,490
-24.2
23.8
13,931
14,920
10,935
16,480
0
16,480
4,914
29.8
11,567
0
5,417
6,150
-56.4
FY17
2Q
3Q
158,596 194,171
-4.2
30.5
111,922 134,207
46,674
59,964
4,304
5,017
4,200
6,520
1,050
4,710
3,641
4,452
20,767
27,834
3,390
2,020
12,216
20.9
106.4
29.4
30.9
14,503
15,082
15,289
15,203
12,521
9,160
29,403
38,840
0
0
29,403
38,840
6,623
8,968
22.5
23.1
22,780
29,872
2
-20
10,261
11,188
12,521
18,663
50.1 -1,124.9
4Q
225,113
40.9
151,612
73,501
5,160
9,900
3,870
4,565
37,480
1,380
12,929
111.7
32.7
15,035
16,037
9,208
51,637
1,144
50,493
20,604
40.8
29,889
-8
15,775
15,249
34.8
1QE
181,742
25.9
130,401
51,341
3,322
5,984
1,113
1,160
23,652
3,539
12,572
49.3
28.2
15,404
16,091
9,200
29,045
29,045
7,972
27.4
21,073
20
7,250
13,843
125.1
FY18
2QE
3QE
200,520 207,699
26.4
7.0
139,496 142,877
61,024
64,822
4,202
3,977
8,085
8,559
783
2,849
5,023
5,033
27,960
30,073
3,029
2,507
11,942
11,823
30.7
8.1
30.4
31.2
15,108
14,812
16,427
16,762
10,677
10,421
40,166
43,669
40,166
11,024
27.4
29,142
10
8,509
20,643
64.9
43,669
11,986
27.4
31,683
5
9,154
22,534
20.7
FY17
4QE
218,956
-2.7
152,673
66,283
4,562
9,046
1,682
4,978
31,308
3,238
11,468
-9.8
30.3
13,923
17,768
11,360
45,952
45,952
12,612
27.4
33,340
15
8,522
24,833
62.8
(INR Million)
FY18E
808,916
12.0
565,446
243,470
16,062
31,675
6,427
16,193
112,993
12,314
47,806
14.1
30.1
59,248
67,048
41,658
158,833
0
158,833
43,594
27.4
115,238
50
33,435
81,853
45.5
722,250
12.4
508,931
213,319
16,926
23,057
13,224
16,425
95,302
9,261
40,132
40.8
29.5
58,550
62,915
45,806
137,660
1,144
136,516
37,783
27.7
98,733
-27
43,584
56,266
-73.8
25 July 2017
30

In conversation
1. Expect better margins from last year because of GST: V-mart
retail; Lalit Agarwal, CMD
n
n
n
n
Things have settled down, things are rolling back, most of the vendours have
started dispatching goods, customers are coming in.
Consumer demand is still little low otherwise GST is back to normal and seeing
supply chain streamlined
GST implementation has weakened the micro, small & medium enterprises
(MSME) sector in this particular quarter
Anticipate a small dip in the sales, he added. Expect better margins from last
year because of GST, said Agarwal.
2. Expect fy18 loan growth at 7-8%: Vijaya Bank; Kishore Sansi,
MD & CEO
n
n
n
n
n
Deposits have grown by 3.39 percent, advances have grown by 3.5 percent,
savings accounts have increased by 29.11 percent and current accounts have
increased by 32.42 percent year-on-year
Yield of advances is down due to accounts shifting to marginal cost of lending
rate (MCLR) regime.
Targets net interest margins of 3 percent by FY18.
Expect FY18 loan growth at 7-8 percent
Loan growth expected to come largely from micro, small and medium
enterprises (MSMEs), retail and mid-corporate sector
3. Raw material prices should decline going forward: cupid; Om
Garg, CMD
n
n
n
Target is to achieve more than 35 percent EBITDA margin
Raw material prices should decline going forward.
80 percent orders are from exports.
4. No threat for cable tv, our connection is based on real time:
GTPL Hathway; Aniruddhasinhji Jadeja, Promoter & MD
n
n
n
There is no threat for cable TV.
GTPL Hathway's connection is based on real time.
There is no need to reduce prices for cable TV
25 July 2017
31

From the think tank
1. Is a dotcom bubble repeat underway?
n
This time is different.” Those are usually famous last words when it comes to
markets. But it’s what a number of industry experts have been saying about the
US tech sector for the past three years or so, while others warn of a tech bubble.
Last week, the S&P 500 technology index went past its March 2000 peak. The
latter, of course, was the dotcom bubble’s acme and dying gasp both. Is this a
warning, or is it truly different this time? The San Francisco region is well
acquainted with the folly of greedy optimism. Halfway through 1847, the city
had less than 500 inhabitants. The California Gold Rush took off in 1849. By the
end of the year, San Francisco had between 25,000 and 30,000 inhabitants. Gold
fever was in the air. Dubious businesses flourished at the merest hint of
prospective gold strikes. The city’s real estate boom would have given the
apparatchiks trying to control China’s real estate bubble nightmares. About a
century-and-a-half later, history repeated itself.
2. How RBI can empower NBFCS to face challenges
n
India has shown dramatic improvement in terms of financial inclusion in the last
few years with around 20 crore people having gained access to financial services
as validated by a report by global consultancy firm BCG in 2016. According to a
recent report by The Global Microscope 2016, India is firmly among the leaders
in providing financial empowerment to the marginalised section of the society.
Through financial inclusion policies such as Pradhan Mantri Jan Dhan Yojana,
India’s effort in encouraging holistic economic development has shown
considerable progress. To sustain the economic growth of 7-8%, the focus needs
to shift towards broadening the scope of financial inclusion. Right now, the
focus is more towards providing un-banked entities with banking products and
tax benefits. It’s time to move beyond enablement to true empowerment. A
survey conducted across 540 SMEs by the Firstbiz and Greyhound Knowledge
Group last year reports, that over 500 SMEs in this country found ‘lack of easy
finance and credit instruments’ to be their most critical challenge. The fact that
money lenders continue to account for nearly 30% of total banking business
reflects the dependence of credit starved SMEs toward informal means for
raising money. This invariably results in exorbitantly higher interest rates for
loans, which most of the SMEs find difficult to pay back.
3. Healthcare systems need drastic surgery
n
High-end private healthcare in India has recently taken a couple of hard knocks.
The West Bengal Clinical Establishment Regulatory Commission, set up in
response to widespread public protests over mistreatment and overcharging,
has in an early verdict fined Apollo hospital chain ₹30 lakh over the death of a 4-
month-old at their Kolkata hospital for “mismanagement and
misrepresentation”. The hospital will appeal. Most recently, the Maharashtra
FDA (Food and Drug Administration) has sent to the National Pharmaceutical
Pricing Authority a report on startling overpricing of medical devices by leading
hospitals. In an obvious attempt to get around the regulator’s cap on the price
of coronary stents, these hospitals are levying a huge markup on balloon and
guiding catheters also used for angioplasty. If you add the margin that the
distributor makes, patients are paying five times the imported cost of these
devices. The latter already includes the development cost and the margin of the
manufacturer.
32
25 July 2017

4. The RBI’S Harsh prescription
n
In a press release issued on 13 June by the Reserve Bank of India (RBI) wherein
12 accounts for reference under Insolvency and Bankruptcy Code were cited, it
was also mentioned that RBI will notify revised provisioning norms for cases
accepted under the code. Certain newspapers have recently reported that RBI
has mandated banks to set aside at least 50% of the loan amount as probable
losses for cases referred under the code. These reports also suggest that the RBI
has directed a provisioning of 100% of the loan amount for cases that are not
resolved in the initial period of 180 days. If these reports are indeed true, the
RBI has probably erred on the side of caution. There is limited or no empirical
basis available in the public domain to justify the “zero recovery” assumption
envisaged by the RBI. In addition, the RBI’s assumption regarding the final
resolution timeline of 180 days is quite aggressive and does not align with the
findings based on the experience of developed countries.
International
5. Public offerings that serve a wealthy few
n
The US market in public share listings is ailing; over the past two decades, the
number of initial offerings has plunged 45 per cent. That is one reason Barack
Obama, then president, passed the Jumpstart Our Business Startups Act, which
allowed listing companies worth less than $1bn to keep their finances private
for longer. The Trump administration recently loosened those standards to
include any company of any size, the idea being that less onerous reporting
standards would encourage more public offerings. Jay Clayton, US Securities and
Exchange Commission chair, positioned it as a big win for the little guy. The
extent, he said, to which companies are eschewing public markets in the US
makes most individual investors unable to benefit from their growth.
25 July 2017
33

Click excel icon
for detailed
valuation guide
Rs
Valuation snapshot
P/E (x)
P/B (x)
FY17 FY18E FY17 FY18E
30.1
22.6
21.4
43.2
50.8
19.7
47.0
38.8
32.7
26.4
21.8
25.6
46.5
30.4
23.4
49.1
28.7
34.8
28.0
35.5
24.3
30.5
19.8
20.1
32.4
NM
36.9
44.2
13.5
21.8
29.3
27.4
NM
18.8
39.6
11.0
NM
25.9
989.9
20.6
107.7
47.6
37.4
24.6
15.4
57.4
34.9
16.7
29.4
19.4
25.0
17.3
20.6
30.0
37.0
19.1
33.5
29.8
17.7
22.2
18.6
20.8
25.3
25.8
15.0
35.4
22.3
22.5
23.4
34.7
21.5
25.8
19.4
17.2
25.1
22.9
30.6
29.2
10.2
17.6
23.3
8.9
11.7
11.7
9.4
9.4
8.9
15.7
16.4
6.4
13.1
33.6
19.0
20.5
12.1
47.0
32.3
13.0
21.5
15.5
5.6
5.0
4.8
6.4
8.3
3.1
16.3
7.4
3.3
3.7
7.3
3.2
2.9
6.3
2.7
11.4
4.9
2.4
2.9
2.5
2.3
5.0
2.2
1.4
4.7
0.8
4.8
4.6
1.1
3.4
3.3
1.1
0.7
0.7
0.6
1.1
0.4
0.9
1.4
0.5
0.9
9.1
4.4
4.1
1.8
17.2
6.5
4.0
3.5
3.5
4.7
4.2
4.4
5.5
7.4
2.7
11.8
6.1
2.8
3.3
6.2
2.9
2.6
5.5
2.3
9.1
4.2
2.2
2.3
2.4
1.9
4.5
2.1
1.3
4.1
0.8
4.3
3.3
1.1
2.9
3.0
1.0
0.7
0.7
0.5
1.0
0.4
0.9
1.3
0.5
0.9
7.4
3.6
3.5
1.6
14.1
5.9
3.6
3.0
3.0
ROE (%)
FY17 FY18E FY19E
20.3
23.3
25.3
16.2
15.8
16.9
40.3
20.8
10.6
14.0
35.7
14.2
6.4
20.3
9.8
25.6
17.1
6.9
10.8
8.9
9.9
17.9
10.2
7.2
15.4
-27.0
13.8
12.3
9.5
18.9
11.4
4.1
-6.7
4.2
1.4
10.1
-8.4
3.6
-0.2
2.7
0.9
21.7
15.1
18.1
14.4
32.5
19.3
25.5
12.4
19.4
20.4
26.5
22.2
19.8
21.1
15.1
40.8
22.4
17.3
14.8
36.0
14.1
10.8
20.8
16.5
28.6
19.0
10.1
11.4
7.1
10.2
18.2
9.4
7.9
17.3
5.8
15.0
13.6
10.8
18.0
12.8
11.9
6.1
6.2
5.8
10.9
4.6
5.6
8.7
8.1
6.7
24.3
20.9
18.5
14.1
33.0
18.3
29.0
15.3
20.6
20.7
28.3
24.0
22.3
21.9
17.8
38.0
23.6
18.3
15.9
31.0
14.6
11.5
22.8
27.3
35.2
22.6
15.4
11.8
10.1
10.5
19.0
10.1
8.8
18.5
7.0
16.3
13.9
12.7
19.5
14.3
13.2
9.0
9.1
7.3
11.2
5.4
7.5
10.0
10.5
8.3
25.9
21.6
18.9
15.6
32.8
17.4
32.7
17.5
19.7
Company
Automobiles
Amara Raja
Ashok Ley.
Bajaj Auto
Bharat Forge
Bosch
CEAT
Eicher Mot.
Endurance Tech.
Escorts
Exide Ind
Hero Moto
M&M
Mahindra CIE
Maruti Suzuki
Tata Motors
TVS Motor
Aggregate
Banks - Private
Axis Bank
DCB Bank
Equitas Hold.
Federal Bank
HDFC Bank
ICICI Bank
IDFC Bank
IndusInd
J&K Bank
Kotak Mah. Bk
RBL Bank
South Indian
Yes Bank
Aggregate
Banks - PSU
BOB
BOI
Canara
IDBI Bk
Indian Bk
OBC
PNB
SBI
Union Bk
Aggregate
NBFCs
Bajaj Fin.
Bharat Fin.
Cholaman.Inv.&F
n
Dewan Hsg.
GRUH Fin.
HDFC
Indiabulls Hsg
L&T Fin Holdings
LIC Hsg Fin
Reco
Buy
Buy
Buy
Buy
Neutral
Buy
Buy
Buy
Neutral
Buy
Neutral
Buy
Not Rated
Buy
Buy
Buy
CMP
(INR)
843
104
2,827
1,129
24,050
1,841
28,843
910
653
215
3,691
1,389
249
7,552
464
577
TP
% Upside
EPS (INR)
(INR) Downside FY17 FY18E FY19E
1,073
122
3,281
1,330
23,738
2,100
31,326
1,025
731
286
3,666
1,625
-
8,483
666
606
27
17
16
18
-1
14
9
13
12
33
-1
17
12
44
5
28.0
4.6
132.3
26.2
473.1
93.3
613.8
23.5
20.0
8.2
169.1
54.3
5.4
248.6
19.8
11.7
33.8
40.5
6.0
7.6
137.2 163.6
37.7
49.7
649.9 766.2
96.2
131.3
861.2 1,102.9
30.5
38.8
36.9
45.7
9.7
11.9
198.2 198.7
66.7
79.9
9.9
11.8
292.6 379.7
30.9
64.3
16.3
25.9
Neutral
534
Neutral
196
Buy
168
Buy
117
Buy
1,735
Buy
303
Neutral
60
Buy
1,553
Neutral
91
Buy
992
Under Review 526
Buy
29
Buy
1,593
500
192
207
134
1,885
340
62
1,800
89
1,153
-
34
2,121
-6
-2
24
14
9
12
3
16
-2
16
16
33
15.4
7.0
4.7
4.8
56.8
15.3
3.0
47.9
-31.3
26.8
11.9
2.2
73.0
23.8
8.4
4.8
5.5
67.1
15.6
3.5
61.9
4.0
32.4
18.0
2.9
90.7
40.3
10.4
7.4
6.8
79.4
17.9
4.2
76.8
8.2
41.0
23.7
3.7
114.6
Buy
Neutral
Neutral
Neutral
Buy
Neutral
Buy
Buy
Neutral
164
160
353
61
322
153
161
294
157
212
147
360
49
382
150
184
362
162
29
-8
2
-18
18
-2
14
23
3
6.0
-14.8
18.8
1.5
29.3
-31.6
6.2
0.3
7.6
18.4
13.7
30.1
6.4
34.4
17.1
10.3
17.9
24.6
22.5
22.0
47.0
8.6
38.3
21.4
14.5
23.3
34.5
Buy
Neutral
Buy
1,598
785
1,129
1,800
800
1,300
630
450
-
1,300
180
750
13
2
15
38
-4
13
17
1
33.6
21.0
46.0
29.6
8.1
46.8
69.0
5.2
38.2
47.6
41.3
55.0
37.7
9.9
50.7
88.9
7.2
47.9
62.9
53.0
66.4
47.1
12.1
55.9
113.9
9.6
53.8
Buy
456
Neutral
467
Under Review 1,635
Buy
1,155
Buy
154
Neutral
742
25 July 2017
34

Company
Reco
Manappuram
Not Rated
M&M Fin.
Buy
Muthoot Fin
Buy
PFC
Neutral
Repco Home
Buy
REC
Neutral
Shriram
City
Buy
Union
STF
Buy
Aggregate
Capital Goods
ABB
Sell
Bharat Elec.
Buy
BHEL
Sell
Blue Star
Neutral
CG Cons. Elec.
Buy
CG Power & Indu. Sell
Cummins
Buy
GE T&D
Neutral
Havells
Neutral
K E C Intl
Neutral
L&T
Buy
Pennar Eng.
Not Rated
Siemens
Neutral
Solar Ind
Neutral
Suzlon Energy
Not Rated
Thermax
Sell
Va Tech Wab.
Buy
Voltas
Sell
Aggregate
Cement
Ambuja Cem.
Buy
ACC
Neutral
Birla Corp.
Buy
Dalmia Bharat
Buy
Grasim Inds.
Neutral
India Cem
Neutral
J K Cements
Buy
JK Lakshmi Ce
Buy
Ramco Cem
Buy
Orient Cem
Buy
Prism Cem
Buy
Shree Cem
Buy
Ultratech
Buy
Aggregate
Consumer
Asian Paints
Neutral
Britannia
Buy
Colgate
Buy
Dabur
Neutral
Emami
Buy
Godrej Cons.
Neutral
GSK Cons.
Sell
HUL
Buy
ITC
Neutral
CMP
(INR)
108
364
462
128
781
181
2,319
964
TP
% Upside
EPS (INR)
(INR) Downside FY17 FY18E FY19E
-
8.6
10.8
12.5
415
14
7.1
13.6
16.4
550
19
29.5
41.0
43.3
117
-8
25.7
27.2
30.2
936
20
29.1
35.8
42.5
134
-26
31.4
35.0
40.4
2,900
1,340
25
39
84.3
55.6
132.8
78.5
171.2
98.5
P/E (x)
P/B (x)
FY17 FY18E FY17 FY18E
12.6
10.1
2.8
2.5
51.3
26.8
3.2
3.0
15.6
11.3
2.8
2.4
5.0
4.7
0.9
0.8
26.8
21.8
4.3
3.6
5.8
5.2
1.1
0.9
27.5
17.3
19.7
73.5
24.9
68.0
52.1
44.0
20.8
38.8
57.3
48.3
24.3
27.9
17.4
77.1
43.6
29.9
29.7
20.4
32.4
35.4
54.8
47.8
32.0
67.6
15.5
37.1
29.2
67.3
24.8
NM
347.7
46.1
43.6
36.8
55.0
51.9
50.4
42.2
41.6
52.4
35.3
59.0
34.9
17.5
12.3
16.5
64.6
24.0
41.0
37.7
37.6
37.3
35.2
53.0
42.2
22.5
25.0
13.6
56.6
39.7
21.5
28.0
16.9
32.1
31.2
36.9
34.7
22.9
39.3
14.8
22.4
24.4
41.1
21.7
34.6
32.6
39.0
45.7
31.0
50.0
44.8
41.7
39.5
39.1
45.4
33.2
50.5
31.6
3.0
1.9
3.3
9.3
5.1
1.1
8.5
23.9
1.3
7.6
8.1
8.8
4.7
3.3
1.8
7.2
8.0
-1.7
4.1
3.2
5.0
4.0
2.8
3.7
2.2
4.7
1.7
1.3
3.9
3.9
4.4
3.3
6.1
8.8
4.8
3.6
14.6
17.0
22.8
11.1
14.3
12.7
7.4
37.6
7.9
2.7
1.7
2.9
8.2
4.0
1.1
8.0
17.3
1.2
7.0
7.4
7.9
4.0
3.1
1.6
6.2
6.9
-1.9
3.7
2.8
4.5
3.6
2.6
3.6
2.0
4.2
1.5
1.2
3.4
3.6
3.7
3.1
5.2
7.3
4.4
3.3
14.0
14.0
21.6
9.5
12.0
9.9
7.2
36.2
7.8
FY17
24.0
6.3
19.4
17.9
17.4
19.9
11.7
11.7
16.9
12.7
20.6
1.6
18.0
76.4
6.2
21.2
12.4
18.2
21.2
12.2
10.2
9.3
19.8
NM
14.3
16.3
18.0
11.2
5.1
7.9
7.5
7.2
11.5
3.4
14.4
6.0
19.2
-3.2
1.8
20.2
11.6
9.7
28.5
36.9
50.4
28.4
35.8
24.6
22.2
65.6
23.5
ROE (%)
FY18E
25.9
11.4
23.2
17.0
18.1
19.1
16.2
14.7
17.8
12.6
16.5
2.7
21.7
53.4
3.4
20.7
14.7
18.6
19.2
12.6
11.6
11.0
18.6
-8.8
13.7
17.7
14.7
11.6
7.3
10.6
9.2
11.3
10.9
5.5
15.0
9.2
18.6
9.2
17.2
20.4
10.1
10.5
28.6
34.4
53.2
26.0
33.4
24.5
22.1
73.1
24.8
FY19E
26.9
12.8
21.4
16.8
18.2
19.1
18.1
16.3
17.9
15.8
16.8
3.4
30.1
49.8
4.2
23.5
16.4
20.7
20.9
13.4
12.6
13.7
19.9
-11.0
12.9
17.5
14.9
12.7
7.8
13.1
12.2
13.1
13.9
7.2
17.2
13.8
19.1
12.6
22.0
21.3
14.0
12.9
30.6
34.7
60.3
26.3
34.1
23.0
22.4
82.8
26.3
1,448
172
146
671
206
85
1,028
329
461
288
1,179
123
1,374
900
19
915
590
500
1,200
200
100
610
240
65
1,110
320
455
250
1,340
-
1,355
825
-
850
800
400
-17
16
-32
-9
17
-24
8
-3
-1
-13
14
-1
-8
-7
36
-20
19.7
6.9
2.1
12.9
4.7
4.1
26.5
5.7
9.6
11.9
42.3
7.1
17.8
20.6
0.6
30.8
28.9
15.5
22.4
7.2
3.6
17.8
5.5
2.3
29.2
6.2
10.9
12.8
47.1
9.1
24.3
22.6
0.9
32.7
34.9
15.6
31.6
8.1
4.7
26.6
6.6
4.5
36.0
7.6
13.8
16.4
54.0
11.2
33.3
28.2
1.0
34.0
39.8
17.6
268
1,727
939
2,622
1,053
209
985
468
675
160
121
17,716
4,185
291
1,622
1,205
3,162
1,384
219
1,287
553
823
178
145
21,052
4,936
9
-6
28
21
31
5
31
18
22
11
20
19
18
4.9
36.1
29.4
38.8
67.9
5.6
33.7
7.0
27.3
-1.6
0.3
384.4
96.1
7.3
49.8
40.9
66.7
71.2
9.3
40.4
11.4
31.1
4.6
3.7
454.7
91.5
8.2
65.0
58.9
87.1
102.6
12.9
53.5
19.2
37.5
7.0
5.6
575.2
138.8
1,156
3,825
1,070
306
1,104
991
5,516
1,158
293
1,240
4,450
1,335
315
1,265
930
4,500
1,285
280
7
16
25
3
15
-6
-18
11
-5
21.0
73.7
21.2
7.2
26.5
18.9
156.1
19.6
8.4
23.1
85.4
25.7
7.7
28.3
21.8
166.3
22.9
9.3
27.4
105.5
31.1
9.1
33.9
25.0
181.9
27.3
10.3
25 July 2017
35

Company
Jyothy Lab
Marico
Nestle
Page Inds
Parag Milk
Pidilite Ind.
P&G Hygiene
Prabhat Dairy
United Brew
United Spirits
Aggregate
Healthcare
Alembic Phar
Alkem Lab
Ajanta Pharma
Aurobindo
Biocon
Cadila
Cipla
Divis Lab
Dr Reddy’s
Fortis Health
Glenmark
Granules
GSK Pharma
IPCA Labs
Jubilant Life
Lupin
Sanofi India
Sun Pharma
Syngene Intl
Torrent Pharma
Aggregate
Logistics
Allcargo Logistics
Blue Dart
Concor
Gateway
Distriparks
Gati
Transport Corp.
Aggregate
Media
Dish TV
D B Corp
Den Net.
Hind. Media
HT Media
Jagran Prak.
PVR
Siti Net.
Sun TV
Zee Ent.
Aggregate
Metals
Reco
Neutral
Neutral
Sell
Buy
Neutral
Neutral
Buy
Not Rated
Neutral
Neutral
CMP
(INR)
378
331
6,830
16,735
253
812
8,239
137
815
2,641
TP
% Upside
(INR) Downside
405
7
360
9
5,990
-12
20,195
21
240
-5
835
3
9,082
10
-
850
4
2,415
-9
FY17
11.2
6.3
118.0
238.7
3.6
16.7
144.9
3.5
8.7
26.7
EPS (INR)
FY18E FY19E
8.9
11.0
6.9
8.4
118.6 139.5
317.0 400.0
7.4
12.3
18.4
21.2
155.8 181.6
3.5
6.4
9.7
14.7
37.4
51.8
P/E (x)
P/B (x)
FY17 FY18E FY17 FY18E
33.7
42.3
6.3
6.5
52.6
47.6 18.3 15.6
57.9
57.6 21.9 20.1
70.1
52.8 28.0 22.2
70.3
34.1
3.2
3.0
48.5
44.0 12.6 10.2
56.9
52.9 47.0 37.5
38.8
39.4
1.9
1.9
93.7
84.0
9.4
8.6
98.8
70.7 19.8 13.6
46.6
41.7 12.8 11.9
25.3
23.8
24.7
18.9
39.1
37.4
35.8
17.3
37.1
16.2
17.5
19.6
74.4
29.8
20.1
19.3
33.2
21.9
36.7
22.9
25.2
18.0
42.8
30.9
39.5
14.8
18.8
29.6
80.6
18.2
NM
10.7
11.9
16.2
66.8
NM
32.6
23.8
40.5
26.7
22.6
21.8
16.3
38.5
29.9
28.5
20.5
25.3
79.2
16.0
17.4
49.2
22.5
15.8
19.7
32.1
22.6
29.6
22.3
23.6
14.5
33.8
30.0
25.1
7.8
15.1
25.1
56.0
15.7
NM
9.8
11.1
14.2
47.4
NM
28.4
35.3
30.3
5.4
5.1
8.1
4.7
5.3
8.5
3.7
3.9
3.6
1.7
4.3
3.6
16.0
2.5
3.4
3.9
5.7
3.8
7.4
5.4
4.4
2.7
19.0
3.2
2.3
2.0
2.9
3.6
17.3
4.3
1.5
1.9
0.8
2.4
6.6
3.6
8.1
9.1
6.0
4.7
4.3
6.2
3.7
4.9
7.0
3.3
3.5
3.0
1.5
3.5
2.5
19.5
2.3
2.8
3.4
5.3
3.6
6.1
4.7
3.9
2.4
14.5
3.1
2.2
1.8
2.5
3.4
13.2
3.8
1.6
1.6
0.7
2.3
5.9
3.6
7.5
7.7
5.4
FY17
21.1
36.7
39.0
40.0
5.9
28.2
45.3
5.2
10.4
21.3
27.6
23.0
23.4
37.7
28.3
13.6
24.8
10.2
23.5
9.6
11.3
24.7
21.1
21.5
8.6
18.1
22.0
17.1
18.5
22.2
25.3
17.5
12.6
50.5
10.8
5.9
12.4
16.7
12.2
24.1
25.5
-12.0
19.0
7.1
17.6
10.4
-23.5
25.0
24.7
14.7
ROE (%)
FY18E
15.1
35.5
36.4
42.0
9.1
25.6
78.9
4.9
10.7
19.3
28.6
19.0
20.7
32.2
25.5
12.6
25.7
11.5
18.1
13.2
2.0
21.6
17.7
39.7
10.5
19.5
18.2
16.6
16.1
22.5
22.4
16.4
17.2
48.6
10.6
9.1
19.4
17.8
13.4
26.8
25.7
-5.3
17.3
6.9
16.4
13.2
-2.0
26.3
23.6
17.8
FY19E
18.4
38.1
39.0
42.8
13.4
24.0
74.0
8.5
14.6
19.7
29.6
20.4
21.0
29.9
22.3
15.6
27.2
12.8
19.4
14.9
5.3
20.9
18.8
54.4
12.7
19.6
19.4
18.1
17.9
20.7
24.2
17.4
17.8
46.8
11.8
11.1
25.4
18.6
15.0
327.5
26.5
0.7
17.3
6.4
17.2
17.7
6.9
30.2
23.7
22.7
Neutral
Neutral
Buy
Buy
Sell
Buy
Neutral
Neutral
Neutral
Buy
Neutral
Buy
Neutral
Neutral
Buy
Buy
Buy
Buy
Not Rated
Buy
546
1,797
1,441
745
399
532
570
687
2,692
167
689
142
2,556
479
744
1,143
4,287
571
478
1,267
510
1,900
2,028
850
300
510
500
680
2,600
240
800
200
2,700
480
905
1,475
4,820
650
-
1,450
-7
6
41
14
-25
-4
-12
-1
-3
43
16
41
6
0
22
29
12
14
14
21.6
75.7
58.4
39.3
10.2
14.2
15.9
39.7
72.6
10.3
39.3
7.2
34.4
16.1
37.0
59.2
129.1
26.1
13.0
55.2
20.5
79.7
66.1
45.7
10.4
17.8
20.0
33.6
106.2
2.1
42.9
8.2
51.9
21.3
47.1
57.9
133.6
25.2
16.1
56.8
25.5
95.0
79.6
50.0
14.4
23.2
25.0
40.0
143.0
6.1
51.7
11.5
60.1
28.5
56.7
72.0
160.6
30.8
18.0
71.4
Buy
Not Rated
Neutral
Buy
Not Rated
Not Rated
177
4,387
1,175
269
123
318
228
-
1,236
313
-
-
29
5
16
9.8
102.5
38.0
6.8
8.4
16.9
12.2
129.9
39.2
10.7
15.9
21.0
14.3
163.2
45.8
13.6
23.9
25.9
Buy
Buy
Neutral
Buy
Neutral
Buy
Buy
Neutral
Neutral
Buy
80
372
78
276
88
174
1,370
26
810
550
105
450
90
350
90
225
1,588
32
860
585
32
21
15
27
2
29
16
25
6
6
1.0
20.4
-8.6
25.9
7.4
10.8
20.5
-1.8
24.9
23.1
1.4
23.6
-2.7
28.3
7.9
12.3
28.9
-0.1
28.5
15.6
4.0
27.5
0.3
33.6
8.1
14.0
45.1
0.5
35.9
18.6
25 July 2017
36

Company
Hindalco
Hind. Zinc
JSPL
JSW Steel
Nalco
NMDC
SAIL
Vedanta
Tata Steel
Aggregate
Oil & Gas
BPCL
GAIL
Gujarat Gas
Gujarat St. Pet.
HPCL
IOC
IGL
MRPL
Oil India
ONGC
PLNG
Reliance Ind.
Aggregate
Retail
Jubilant Food
Titan Co.
Aggregate
Technology
Cyient
HCL Tech.
Hexaware
Infosys
KPIT Tech
L&T Infotech
Mindtree
Mphasis
NIIT Tech
Persistent Sys
Tata Elxsi
TCS
Tech Mah
Wipro
Zensar Tech
Aggregate
Telecom
Bharti Airtel
Bharti Infratel
Idea Cellular
Tata Comm
Aggregate
Utiltites
Coal India
CESC
JSW Energy
Reco
Buy
Sell
Buy
Buy
Neutral
Buy
Sell
Buy
Neutral
CMP
(INR)
214
278
138
214
70
122
63
265
547
TP
% Upside
EPS (INR)
(INR) Downside FY17 FY18E FY19E
308
44
16.2
21.8
26.1
246
-12
15.1
24.4
32.2
190
37
-20.9 -17.2
2.4
281
31
14.8
19.0
22.6
70
0
3.7
3.8
4.2
180
47
10.0
12.1
12.2
37
-42
-6.2 -10.6
-4.2
311
17
19.7
22.6
26.9
583
6
37.9
49.6
65.6
P/E (x)
P/B (x)
FY17 FY18E FY17 FY18E
13.2
9.8
1.6
1.4
18.4
11.4
1.7
1.6
NM
NM
0.4
0.4
14.4
11.3
2.3
2.0
19.0
18.6
1.3
1.3
12.3
10.1
1.7
1.6
NM
NM
0.7
0.8
13.4
11.7
3.6
3.9
14.4
11.0
1.7
1.5
19.1
14.7
1.6
1.5
9.6
16.7
37.3
20.5
9.1
8.8
26.8
8.1
14.6
9.9
17.8
16.7
12.3
125.0
59.4
65.0
17.7
15.1
17.7
15.8
10.3
13.8
19.4
14.9
14.1
16.9
29.7
19.0
12.9
17.3
15.5
16.9
37.8
27.6
NM
24.9
39.0
17.5
17.3
17.0
12.7
14.3
22.6
16.3
12.5
10.5
24.3
12.7
10.1
9.4
23.6
14.0
12.3
84.5
52.2
55.9
15.3
14.7
15.7
15.6
11.6
12.9
16.9
13.7
12.7
14.7
24.6
19.0
12.9
16.1
15.6
16.9
71.5
23.9
NM
63.5
127.3
14.8
11.4
20.9
3.0
1.7
6.4
2.3
2.8
1.8
5.4
2.1
0.8
0.9
3.8
1.7
1.6
10.2
11.3
11.2
2.9
3.8
4.3
3.3
1.6
4.8
3.2
2.0
1.9
2.6
9.3
5.6
2.1
2.8
2.5
3.9
2.5
4.9
1.3
11.6
2.7
6.6
1.8
1.0
2.6
1.6
5.2
2.0
2.4
1.6
4.6
1.8
0.7
0.9
3.4
1.5
1.5
9.4
10.3
10.3
2.5
3.7
3.8
3.0
1.4
3.7
3.1
2.3
1.8
2.5
7.5
6.0
1.9
2.7
2.2
3.9
2.4
4.3
1.6
9.8
2.7
6.6
1.5
1.0
FY17
14.0
9.7
-7.9
17.3
7.2
12.4
-6.7
24.4
15.7
8.2
32.4
9.6
17.8
11.6
32.4
21.2
21.0
31.4
5.7
10.1
23.2
11.6
13.3
8.2
20.6
17.2
16.2
27.5
26.5
22.0
14.3
40.4
16.8
13.2
13.7
17.0
37.1
32.6
18.4
16.9
17.2
22.9
6.7
16.2
-1.6
126.2
6.9
37.8
10.5
6.3
ROE (%)
FY18E
15.2
14.6
-5.4
18.7
7.0
15.0
-12.6
32.0
14.3
10.3
21.7
11.3
25.3
13.1
20.6
15.8
20.6
15.5
7.5
9.9
15.1
12.3
12.1
11.1
20.6
18.4
16.6
25.2
25.3
20.0
13.0
32.5
17.3
14.2
14.4
17.9
33.7
31.1
16.0
16.1
15.0
22.9
3.4
19.1
-15.3
16.7
2.1
44.5
14.4
4.9
FY19E
15.4
17.9
0.8
19.0
7.5
15.5
-5.5
35.1
16.8
13.2
22.3
11.8
28.0
14.0
20.0
15.8
19.6
17.0
7.8
10.8
26.4
12.3
12.6
14.0
21.6
19.2
17.3
25.8
23.5
19.8
14.2
28.4
20.1
16.1
15.4
20.7
32.3
33.5
16.9
16.1
17.9
22.3
6.1
18.7
-20.8
37.8
4.2
47.0
13.9
4.8
Neutral
Sell
Sell
Neutral
Buy
Neutral
Neutral
Sell
Buy
Buy
Buy
Neutral
466
376
762
180
369
377
1,138
120
281
163
202
1,616
511
340
697
168
420
459
1,070
113
305
195
259
1,499
10
-10
-8
-7
14
22
-6
-6
8
19
28
-7
48.3
22.6
20.4
8.8
40.7
43.0
42.5
14.8
19.3
16.4
11.4
96.7
36.7
26.3
33.7
11.0
29.5
36.0
46.8
9.4
27.9
17.4
8.6
115.5
43.5
29.8
46.5
13.1
32.6
40.0
51.9
11.7
30.1
19.7
17.6
128.1
Sell
Neutral
1,251
537
850
545
-32
2
10.0
9.0
14.8
10.3
20.7
12.1
Buy
Buy
Neutral
Buy
Neutral
Buy
Sell
Neutral
Neutral
Buy
Buy
Neutral
Buy
Neutral
Buy
542
903
242
991
123
764
484
580
536
636
1,671
2,533
399
292
809
600
960
235
1,200
140
850
450
600
540
750
1,607
2,350
465
270
950
11
6
-3
21
14
11
-7
3
1
18
-4
-7
17
-7
17
30.6
59.8
13.7
62.9
11.9
55.5
24.9
38.9
38.0
37.7
56.3
133.4
30.9
16.9
52.1
35.4
61.4
15.4
63.7
10.6
59.1
28.7
42.3
42.3
43.3
68.0
133.6
31.0
18.1
51.9
41.9
66.7
16.7
69.5
13.1
65.1
32.9
46.2
48.7
52.0
80.4
147.7
36.2
19.1
70.0
Buy
Buy
Buy
Buy
420
410
92
648
430
440
110
811
2
7
20
25
11.1
14.9
-1.1
26.0
5.9
17.2
-9.7
10.2
10.9
19.3
-11.2
30.8
Buy
Buy
Buy
261
899
66
315
1,140
85
21
27
29
14.9
51.9
3.9
17.6
78.6
3.2
18.6
86.0
3.1
25 July 2017
37

Company
NTPC
Power Grid
Tata Power
Aggregate
Others
Arvind
Avenue
Supermarts
Bata India
Castrol India
Century Ply.
Coromandel Intl
Delta Corp
Dynamatic Tech
Eveready Inds.
Interglobe
Indo Count
Info Edge
Inox Leisure
Jain Irrigation
Just Dial
Kaveri Seed
Kitex Garm.
Manpasand
MCX
Monsanto
Navneet
Education
PI Inds.
Piramal Enterp.
SRF
S H Kelkar
Symphony
TTK Prestige
V-Guard
Wonderla
Reco
Buy
Buy
Sell
CMP
(INR)
164
217
83
TP
% Upside
EPS (INR)
(INR) Downside FY17 FY18E FY19E
198
21
13.0
13.4
16.2
242
12
14.2
17.6
20.6
68
-18
5.2
6.4
6.7
P/E (x)
P/B (x)
FY17 FY18E FY17 FY18E
12.6
12.3
1.4
1.3
15.2
12.3
2.3
2.0
16.1
13.0
1.9
1.7
15.1
13.3
2.3
2.1
29.9
119.7
43.5
30.0
32.9
26.6
56.9
35.0
25.6
26.8
12.0
62.8
79.8
19.8
21.7
34.2
14.7
61.3
46.9
31.8
21.8
22.5
40.3
17.5
38.1
59.7
48.4
50.6
50.8
29.5
71.6
37.4
28.3
29.1
20.3
30.6
21.0
22.9
21.3
11.8
48.6
33.1
14.5
20.5
20.8
12.3
38.4
41.6
26.1
17.9
22.5
28.1
17.4
32.1
40.2
46.4
40.4
29.8
2.7
14.9
5.7
34.0
8.9
4.5
4.4
4.8
8.3
22.1
3.6
6.0
4.6
1.7
2.9
4.4
3.9
3.9
4.4
8.9
5.4
6.4
3.8
2.8
4.9
22.1
8.7
12.1
4.6
2.5
13.0
5.1
30.4
7.3
3.9
2.9
3.9
6.7
19.8
2.7
5.5
4.1
1.6
2.6
4.8
3.2
3.6
4.1
8.1
4.6
5.2
3.5
2.5
4.4
19.5
8.0
9.9
4.2
FY17
11.5
16.2
11.2
15.2
10.3
17.9
13.9
115.2
31.1
17.5
8.1
15.1
37.7
86.2
34.8
10.2
5.9
8.6
14.8
13.6
29.8
7.3
10.2
31.6
26.8
32.8
9.8
16.6
13.7
43.3
19.5
27.4
9.5
ROE (%)
FY18E
10.9
17.5
13.9
16.1
8.8
19.4
14.4
113.3
27.7
20.6
12.1
20.7
32.3
98.0
26.4
11.9
12.5
11.7
13.4
21.6
28.6
8.5
10.2
32.5
27.8
25.4
13.0
14.7
14.5
51.6
18.0
26.9
14.8
FY19E
12.3
17.8
12.1
16.8
11.8
23.3
15.8
106.1
29.6
21.6
11.5
24.3
31.6
136.2
23.5
12.3
16.2
14.8
13.7
26.0
27.6
13.5
14.5
34.5
28.2
23.8
16.4
16.7
15.6
54.5
20.7
28.8
17.5
Neutral
Neutral
Under Review
Buy
Neutral
Under Review
Buy
Buy
Buy
Neutral
Buy
Buy
Sell
Under Review
Neutral
Buy
Buy
Buy
Buy
Buy
Buy
Buy
Buy
Buy
Buy
Sell
Neutral
Neutral
Buy
370
919
588
409
286
442
174
2,367
330
1,234
156
984
266
110
379
652
272
779
1,164
2,741
169
751
2,923
1,501
276
1,412
6,390
181
355
359
804
-
527
323
-
215
3,334
368
1,283
200
1,050
240
-
465
755
394
927
1,300
3,295
226
952
3,044
1,816
287
1,288
5,281
167
393
-3
-12
29
13
24
41
12
4
29
7
-10
23
16
45
19
12
20
34
27
4
21
4
-9
-17
-8
11
12.4
7.7
13.5
13.6
8.7
16.6
3.1
67.6
12.9
46.0
13.0
15.7
3.3
5.5
17.5
19.1
18.6
12.7
24.8
86.2
7.8
33.4
72.6
85.9
7.2
23.7
132.1
3.6
7.0
12.5
12.8
15.7
14.4
9.8
21.8
5.7
112.9
14.4
57.9
13.2
20.3
8.0
7.6
18.5
31.3
22.1
20.3
28.0
105.1
9.4
33.4
104.1
86.3
8.6
35.1
137.8
4.5
11.9
18.1
17.9
19.4
15.0
12.9
26.1
7.2
166.7
17.5
91.6
15.4
22.9
12.0
10.0
21.1
37.7
26.2
30.9
42.2
126.7
11.3
38.1
144.6
109.2
10.3
42.9
176.1
6.0
16.0
25 July 2017
38

MOSL Universe stock performance
Company
Automobiles
Amara Raja
Ashok Ley.
Bajaj Auto
Bharat Forge
Bosch
CEAT
Eicher Mot.
Endurance Tech.
Escorts
Exide Ind
Hero Moto
M&M
Mahindra CIE
Maruti Suzuki
Tata Motors
TVS Motor
Banks - Private
Axis Bank
DCB Bank
Equitas Hold.
Federal Bank
HDFC Bank
ICICI Bank
IDFC Bank
IndusInd
J&K Bank
Kotak Mah. Bk
RBL Bank
South Indian
Yes Bank
Banks - PSU
BOB
BOI
Canara
IDBI Bk
Indian Bk
OBC
PNB
SBI
Union Bk
NBFCs
Bajaj Fin.
Bharat Fin.
Cholaman.Inv.&Fn
Dewan Hsg.
GRUH Fin.
HDFC
Indiabulls Hsg
L&T Fin.Holdings
LIC Hsg Fin
Manappuram
M&M Fin.
Muthoot Fin
PFC
Repco Home
REC
STF
Shriram City Union
1 Day (%)
0.5
0.9
0.4
-0.5
0.2
-0.3
-0.1
2.2
-0.4
-0.7
0.3
0.4
1.6
0.3
-0.2
1.1
-1.1
0.4
-0.3
-0.3
1.8
0.6
0.0
-0.9
8.0
-0.7
-1.1
2.4
0.9
1.5
3.2
0.7
2.6
-1.9
1.8
2.0
1.4
1.7
-1.2
0.4
-0.7
-0.6
-1.9
-0.4
1.5
0.7
0.3
3.4
2.8
2.0
-0.6
-2.1
-0.8
0.0
-1.9
1M (%)
0.4
12.9
0.1
1.8
1.0
2.1
6.1
3.7
-3.6
-0.7
0.8
0.9
7.9
4.3
4.6
7.5
5.9
-2.2
9.7
1.8
3.3
3.9
6.2
4.2
-0.1
0.6
4.0
4.1
10.9
2.1
19.2
4.0
7.9
11.6
6.3
12.1
1.9
7.3
14.1
10.6
6.2
3.6
7.1
-1.0
4.6
9.7
-1.3
14.3
9.9
3.5
4.3
-7.2
2.9
-0.2
-4.6
12M (%)
-6.6
7.6
3.9
53.5
-1.0
108.3
45.4
163.0
18.6
13.2
-3.7
39.8
71.1
-8.5
91.4
-0.6
95.5
-7.8
83.3
40.9
26.4
19.8
36.6
35.4
30.5
51.3
37.5
8.7
50.6
50.7
-15.7
121.5
37.4
34.1
31.8
24.3
80.7
-7.1
10.7
105.2
60.1
20.6
57.2
100.3
45.7
44.3
13.4
66.3
17.7
-7.5
73.5
-18.1
21.4
Company
Capital Goods
ABB
Bharat Elec.
BHEL
Blue Star
CG Cons. Elec.
CG Power & Inds Sol.
Cummins
GE T&D
Havells
K E C Intl
L&T
Pennar Eng.
Siemens
Solar Ind
Suzlon Energy
Thermax
Va Tech Wab.
Voltas
Cement
Ambuja Cem.
ACC
Birla Corp.
Dalmia Bharat
Grasim Inds.
India Cem
J K Cements
JK Lakshmi Ce
Ramco Cem
Orient Cem
Prism Cem
Shree Cem
Ultratech
Consumer
Asian Paints
Britannia
Colgate
Dabur
Emami
Godrej Cons.
GSK Cons.
HUL
ITC
Jyothy Lab
Marico
Nestle
Page Inds
Parag Milk
Pidilite Ind.
P&G Hygiene
Prabhat Dairy
United Brew
United Spirits
Healthcare
Alembic Phar
Alkem Lab
Ajanta Pharma
Aurobindo
Biocon
1 Day (%)
-0.9
0.6
0.7
-0.6
0.7
-0.6
2.1
0.4
-0.2
-1.8
-0.1
-0.6
0.9
0.5
-1.0
-1.2
-3.2
0.4
0.9
1.0
-0.8
-0.7
-0.8
0.1
0.2
0.9
0.0
0.2
-1.1
0.2
0.1
0.0
-0.2
0.0
1.0
0.4
3.3
0.9
-0.1
1.6
-1.5
0.4
0.2
-0.4
-0.4
1.0
2.3
0.6
0.2
-2.5
1.0
1.3
-1.6
-0.3
-0.3
1M (%)
0.5
4.6
8.4
8.8
-6.0
4.8
13.4
-3.9
-0.5
17.6
2.6
-8.8
3.3
10.7
3.3
-2.2
-15.9
10.2
10.3
5.6
6.7
5.9
7.7
3.8
1.9
-4.2
-1.0
11.5
1.8
4.7
4.6
0.2
4.8
-3.3
5.9
1.0
3.6
2.5
5.6
-5.7
3.3
6.1
3.2
2.5
19.5
-2.0
2.3
3.9
4.5
17.6
7.5
-1.5
-4.7
11.0
21.0
12M (%)
12.8
39.2
3.6
45.2
38.8
16.4
16.0
-8.7
22.5
104.4
12.3
-30.1
2.4
34.2
5.3
1.4
0.5
49.6
1.1
2.6
74.9
82.8
29.2
82.8
39.0
11.8
19.6
-6.4
15.8
9.0
15.0
10.6
34.2
12.1
-0.6
-1.8
20.5
-15.0
28.2
17.5
31.0
19.0
-3.4
22.9
-23.5
10.8
29.3
43.6
4.6
9.9
-7.1
14.0
-10.2
-6.8
48.0
25 July 2017
39

MOSL Universe stock performance
Company
Cadila
Cipla
Divis Lab
Dr Reddy’s
Fortis Health
Glenmark
Granules
GSK Pharma
IPCA Labs
Jubilant Life
Lupin
Sanofi India
Sun Pharma
Syngene Intl
Torrent Pharma
Logistics
Allcargo Logistics
Blue Dart
Concor
Gateway Distriparks
Gati
Transport Corp.
Media
Dish TV
D B Corp
Den Net.
Hind. Media
HT Media
Jagran Prak.
PVR
Siti Net.
Sun TV
Zee Ent.
Metals
Hindalco
Hind. Zinc
JSPL
JSW Steel
Nalco
NMDC
SAIL
Vedanta
Tata Steel
Oil & Gas
BPCL
GAIL
Gujarat Gas
Gujarat St. Pet.
HPCL
IOC
IGL
MRPL
Oil India
ONGC
PLNG
Reliance Ind.
Retail
Jubilant Food
Titan Co.
1 Day (%)
0.7
0.6
-4.7
-2.4
2.3
-1.1
0.2
0.7
-0.1
-0.5
0.0
2.8
-0.9
-0.8
-0.4
0.1
-1.6
-0.5
1.3
-0.6
-0.8
2.0
-1.1
-0.6
-2.2
3.9
-0.5
0.3
-0.8
0.5
-0.7
-0.2
-0.7
1.3
-0.1
-1.3
-0.3
1.4
-1.3
-0.9
-0.3
-0.4
-0.1
3.9
0.6
-0.9
-0.5
-5.5
-0.4
-0.8
-1.5
1.9
-0.2
-1.1
1M (%)
1.2
5.3
7.6
1.9
-2.9
9.8
4.8
3.7
1.2
10.6
7.7
3.2
5.0
4.3
7.5
1.9
3.6
0.9
4.2
-4.3
7.9
7.6
-2.6
-3.1
1.0
6.0
-3.4
-9.2
-11.1
0.0
8.1
13.3
10.9
16.8
9.4
13.2
14.0
10.2
11.8
7.9
10.8
6.1
0.3
13.5
9.0
-1.6
6.5
1.6
2.2
3.3
-7.6
12.6
35.8
4.8
12M (%)
43.0
9.6
-42.9
-25.3
-7.5
-20.4
-1.2
-24.6
-2.2
128.6
-32.7
-4.7
-27.5
12.5
-13.1
-6.9
-26.2
0.9
-2.3
-29.5
47.3
-18.7
-8.6
-10.6
1.2
12.0
-2.7
28.8
-32.0
90.2
18.1
57.4
43.7
99.9
32.5
42.9
24.8
32.2
56.7
49.9
19.9
26.8
36.4
40.6
42.2
44.6
83.9
48.4
0.0
10.0
37.5
59.3
8.5
31.0
Company
Technology
Cyient
HCL Tech.
Hexaware
Infosys
KPIT Tech
L&T Infotech
Mindtree
Mphasis
NIIT Tech
Persistent Sys
Tata Elxsi
TCS
Tech Mah
Wipro
Zensar Tech
Telecom
Bharti Airtel
Bharti Infratel
Idea Cellular
Tata Comm
Utiltites
Coal India
CESC
JSW Energy
NTPC
Power Grid
Tata Power
Others
Arvind
Avenue Super.
Bata India
Castrol India
Century Ply.
Coromandel Intl
Delta Corp
Dynamatic Tech
Eveready Inds.
Interglobe
Indo Count
Info Edge
Inox Leisure
Jain Irrigation
Just Dial
Kaveri Seed
Kitex Garm.
Manpasand
MCX
Monsanto
Navneet Educat.
PI Inds.
Piramal Enterp.
SRF
S H Kelkar
Symphony
TTK Prestige
V-Guard
Wonderla
1 Day (%)
2.0
-0.2
-0.6
1.2
-2.6
-0.4
0.1
0.7
-1.3
-3.1
-0.6
1.7
1.0
1.9
-2.4
2.2
-0.2
-0.1
-1.3
-0.3
-0.1
-1.6
-0.2
0.6
-0.4
0.0
0.5
1.4
-0.1
-0.7
2.1
1.5
-0.5
0.6
-0.7
0.5
-2.4
-2.5
0.5
-0.6
2.1
0.6
1.3
3.2
0.8
-2.0
-1.2
0.2
-0.7
2.0
4.7
0.1
-0.1
-0.8
1M (%)
5.4
6.1
-1.9
5.1
2.7
-5.2
-9.0
-2.1
-4.7
-3.7
4.0
7.3
4.7
13.6
-6.6
14.8
10.0
15.8
-10.5
6.5
3.3
4.1
3.9
5.6
2.0
0.1
14.9
12.8
0.3
-4.8
4.0
14.3
-0.7
-5.7
-0.6
-11.5
-0.5
-2.7
4.2
-3.1
2.8
-3.0
-0.1
7.6
2.6
-5.0
-7.1
3.6
-5.6
1.9
6.2
-4.5
0.8
-4.7
12M (%)
11.6
23.8
8.2
-7.6
-8.5
9.2
-13.1
7.3
15.7
-3.3
0.4
0.9
-21.0
8.6
-18.1
14.3
13.4
-13.9
40.9
-20.9
48.4
-17.2
4.8
30.0
15.2
18.3
3.2
-1.1
25.1
90.4
93.1
-7.7
22.4
29.1
-12.5
14.0
7.2
56.6
-31.5
68.3
-22.5
11.4
7.3
13.6
80.3
2.0
84.9
8.0
13.1
18.2
36.2
77.5
-11.4
25 July 2017
40

THEMATIC/STRATEGY RESEARCH GALLERY

REPORT GALLERY
RECENT INITIATING COVERAGE REPORTS
Rs

DIFFERENTIATED PRODUCT GALLERY

Disclosures
This document has been prepared by Motilal Oswal Securities Limited (hereinafter referred to as Most) to provide information about the company (ies) and/sector(s), if any, covered in the report and may be distributed by it and/or its
affiliated company(ies). This report is for personal information of the selected recipient/s and does not construe to be any investment, legal or taxation advice to you. This research report does not constitute an offer, invitation or
inducement to invest in securities or other investments and Motilal Oswal Securities Limited (hereinafter referred as MOSt) is not soliciting any action based upon it. This report is not for public distribution and has been furnished to
you solely for your general information and should not be reproduced or redistributed to any other person in any form. This report does not constitute a personal recommendation or take into account the particular investment
objectives, financial situations, or needs of individual clients. Before acting on any advice or recommendation in this material, investors should consider whether it is suitable for their particular circumstances and, if necessary, seek
professional advice. The price and value of the investments referred to in this material and the income from them may go down as well as up, and investors may realize losses on any investments. Past performance is not a guide for
future performance, future returns are not guaranteed and a loss of original capital may occur.
MOSt and its affiliates are a full-service, integrated investment banking, investment management, brokerage and financing group. We and our affiliates have investment banking and other business relationships with a some
companies covered by our Research Department. Our research professionals may provide input into our investment banking and other business selection processes. Investors should assume that MOSt and/or its affiliates are
seeking or will seek investment banking or other business from the company or companies that are the subject of this material and that the research professionals who were involved in preparing this material may educate investors
on investments in such business . The research professionals responsible for the preparation of this document may interact with trading desk personnel, sales personnel and other parties for the purpose of gathering, applying and
interpreting information. Our research professionals are paid on twin parameters of performance & profitability of MOSt.
MOSt generally prohibits its analysts, persons reporting to analysts, and members of their households from maintaining a financial interest in the securities or derivatives of any companies that the analysts cover. Additionally, MOSt
generally prohibits its analysts and persons reporting to analysts from serving as an officer, director, or advisory board member of any companies that the analysts cover. Our salespeople, traders, and other professionals or affiliates
may provide oral or written market commentary or trading strategies to our clients that reflect opinions that are contrary to the opinions expressed herein, and our proprietary trading and investing businesses may make investment
decisions that are inconsistent with the recommendations expressed herein. In reviewing these materials, you should be aware that any or all of the foregoingamong other things, may give rise to real or potential conflicts of interest.
MOSt and its affiliated company(ies), their directors and employees and their relatives may; (a) from time to time, have a long or short position in, act as principal in, and buy or sell the securities or derivatives thereof of companies
mentioned herein. (b) be engaged in any other transaction involving such securities and earn brokerage or other compensation or act as a market maker in the financial instruments of the company(ies) discussed herein or act as an
advisor or lender/borrower to such company(ies) or may have any other potential conflict of interests with respect to any recommendation and other related information and opinions.; however the same shall have no bearing
whatsoever on the specific recommendations made by the analyst(s), as the recommendations made by the analyst(s) are completely independent of the views of the affiliates of MOSt even though there might exist an inherent
conflict of interest in some of the stocks mentioned in the research report Reports based on technical and derivative analysis center on studying charts company's price movement, outstanding positions and trading volume, as
opposed to focusing on a company's fundamentals and, as such, may not match with a report on a company's fundamental analysis. In addition MOST has different business segments / Divisions with independent research
separated by Chinese walls catering to different set of customers having various objectives, risk profiles, investment horizon, etc, and therefore may at times have different contrary views on stocks sectors and markets.
Unauthorized disclosure, use, dissemination or copying (either whole or partial) of this information, is prohibited. The person accessing this information specifically agrees to exempt MOSt or any of its affiliates or employees from,
any and all responsibility/liability arising from such misuse and agrees not to hold MOSt or any of its affiliates or employees responsible for any such misuse and further agrees to hold MOSt or any of its affiliates or employees free
and harmless from all losses, costs, damages, expenses that may be suffered by the person accessing this information due to any errors and delays. The information contained herein is based on publicly available data or other
sources believed to be reliable. Any statements contained in this report attributed to a third party represent MOSt’s interpretation of the data, information and/or opinions provided by that third party either publicly or through a
subscription service, and such use and interpretation have not been reviewed by the third party. This Report is not intended to be a complete statement or summary of the securities, markets or developments referred to in the
document. While we would endeavor to update the information herein on reasonable basis, MOSt and/or its affiliates are under no obligation to update the information. Also there may be regulatory, compliance, or other reasons that
may prevent MOSt and/or its affiliates from doing so. MOSt or any of its affiliates or employees shall not be in any way responsible and liable for any loss or damage that may arise to any person from any inadvertent error in the
information contained in this report. MOSt or any of its affiliates or employees do not provide, at any time, any express or implied warranty of any kind, regarding any matter pertaining to this report, including without limitation the
implied warranties of merchantability, fitness for a particular purpose, and non-infringement. The recipients of this report should rely on their own investigations.
This report is intended for distribution to institutional investors. Recipients who are not institutional investors should seek advice of their independent financial advisor prior to taking any investment decision based on this report or for
any necessary explanation of its contents.
Most and it’s associates may have managed or co-managed public offering of securities, may have received compensation for investment banking or merchant banking or brokerage services, may have received any compensation
for products or services other than investment banking or merchant banking or brokerage services from the subject company in the past 12 months.
Most and it’s associates have not received any compensation or other benefits from the subject company or third party in connection with the research report.
Subject Company may have been a client of Most or its associates during twelve months preceding the date of distribution of the research report
MOSt and/or its affiliates and/or employees may have interests/positions, financial or otherwise of over 1 % at the end of the month immediately preceding the date of publication of the research in the securities mentioned in this
report. To enhance transparency, MOSt has incorporated a Disclosure of Interest Statement in this document. This should, however, not be treated as endorsement of the views expressed in the report.
Motilal Oswal Securities Limited is registered as a Research Analyst under SEBI (Research Analyst) Regulations, 2014. SEBI Reg. No. INH000000412
Pending Regulatory inspections against Motilal Oswal Securities Limited:
SEBI pursuant to a complaint from client Shri C.R. Mohanraj alleging unauthorized trading, issued a letter dated 29th April 2014 to MOSL notifying appointment of an Adjudicating Officer as per SEBI regulations to hold inquiry and
adjudge violation of SEBI Regulations; MOSL replied to the Show Cause Notice whereby SEBI granted us an opportunity of Inspection of Documents. Since all the documents requested by us were not covered we have requested to
SEBI vide our letter dated June 23, 2015 to provide pending list of documents for inspection.
List of associate companies of Motilal Oswal Securities Limited -Click
here to access detailed report
Analyst Certification
The views expressed in this research report accurately reflect the personal views of the analyst(s) about the subject securities or issues, and no part of the compensation of the research analyst(s) was, is, or will be directly or
indirectly related to the specific recommendations and views expressed by research analyst(s) in this report. The research analysts, strategists, or research associates principally responsible for preparation of MOSt research receive
compensation based upon various factors, including quality of research, investor client feedback, stock picking, competitive factors and firm revenues
Disclosure of Interest Statement
Analyst ownership of the stock
Served as an officer, director or employee
Companies where there is interest
No
No
A graph of daily closing prices of securities is available at www.nseindia.com and http://economictimes.indiatimes.com/markets/stocks/stock-quotes
Regional Disclosures (outside India)
This report is not directed or intended for distribution to or use by any person or entity resident in a state, country or any jurisdiction, where such distribution, publication, availability or use would be contrary to law, regulation or which
would subject MOSt& its group companies to registration or licensing requirements within such jurisdictions.
For Hong Kong:
This report is distributed in Hong Kong by Motilal Oswal capital Markets (Hong Kong) Private Limited, a licensed corporation (CE AYY-301) licensed and regulated by the Hong Kong Securities and Futures
Commission (SFC) pursuant to the Securities and Futures Ordinance (Chapter 571 of the Laws of Hong Kong) “SFO”. As per SEBI (Research Analyst Regulations) 2014 Motilal Oswal Securities (SEBI Reg No. INH000000412) has
an agreement with Motilal Oswal capital Markets (Hong Kong) Private Limited for distribution of research report in Kong Kong. This report is intended for distribution only to “Professional Investors” as defined in Part I of Schedule 1 to
SFO. Any investment or investment activity to which this document relates is only available to professional investor and will be engaged only with professional investors.” Nothing here is an offer or solicitation of these securities,
products and services in any jurisdiction where their offer or sale is not qualified or exempt from registration. The Indian Analyst(s) who compile this report is/are not located in Hong Kong & are not conducting Research Analysis in
Hong Kong.
Motilal Oswal Securities Limited (MOSL) is not a registered broker - dealer under the U.S. Securities Exchange Act of 1934, as amended (the"1934 act") and under applicable state laws in the United States. In addition MOSL is not a
registered investment adviser under the U.S. Investment Advisers Act of 1940, as amended (the "Advisers Act" and together with the 1934 Act, the "Acts), and under applicable state laws in the United States. Accordingly, in the
absence of specific exemption under the Acts, any brokerage and investment services provided by MOSL, including the products and services described herein are not available to or intended for U.S. persons.
This report is intended for distribution only to "Major Institutional Investors" as defined by Rule 15a-6(b)(4) of the Exchange Act and interpretations thereof by SEC (henceforth referred to as "major institutional investors"). This
document must not be acted on or relied on by persons who are not major institutional investors. Any investment or investment activity to which this document relates is only available to major institutional investors and will be
engaged in only with major institutional investors. In reliance on the exemption from registration provided by Rule 15a-6 of the U.S. Securities Exchange Act of 1934, as amended (the "Exchange Act") and interpretations thereof by
the U.S. Securities and Exchange Commission ("SEC") in order to conduct business with Institutional Investors based in the U.S., MOSL has entered into a chaperoning agreement with a U.S. registered broker-dealer, Motilal Oswal
Securities International Private Limited. ("MOSIPL"). Any business interaction pursuant to this report will have to be executed within the provisions of this chaperoning agreement.
The Research Analysts contributing to the report may not be registered /qualified as research analyst with FINRA. Such research analyst may not be associated persons of the U.S. registered broker-dealer, MOSIPL, and therefore,
may not be subject to NASD rule 2711 and NYSE Rule 472 restrictions on communication with a subject company, public appearances and trading securities held by a research analyst account.
For Singapore
Motilal Oswal Capital Markets Singapore Pte Limited is acting as an exempt financial advisor under section 23(1)(f) of the Financial Advisers Act(FAA) read with regulation 17(1)(d) of the Financial Advisors Regulations and is a
subsidiary of Motilal Oswal Securities Limited in India. This research is distributed in Singapore by Motilal Oswal Capital Markets Singapore Pte Limited and it is only directed in Singapore to accredited investors, as defined in the
Financial Advisers Regulations and the Securities and Futures Act (Chapter 289), as amended from time to time.
In respect of any matter arising from or in connection with the research you could contact the following representatives of Motilal Oswal Capital Markets Singapore Pte Limited:
Varun Kumar
Varun.kumar@motilaloswal.com
Contact : (+65) 68189232
Office Address:21 (Suite 31),16 CollyerQuay,Singapore 04931
For U.S
13 December 2016
Motilal Oswal Tower, Level 9, Sayani Road, Prabhadevi, Mumbai 400 025
Phone: +91 22 3982 5500 E-mail: reports@motilaloswal.com
Motilal Oswal Securities Ltd
42