27 July 2017
Motilal Oswal values your support in the
Asiamoney Brokers Poll 2017 for India
Research, Sales and Trading team.
We
request your ballot.
Today’s top research idea
India Strategy: Nifty hits 10k mark after a stirring 22-year journey
v
Nifty yesterday crossed and closed above the 10K mark – an all-time high. Against
this backdrop, we take a trip down the memory lane and compare various aspects
of Nifty now and 22 years ago.
v
Since its inception, Nifty has delivered 11% CAGR returns. Over the same period,
Mcap of Nifty companies has expanded at 20% CAGR. Notably, 30% of Nifty
constituents have been part of the index since inception, delivering market cap
CAGR of 18%.
v
Private Banks – which had the lowest weight in Nifty at 0.4% then – now hold the
highest weight of 23.9%. Consumer – which had the highest weight then at 17% –
now accounts for 10%.
v
Meanwhile, valuations are rich, with Nifty trailing P/E at 25% premium to LPA and
trailing P/B at 10% premium to LPA.
Market snapshot
Equities - India
Close
Chg .%
Sensex
32,382
0.5
Nifty-50
10,021
0.6
Nifty-M 100
18,429
0.3
Equities-Global
Close
Chg .%
S&P 500
2,478
0.0
Nasdaq
6,423
0.2
FTSE 100
7,452
0.2
DAX
12,305
0.3
Hang Seng
10,832
0.5
Nikkei 225
20,050
0.5
Commodities
Close
Chg .%
Brent (US$/Bbl)
50
0.3
Gold ($/OZ)
1,248
-0.3
Cu (US$/MT)
6,298
1.6
Almn (US$/MT)
1,921
0.6
Currency
Close
Chg .%
USD/INR
64.4
-0.1
USD/EUR
1.2
-0.1
USD/JPY
111.9
0.5
YIELD (%)
Close
1MChg
10 Yrs G-Sec
6.4
0.0
10 Yrs AAA Corp
7.5
0.0
Flows (USD b)
26-Jul
MTD
FIIs
0.0
0.2
DIIs
0.1
0.6
Volumes (INRb)
26-Jul
MTD*
Cash
331
290
F&O
6,947
5,569
Note: YTD is calendar year, *Avg
YTD.%
21.6
22.4
28.4
YTD.%
10.7
19.3
4.3
7.2
15.3
4.9
YTD.%
-9.0
7.6
14.0
12.7
YTD.%
-5.2
10.4
-4.4
YTDchg
-0.1
-0.1
YTD
8.7
3.9
YTD*
286
4,994
Research covered
Cos/Sector
India Strategy
HDFC
Yes Bank
Bharti Airtel
Nestle India
Pidilite Inds
Federal Bank
Amara Raja Batt.
MphasiS
Bharat Financial
PVR
Delta Corp
Orient Cement
Healthcare
Key Highlights
Nifty hits 10k mark after a stirring 22-year journey
Core operating performance helped by pick-up in non-retail loans
Stellar all-round performance
Decent quarter; light at the end of the tunnel
Results miss estimates, higher RM costs impact margins
Results below expectation; expect normalcy from 3QFY18
Slippages dent profitability; Underlying story intact
Annual Report | Strengthening products and market presence
HP-driven beat topped with deal wins worth USD183m
Up-fronting provisions; stressed loans pool declines
Expansion in southern market to lead growth
Steady growth in gaming drives revenue beat
Profitability uptick led by high pricing
Moderate growth in June 2017
BIOS | CIFC | CROMPTON | DRRD | EXID | GNP | HCLT | ICICIBV | IDEA |
Results Expectation
IDFCBK | ITC| MSIL | ONGC | TELX
Piping hot news
US Federal Reserve keeps benchmark interest rate unchanged
v
The Federal Reserve kept interest rates unchanged on Wednesday and said it
expected to start winding down its massive holdings of bonds "relatively soon"
in a sign of confidence in the U.S. economy.
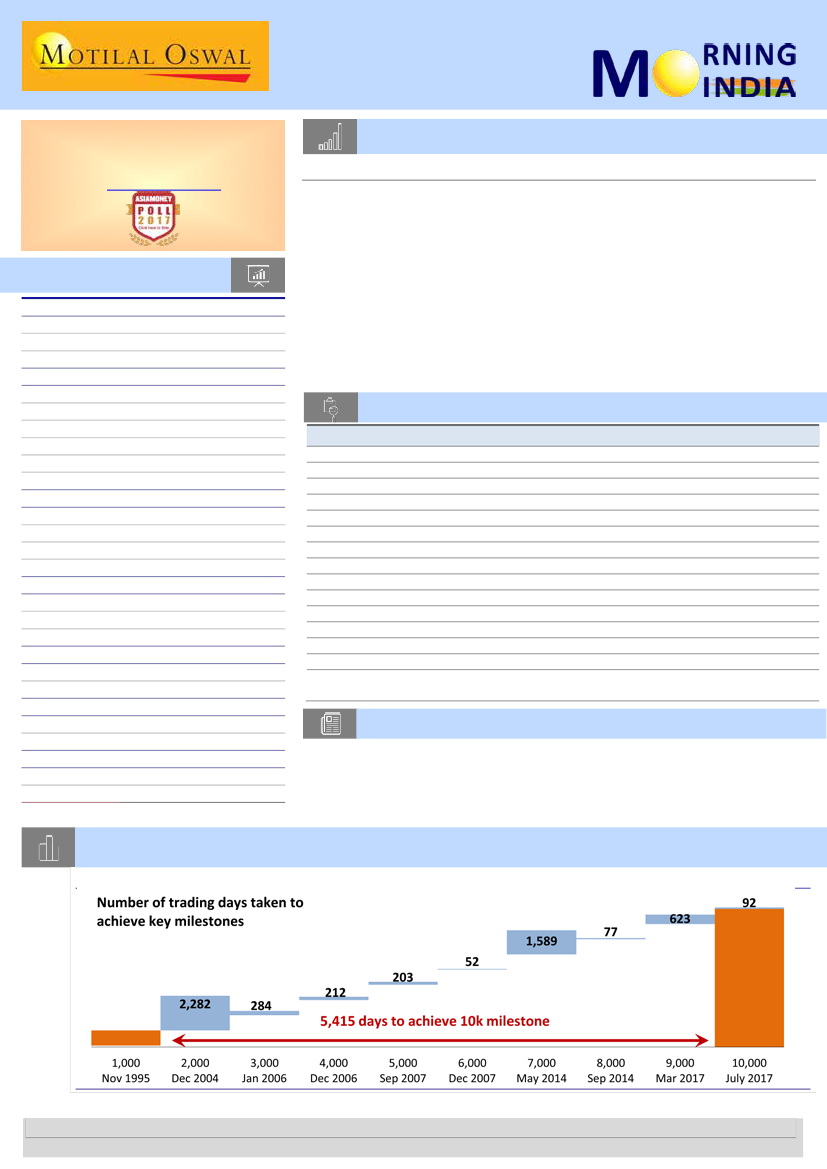
Chart of the Day: India Strategy - Nifty hits 10k mark after a stirring 22-year journey
The journey of Nifty from 1K to 10K…
Research Team (Gautam.Duggad@MotilalOswal.com)
Motilal Oswal research is available on www.motilaloswal.com/Institutional-Equities, Bloomberg, Thomson Reuters, Factset and S&P Capital.
Investors are advised to refer through important disclosures made at the last page of the Research Report.

In the news today
Kindly click on textbox for the detailed news link
1
HPCL-ONGC deal: Govt steps
on the gas
Kicking off the process of stake
sale in Hindustan Petroleum
Corporation (HPCL), the
department of investment and
public asset management (Dipam)
has started the process for
selecting two consultants and a
law firm…
2
Airtel to launch VoLTE service to counter Reliance Jio
Apart from launching VoLTE service by March 2018, Airtel says will partner
phone makers for 4G feature phones, less than a week after Reliance Jio
unveiled the JioPhone…
3
Niti Aayog clears six proposals
for high-tech public transport
Mass rapid transportation
technologies such as hyperloop,
metrino and pod taxis could soon
be a reality in India after Niti
Aayog cleared half-a-dozen
proposals of the transport
ministry exploring options to
improve public transport…
4
Vodafone moves court for
transparent IUC consultations
by Trai
Vodafone has again dragged the
telecom regulator to court, this
time calling for greater
transparency in its consultation
process on the contentious
interconnect usage charge (IUC)…
5
Demonetisation crackdown
round two: Tax sleuths target
corporate accounts
After targeting individuals who
made large cash deposits in banks
during or after demonetisation,
the income-tax department is now
going after businesses that
deposited lots of cash in corporate
accounts in the second round of
demonetisation tax notices…
6
Grand Alliance 2.0: Nitish
Kumar, BJP to form
government in Bihar again
Hours after Nitish Kumar quit as
the chief minister of Bihar, he was
back with the JDU’s old suitor, BJP,
and the new alliance began the
process of forming the next
government that will have Kumar
in the saddle and BJP’s Sushil
Modi as the deputy chief
minister…
27 July 2017
7
Insolvency case: NCLT admits
bankruptcy plea against
Bhushan Steel
The Delhi bench of National
Company Law Tribunal (NCLT)
admits insolvency petition against
Bhushan Steel and Bhushan Power
and Steel. While State Bank of
India filed a petition against
Bhushan Steel, Punjab National
Bank filed a petition against
Bhushan Power and Steel...
2

India Strategy
BSE Sensex: 32,382
NIFTY MILESTONE JOURNEY
Index base period (3
November 1995) value
set at 1,000
S&P CNX: 10,021
Nifty hits 10k mark after a stirring 22-year journey
Taking a trip down the memory lane – Nifty: Then and Now
A flashback – 1995 to 2017
n
Nifty @ 1,000
1995
2004
Journey to 2k was
most excruciating,
taking a total of 2,282
trading days
Nifty @ 2,000
n
2006
Market cap of Nifty
touches 14t
Nifty @ 3,000
2006
Crossed 4k level in Dec
2006; exited the year
with 40% return
Nifty @ 4,000
n
2007
Crossed 5k in Sep
2007, crossed 6k in the
same year
Nifty @ 5,000
For the first time in its history, the Nifty has crossed and closed above the
psychological 10K mark. With this, the Nifty has now become the second Indian
benchmark index to trade in five digits.
The Indian markets remain buoyed by continued liquidity inflow amid a strong
macro backdrop. Domestic MF inflows in CY17 YTD stand at USD7b, matching
inflows recorded in the entire last calendar year. Even more notable are FII
flows of USD8.6b, higher than those recorded in CY15 and CY16. We note that
the macro backdrop remains best in recent times, with inflation under control,
twin deficits in check, stable currency, and policy momentum intact (evident
from the smooth and timely GST implementation). Only missing link in an
otherwise positive set-up is earnings recovery, in our view. Nifty earnings have
remained flat for the last five years (4% CAGR over FY12-17) and hold the key
for further re-rating, in our view.
In markets, one always looks at the future. Today, we make a small departure
to this trend and look back at the past. In this note, we will also share some
interesting tidbits of the Nifty’s journey from 1,000 in 1995 to 10k today.
While traversing its journey from 1K to 10K, the Nifty has delivered 11% CAGR
returns. Meanwhile, the market capitalization of the index has expanded 48x
from INR1.5t to INR70.6t, implying a CAGR of 20%.
The journey of Nifty from 1k to 2k was most excruciating, which took a total
2,282 trading days (almost nine years). The move from 6K to 7K also took some
time (1,589 trading days, 6.5 years), with the markets being stranded in a long
phase of correction in the aftermath of the Global Financial Crisis (GFC) in 2008.
From 26 June 2009, the index shifted its computation to free-float
methodology.
Out of the 50 stocks in Nifty, 15 have been part of the index since its inception -
RIL, HDFC BANK, HDFC, SBI, HUL, ITC, TATA MOTORS, HERO MOTORS, TATA
STEEL, HINDALCO, ACC, AMBUJA, L&T, DR. REDDY and TATA POWER.
The combined market-cap of these 15 stocks increased at 18% CAGR since
inception. These 15 stocks weigh 46% in Nifty today v/s 53% at inception.
Best performers (mkt. cap multiple since Nifty inception, % CAGR): HDFC Bank
(693x – 36%), Hero Motocorp (126x – 26%), HDFC (68x – 22%), ITC (65x – 22%),
Dr Reddy's Lab (65x – 22%) and Reliance Inds (55x – 21%).
Over the years, the sectoral representation in the Nifty has undergone a sea
change, in consonance with the changes in the underlying economy – new
sectors have evolved, while some of the erstwhile dominant sectors of the
economy have lost relative importance in the new India.
3
Nifty up 10x in ~22 years, market cap expands 48x
n
2007
Fastest 1k jump, taking
just 52 trading days
Nifty @ 6,000
n
2014
Journey to 7k was also
agonizing, taking 1,589
trading days
Nifty @ 7,000
n
2014
2 fastest 1k jump,
taking 77 trading days,
post BJP winning Lok
Sabha election
Crossed 9k on strong
buying from FIIs and
mutual funds
nd
Nifty @ 8,000
30% of index constituents unchanged over 22 years
n
Nifty @ 9,000
n
n
2017
2017
Macro backdrop
remains best with
continued strong
inflows in equities
Nifty @ 10,000
Sunrise and Sunset: Some sectors acquire prominence, others fade
n
27 July 2017

n
n
n
Consumer (with 17.6%) had the highest weight in the Nifty at inception. Today, it
stands shoulder-to-shoulder with IT, Oil & Gas and Auto, with ~10-11% weight.
PSU Banks had the second highest weight of 12.2% at inception, while Private
Banks (0.4%) had the lowest weight, with sole representation of HDFC Bank.
Today, at 23.9%, Private Banks have the highest weight, while PSU Banks have
just 3.3% weight.
Textile and Chemicals, which had 8.3% weight at inception, have no
representation today. On the contrary, Information Technology and Telecom,
which had no presence in the index in 1996, today form 14% of the index.
The drivers of market earnings growth have changed over the last decade. While
the large part of the first decade of the 21
st
century was characterized by stronger
earnings performance from Cyclicals and Infrastructure sectors, the story has
changed post the Global Financial Crisis. Financials and Consumer/Consumer
Discretionary have exhibited earnings outperformance over 2008-17. The same is
reflected in the change in their market capitalization ranks.
The disproportionate influence of Financials and Consumer/Consumer
Discretionary in the current cycle has been reinforced – these sectors have
delivered best earnings performance and are re-rated significantly. Naturally,
they have gained in prominence in the market cap rankings.
Biggest gainers in market cap ranks are:
Maruti, IndusInd Bank, Ultratech, Asian
Paints, Eicher Motors, HDFC Bank and HUL.
Similarly, the underperformance of
Cyclicals is reflected in the change in market-cap ranks at the bottom, with
Tata
Steel, Hindalco, ACC and Tata Power
being the key losers.
Key changes in market-cap ranks v/s January 2008 peak
n
n
n
Valuations ~25% above long-period averages; 19% premium to Jan 2008
levels
n
n
The Nifty is trading at a trailing P/E of 22.3x, at a 25% premium to its own long-
period average. Comparing the Nifty’s current valuations with those in January
2008 (earlier peak), we note that the index now trades at a 19% premium.
Nifty trailing P/B, at 3.1x, is at a 10% premium to LAP, but at a 22% discount to
January 2008 P/B of 3.9x.
The journey of Nifty from 1K to 10K…
Number of trading days taken to
achieve key milestones
1,589
52
203
212
2,282
284
77
92
623
5,415 days to achieve 10k milestone
1,000
Nov 1995
2,000
Dec 2004
3,000
Jan 2006
4,000
Dec 2006
5,000
Sep 2007
6,000
Dec 2007
7,000
May 2014
8,000
Sep 2014
9,000
Mar 2017
10,000
July 2017
Source: NSE, MOSL
27 July 2017
4

26 July 2017
1QFY18 Results Update | Sector: Financials
HDFC
Buy
BSE SENSEX
32,382
Bloomberg
Equity Shares (m)
M.Cap.(INRb)/(USDb)
52-Week Range (INR)
1, 6, 12 Rel. Per (%)
Avg Val, INRm
Free float (%)
S&P CNX
10,021
HDFC IN
1,574
2,571.5 / 39.9
1681 / 1185
-5/5/4
3906
100.0
CMP: INR1,633
n
TP: INR1,900 (+17%)
Core operating performance helped by
pick-up in non-retail loans
n
Financials & Valuations (INR b)
Y/E March
2017 2018E 2019E
NII
99.5 113.2 129.0
PAT
74.4
84.0
95.9
Adj. EPS (INR)
35.7
41.4
47.0
EPS Gr. (%)
9.7
16.0
13.5
BV/Sh. (INR)
253.0 280.0 337.8
ABV/Sh. (INR) 201.2 228.3 287.2
RoAA (%)
2.4
2.3
2.3
Core RoE (%)
18.9
19.3
18.4
Payout (%)
37.1
43.5
43.5
Valuation
AP/E (x)
28.3
21.8
16.9
P/BV (x)
6.5
5.8
4.8
AP/ABV (x)
5.0
4.0
2.8
Div. Yield (%)
1.1
1.2
1.4
n
n
n
HDFC’s 1QFY18 core PBT growth of 15% YoY beat our estimates by 3%.
Reported PAT missed our estimate by 3%, driven by marginally higher taxes.
Continued pick-up in corporate loan growth (+7% QoQ, +22% YoY) helped
HDFC to report healthy core income growth (+16% YoY; 6% beat).
AUM increased 18% YoY to INR3.55t. Retail loan growth of 16% YoY was similar
to growth seen in 4QFY17, but still short of the earlier growth rates of 17-18%.
Corporate loans grew 22% YoY (+7% QoQ). We are encouraged by sustained
pick-up in corporate loan growth over the past four quarters. Share of
corporate loans increased 50bp QoQ to 27.7%.
Asset quality deteriorated, with GNPA % at 1.12% v/s 0.8% a quarter ago, led
by a rise in GNPA % in non-retail loans to 2.1% v/s 1.2% a quarter ago. HDFC
recognized one large steel account (belonging to 12 cases referred to NCLT) of
INR9.1b as NPA. It had already made contingent provisions on this account of
INR2.75b in FY17, which were utilized in the quarter.
Spreads improved by 3bp YoY to 2.29%, helped by mix shift toward non-retail
loans (+100bp YoY to 28.5%) and benefit on cost of funds. Spreads were
impacted (5bp, in our view) by non-recognition of interest on the two large
corporate accounts slipped during last three quarters.
Valuation view:
HDFC’s retail loan growth is impressive, despite intense
competition and a high base. Over the past three quarters, corporate loan
growth has also picked up smartly – this remains a key for overall spreads,
considering individual spreads are under pressure. We upgrade estimates by
~5% to factor in better-than-expected corporate loan growth. We expect core
PBT CAGR ~14% over FY17-20. We expect AUM CAGR of ~16%.
Buy
with an
SOTP-based TP of INR1,900.
27 July 2017
5

26 July 2017
1QFY18 Results Update | Sector: Financials
Yes Bank
Buy
BSE SENSEX
32,382
Bloomberg
Equity Shares (m)
M.Cap.(INRb)/(USDb
52-Week
Range
1, 6, 12 Rel. Per (%)
Avg Val, INRm
Free float (%)
S&P CNX
10,021
YES IN
456.5
786.1 / 12.2
1723 / 1091
15/5/27
4021
79.9
CMP: INR1,713
n
TP: INR2,123 (+24%)
Stellar all-round performance
Yes Bank’s (YES) NII grew 45% YoY (+10% QoQ) to INR18.1b, helped by 30bp
YoY NIM improvement (to 3.7%) and customer assets growth of 32% YoY (+5%
QoQ). Strong NII and 13% beat on other income (+17% YoY) drove PPoP
outperformance (+30% YoY; 6% beat). This was partly offset by higher-than-
expected provisioning (INR1b of prudent provisioning), leading to PAT of
INR9.1b (5% beat, 32% YoY).
Asset quality improved during the quarter, with GNPA of 97bp v/s 1.52% in
4Q. In absolute terms, GNPA declined to INR13.6b. This includes one borrower
with gross exposure of 0.26% (INR3.66b; down from INR9.11b in 4Q as the
bank recovered INR5.46b on the account) and net exposure of 0.10%
(INR1.38b). Specific provision held in this account is INR2.27b. Total net
stressed loans stood at 1.6% of advances.
Deposits grew 5%/23% QoQ/YoY to INR1.5t, led by continued CASA inflows.
Strengthening of liability franchise continued, with CASA ratio improving 50bp
QoQ to 36.8%, helped by 66.7%/45.8% YoY growth in CA/SA deposits.
Other highlights: a) NIM improved 10bp QoQ, helped by capital raise benefit.
b) Loans grew 32% YoY to INR1.4t. c) Retail fee income showed robust growth
of 45% YoY. d) RWA/TA declined 300bp+ QoQ to 83% and CET 1 ratio
improved 50bp QoQ to 11.9%.
Valuation and view:
With significant investment in people (20,000+ v/s 3,929
in FY11), branches (1,000 v/s 214 in FY11) and new products, YES is expected
to grow significantly faster than the system. The bank has best-in-class return
ratio, with RoA/RoE of 1.8%/19%+. YES is adequately capitalized for the next
stage of growth (CET1 ~11.9%). We largely maintain earnings estimates and
reiterate
Buy
with a target price of INR2,123 (3.2x June 19) – based on
residual income model.
Financials & Valuations (INR b)
Y/E March
2018E 2019E 2020E
NII
75.7
94.4 121.1
OP
70.4
88.8 116.0
NP
42.1
52.3
65.7
NIM (%)
3.5
3.6
3.7
EPS (INR)
92.3 114.5 143.9
EPS Gr. (%)
26.5
24.1
25.7
BV/Sh. (INR)
542.1 633.3 746.8
ABV/Sh. (INR) 535.1 623.1 736.4
RoE (%)
18.3
19.5
20.9
RoA (%)
1.8
1.8
1.8
Valuations
P/E(X)
18.7
15.0
12.0
P/BV (X)
3.2
2.7
2.3
n
n
n
n
27 July 2017
6

26 July 2017
1QFY18 Results Update | Sector: Telecom
Bharti Airtel
Buy
BSE SENSEX
32,382
Bloomberg
Equity Shares (m)
M.Cap.(INRb)/(USDb)
52-Week Range (INR)
1, 6, 12 Rel. Per (%)
Avg Val, INRm
Free float (%)
S&P CNX
10,021
CMP: INR426
TP: INR490 (+15%)
BHARTI IN
n
3,997.3
1,709.8 / 26.5
431 / 284
12/20/0
1479
32.9
Decent quarter; light at the end of the tunnel
Financials & Valuations (INR b)
2017 2018E 2019E
Y/E Mar
Net Sales
954.7 922.7 1022.0
EBITDA
353.3 336.3 381.4
NP
37.9
17.1
26.6
EPS (INR)
11.1
4.3
6.6
EPS Gr. (%)
-6.4 -54.9
53.1
BV/Sh. (INR)
168.8 171.8 177.3
RoE (%)
6.7
2.5
3.8
RoCE (%)
5.4
3.8
4.5
P/E (x)
38.3
98.2
64.2
P/BV (x)
2.5
2.5
2.4
n
n
Estimate change
TP change
Rating change
n
Consolidated EBITDA drops meager 1% QoQ:
Consol. EBITDA fell 1% QoQ
(-19% YoY) to INR77.6b (4% above estimate) on the back of flat revenue.
Bucking the last two quarter’s declining trend, India wireless revenues
stabilized in 1QFY18 (+0.4% QoQ, -14.2% YoY) to INR129.1b, as traffic
recovered post RJio ending its free usage offer. India wireless EBITDA declined
8% QoQ (-31% YoY) to INR44.3b due to high discretionary costs. Currency
devaluation pulled Africa revenue down by 4% QoQ (-22% YoY) to INR48.5b
(2% below estimates); however, in dollar terms, it increased 1% QoQ. Backed
by efficiency in operating cost, Africa EBITDA increased (+4% QoQ; -3% YoY) for
the second consecutive quarter to INR13.6b. PAT slipped 2% QoQ (-75% YoY) to
INR3.7b.
Resurgence of voice/data revenue:
Data revenue recovered after two quarters
of decline, increasing 3% QoQ (-20% YoY) to INR28.1b. Voice revenue
stabilized, with flat QoQ growth (-12% YoY) to INR92.6b. Both segments
witnessed steep volume growth, offsetting by price decline as industry shifts to
ARPU model. Blended ARPU declined 2% QoQ to INR154.
Growth avenues in sight:
Bharti’s market share improvement in the current
hyper-competitive market highlights its strong network and market standing.
RJio’s gradual reduction of smartphone-oriented freebies should support
growth, in our view. RJio’s VoLTE feature phone should see limited disruption
due to its ARPU-accretive offering and limited product differentiation.
Maintain Buy with revised TP of INR490:
The stock is trading at 6.8x on FY19E
EV/EBITDA, with potential FCFE yield of 6-7% as the market bottoms out. Our
EBITDA factors in 5% decline in FY18 and 13% growth in FY19. We have revised
our TP to INR490 (from INR430 earlier), based on 3.5x EV/EBITDA to Africa
business (3x earlier) and higher EBITDA estimates after two consecutive
quarters of earnings improvement. We assign 7.5x to India excl. tower and 15%
discount to our Bharti Infratel valuations. Maintain
Buy.
FY17
2Q
246,515
3.4
152,113
94,402
38.3
49,560
19,057
1,568
27,353
66
27,287
11,136
40.8
1,544
14,607
FY18
2QE
226,391
-8.2
144,372
82,019
36.2
49,282
21,459
3,698
14,976
0
14,976
8,224
54.9
2,737
4,015
FY17
FY18E
Exhibit 1:
Quarterly Performance
Y/E March
Gross Revenue
YoY Change (%)
Total Expenditure
EBITDA
Margins (%)
Depreciation
Interest
Other Income
PBT before EO expense
Extra-Ord expense
PBT
Tax
Rate (%)
Minority Interest & Profit/Loss of Asso. Cos.
Reported PAT
1Q
255,465
7.9
159,985
95,480
37.4
50,402
19,399
2,787
28,466
3,536
24,930
10,089
40.5
222
14,619
3Q
4Q
1QE
233,357 219,346 219,581
-3.0
-12.1
-14.0
148,542 140,746 141,997
84,815 78,600 77,584
36.3
35.8
35.3
48,350 49,418 48,192
19,356 19,162 18,274
3,487
2,494
3,698
20,596 12,514 14,816
2,040
6,055
503
18,556
6,459 14,313
11,841
1,753
8,136
63.8
27.1
56.8
1,678
972
2,504
5,037
3,734
3,673
3QE
4QE
233,885 242,835 954,683 922,692
0.2
10.7
-1.1
-3.4
147,936 152,107 601,386 586,412
85,949 90,728 353,297 336,279
36.7
37.4
37.0
36.4
51,746 54,210 197,730 203,430
21,459 21,459
76,974 82,652
3,698
3,698
10,336 14,792
16,442 18,756
88,929 64,990
0
0
11,697
503
16,442 18,756
77,232 64,487
9,029 10,300
34,819 35,688
54.9
54.9
45.1
55.3
3,005
3,428
4,416 11,674
4,408
5,029
37,997 17,124
Source: MOSL, Company
27 July 2017
7

26 July 2017
Q2CY17 Results Update | Sector: Consumer
Nestle India
Sell
BSE SENSEX
32,382
Bloomberg
Equity Shares (m)
M.Cap.(INRb)/(USDb)
52-Week Range (INR)
1, 6, 12 Rel. Per (%)
Avg Val, INRm/ Vol m
Free float (%)
S&P CNX
10,021
NEST IN
96.4
654.4 / 10.2
7390 / 5701
-1/-3/-21
263
37.2
CMP: INR6,787
TP: INR5,740(-15%)
Results miss estimates, higher RM costs impact margins
n
n
Financials & Valuations (INR b)
Y/E Dec
2016 2017E 2018E
n
Net Sales
91.6
98.2 109.8
18.0
17.7
20.6
EBITDA
11.4
11.1
12.9
PAT
118.0 115.1 133.6
EPS (INR)
Gr. (%)
-1.6
-2.5
16.2
BV/Sh (INR)
312.6 336.0 365.8
RoE (%)
39.0
35.5
38.1
n
38.8
35.2
37.8
RoCE (%)
57.5
59.0
50.8
P/E (x)
35.0
35.3
29.9
EV/EBITDA (x)
Estimate change
TP change
Rating change
Net sales were up by only 6.9% YoY (est. of +16%) to INR23.9b
(Ind-AS).
EBITDA (Ind-AS) was down 6.1% YoY (est. of +10%) to INR4.4b. Adj. PAT was
down 11.8% YoY (est. of +5.4% YoY) to INR2.5b (Ind-AS).
Weak base makes revenue performance disappointing:
The base quarter was
weak as Maggi was still recovering in terms of sales and market share. Overall
gross sales grew 7.3% YoY in 2QCY17, but net sales growth was weaker owing
to end of tax holiday at the Pantnagar unit from June 2016.
EBITDA margin shrinks 260bp YoY:
Gross margin contracted 270bp to 54.8%
(est. of -150bp), which management attributed to rising cost of milk
derivatives. Staff costs increased 50bp YoY due to adoption of long-term
approach of compensating most factory employees in line with industry
practice. Other expenses, however, were down 70bp YoY. Consequently
EBITDA margin shrunk 260bp YoY (est. of -100bp) to 18.6%.
Valuation and view:
We have cut our EPS by 3%/4% for CY17/CY18E to model
the revenue and margin miss. It has now been over five long years of abysmal
volumes. While recent new product launches and rebuild of Maggi noodles
should support volumes, double-digit volume-led sales growth seems long time
away. Nestle is no longer the business it was before CY11 (it used to report
consistent double-digit volume growth with over 100% RoCEs) and may never
be so. Considering that valuations are rich at 50.8x CY18E EPS, we maintain
Sell
with a revised target of INR5,740 (INR5,990 earlier; 39x June’19 EPS, 25%
discount to three-year avg. multiple).
CY17
2Q
3QE
23,865 24,414
6.9
5.0
10,791 10,719
13,075 13,696
54.8
56.1
8,645
9,097
4,430
4,598
18.6
18.8
-6.1
-5.1
854
838
229
220
569
629
3,915
4,169
1,408
1,376
36.0
33.0
2,507
2,793
-11.8
-7.5
CY16
4QE
24,651
10.0
11,054
13,596
55.2
8,820
4,776
19.4
4.6
830
210
768
4,504
1,486
33.0
3,018
7.1
91,593
12.8
38,797
52,796
57.6
34,838
17,958
19.6
12.6
3,536
35
2,139
16,526
5,150
31.2
11,376
16.5
CY17E
98,214
7.2
43,285
54,929
55.9
37,245
17,684
18.0
-1.5
3,414
38
2,326
16,558
5,464
33.0
11,094
-2.5
(INR Million)
Estimate
Var.
2QCY17E
26,171
-8.8%
16.0
11,407
14,763
-11.4%
56.4
9,971
4,792
-7.6%
18.3
10.0
907
0
600
4,486 -12.7%
1,480
33.0
3,005 -16.6%
5.4
E: MOSL Estimates
Quarterly performance
Y/E December
1Q
22,770
Net Sales
YoY Cha nge (%)
COGS
9,872
9,495
Gross Profit
12,898 12,837
Ma rgi n (%)
56.6
57.5
Opera ti ng Exp
7,375
8,119
EBITDA
5,523
4,718
Ma rgi ns (%)
24.3
21.1
YoY Growth (%)
Depreci a ti on
891
889
Interes t
259
220
Other i ncome
421
524
PBT
4,793
4,132
Ta x
1,722
1,288
Ra te (%)
35.9
31.2
Adjusted PAT
3,071
2,844
YoY Cha nge (%)
22.5
Note: Quarterly numbers are as per Ind-AS
CY16
2Q
3Q
22,332 23,252
9,860
13,392
57.6
8,548
4,844
20.8
69.5
883
220
547
4,289
1,269
29.6
3,020
83.1
4Q
22,410
9,601
12,808
57.2
8,242
4,566
20.4
30.8
873
210
668
4,150
1,332
32.1
2,818
35.1
1Q
24,757
8.7
10,939
13,818
55.8
8,708
5,110
20.6
-7.5
867
228
578
4,593
1,468
32.0
3,126
1.8
27 July 2017
8

Pidilite Industries
BSE SENSEX
32,382
Bloomberg
Equity Shares (m)
M.Cap.(INRb)/(USDb)
52-Week Range (INR)
1, 6, 12 Rel. Per (%)
Avg. Val, INR m/Vol m
Free float (%)
S&P CNX
10,021
PIDI IN
512.7
427.6 / 6.6
837 / 569
-7/0/-5
385
30.4
26 July 2017
1QFY18 Results Update | Sector: Consumer
CMP: INR805
n
TP: INR810 (+1%)
Neutral
Results below expectation; expect normalcy from 3QFY18
PIDI’s 1QFY18 results came in below expectations.
Gross sales were down
1.3% YoY to INR16.7b. Net sales declined 2.6% YoY (est. of flat growth) to
INR15.3b, with flattish volume growth (est. of flat growth) in the Consumer
Bazaar segment. EBITDA was down 18.5% YoY (est. of -4% YoY) to INR3.2b,
while adj. PAT declined 16.7% YoY (est. of -6.1%) to INR2.3b.
Gross margin contracted 60bp YoY to 51.7%,
led by uptrend in key raw
material costs. Staff costs increased 150bp YoY to 11.8%. Other expenses were
up 200bp YoY to 18.9%, led by 39.6% increase in adspend due to timing
difference between advertisement and promotion spends compared to
1QFY17. EBITDA margin thus contracted 410bp YoY (est. of -150bp YoY) to 21%.
Consolidated segmental performance:
Consumer Bazaar revenues were down
1.6% YoY to INR14.3b. Segmental EBIT margin shrunk sharply by 390bp YoY to
23.0%. Consumer Bazaar EBIT declined 15.7% to INR3.3b. Industrial segment
was flat at INR2.5b, with margin contraction of 360bp to 14.7%.
Concall highlights:
1) No significant schemes launched in 1QFY18 to push stock.
Provided certain amount of money to channel partners for loss on stock due to
GST transition; accounted fully in other expenses in 1QFY18. 2) Company had
taken price hikes in segments that were affected more by RM inflation; no
price hikes taken in bigger products like Fevicol and Fevikwik. 3) Company sees
reasonable pick-up in demand after 1
st
week of July.
Valuation and view:
We cut our EPS numbers by 2%/3% for FY18/FY19 to build
in the miss on revenue and margins. PIDI offers a high-quality discretionary
play with strong competitive positioning, proven in-market excellence, and an
impeccable track record of generating long-term shareholder value over
multiple periods. While we admire the business franchise and long-term
growth prospects, fair valuations at 39x FY19E EPS lead us to maintain our
Neutral
rating with a revised target price of INR810 (INR835 earlier, 38x FY19E
EPS, 5% premium to three-year average).
(INR Million)
4Q
12,954
4.9
10,375
2,579
19.9
296
48
286
2,520
971
38.5
1,549
-7.5
12.0
1Q
15,289
-2.6
12,079
3,210
21.0
313
37
432
3,292
1,033
31.4
2,260
-16.7
14.8
FY18
2QE
3QE
15,594 16,146
10.0
21.0
12,015 12,516
3,579
3,629
23.0
22.5
318
316
26
30
275
272
3,510
3,556
1,088
1,102
31.0
31.0
2,422
2,454
4.9
21.5
15.5
15.2
FY17
4QE
15,384
18.8
12,250
3,134
20.4
318
34
279
3,061
937
30.6
2,124
37.1
13.8
56,168
4.8
43,570
12,598
22.4
1,151
139
1,123
12,430
3,851
31.0
8,579
6.7
15.3
FY18E
62,414
11.1
48,861
13,552
21.7
1,264
127
1,259
13,419
4,160
31.0
9,259
7.9
14.8
FY18
1QE
16,008
2.0
12,226
3,782
23.6
270
32
193
3,672
1,120
30.5
2,552
-6.1
15.9
Var.
(%)
-4.5
n
Financials & Valuations (INR b)
Y/E Mar
2017 2018E 2019E
Net Sales
56.2
62.4
72.4
EBITDA
12.6
13.6
15.5
PAT
8.6
9.3
10.6
EPS (INR)
16.7
18.1
20.6
Gr. (%)
6.7
7.9
14.0
BV/Sh (INR)
64.5
79.0
96.1
RoE (%)
28.2
25.2
23.5
RoCE (%)
26.8
24.1
22.7
P/E (x)
48.1
44.6
39.1
EV/EBITDA (x)
32.0
29.4
25.3
n
n
Estimate change
TP change
Rating change
n
Consolidated - Quarterly Earning Model
Y/E March
Net Sales
YoY Cha nge (%)
Tota l Expendi ture
EBITDA
Ma rgi ns (%)
Depreci a ti on
Interes t
Other Income
PBT
Ta x
Ra te (%)
Adj PAT
YoY Cha nge (%)
Ma rgi ns (%)
E: MOSL Estimates
1Q
15,694
6.8
11,754
3,939
25.1
258
35
241
3,887
1,174
30.2
2,713
16.3
17.3
FY17
2Q
3Q
14,177 13,344
7.5
-0.3
10,951 10,477
3,225
2,866
22.8
21.5
303
295
26
30
324
272
3,209
2,814
912
793
28.4
28.2
2,309
2,020
12.4
1.5
16.3
15.1
-15.1
-10.4
-11.5
27 July 2017
9

26 July 2017
1QFY18 Results Update | Sector: Financials
Federal Bank
Buy
BSE SENSEX
32,382
Bloomberg
Equity Shares (m)
M.Cap.(INRb)/(USDb)
52-Week Range (INR)
1, 6, 12 Rel. Per (%)
Avg Val, INRm
Free float (%)
S&P CNX
10,021
FB IN
1,719.0
139.2/2.1
82/41
13/61/40
414
100.0
CMP: INR115
n
TP:INR139 (+21%)
Slippages dent profitability; Underlying story intact
Federal Bank’s (FB) 1QFY18 PAT declined 18% QoQ (+26% YoY) to INR2.1b (14%
miss), despite in-line PPoP (+2%/31% QoQ/YoY), due to the twin impact on NII
and provisions from a spike in corporate slippages, with a restructured account
slipping into NPA.
NII growth came in at -5%/16% QoQ/YoY (7% miss) owing to interest reversals
of ~INR160m, adjusted for which, calculated NIM would stand at 3.11% instead
of 3.05%. Capital raise benefit (+15bp) will help near-term NIMs. Other income
grew 17%/39% QoQ/YoY due to a lumpy contribution of INR2b of treasury
income. CI ratio improved 60bp QoQ to 50.6%.
Loan growth of 4%/29% QoQ/YoY was broad-based, with strong growth across
segments. Corporate growth was the strongest at 6%/39% QoQ/YoY. Retail &
agri loans grew by 3%/27% QoQ/YoY, and SME loans by 3%/17% QoQ/YoY.
Asset quality deteriorated, with one bulky restructured account of INR1.05b
(62% of corporate slippages) slipping into NPA; GNPA/NNPA increased to
2.42%/1.39% (+9bp/+11bp QoQ), with slippage ratio shooting up to 2.88% v/s
1.68% in 4QFY17. Recoveries and upgrades declined 34% QoQ. During the
quarter, the bank sold ~INR480m from existing accounts to ARCs.
Other highlights: a) CASA increased 33% YoY led by 28% CA growth. b) Growth
picking up outside Kerala with 20%/25% growth in loans/SA, while overall
loans/SA growth was 14%/19%.
Valuation and view:
We believe FB’s asset quality concerns, which are largely
legacy issues, are largely behind. The bank is ahead of corporate lending peer
banks on the asset quality curve, especially with opportunistic entry into the
mid-commercial segment. Considering asset quality distractions in the PSU
space, we believe FB is well positioned to gain market share in highly rated
corporates. Post QIP, the bank is comfortably positioned with respect to capital
(Tier 1 ratio of 14.7%). We largely maintain estimates for FY18/19 and reiterate
Buy
with a target price of INR139 (2x June 2019 BV) based on RI model.
n
Financials & Valuations (INR b)
Y/E Mar
2018E 2019E 2020E
NII
35.4
43.4
52.0
OP
23.4
27.5
33.9
NP
10.4
13.3
16.7
NIM (%)
3.1
3.1
3.0
EPS (INR)
5.4
6.8
8.6
EPS Gr. (%)
11.6
27.0
25.7
BV/Sh. (INR)
62.3
67.7
74.6
ABV/Sh. (INR) 58.9
64.1
71.7
ROE (%)
10.0
10.5
12.1
ROA (%)
0.8
0.9
0.9
Payout (%)
20.3
19.7
19.7
Valuations
P/E(X)
21.3
16.7
13.3
P/BV (X)
1.8
1.7
1.5
n
n
n
n
27 July 2017
10

26 July 2017
Amara Raja Batteries
BSE SENSEX
32,382
S&P CNX
10,021
Annual Report Update | Sector: Automobiles
CMP: INR847
TP: INR1,095(+29%)
Strengthening products and market presence
Expanding technology and offerings to challenge leader
Buy
AMRJ’s FY17 annual report, themed ‘Expanding Horizons’ highlights initiatives on new
technologies, applications and markets. It has prioritized segments such as e-rickshaws,
renewable energy, motive power products and exports to keep its growth momentum
intact in FY18. Further, it is exploring and evaluating possibilities of foraying into other
technologies even as it continues to strengthen its leadership in the lead-acid space.
Expanding horizons across every aspect of business
Stock Info
Bloomberg
Equity Shares (m)
52-Week Range (INR)
1,6,12 Rel. Perf. (%)
M.Cap. (INR b)
M.Cap. (USD b)
Avg Val, INRm
Free float (%)
FY17 was an important year for AMRJ, as it expanded its horizon across every
aspect of business: (a) Technology – absorbed glass mat batteries, flat plate gel,
tubular gel, etc, (b) Products – batteries for micro-hybrid vehicles, customized
AMRJ IN
batteries for UPS segment, etc, and (c) Processes. Further, it is exploring products
170.8
1,077/807
for renewable energy and e-mobility.
-3/-21/-21
144.6
2.2
353.0
47.9
Technological innovations to enhance product offerings
In the lead acid space, AMRJ is targeting to launch flat plate and tubular gel
batteries developed on gel-based platforms in FY18. It expects to launch products
based on EFB (enhance flooded battery) technology for micro hybrid vehicles in
1HFY18. In FY17, it developed products on AGM (absorbed glass mat) platform and
customized batteries for UPS applications. AMRJ expects the domestic battery
industry to grow at a CAGR of 7-9% till 2020.
Financials Snapshot (INR b)
2017 2018E 2019E
Y/E Mar
Sales
53.2
62.1
73.6
EBITDA
8.5
9.9
11.7
NP
4.8
6.0
7.2
EPS (INR)
28
35
42
EPS Gr. (%)
(2.7)
26.1
19.2
BV/Sh. (INR)
152
181
215
RoE (%)
20.3
21.2
21.3
RoCE (%)
19.4
20.3
20.4
P/E (x)
30.2
24.0
20.1
P/BV (x)
5.6
4.7
3.9
Shareholding pattern (%)
Jun-17 Mar-17 Jun-16
As On
Promoter
52.1
52.1
52.1
DII
10.9
8.9
8.2
FII
19.0
19.7
20.6
Others
18.0
19.4
19.2
FII Includes depository receipts
Key priorities for FY18
n
n
n
n
n
n
n
n
n
Implement punch greed technology across segments
Capacity enhancement in 2W and 4W space
Increase in automation levels to handle materials on the shop floor
Expand network and market share in EXID-dominated East and West markets
Strengthen marketing of in-house manufactured tubular batteries for home
UPS and e-rickshaw applications
Establish strong presence in high potential exports markets like Saudi Arabia
and Australia
Launch high warranty and energy-efficient products in industrial segment
Focus on increasing volumes of batteries used in data center applications
Increase focus on renewable energy and motive power segment
Targets to double 2W battery capacity in three years
AMRJ intends to continue its capacity expansion drive, as long-term growth
prospects remain robust. It is establishing a 14m units/year greenfield 2W battery
capacity in four phases over the next five years. This will take its total 2W battery
capacity to 24m units/year. In addition to the recently-commissioned 2.25m
units/year capacity, AMRJ is setting up three additional lines in the 4W segment.
27 July 2017
11

Stock Performance (1-year)
Focus on new segments to fuel growth
AMRJ is targeting new segments like renewable energy, e-mobility, motive power
and data center applications. It is banking on government schemes like FAME, Auto
Mission Plan II and National Electric Mobility Mission Plan (NEMMP) 2020, which are
expected to drive demand for automotive batteries in the future.
On-boarding new customers across segments
In the 2W battery space, AMRJ commenced supplies to Bajaj Auto (BJAUT) in FY17
and has on-boarded Hero MotoCorp (HMCL) as new customer. In 4Ws, AMRJ is the
sole supplier to Renault Kwid, and has added new platforms from existing
customers. It has also begun supplies to Volvo for its earth-moving vehicles.
Exploring India-like export markets to de-risk India exposure
AMRJ is expanding its presence in key markets such as South-East Asia, the Middle
East, Australia and Africa. Its exports grew 48% in FY17 and it targets to raise the
contribution of exports from 6.8% of revenue in FY17. For South-East Asian markets,
AMRJ is targeting telecom and UPS batteries for volume growth.
Double-digit revenue growth in automotive segment (60% of revenue)
In FY17, automotive segment revenue grew in double digits, led by healthy growth
in the 4W and 2W OEM space. AMRJ commenced supplies to BJAUT and will soon
start supplies to HMCL to further boost 2W OEM revenue. On the replacement side,
AMRJ continued its growth momentum, led by strengthening of brands, expansion
of network, and varied product offerings.
Telecom and UPS segments moderated industrial segment growth
AMRJ has highlighted that the entry of Reliance Jio with lithium-ion batteries has
impacted volume off-take for replacement batteries. Additionally, lead inflation
presented challenges in the telecom and UPS segments. However, preferred
supplier status with major OEMs, after sales service, and strong performance of
brands like
PowerStack, Quanta
and
QRS
supported sales.
Valuation and view
With stable competitive environment and demand recovery, we estimate 17.6%
Revenues CAGR, 17.3% EBITDA CAGR and 22.6% PAT CAGR over FY17-19. FCF
generation (INR8.2b over FY17-19E) and RoE of 21% coupled with potential shift
from unorganized to organized players due to GST would continue to drive stock
re-rating. The stock trades at 24x FY18E and 20.1x FY19E EPS. Maintain
Buy
with
a target price of ~INR1,095 (25x June 2019E EPS).
27 July 2017
12

RESULTS
FLASH
26 July 2017
Results Flash | Sector: Technology
Mphasis
Neutral
BSE SENSEX
27836.51
S&P CNX
8615.25
CMP: INR595
TP: INR600(+1%)
We will revisit our estimates
post earnings call/management
interaction.
HP-driven beat topped with deal wins worth USD183m
Strength seen in HP and Direct International
n
MPHL’s dollar revenue of USD231m was up 4.2% QoQ, above our estimate of
USD224m. In INR terms, revenue grew 2.0% QoQ (est. of -1.6%) to INR15.36b.
n
EBITDA margin contracted 90bp QoQ to 14.9%, below our estimate of 15.7%.
Our expectation of stable margins was driven by offsetting of INR appreciation
and visa expenses by a better revenue mix.
n
PAT was INR1,872m, below our estimate of INR2,011m, led by lower margins
and other income.
Deal wins of USD183m in 1QFY18, up 40% YoY LTM
n
A strong rebound was seen in revenue from the HP channel, which grew by
10.3% QoQ. Traction was also seen continuing in the Direct International
business, which grew by 4% QoQ.
n
Growth was dragged lower by further pressure in Digital Risk, which declined
by ~9% QoQ. The run-rate in Digital Risk has reduced by 25% compared to the
previous year.
n
The margin contraction was primarily seen at the gross level, with gross
margins contracting 140bp QoQ. This can be explained by the ~300bp shift of
revenue to onsite.
n
While S&M expenses increased 20bp QoQ, hefty savings were witnessed in
G&A expenses, which declined by 60bp to 5.2% of revenue.
Valuation and view:
We will revisit our estimates post the earnings call. Outlook on
growth in Direct Core, strategy under new leadership and the margin outlook
would be keenly watched. Based on current estimates, it trades at 14.2/13.0x
FY18/19E EPS.
Neutral.
Dec 16
224
-0.3
15,361
1.3
27.8
12.3
2,396
15.6
14.7
617
28.5
2,044
-5.6
17.7
9.7
22,018
-266
24.0
20.6
Mar 17
222
-0.9
15,059
-0.7
28.7
12.8
2,384
15.8
14.6
485
27.5
1,934
-5.4
0.7
8.8
21,979
-39
24.4
19.3
Jun 17
231
4.2
15,360
1.3
27.3
12.4
2,295
14.9
13.8
469
26.9
1,872
-3.2
-8.4
9.1
21,878
-101
25.8
21.3
FY18E
Sep 17
225
-2.8
14,826
-2.3
24.7
12.6
1,798
12.1
10.7
512
26.9
1,518
-18.9
-29.9
7.4
21,023
-855
FY17
Dec 17
229
2.0
15,189
-1.1
23.4
12.3
1,683
11.1
9.7
483
26.9
1,413
-6.9
-30.9
6.9
21,568
545
Mar 18
237
3.4
15,779
4.8
24.3
12.4
1,885
11.9
10.6
546
26.9
1,604
13.5
-17.1
7.8
22,088
520
894
-3.5
60,763
-0.2
28.2
12.2
9,688
15.9
15.0
2,385
27.8
8,188
13.0
38.5
21,979
-345
Est. Var. (% /
Jun 17
bp)
225.9
2.2
2.0
228bp
14,815
3.7
-2.3
360bp
28.2
-88bp
12.5
-12bp
2,323
-1.2
15.7
-74bp
14.5
-74bp
648
-27.6
27.5
-57bp
2,011
-6.9
4.0
-1.6
10.4
20,954
4.4
-1025.0
Conference Call Details
Date:
27 July 2017
Time:
11:00 IST
Dial-in details:
+91-22-3938 1095
th
Financials & Valuations (INR b)
2017
2018E
Y/E Mar
Net Sales
60.8
62.3
EBITDA
9.7
9.9
NP
8.2
8.2
EPS (INR)
38.9
42.3
EPS Gr. (%)
12.9
8.8
BV/Sh. (INR)
292.4
254.6
RoE (%)
13.2
14.2
RoCE (%)
12.4
13.7
Payout (%)
43.7
52.0
Div. Yield
2.9
3.8
2019E
69.2
11.2
8.9
46.2
9.1
272.8
16.1
15.8
47.6
3.8
Quarterly Performance (Consolidated)
Y/E March
Revenue (USD m)
QoQ (%)
Revenue (INR m)
YoY (%)
GPM (%)
SGA (%)
EBITDA
EBITDA Margin (%)
EBIT Ma rgi n (%)
Other i ncome
ETR (%)
PAT
QoQ (%)
YoY (%)
EPS (INR)
Headcount
Net Addi ti ons
HP Cha nnel rev. (%)
Fi xed Pri ce (%)
Jun 16
224
-0.3
15,167
1.5
28.1
12.0
2,445
16.1
15.2
572
27.7
2,043
6.4
23.2
9.7
22,374
50
23.4
19.8
FY17
Jun 16
224
-0.2
15,176
-2.6
28.1
11.8
2,463
16.2
15.3
711
27.5
2,166
6.0
14.0
10.3
22,284
-90
23.9
19.1
27 July 2017
13

Bharat Financial Inclusion
BSE SENSEX
32,382
Bloomberg
Equity Shares (m)
M.Cap.(INRb)/(USDb)
52-Week Range (INR)
1, 6, 12 Rel. Per (%)
Avg Val, INRm
Free float (%)
S&P CNX
10,021
BHAFIN IN
138.0
110.9/1.7
939 / 465
-4/-12/10
2496
98.3
26 July 2017
1QFY18 Results Update | Sector: Financials
CMP: INR789
n
TP: INR820 (+4%)
Neutral
Up-fronting provisions; stressed loans pool declines
BHAFIN reported 1QFY18 net loss of INR371m, driven by a provision hit of
INR1.76b. The company up-fronted bulk of the provisions which it plans to
make for the year. We view this as a key positive.
Collection efficiency trends have been encouraging. First month collection rate
improved from 91% in November 2016 to 92% in April and 96.2% in July.
Collection efficiency on a lagged basis also witnessed an improving trend.
Interestingly, the company disclosed collection efficiency trends on loans
disbursed over Jan-Jun 2017 across geographies. The minimum cumulative
collection efficiency in any state is 99.7%.
The pool of overall stressed loans continues to decline. Total overdue portfolio
declined QoQ from INR7.12b to INR5.55b. The company now holds provisions
of INR3.94b as against INR4.64b of 8 weeks+ overdue loans.
Number of loans disbursed increased 8% QoQ, while total disbursements
declined 4% sequentially.
Valuation and view:
Large unmet demand, low competitive intensity,
supportive regulations, strong balance sheet and best-in-class operating
metrics have put BHAFIN on a high-growth path. While there has been a hit
due to demonetization and other external factors, we believe that the long-
term growth story remains unchanged. However, the stock trades at 2.9x
FY19E BVPS, which we believe leaves little room for upside. However, we
acknowledge that upside could accrue with potential events (M&A) and better-
than-expected profit growth. Maintain
Neutral
with a TP of INR820 (3.0x FY19E
P/B).
n
Financials & Valuations (INR m)
Y/E March
2017 2018E 2019E
NII
7,774 9,210 13,920
PPP
5,522 6,860 11,200
PAT
2,897 4,387 9,484
EPS (INR)
21.0
31.8
68.7
BV/Sh (INR)
177.3 218.6 271.6
3.3
3.4
5.3
RoA on AUM(%)
RoE (%)
15.1
16.1
28.0
Valuations
P/E (x)
37.6
24.8
11.5
P/BV (x)
4.4
3.6
2.9
n
n
n
n
27 July 2017
14

26 July 2017
1QFY18 Results Update | Sector: Media
PVR
Buy
BSE SENSEX
32,382
Bloomberg
Equity Shares (m)
M.Cap.(INRb)/(USDb)
52-Week Range (INR)
1, 6, 12 Rel. Per (%)
Avg Val, INRm
Free float (%)
S&P CNX
10,021
PVRL IN
47
64.6 / 1.0
1660 / 1011
-14/-12/8
261
79.8
CMP: INR1,353
n
TP: INR1,628(+20%)
Expansion in southern market to lead growth
Financials & Valuations (INR b)
2017 2018E 2019E
Y/E Mar
Net Sales
21.2
24.6
29.3
EBITDA
3.1
4.1
5.4
PAT
1.0
1.4
2.2
EPS (INR)
20.5
30.9
46.9
Gr. (%)
-3.8
50.5
51.7
BV/Sh (INR)
206.5 235.5 280.0
RoE (%)
10.4
14.0
18.2
RoCE (%)
9.5
11.5
14.6
P/E (x)
65.9
43.8
28.9
P/BV (x)
6.6
5.7
4.8
n
n
Estimate change
TP change
Rating change
n
Revenue in-line, EBITDA and PAT below estimates:
PVR reported overall
revenue of INR6.4b (est. INR6.3b) in 1QFY18 as against INR5.6b in 1QFY17
marking a YoY growth of 13.2%. EBITDA margins declined to 17.6% in 1QFY18
(est. 20.5%) from 19% in 1QFY17. EBITDA stood at INR1,120m (est. INR1,309m)
as against INR1,065m in 1QFY17. The margins declined on account of higher
movie exhibition cost which increased by 90bp to 22.8% of net sales and higher
employee expenses which increased by 100bp to 10.7%. Consequently,
adjusted PAT stood at INR445m in 1QFY18 (est. INR506m) as against INR444m
in 1QFY17.
Screen additions in South market to aid growth:
PVR added 8 new screens in
1QFY18 out of which 5 were added in Chennai and 3 in Kota. 30 more screens
are ready and await licenses or completion certificate from the developers’
end. The company plans to leverage on the lesser penetrated markets of south
and expand its footprint there. Going forward, the company plans to open 65-
70 new screens in FY18 to leverage on the strong pipeline of upcoming
content.
Advertisement revenue to maintain uptrend:
PVR reported a sponsorship
income of INR674m as compared to INR515m in 1QFY17, a growth of 31%. The
growth was primarily led by strong content which usually fetches significantly
higher advertisement revenue. The strong growth is expected to continue with
strong content in pipeline for 2QFY18. Further, the quarter also witnessed a
growth of 10% in average ticket price (ATP) which went up to INR214 with the
company intending to sustain price at existing levels.
Valuation and view:
We expect long-term growth will be driven by expansion
into under penetrated markets and a robust content pipeline driving
advertisement revenue. Hence, keeping FY18E estimates unchanged, we raise
our PAT estimate of FY19E by 4%. We expect revenue CAGR of 18% and PAT
CAGR of 49% over FY17-19E. We value the stock at 15x EV/EBITDA and
maintain our Buy rating with a target price of INR1,628.
27 July 2017
15

26 July 2017
1QFY18 Results Update | Sector: Others
Delta Corp
Buy
BSE SENSEX
32,382
Bloomberg
Equity Shares (m)
M.Cap.(INRb)/(USDb)
52-Week Range (INR)
1, 6, 12 Rel. Per (%)
Avg Val, INRm
Free float (%)
S&P CNX
10,021
DELTA IN
267
39.4 / 0.6
218 / 90
8/14/72
790
64.7
CMP: INR170
TP: INR237(39%)
Steady growth in gaming drives revenue beat
Expanding share of online gaming to bolster growth
n
Financials & Valuations (INR b)
Y/E Mar
2017 2018E 2019E
Net Sales
4.5
6.8
8.6
EBITDA
1.6
2.5
3.3
PAT
0.7
1.5
2.1
EPS (INR)
3.1
5.8
7.9
Gr. (%)
125.5
89.1
36.7
BV/Sh (INR)
39.7
59.4
65.7
RoE (%)
8.1
12.3
12.6
RoCE (%)
9.6
12.6
12.6
P/E (x)
55.7
29.4
21.5
P/BV (x)
4.3
2.9
2.6
n
n
Estimate change
TP change
Rating change
n
Revenue exceeds but PAT below estimates:
DELTA reported overall revenue of
INR1,286m (est. of INR1,180m) v/s INR1,087m in 1QFY17, marking an increase
of 18.4%, driven by healthy growth of 20% in gaming. EBITDA margin shrunk
300bp YoY to 35.2% (est. of 38.1%) in 1QFY18, and EBITDA stood at INR453m
(est. of INR450m) v/s INR415m in 1QFY17. Consequently, adj. PAT came in at
INR211m (below est. of INR255m), as against INR170m in 1QFY17, because of
higher tax-rate of 36% v/s 29% in 1QFY17.
Online gaming – the next big opportunity:
Adda52 posted consolidated
revenue of INR290m, with EBITDA of INR80m in 1QFY18, which sets the stage
for robust growth of ~70% in FY18 (FY17 revenue: INR720m). Adda52 has
aggressive plans to ramp-up its online Rummy business and launch Teen Patti
in the UK market, which should drive sustainable long-term growth.
Change in Goa casino policy – a big game changer:
As per media articles, the
cabinet of Goa is likely to make a change in Goa’s casino policy, whereby all the
offshore license holders will be allowed to set up a live onshore gaming casino
on land in lieu of their offshore licenses. We believe this will be a major game-
changer for DELTA as it would not only significantly increase the scale of the
business, but also bring down the cost of operations.
Valuation and view:
Considering significant growth expected in online gaming,
we upgrade our sales estimate for FY18E by 6%, but keep PAT estimate
unchanged. However, we increase sales and PAT estimates for FY19E by 10%
and 11%, respectively. We expect the company to deliver sales/PAT CAGR of
38%/69% over FY17-19E, and value the stock at 30x FY19E EPS to arrive at a TP
of INR237. Maintain
Buy.
27 July 2017
16

26 July 2017
1QFY18 Results Update | Sector: Cement
Orient Cement
Buy
BSE SENSEX
32,382
Bloomberg
Equity Shares (m)
M.Cap.(INRb)/(USDb)
52-Week Range (INR)
1, 6, 12 Rel. Per (%)
Avg Val, INRm
Free float (%)
S&P CNX
10,021
ORCMNT IN
Profitability uptick led by high pricing
204.9
n
Muted volume growth:
1QFY18 revenue increased 30% YoY (-5% QoQ) to
32.9/0.5
INR5.68b (est. of INR5.92b), as volume growth was flat YoY at 1.40mt (est. of
241 / 115
1.6mt) on account of destocking ahead of GST roll-out. Realizations
8/5/-20
increased 18% QoQ (+30% YoY) to INR4,065/t (est. of INR3,693) due to sharp
58
pricing improvement in AP/Telangana and also Maharashtra (~84% of sales
62.5
CMP: INR160
TP: INR185 (+15%)
Financials & Valuations (INR b)
2017 2018E
Y/E Mar
Net Sales
18.8
23.6
EBITDA
1.8
3.5
NP
-0.3
0.9
EPS (INR)
-1.6
4.4
EPS Gr. (%)
-151.5 -382.2
BV/Sh. (INR)
48.2
52.0
RoE (%)
-3.2
8.8
RoCE (%)
1.4
7.9
EV/EBITDA (x)
24.7
12.4
EV/Ton (USD)
83
81
2019E
26.5
4.3
1.5
7.1
60.5
58.5
12.8
9.0
9.8
79
n
n
Estimate change
TP change
n
Rating change
volume). Realization improvement looks sequentially overstated by
~INR100/t due to lesser proportion of ex-factory sales in 1QFY18.
Favorable pricing improves margins:
Cost/ton rose 7% QoQ (+13% YoY) to
INR3,229 (est. of INR3,029), led by (a) increase of 6% YoY in power/fuel cost
due to higher petcoke prices, partially offset by a rise in proportion of
petcoke consumption, (c) increase of 43% YoY in freight cost/t due a shift in
invoicing toward FOR terms. EBITDA thus rose 189% YoY (+55% QoQ) to
INR1,169m (est. of INR1,065m), with margin at 20.6% (9.3% in 1QFY17).
EBITDA/ton grew INR400 QoQ (+INR546 YoY) to INR836 (est. of INR665).
Other key highlights:
(1) PPC sales at 68% of overall operations. (2) Petcoke
usage at 96% in Chittapur and 32% in Devapur on calorific value. 3) Lead
distance maintained at ~280km. (4) Market mix tilted toward west at 47%,
with south at 37% and others at 16%.
Valuation view:
Proposed acquisition of JPA’s assets would help ORCMNT to
raise capacity by 38% at reasonable valuation and significantly reduce lead
time. While the move would be dilutive to earnings and return ratios over
the near term, it will help the company to become a pan-India player by
diversifying into the newer markets of central/east India. We like the quality
of asset, and thus, believe that the combined valuation of USD84/t (i.e.
Orient’s current + proposed asset valuations) is attractive. The stock trades
at EV of 9.8x FY19E EBITDA and USD79 per ton on standalone operations.
We value ORCMNT at EV/ton of USD88 on FY19E, at a 20% discount to
replacement cost, and accordingly assign a TP of INR185. Maintain
Buy.
27 July 2017
17

Sector Update | 23 June 2017
Healthcare
Performance of top companies:
(June 2017)
Company
MAT
gr (%)
IPM
10.1
Sun Pharma
11.3
Abbott India
10.0
Cipla
6.9
Zydus Cadila
16.8
Mankind
9.1
Alkem
10.6
Lupin
12.7
GSK Pharma
2.3
Pfizer
1.3
Glenmark Pharma
12.7
Sanofi
12.6
Dr Reddy Labs
7.0
Torrent Pharma
12.6
Alembic Pharma
7.3
Ipca Labs
10.8
Natco
(9.5)
Ajanta Pharma
11.5
Merck
7.5
Biocon
11.0
Moderate growth in June 2017
n
n
Jun-17
(%)
7.5
5.7
8.7
3.2
19.4
12.3
(2.0)
16.4
9.2
5.9
3.0
18.3
6.3
0.9
(1.2)
.01
7.8
2.9
9.1
18.3
n
The Indian pharmaceutical market (IPM) grew 7.5% YoY in June 2017 against
7.2% YoY in May. It grew 7.6% YoY for the quarter ended June 2017 (1QFY18).
Volume growth in 1QFY18 was lower at 2.6% compared to 4% in 4QFY17. The
industry saw a moderate rise in price growth to 2.1% after being subdued for 6-
8 months; new product growth in the quarter was 3%. We expect industry
growth to remain muted in the coming months due to GST impact.
Moving annual (MAT) growth for May was 7.2% YoY, primarily driven by muted
volume growth of 2.6% and price growth of 2.1%; while new product growth
contributed 3%.
Cadila, Sanofi, Biocon and Lupin saw highest growth in June
Cadila posted robust growth for the month of June (19.4%), followed by Sanofi and
Biocon (18.3% each), and Lupin (16.4%). Conversely, for Alkem, growth declined by
2%, followed by Alembic Pharma (1.2% down).
Vaccines - Therapeutic (1.9% of IPM) continued to witnessed robust growth at 29%
YoY in June 2017, followed by Anti-Diabetic - Therapeutic (8.9% of IPM) at 18.3%
YoY, and Cardiac - Therapeutic (12.3% of IPM) at 10.7% YoY. Most therapies posted
low to mid-single-digit growth against high-single-digit growth in May. Gynecological
(9%) and Derma (8.1%) posted higher growth than the market.
In value terms, secondary sales of DPCO-listed products declined 3.5% YoY, while
secondary sales of non-DPCO products grew 8.9% YoY. Volume grew 1.6% YoY for
DPCO-listed products and declined 0.3% YoY for non-DPCO products.
FDC-banned drugs (~2.4% of IPM in value terms) continued to be a key drag on IPM
sales. Secondary sales of proposed FDC-banned drugs declined 10.9% YoY in June
while secondary sales of non-banned drugs grew 7.9% YoY. Secondary sales for
Indian companies grew 2% YoY, while MNCs saw a significant decline of 36.1% YoY
in the FDC segment in the month of June 2017.
Exhibit 1. After remaining subdued for six months, price growth saw marginal
improvement in the month of June 2017
Volume Growth (%)
14.9
3.3
5.1
6.5
10.4
3.1
5.1
2.2
Price Growth (%)
1.4
2.1
20.3
-21
New Product Growth (%)
13.6
3.1
2.6
7.9
10.5
3.5
1.9
5.1
Total Growth (%)
Vaccines, Anti-Diabetic and Cardiac led among therapies
DPCO v/s non-DPCO market (June 2017)
FDC ban impact (June 2017)
8.7
3.3
1.4
4
7.7
3
2.1
2.6
Source: AIOCD, MOSL
27 July 2017
18

Indian Pharma Market - June 2017
Exhibit 2:
Performance of top companies: June 2017
MAT June -17
Value
Market
(INR m)
Share (%)
IPM
1,137,387
100.0
Sun Pharma
97,259
8.6
Abbott India
70,154
6.2
Cipla
53,082
4.7
Zydus Cadila
49,774
4.4
Mankind
41,800
3.7
Alkem
39,236
3.5
Lupin
37,823
3.4
GSK Pharma
34,149
3.0
Pfizer
28,458
2.5
Glenmark Pharma 27,105
2.4
Sanofi
25,339
2.2
Dr Reddy Labs
25,551
2.3
Torrent Pharma
26,450
2.3
Alembic Pharma
15,043
1.3
Ipca Labs
16,695
1.5
Natco
9,796
0.9
Ajanta Pharma
7,072
0.6
Merck
6,710
0.6
Biocon
3,794
0.3
Company
Last 8 Quarters in Growth (%)
Growth
(%)
10.1
11.3
10.0
6.9
16.8
9.1
10.6
12.7
2.3
1.3
12.7
12.6
7.0
12.6
7.3
10.8
(9.5)
11.5
7.5
11.0
Sep-15
14.6
13.9
15.4
9.1
11.8
15.3
6.4
13.7
3.1
10.1
22.6
5.7
13.4
19.8
12.9
21.5
31.5
(14.6)
53.9
(36.0)
Dec-15
17.7
10.7
14.6
17.9
12.7
23.4
16.2
14.4
14.0
5.5
22.7
0.4
26.8
11.6
23.5
34.7
(4.8)
(3.0)
27.9
(29.3)
Mar-16
13.6
13.5
5.9
8.3
11.0
21.9
10.8
17.3
4.0
(2.3)
16.3
(6.1)
21.0
10.8
15.4
22.6
48.1
(5.3)
9.8
(29.2)
Jun-16
9.0
4.0
8.3
5.8
6.8
16.2
15.3
7.9
(4.7)
(1.0)
5.9
(1.2)
(1.2)
4.4
10.3
13.4
20.4
12.5
9.5
(19.2)
Sep-16
14.1
14.8
10.3
15.5
12.0
17.3
25.1
14.5
1.4
4.9
14.1
14.4
15.0
15.3
19.5
20.5
2.0
12.8
4.7
7.4
1M
Dec-16 Mar-17 Jun-17 Jun-17
10.3
14.0
13.6
5.9
16.0
2.6
10.4
14.6
(5.9)
2.0
11.2
12.2
2.8
15.6
4.7
9.0
6.1
11.6
8.3
12.5
8.6
7.6
7.5
9.0
7.8
5.7
9.0
7.2
8.7
3.8
2.6
3.2
21.5
17.5
19.4
6.2
10.2
12.3
7.4
0.0
(2.0)
8.1
13.4
16.4
6.3
8.6
9.2
(0.2)
(1.8)
5.9
15.4
10.1
3.0
9.4
14.3
18.3
2.2
8.4
6.3
11.7
8.3
0.9
2.3
2.5
(1.2)
9.2
3.7
0.1
(29.3) (8.8)
7.8
14.0
7.7
2.9
5.9
10.9
9.1
5.8
18.3
18.3
Source: AIOCD, MOSL
Exhibit 3:
Performance of top therapies: June 2017
Therapy
IPM
Anti-Infectives
Cardiac
Gastro Intestinal
Anti Diabetic
Vitamins / Minerals / Nutrients
Respiratory
Pain / Analgesics
Derma
Neuro / CNS
Gynaecological
Anti-Neoplastics
Vaccines
Ophthal
Hormones
MAT June -17
Last 8 Quarters in Growth (%)
1M
Value
Market Growth
Sep-15 Dec-15 Mar-16 Jun-16 Sep-16 Dec-16 Mar-17 Jun-17 Jun-17
(INR m) Share (%) (%)
113,739
100.0
10.1
14.6
17.7
13.6
9.0
14.1
10.3
8.6
7.6
7.5
16,217
14.3
4.6
4.8
16.9
10.4
5.8
18.0
1.1
(2.7)
1.0
3.1
14,025
12.3
11.4
15.3
14.0
13.2
9.2
11.4
14.2
10.8
9.4
10.7
13,198
11.6
9.9
15.9
17.3
14.5
8.9
13.1
9.6
9.7
7.2
6.2
10,148
8.9
19.2
24.2
22.9
18.0
16.5
17.9
21.4
20.2
17.6
18.3
9,951
8.7
8.6
13.1
10.9
12.3
9.9
11.4
11.6
8.0
3.7
1.6
8,478
7.5
9.4
5.6
18.5
7.5
2.2
27.5
4.6
2.9
4.3
3.0
7,832
6.9
9.8
12.4
18.1
12.8
8.1
14.8
9.5
8.2
6.4
5.3
6,859
6.0
12.7
18.6
17.2
16.0
10.1
11.3
13.7
15.4
10.6
8.1
6,847
6.0
8.4
16.7
16.9
17.4
11.2
11.9
11.0
6.2
5.0
5.3
5,926
5.2
11.1
17.5
16.7
14.8
10.9
9.9
13.0
13.2
8.9
9.0
2,391
2.1
7.2
63.2
51.0
43.9
8.7
(3.1) 16.8
8.5
7.9
1.7
2,131
1.9
20.3
24.7
33.6
(2.1)
2.7
14.1
13.5
26.1
28.6
29.0
2,085
1.8
6.4
54.6
10.6
17.6
12.1
7.2
6.6
5.0
6.9
6.5
1,918
1.7
9.0
15.7
19.4
13.9
6.0
8.7
10.0
5.7
11.7
17.2
Source: AIOCD, MOSL
27 July 2017
19

June 2017 Results Preview | Sector: Healthcare
Biocon
Bloomberg
Equity Shares (m)
M. Cap. (INR b)/(USD b)
52-Week Range (INR)
1,6,12 Rel Perf. (%)
BIOS IN
600.0
200 / 3
396 / 230
3 / -11 / 20
n
n
n
CMP: INR333
n
TP: INR300 (-10%)
Sell
Financial Snapshot (INR Billion)
y/e march
2017 2018E 2019E 2020E
Sales
EBITDA
NP
EPS (INR)
EPS Gro. (%)
BV/Sh. (INR)
RoE (%)
RoCE (%)
Valuations
P/E (x)
P/BV (x)
EV/EBITDA (x)
Div. Yield (%)
32.6
4.4
21.6
0.8
32.1
4.1
17.8
0.8
23.1
3.6
13.3
1.1
17.9
3.2
10.4
1.4
38.8
9.3
6.1
10.2
31.7
74.8
13.6
9.3
47.8
11.5
6.2
10.4
1.7
82.1
12.6
9.0
59.3
15.1
8.6
14.4
38.8
15.6
14.7
69.9
18.9
11.1
18.5
29.0
17.6
17.0
92.3 105.4
n
Key issues to watch out
Biocon’s revenue is likely to post muted growth of 2.7% YoY to
INR10b, mainly due to the subdued performance in the small
molecules business (72% of sales).
EBITDA is expected to decline ~8% YoY to INR2.3b, with EBITDA
margins at 23.2%.
We expect PAT to decline to INR1.2b, primarily due to an increase
in depreciation due to the commencement of Malaysian facility.
Key growth drivers for FY18E will be 1) commercialization and
ramp-up of the insulin plant in Malaysia, 2) ramp-up in CRO
division, 3) contribution from API/immuno-suppressants supplies
to partners and 4) branded formulations in India. However, capex
for long-term initiatives is likely to exert pressure on profitability
and return ratios in the near term.
Recent stock price run-up is mainly led by positive developments
in Biosimilars. Although the progress is impressive, we believe
there are some uncertainties capping upside potential. In the
near term, commissioning of the Malaysia plant would pressurize
profits. Maintain Sell with revised a TP of INR300 @ 20x FY19E
EPS
Ø
Update on Middle-East problems.
Ø
Progress on Rh-Insulin/Glargine in Europe/US and other out-licensing
opportunities.
Quarterly Performance Consolidated
Y/E March
1Q
Net Sales
YoY Change (%)
Total Expenditure
EBITDA
Margins (%)
Depreciation
Interest
Other Income
PBT
Tax
Rate (%)
Minority Interest
PAT
YoY Change (%)
Margins (%)
9,814
21.1
7,276
2,538
25.9
661
57
502
2,322
552
23.8
104
1,666
34.6
17.0
FY17
2Q
9,400
19.6
7,150
2,250
23.9
680
70
520
2,020
420
20.8
130
1,470
51.5
15.6
3Q
10,290
24.2
7,680
2,610
25.4
710
90
630
2,440
550
22.5
180
1,710
66.0
16.6
4Q
9,250
-2.1
7,430
1,820
19.7
730
50
490
1,530
110
7.2
150
1,270
-61.6
13.7
1QE
10,076
2.7
7,738
2,338
23.2
950
68
500
1,820
437
24.0
175
1,208
-27.5
12.0
FY18E
2QE
10,939
16.4
8,313
2,625
24.0
1,000
68
500
2,057
494
24.0
175
1,389
-5.5
12.7
3QE
12,033
16.9
9,145
2,888
24.0
1,050
68
500
2,270
545
24.0
175
1,550
-9.3
12.9
4QE
14,757
59.5
11,131
3,626
24.6
1,080
68
500
2,979
715
24.0
191
2,073
63.2
14.0
38,760
12.3
29,421
9,339
24.1
2,772
260
2,024
8,331
1,616
19.4
597
6,118
31.7
15.8
47,806
23.3
36,328
11,477
24.0
4,080
272
2,000
9,126
2,190
24.0
716
6,219
1.7
13.0
(INR Million)
FY17
FY18E
27 July 2017
20

June 2017 Results Preview | Sector: Financials
Cholamandalam Inv & Fin
Bloomberg
Equity Shares (m)
M. Cap. (INR b)/(USD b)
52-Week Range (INR)
1,6,12 Rel Perf. (%)
CIFC IN
156.3
171 / 3
1244 / 805
6 / -4 / -1
CMP: INR1,091 TP: INR1,300 (+19%)
n
Buy
Financial Snapshot (INR b)
Y/E March
NII
PPP
Adj. PAT
EPS (INR)
EPS Gr. (%)
BV (INR)
BVPS Gr. (%)
RoAA (%)
RoE (%)
Valuations
P/E (x)
P/BV (x)
Div. Yield (%)
2017 2018E 2019E 2020E
23.5
28.1
32.8
38.4
14.2
17.6
21.2
25.3
7.2
8.6
10.4
12.4
46.0
55.0
66.4
79.4
26.3
19.7
20.6
19.7
274
322
380
449
17
17
18
18
2.6
2.7
2.8
2.8
18.1
18.5
18.9
19.2
23.7
4.0
0.5
19.8
3.4
0.5
16.4
2.9
0.6
13.7
2.4
0.7
Vehicle finance segment continues to register strong growth. Home
equity too has witnessed some pick-up this quarter.
n
Disbursements are expected to increase 15% YoY, resulting in
15%/4% YoY/QoQ increase in AUM.
n
Margins are expected to increase slightly on a YoY basis, driven by
higher share of vehicle finance loans. We expect NIM of 7.7%.
n
As a result, NII growth is expected to be strong at 20% YoY.
n
Calculated cost-to-income ratio should decline 20bp to 40.2%.
n
We believe GNPLs have topped out and should decline going
forward, as the company has started invoking SARFAESI to
repossess properties. We expect provisions of INR1b v/s INR0.5b in
4QFY17 and INR0.8b in 1QFY17.
n
Net profit is likely to grow 19% YoY to INR1.97b.
n
The stock trades at 3.4x FY18E and 2.9x FY19E BV. Maintain Buy.
Key issues to watch for
Ø
Business growth trends and management commentary on the
same.
Ø
Impact of BS4 and GST on business going forward.
Ø
Trend in opex, given management’s intent to reduce expense ratio
to 2.5% by FY20.
CIFC: Quarterly Performance
Y/E March
FY17
FY18E
1Q
2Q
3Q
4Q
1QE
2QE
3QE
Income from Operations
11,017 11,558 11,698 12,069 12,190 12,677 13,311
Interest Expenses
5,481
5,694
5,658
5,476
5,530
5,751
6,039
Net Interest Income
5,536
5,864
6,040
6,594
6,660
6,926
7,272
YoY Growth (%)
13.8
20.6
20.1
22.5
20.3
18.1
20.4
Other Op. and Other Income
68
69
60
65
69
69
69
Net Operating Income
5,604
5,933
6,100
6,659
6,728
6,995
7,341
YoY Growth (%)
14.3
21.0
20.5
22.6
20.1
17.9
20.3
Operating Expenses
2,264
2,527
2,588
2,754
2,706
2,794
2,885
Operating Profit
3,341
3,405
3,512
3,905
4,023
4,201
4,456
YoY Growth (%)
20.4
22.7
17.9
19.1
20.4
23.4
26.9
Provisions & Loan Losses
804
772
1,003
529
1,000
1,000
1,400
Profit before Tax
2,537
2,634
2,509
3,376
3,023
3,201
3,056
Tax Provisions
880
924
884
1,181
1,058
1,120
1,070
Net Profit
1,657
1,709
1,625
2,196
1,965
2,081
1,987
YoY Growth (%)
50.3
55.0
34.9
50.7
18.5
21.7
22.2
E: MOSL Estimates; * Quaterly nos and full year nos will not tally due to different way of reporting financial nos
(INR Million)
FY17
FY18E
4QE
13,970
6,046
7,925
20.2
77
8,001
20.2
3,042
4,960
27.0
1,005
3,954
1,383
2,572
17.1
45,781
22,308
23,473
13.3
822
24,296
13.4
10,133
14,162
9.1
3,106
11,056
3,868
7,187
26.4
51,463
23,367
28,097
19.7
969
29,065
19.6
11,426
17,639
24.6
4,405
13,234
4,631
8,603
19.7
27 July 2017
21

June 2017 Results Preview | Sector: Capital Goods
CG Consumer Electricals
Bloomberg
Equity Shares (m)
M. Cap. (INR b)/(USD b)
52-Week Range (INR)
1,6,12 Rel Perf. (%)
CROMPTON IN
626.8
141 / 2
246 / 135
-7 / 31 / 43
CMP: INR224
n
n
n
TP: INR255 (14%)
Buy
Financial Snapshot (INR b)
Y/E March
2017 2018E 2019E 2020E
Net Sales
39.8
43.6
49.7
56.7
EBITDA
4.9
5.6
6.5
7.7
Adj. PAT
2.9
3.4
4.1
5.1
EPS (INR)
4.7
5.5
6.6
8.1
EPS Gr. (%)
146.2
17.2
20.2
22.7
BV/Sh. (INR)
8.6
11.9
14.5
17.8
RoE (%)
76.4
53.4
49.8
50.0
RoCE (%)
32.4
30.0
30.9
35.8
Payout (%)
32.7
33.0
50.0
50.0
Valuations
P/E (x)
47.0
40.1
33.4
27.2
P/BV (x)
25.6
18.5
15.1
12.4
EV/EBITDA, x
29.3
25.2
21.5
18.0
Div Yield (%)
0.7
0.8
1.5
1.8
* Consolidated
We expect sales to grow 7% YoY, driven by 9% YoY growth in the
consumer durables segment and 1% YoY in the lighting segment.
We expect operating profit of INR1.7b in 1QFY18, an improvement
of 7% YoY, and stable EBITDA margin of 13.8%.
Net profit is expected to be INR1.0b in 1QFY18, as against INR919m
in 1QFY17, implying growth of 10.7%.
Key issues to watch
Ø
Ø
Ø
Impact on the operating performance of the company on account of the
destocking measures taken by dealers amid GST implementation.
Details of segmental sales, as CROMPTON intends to improve sales of its
premium category products.
Ad spends incurred by the company during the quarter, as CROMPTON
intends to position itself as an electrical consumer durables brand as
against its current positioning as a fans brand.
Crompton: Quarterly Estimates (Standalone)
Y/E March
Sales
Change (%)
EBITDA
Change (%)
As of % Sales
Depreciation
Interest
Other Income
PBT
Tax
Effective Tax Rate (%)
Adjusted PAT
Change (%)
Extra-ordinary Income (net)
Reported PAT
Change (%)
1Q
11,208
1,550
13.8
28
180
34
1,376
457
33.2
919
-
919
FY17
2Q
8,900
974
10.9
27
161
42
827
273
33.0
554
-
554
3Q
8,889
9.7
993
19.9
11.2
26
162
50
855
281
32.9
574
35
-
574
39
4Q
10,762
7.4
1,386
9.0
12.9
29
153
69
1,273
388
30.5
885
16.6
(20.7)
864
29.8
1QE
12,000
7.1
1,650
6.5
13.8
30
153
50
1,517
500
33.0
1,017
10.7
-
1,017
10.7
FY18
2QE
3QE
9,900
10,000
11.2
12.5
1,150
1,190
18.1
19.8
11.6
11.9
30
30
153
153
60
60
1,027
1,067
350
34.1
677
22.3
-
677
22.3
350
32.8
717
25.1
-
717
25.1
FY17
4QE
11,719
8.9
1,624
17.2
13.9
28
163
65
1,499
440
29.3
1,059
19.7
-
1,059
22.5
39,759
119.5
4,902
134.0
12.3
110
655
195
4,332
1,399
32.3
2,933
138.8
2,907
167.0
FY18
43,619
9.7
5,614
14.5
12.9
118
655
235
5,076
1,640
32.3
3,436
17.2
3,436
18.2
27 July 2017
22

June 2017 Results Preview | Sector: Healthcare
Dr Reddy’s Labs
Bloomberg
Equity Shares (m)
M. Cap. (INR b)/(USD b)
52-Week Range (INR)
1,6,12 Rel Perf. (%)
DRRD IN
170.5
448 / 7
3689 / 2382
3 / -32 / -38
CMP: INR2,630
n
n
TP: INR2,600 (-1%)
Neutral
Financial Snapshot (INR Billion)
y/e march
2017 2018E 2019E 2020E
Sales
EBITDA
NP
EPS (INR)
EPS Gro. (%)
BV/Sh. (INR)
RoE (%)
RoCE (%)
Valuations
P/E (x)
P/BV (x)
EV/EBITDA (x)
Dividend Yield
(%)
36.2
3.6
19.5
0.4
24.8
2.9
13.5
0.6
18.4
2.6
10.1
0.8
15.9
2.3
8.5
0.9
140.8 162.1 188.3 219.0
24.2
12.0
-45.1
740
9.6
6.3
34.0
18.1
46.3
13.2
9.3
44.4
24.4
34.6
14.9
11.3
51.7
28.2
15.6
15.2
12.1
n
n
n
72.6 106.2 143.0 165.3
896 1,020 1,161
Dr Reddy’s Lab is expected to report 12.4% YoY growth in
1QFY18, with revenue at INR36.3b.
US business is likely to improve ~4% YoY to INR16b after declining
19% in 4QFY17, on the back of launch of Vitorin (>USD125m
product annually), while Russia and CIS region sales are expected
to post significant growth of ~41% YoY. India business is expected
to report growth of 15% YoY to INR6b.
EBITDA is expected to increase 104% YoY to INR7.6b, and the
margin to expand 934bp YoY to 21%. This is mainly attributed to
higher remediation cost (USD16m), and cost related to the launch
of 505 (b)(2) products in 1QFY17.
PAT is expected to increase to INR3.8b on the back of higher margin.
Although long-term fundamentals remain intact, the stock will
remain range bound in the near term due to regulatory concerns.
We value the company at 18x FY19E PER, at a 10-15% discount to
peers, due to added regulatory uncertainty related to Duvvada
and Bachupalli. Maintain Neutral with a TP of INR2,600 @ 18x
FY19E PER.
Key issues to watch out
Ø
Update on USFDA resolution of warning letters for Srikakulam,
Duvvada and Miryalaguda API plants.
Ø
FY18 outlook for both the generics and PSAI businesses.
Ø
Impact of pricing pressure in the US.
Quarterly Performance
Y/E March
1Q
Sales
YoY Change (%)
Total Expenditure
EBITDA
Margins (%)
Amortization
Other Income
Profit before Tax
Tax
Rate (%)
Reported PAT
Adjusted PAT
YoY Change (%)
Margins (%)
32,345
-13.9
28,572
3,773
11.7
2,681
615
1,707
444
26.0
1,263
1,263
-79.8
3.9
FY17
2Q
35,857
-10.1
29,834
6,023
16.8
2,914
726
3,835
885
23.1
2,950
3,244
-55.1
9.0
3Q
37,065
-6.6
28,539
8,526
23.0
2,924
320
5,922
1,221
20.6
4,701
4,701
-18.8
12.7
4Q
35,542
-5.4
29,708
5,834
16.4
3,204
559
3,189
64
2.0
3,125
3,125
-16.9
8.8
1QE
36,348
12.4
28,715
7,633
21.0
3,150
485
4,968
1,192
24.0
3,776
3,776
198.9
10.4
FY18E
2QE
38,804
8.2
30,655
8,149
21.0
3,000
485
5,634
1,352
24.0
4,282
4,282
32.0
11.0
3QE
40,831
10.2
32,256
8,574
21.0
3,000
485
6,059
1,454
24.0
4,605
4,605
-2.0
11.3
4QE
46,103
29.7
36,422
9,682
21.0
3,006
507
7,182
1,724
24.0
5,458
5,458
74.7
11.8
(INR Million)
FY17
140,809
-9.0
116,654
24,155
17.2
11,722
2,220
14,652
2,614
17.8
12,038
12,038
-39.8
8.5
FY18
162,086
15.1
128,048
34,038
21.0
12,156
1,962
23,842
5,722
24.0
18,120
18,120
50.5
11.2
27 July 2017
23

June 2017 Results Preview | Sector: Automobiles
Exide Industries
Bloomberg
Equity Shares (m)
M. Cap. (INR b)/(USD b)
52-Week Range (INR)
1,6,12 Rel Perf. (%)
EXID IN
850.0
192 / 3
250 / 168
0 / 7 / 15
CMP: INR226
TP:INR317 (+40%)
Buy
Financial Snapshot (INR b)
Y/E MARCH
2017 2018E 2019E 2020E
Net Sales
EBITDA
Adj. PAT
Adj. EPS (INR)
EPS Gr. (%)
BV/Sh. (INR)
RoE (%)
RoCE (%)
Payout (%)
Valuations
P/E (x)
P/BV (x)
EV/EBITDA (x)
Div. Yield (%)
27.7
3.9
15.3
1.1
23.4
3.5
12.7
1.0
15.8
2.5
8.1
1.2
13.8
2.2
6.4
1.7
76.2
10.9
6.9
8.2
11.1
58.4
14.0
14.4
29.4
86.5
12.9
8.2
9.7
18.5
65.5
14.8
15.2
22.8
99.2 115.3
15.2
10.1
11.9
23.2
74.8
15.9
16.5
18.5
17.8
11.6
13.7
15.0
84.7
16.2
16.8
23.4
n
We expect net revenue to grow 8.9% YoY (and 11.4% QoQ) to
INR21.8b, led by better OEM and replacement demand.
n
EBITDA margin is likely to decline 84bp YoY (but expand 157bp
QoQ) to 15% due to YoY increase in lead price. However, price
increase of ~2-3% in replacement segment should arrest the
decline in margins.
n
Spot LME lead prices decreased ~9% QoQ but increased 20.4%
YoY in 4QFY17.
n
EBITDA is likely to increase 3% YoY (and 24% QoQ) to ~INR3.2b.
n
PAT is likely to increase by 6% YoY (and 26% QoQ) to INR2.1b, led
by higher other income and lower tax rate.
n
The stock trades at 23.4x FY18E and 15.8x FY19E EPS; maintain
Buy.
Key issues to watch
Ø
Update on demand environment for OEMs, auto replacement, and
industrial battery segments, post demonetization.
Ø
Ø
Market share in autos and non-autos.
Outlook for raw material cost trend, recent pricing action and currency
hedges, if any.
S/A Quarterly Performance
Y/E March (INR m)
Net Sales
Growth YoY (%)
RM(%)
Employee cost (%)
Other Exp(%)
EBITDA
EBITDA Margin(%)
Change (%)
Non-Operating Income
Interest
Depreciation
PBT after EO Exp
Effective Tax Rate (%)
Adj. PAT
Change (%)
E: MOSL Estimates
1Q
20,081
11.2
62.4
6.4
15.5
3,150
15.7
18.6
143
17
491
2,784
29.6
1,961
25.9
FY17
2Q
3Q
19,233 17,253
10.3
12.6
61.1
60.0
6.8
7.4
16.9
19.3
2,927
2,296
15.2
13.3
14.7
-4.0
190
350
6
46
506
522
2,606
2,079
30.4
27.1
1,813
1,515
16.9
9.4
4Q
19,636
11.3
62.6
6.6
17.6
2,618
13.2
-1.7
215
0
544
2,289
28.0
1,648
-6.0
1QE
21,876
8.9
62.0
6.5
16.7
3,249
14.8
3.2
200
8
550
2,892
28.0
2,082
6.2
FY18E
2QE
3QE
21,584 20,202
12.2
17.1
62.0
62.0
6.7
7.2
16.3
16.5
3,236
2,902
15.0
14.3
10.5
26.4
225
250
8
8
570
600
2,883
2,544
28.0
28.0
2,076
1,832
14.5
20.9
FY17
4QE
22,792
16.1
62.0
6.4
16.2
3,513
15.4
34.2
226
8
639
3,093
28.0
2,227
35.1
76,203
11.3
61.6
6.8
17.2
10,949
14.3
7.1
899
30
2,063
9,755
28.9
6,935
11.0
FY18E
86,454
13.5
62.0
6.7
16.4
12,900
14.9
17.8
901
30
2,359
11,412
28.0
8,217
18.5
27 July 2017
24

June 2017 Results Preview | Sector: Healthcare
Glenmark Pharma
Bloomberg
Equity Shares (m)
M. Cap. (INR b)/(USD b)
52-Week Range (INR)
1,6,12 Rel Perf. (%)
GNP IN
282.3
181 / 3
993 / 600
-1 / -46 / -36
n
CMP: INR642
n
TP:INR800 (+25%)
Neutral
Financial Snapshot (INR Billion)
y/e Mar
2017 2018E 2019E 2020E
Sales
EBITDA
NP
EPS (INR)
EPS Gro. (%)
BV/Sh. (INR)
RoE (%)
RoCE (%)
Valuations
P/E (x)
P/BV (x)
EV/EBITDA (x)
D. Yield (%)
16.3
4.0
12.0
0.5
15.0
3.2
11.1
0.5
12.4
2.6
9.3
0.5
10.3
2.1
7.6
0.5
89.7
18.2
11.1
39.3
58.0
24.7
19.1
97.8 113.2 130.4
19.1
12.1
42.9
9.2
21.6
18.6
22.2
14.6
51.7
20.3
20.9
20.5
26.2
17.5
62.1
20.3
20.4
21.9
n
159.2 198.5 246.5 305.0
n
We expect Glenmark Pharmaceuticals (GNP) to report robust
24.6% YoY growth in overall revenues to INR23.5b, driven by
buoyant performance in the US.
The India branded business is likely to grow 10% YoY, while the
US generic segment is expected to drive strong growth, primarily
aided by gZetia sales. LatAm business is expected decline ~30%
YoY on the back of absence of sale from Venezuela.
EBITDA is likely to increase 68.3% YoY to INR5.3b. We expect
margin to expand to ~23% on the back of Zetia launch in Dec-16.
Adjusted PAT is expected at INR3.5b, up 53.5% YoY, aided by
lower tax rate of 25%, as against 34.8% in 1QFY17, and expansion
in EBITDA margin.
The significant miss on sales/profit guidance is a key overhang.
Weak cash flow conversion and high net debt remain key
concerns. Maintain Neutral with a TP of INR800 @ 15x FY19E EPS.
Any big in-licensing deal in the innovation business could act as a
positive catalyst.
Key issues to watch out
Ø
New ANDA filings in complex category.
Ø
Update on free-cash generation and debt repayment schedule.
Ø
Progress of NCE/NBE pipeline and potential out-licensing prospects.
Quarterly Performance
Y/E March
Net Revenues (Core)
YoY Change (%)
EBITDA
Margins (%)
Depreciation
Interest
Other Income
PBT before EO Expense
Extra-Ord Expense
PBT after EO Expense
Tax
Rate (%)
Reported PAT (incl one-offs)
Reported PAT (excl MI)
YoY Change (%)
Margins (%)
E: MOSL Estimates
1Q
18,832
15.8
3,192
17.0
642
430
1,358
3,477
0
3,477
1,209
34.8
2,268
2,268
24.0
12.0
FY17
2Q
3Q
21,732
24,630
17.9
42.8
3,978
6,929
18.3
28.1
770
625
629
617
491
866
3,070
6,553
0
0
3,070
6,553
876
1,782
28.5
27.2
2,193
4,771
2,193
4,771
9.4
180.8
10.1
19.4
4Q
24,244
11.5
4,111
17.0
689
697
-185
2,540
809
1,730
-107
-6.2
1,838
1,838
23.5
7.6
1QE
23,461
24.6
5,373
22.9
744
488
500
4,640
0
4,640
1,160
25.0
3,480
3,480
53.5
14.8
FY18E
2QE
3QE
24,197
23,620
11.3
-4.1
4,452
4,582
18.4
19.4
744
744
488
488
500
500
3,720
3,850
0
0
3,720
3,850
930
962
25.0
25.0
2,790
2,887
2,790
2,887
27.2
-39.5
11.5
12.2
4QE
26,490
9.3
4,670
17.6
744
488
500
3,938
0
3,938
984
25.0
2,953
2,953
60.7
11.1
(INR Million)
FY17
89,701
18.2
18,211
20.3
2,644
2,373
2,530
15,724
809
15,724
3,827
24.3
11,897
11,897
56.5
13.3
FY18E
97,769
9.0
19,077
19.5
2,976
1,953
2,000
16,148
0
16,148
4,037
25.0
12,111
12,111
1.8
12.4
27 July 2017
25

June 2017 Results Preview | Sector: Technology
HCL Technologies
Bloomberg
Equity Shares (m)
M. Cap. (INR b)/(USD b)
52-Week Range (INR)
1,6,12 Rel Perf. (%)
HCLT IN
1412.9
1187 / 18
908 / 710
-2 / -19 / -2
CMP: INR838
n
n
n
TP: INR960 (+15%)
Buy
Financial Snapshot (INR b)
y/e JUNE
2017 2018E 2019E 2020E
Sales
EBITDA
PAT
EPS (INR)
EPS Gr. (%)
BV/Sh. (INR)
RoE (%)
RoCE (%)
Payout (%)
Valuation
P/E (x)
P/BV (x)
EV/EBITDA
(x)
Div yld (%)
14.0
3.5
10.2
2.9
13.6
3.5
9.7
3.3
12.6
3.1
8.6
3.8
11.8
2.8
9.5
4.3
467.2
103.1
84.6
59.8
49.2
239.0
27.5
25.3
40.1
509.1
108.7
84.8
61.4
2.6
241.2
25.2
23.2
45.6
563.3
119.9
92.3
66.7
8.6
268.9
25.8
24.1
48.0
610.4
124.5
98.5
71.0
6.5
296.3
24.8
23.4
50.7
n
n
n
n
We expect HCLT’s USD revenue to grow 4.3% QoQ and 3.1% QoQ
on a constant currency basis.
It is expected to be divided as follows: Organic: 1.6pp, Geometric:
1.1pp (USD20m), and new IBM partnership: 0.4pp (USD7.5m).
We expect organic momentum to take a step down. HCLT’s 10.5-
12.5% CC guidance implies organic growth of 5.5-7.5%; which
means CC CQGR of 1.2-2% (mid-point of 1.6% v/s 2.2% achieved
in FY17).
EBIT margins are likely to decline by 50bp to 19.5% because of
continued investments in the business, integration of lower
margin businesses and INR appreciation.
With this, we expect 19.4% EBIT margin for FY18 – towards the
lower-end of the 19.5-20.5% guidance range.
Adjusted PAT estimate for the quarter is INR20.6b, +1.6% QoQ, on
the back of lower margins.
The stock trades at 13.6x FY18E and 12.6x FY19E EPS. Maintain
Buy.
Key issues to watch for
Traction in IMS and Engineering Services.
Margin movement, given lower organic growth.
Traction in Digital.
HCL Tech Quarterly Performance (US GAAP, INR Million)
Y/E March
Revenue (USD m)
QoQ (%)
Revenue (INR m)
YoY (%)
GPM (%)
SGA (%)
EBITDA (INRm)
EBITDA Margin (%)
EBIT Margin (%)
Other income
ETR (%)
PAT before EOI
QoQ (%)
YoY (%)
EPS
Headcount
Util excl. trainees (%)
Attrition (%)
Fixed Price (%)
E: MOSL Estimates
1Q
1,691
6.5
113,360
15.9
34.4
12.1
25,210
22.2
20.6
2,530
21.0
20,430
6.1
14.6
14.5
107,968
85.8
17.8
60.9
FY17
2Q
3Q
1,722
1,745
1.9
1.4
115,190 118,140
14.1
14.2
33.6
33.9
11.8
11.7
25,110
26,280
21.8
22.2
20.1
20.4
2,350
2,310
21.1
21.5
20,150
20,710
-1.4
2.8
10.5
7.9
14.3
14.7
109,795 111,092
85.3
84.6
18.6
17.9
61.3
63.2
4Q
1,817
4.1
120,530
12.7
33.7
11.8
26,490
22.0
20.0
2,150
11.5
20,250
-2.2
5.2
16.5
115,973
85.7
16.9
61.6
1QE
1,896
4.3
122,084
7.7
32.0
10.6
26,144
21.4
19.5
2,392
21.5
20,568
1.6
0.7
14.9
120,073
85.7
FY18E
2QE
3QE
1,947
1,962
2.7
0.8
126,546 128,505
9.9
8.8
31.6
31.9
10.5
10.5
26,676
27,424
21.1
21.3
19.2
19.4
2,069
2,298
21.5
21.5
20,669
21,407
0.5
3.6
2.6
3.4
15.0
15.5
123,073 123,973
85.8
85.6
FY17
4QE
1,999
1.9
131,949
9.5
32.1
10.5
28,428
21.5
19.6
2,293
21.5
22,142
3.4
9.3
16.0
126,723
85.7
6,975
11.9
467,220
14.2
33.9
11.8
103,090
22.1
20.3
9,340
18.8
84,570
13.5
59.8
115,973
83.1
FY18E
7,804
11.9
509,084
9.0
31.9
10.6
108,671
21.3
19.4
9,052
21.5
84,786
0.3
61.4
126,723
83.2
27 July 2017
26

July 2017 Results Preview | Sector: Financials - Banks
ICICI Bank
Bloomberg
Equity Shares (m)
M. Cap. (INR b)/(USD b)
52-Week Range (INR)
1,6,12 Rel Perf. (%)
Financial Snapshot (INR b)
Y/E March
2017 2018E
NII
217.4 243.8
OP
264.9 227.5
NP
98.0 100.3
NIM (%)
3.3
3.4
EPS (INR)
15.3
15.6
EPS Gr (%)
0.6
2.3
BV/Sh (INR)*
135.4 146.6
ABV/Sh (INR)* 107.9 116.8
RoE (%)
10.2
9.4
RoA (%)
1.3
1.2
Valuations
AP/E (x)
14.2
13.0
AP/BV (x)
1.6
1.4
AP/ABV (x)
2.0
1.7
* BV adj for invt in subsidiaries
ICICIBC IN
6408.1
1855 / 29
298 / 215
0 / 10 / 14
n
2019E
275.3
253.6
114.7
3.4
17.9
14.5
159.2
139.9
10.1
1.2
10.5
1.2
1.3
2020E
317.8
289.8
136.7
3.3
21.3
19.2
174.3
161.5
11.3
1.3
7.6
0.9
1.0
CMP: INR289
n
TP: INR340 (+17%)
Buy
n
n
n
Key issues to watch for
Ø
Movement of watch-list accounts.
Ø
Plans on monetization of stakes in various ventures.
Ø
Outlook on asset quality and trend on further relapse from RL.
We expect loan growth to moderate to ~5% YoY (+1.5% QoQ):
corporate loan growth would be moderate and international loan
exposure would continue to decline. Retail loans should continue
to exhibit healthy growth.
NIMs are expected to expand sharply by ~20bp to 3.5% (although
decline ~8bp QoQ), as 1QFY17 was impacted by interest income
reversals. Resultantly, NII should increase ~15% YoY.
Fee income growth is expected to remain moderate at ~10% YoY.
Moderate trading gains, coupled with one-off stake sale and
repatriation gains (both totaling ~24b) in 1QFY17, would reflect in
muted non-interest income growth (-1% YoY).
Gross slippages are expected to remain high in 1QFY18 (4.5%
slippage ratio). O/s watch-list stood at INR190b (~3.7% of
customer assets). Recoveries from the cement account
recognized as NPL in 4QFY17 could lead to reversal of provisions.
We expect PBT growth of 22% YoY, despite ~6% growth in PPoP,
as 1QFY17 was impacted by higher credit costs. ICICIBC trades at
1.2x FY19E core BV and 10.5x FY19E EPS. Buy.
Quarterly Performance
Net Interest Income
% Change (YoY)
Other Income
Net Income
Operating Expenses
Operating Profit
% Change (YoY)
Other Provisions
Profit before Tax
Tax Provisions
Net Profit
% Change (YoY)
Operating Parameters
NIM (Cal, %)
Deposit Growth (%)
Loan Growth (%)
Tax Rate (%)
Asset Quality
Gross NPA (INR b)
Gross NPA (%)
1Q
51,585
0.8
34,293
85,878
33,731
52,147
3.5
25,145
27,002
4,679
22,324
-25.0
3.3
15.3
12.4
17.3
271.9
5.9
FY17
2Q
52,533
0.0
91,197
143,730
37,369
106,361
106.2
70,827
35,534
4,511
31,023
2.4
3.3
16.8
10.9
12.7
321.8
6.8
3Q
53,634
-1.6
39,383
93,017
37,777
55,239
-15.8
27,127
28,112
3,694
24,418
-19.1
3.3
14.2
5.2
13.1
380.9
7.9
4Q
59,622
10.3
30,172
89,794
38,674
51,120
-28.1
28,982
22,138
1,892
20,246
188.5
3.6
16.3
6.7
8.5
425.5
7.9
1QE
59,107
14.6
33,819
92,926
37,863
55,064
5.6
22,000
33,064
9,258
23,806
6.6
3.5
19.6
4.8
28.0
441.1
9.0
FY18E
2QE
3QE
59,457
61,337
13.2
14.4
37,216
38,789
96,672
100,126
41,774
42,698
54,899
57,427
-48.4
4.0
22,000
22,000
32,899
35,427
9,212
9,920
23,687
25,508
-23.6
4.5
3.5
16.3
6.3
28.0
446.5
8.9
3.5
15.6
10.3
28.0
449.8
8.6
4QE
63,892
7.2
39,888
103,781
43,660
60,121
17.6
22,269
37,852
10,598
27,253
34.6
3.5
16.2
14.1
28.0
446.1
8.2
(INR million)
FY17
217,373
2.4
195,045
412,418
147,551
264,867
11.0
152,081
112,786
14,775
98,011
0.8
3.3
16.3
6.7
13.1
425.5
7.9
FY18E
243,793
12.2
149,712
393,505
165,994
227,511
-14.1
88,269
139,241
38,988
100,254
2.3
3.5
16.2
14.1
28.0
446.1
8.2
27 July 2017
27

June 2017 Results Preview | Sector: Telecom
Idea Cellular
Bloomberg
Equity Shares (m)
M. Cap. (INR b)/(USD b)
52-Week Range (INR)
1,6,12 Rel Perf. (%)
IDEA IN
3600.5
302 / 5
124 / 66
5 / -4 / -35
n
CMP: INR84
n
TP: INR110 (+31%)
Buy
We expect consolidated revenue to decline 1.9% QoQ (and 16%
YoY) to INR79.7b.
Voice revenue is expected to remain flat QoQ at INR59.5b, while
data revenue is likely to fall 10% to INR13.1b.
EBITDA margin is expected to contract ~320bp QoQ/860bp YoY to
23.8% due to weak revenue and increased network cost.
We expect Idea to continue to increase net loss to INR8.4b
against a net loss of INR3.3b in 4QFY17.
Idea trades at an EV/EBITDA of 9.8x FY18E and 9.3x FY19E.
Financial Snapshot (INR Million)
Y/E March
2017 2018E 2019E 2020E
Net Sales
EBITDA
Adj. NP
AdjEPS (INR)
Adj.EPSGr(%)
BV/Sh(INR)
RoE (%)
RoCE (%)
Payout (%)
Valuations
P/E (x)
P/BV (x)
EV/EBITDA(x)
Div. Yield (%)
-75.1
1.2
8.3
0.0
-8.6
1.4
9.8
0.0
-7.4
1.7
9.3
0.0
-10.1
2.0
7.6
0.0
355.8
102.8
-4.0
-1.1
-113.0
68.6
-1.6
1.5
0.0
341.8
87.5
-35.1
-9.7
776.9
58.9
-15.3
0.0
0.0
366.1
96.2
-40.5
-11.2
15.4
48.9
-20.8
0.5
0.0
390.2
113.3
-29.8
-8.3
-26.3
42.0
-18.2
1.8
0.0
n
n
n
Key monitorables
Ø
Ø
Ø
Ø
Blended ARPU (we expect INR135.2, 5% QoQ fall).
Voice revenue performance (we expect flat QoQ).
Data revenue performance (we expect 10% decline QoQ).
EBITDA margin (we expect ~320bp contraction QoQ).
Consolidated - Quarterly Earning Model
Y/E March
Gross Revenue
YoY Change (%)
Total Expenditure
EBITDA
Margins (%)
Depreciation
Share in Profits from Associates
Interest
Other Income
PBT before EO expense
PBT
Tax
Rate (%)
Reported PAT
Margins (%)
1Q
94,866
7.9
64,124
30,742
32.4
19,192
1,035
9,224
0
3,362
3,362
1,158
34.4
2,204
2.3
FY17
2Q
93,002
7.0
64,601
28,401
30.5
19,543
1,057
8,753
0
1,162
1,162
247
21.3
915
1.0
3Q
86,627
-3.9
64,973
21,655
25.0
19,653
1,143
9,232
0
-6,087
-6,087
-2,248
36.9
-3,839
-4.4
4Q
81,261
-14.3
59,316
21,945
27.0
19,885
983
10,112
0
-7,069
-7,069
-3,792
53.6
-3,277
-4.0
1QE
79,689
-16.0
60,713
18,977
23.8
20,857
1,003
10,513
0
-11,391
-11,391
-3,000
26.3
-8,391
-10.5
FY18
2Q
83,673
-10.0
62,831
20,843
24.9
21,366
1,023
10,513
0
-10,013
-10,013
0
0.0
-10,013
-12.0
3Q
87,140
0.6
64,866
22,273
25.6
22,177
1,043
10,513
0
-9,373
-9,373
0
0.0
-9,373
-10.8
4Q
91,269
12.3
65,893
25,375
27.8
23,200
1,064
10,513
0
-7,273
-7,273
0
0.0
-7,273
-8.0
(INR Million)
FY17
FY18
355,758 341,771
12.7
-3.9
252,995 254,303
102,763
87,468
28.9
25.6
78,272
87,600
4,218
4,133
37,342
42,051
0
0
-8,633 -38,051
-8,633 -38,051
-4,636
-3,000
53.7
7.9
-3,997
-35,051
-1.1
-10.3
E: MOSL Estimates
27 July 2017
28

July 2017 Results Preview | Sector: Financials - Banks
IDFC Bank
Bloomberg
Equity Shares (m)
M. Cap. (INR b)/(USD b)
52-Week Range (INR)
1,6,12 Rel Perf. (%)
IDFCBK IN
3392.6
192 / 3
83 / 45
-3 / -23 / 8
n
CMP: INR57
n
TP: INR56 (-1%)
Neutral
Financial Snapshot (INR b)
Y/E March
2017 2018E 2019E 2020E
NII
20.2 24.0
29.4
34.5
OP
17.5 19.3
23.6
26.6
NP
10.2 11.9
14.2
15.5
NIM (%)
2.3
2.1
2.1
2.2
EPS (INR)
3.0
3.5
4.2
4.6
EPS Gr. (%)
17.1
18.6
9.5
BV/Sh. (INR)
43.2 45.9
49
53
ABV/Sh. (INR)
40.6 42.9
46
49
RoE (%)
7.2
7.9
8.8
9.0
RoA (%)
1.0
0.9
0.9
0.9
Valuations
P/E(X)
18.9 16.1
13.6
12.4
P/BV (X)
1.3
1.2
1.2
1.1
n
n
n
n
We expect loan growth to pick-up to 12% YoY (+4% QoQ), with
incremental growth to be driven by the retail segment, as the
bank is conservative on corporate growth.
Yields are expected to remain under pressure and we factor in
~15bp QoQ improvement in margins on a very low base to ~2.1%
(~30bp decline on a YoY basis). Overall NII is expected to grow
~10% YoY.
Non-interest income is likely to increase ~29% YoY to INR2.75b,
largely driven by a sharp increase in trading gains. Fee income is
expected to remain moderate.
Opex is likely to grow 28% YoY, driven by costs associated with
expansion of retail and rural banking franchise. Overall PPoP is
expected to grow ~8% YoY.
Stress additions would keep credit costs elevated, and we expect
high provisioning at INR550m. We expect PAT growth of ~9% YoY
to INR2.9b.
The stock trades at 1.2x FY19E BV and 13.6x FY19E EPS. Neutral.
Key issues to watch for
Ø
Outlook on balance sheet growth and costs.
Ø
Retail franchise building plans and update.
Quarterly Performance
Net Interest Income
% Change (Y-o-Y)
Other Income
Net Income
Operating Expenses
Operating Profit
% Change (Y-o-Y)
Other Provisions
Profit before Tax
Tax Provisions
Net Profit
% Change (Y-o-Y)
Operating Parameters
NIM (Cal, %)
Loan Growth (%)
Tax Rate (%)
Asset Quality
Gross NPA (INR b)
Gross NPA (on customer assets, %)
E: MOSL Estimates
1Q
4,989
2,128
7,117
2,768
4,349
236
4,113
1,465
2,648
NA
2.4
35.6
30.3
6.1
FY17
2Q
3Q
4,956
5,208
34.8
4,101
3,350
9,057
8,558
3,234
3,798
5,823
4,760
22.4
223
2,318
5,600
2,443
1,722
530
3,878
1,913
NA
-21.0
2.0
19.7
30.8
32.2
6.0
2.0
9.3
21.7
35.9
7.0
4Q
5,021
20.5
563
5,584
2,981
2,602
0.2
48
2,555
795
1,760
6.6
1.9
8.1
31.1
15.4
3.0
1QE
5,485
9.9
2,750
8,235
3,550
4,686
7.7
550
4,136
1,241
2,895
9.3
2.1
11.9
30.0
21.8
4.1
FY18E
2QE
3QE
5,822
6,166
17.5
18.4
2,700
3,150
8,522
9,316
3,814
4,524
4,708
4,792
-19.2
0.7
550
550
4,158
4,242
1,247
1,272
2,910
2,969
-24.9
55.2
2.1
7.5
30.0
28.2
5.1
2.1
22.9
30.0
34.7
5.8
4QE
6,507
29.6
3,471
9,978
4,815
5,163
98.4
643
4,520
1,356
3,164
79.8
2.1
29.1
30.0
41.1
6.2
(INR Million)
FY17
20,173
NA
10,131
30,304
12,770
17,535
NA
2,825
14,710
4,512
10,197
NA
2.1
8.1
30.7
15.4
3.0
FY18E
23,979
18.9
12,071
36,050
16,703
19,348
10.3
2,293
17,055
5,116
11,938
17.1
2.1
29.1
30.0
41.1
6.2
27 July 2017
29

June 2017 Results Preview | Consumer
ITC
Bloomberg
Equity Shares (m)
M. Cap. (INR b)/(USD b)
52-Week Range (INR)
1,6,12 Rel Perf. (%)
ITC IN
12147.4
4095 / 63
353 / 222
6 / 21 / 23
n
CMP: INR337
n
TP: INR380 (+13%)
Buy
Financial Snapshot (INR b)
Y/E March
Sales
EBITDA
Adj. PAT
Adj. EPS (INR)
EPS Gr. (%)
BV/Sh.(INR)
RoE (%)
RoCE (%)
Payout (%)
Valuations
P/E (x)
P/BV (x)
EV/EBITDA (x)
Div. Yield (%)
40.1
9.1
26.6
1.6
34.9
8.9
23.5
2.0
29.0
8.1
19.3
2.4
24.2
7.3
15.9
2.9
2017 2018E 2019E 2020E
396.4 442.3 514.0 599.4
145.8 164.9 199.8 240.5
102.0 117.2 141.1 169.2
8.4
9.4
37.2
23.5
22.6
66.2
9.6
14.9
37.7
25.8
24.8
70.2
11.6
20.4
41.6
29.3
28.2
70.2
13.9
19.9
46.1
31.8
30.9
70.2
n
n
n
We expect net sales to grow by 4% YoY to INR104.6b, with
cigarette volume declining by 2% YoY (base quarter saw 3%
volume growth).
We expect cigarette EBIT to grow 3.9% YoY. We have factored in
EBITDA growth of 2.5% YoY to INR36.2b for the company.
We expect Other FMCG to post revenue growth of ~4% YoY.
We estimate PAT growth of 6.2% YoY to INR25.3b.
The stock trades at 29x FY19E EPS of INR11.6; maintain Buy.
Key issues to watch for:
Ø
Trends in cigarette volume.
Ø
Demand outlook for FMCG categories and segmental
profitability.
Quarterly Performance
Y/E March
Cigarette Vol Gr (%)
Net Sales
YoY Change (%)
Total Exp
EBITDA
Growth (%)
Margins (%)
Depreciation
Interest
Other Income
PBT
Tax
Rate (%)
Adj PAT
YoY Change (%)
E: MOSL Estimates
1Q
3.0
100,540
9.8
65,278
35,262
8.4
35.1
2,613
101
4,205
36,754
12,907
35.1
23,847
10.1
FY17
2Q
4.0
96,607
9.8
60,307
36,300
7.3
37.6
2,684
107
4,754
38,262
13,262
34.7
25,000
10.5
3Q
-1.0
92,484
4.3
57,020
35,464
2.1
38.3
2,665
136
6,879
39,542
13,075
33.1
26,467
5.7
4Q
0.0
111,255
14.0
72,502
38,754
7.5
34.8
2,418
-115
4,021
40,471
13,777
34.0
26,695
12.1
1QE
-2.0
104,562
4.0
68,412
36,150
2.5
34.6
2,874
101
4,626
37,801
12,474
33.0
25,327
6.2
FY18
2QE
3QE
5.0
10.0
106,268 106,356
10.0
15.0
66,337
65,041
39,930
41,315
10.0
16.5
37.6
38.8
2,953
2,932
107
136
5,229
7,567
42,099
45,815
13,893
15,119
33.0
33.0
28,206
30,696
12.8
16.0
4QE
10.0
129,512
16.4
82,013
47,498
22.6
36.7
2,948
-115
4,501
49,165
16,224
33.0
32,941
23.4
(INR Million)
FY17
1.5
400,887
9.6
255,106
145,780
6.3
36.4
10,380
230
19,859
155,030
53,021
34.2
102,009
9.5
FY18E
6.0
446,698
11.4
281,804
164,894
13.1
36.9
11,707
230
21,923
174,880
57,710
33.0
117,169
14.9
27 July 2017
30

June 2017 Results Preview | Sector: Automobiles
Maruti Suzuki
Bloomberg
Equity Shares (m)
M. Cap. (INR b)/(USD b)
52-Week Range (INR)
1,6,12 Rel Perf. (%)
MSIL IN
302.1
1915 / 29
6356 / 3419
4 / 5 / 58
CMP: INR7,372 TP:INR8,483 (+15%)
Buy
Financial Snapshot (INR b)
Y/E March
2017 2018E 2019E 2020E
Sales
EBITDA
Adj. PAT
680.3
104.7
74.2
815.9
123.5
86.7
955.9
156.0
112.9
1,103
178.9
132.8
*EPS (INR)
248.6 292.6 379.7 446.1
EPS Gr. (%)
36.6
17.7
29.8
17.5
BV/Sh. (INR)
1,197 1,382 1,636 1,943
RoE (%)
20.3
20.8
22.8
22.6
RoCE (%)
27.3
27.7
30.0
29.8
Payout (%)
37.1
35.6
32.2
30.1
Valuations
P/E (x)
29.6
25.2
19.4
16.5
P/CE (x)
22.0
18.7
15.0
12.9
EV/EBITDA (x) 18.6
15.3
11.6
9.5
Div. Yield (%) 1.0
1.2
1.4
1.5
*Consol. & adjusted
n
Volume grew ~13% YoY (and 5% QoQ) to ~394,571 units, led by
better performance from
Baleno
and
Brezza
with incremental
Gujarat production, though slightly impacted by GST transition.
n
Net realization is likely to improve 4% YoY (and 0.5% QoQ) to
INR444,579 per unit, boosting net revenue by ~18% YoY (and
22.6% QoQ) to INR172.6b. Growth in realization is likely to be
driven by improvement in product mix due to compact UV,
Vitarra Brezza,
and premium hatchback,
Baleno.
n
We expect margin to decline 110bp YoY (and 80bp QoQ) to
13.8%, led by the impact of Gujarat plant and higher fixed cost
due to same. Also, higher offers due to GST transition would
impact margins.
n
The compensation to dealers for the loss of input tax credit (ITC)
on inventory following the transition to GST is likely to impact
margin by 25bp in 2QFY18.
n
EBITDA is likely to grow ~10% YoY (but decline 9% QoQ) to
INR24.3b.
n
We expect PAT to grow ~10% YoY (but decline 10% QoQ) to
INR16.3b, led by higher depreciation.
n
The stock trades at 25.2x FY18E and 19.4x FY19E EPS.
Buy.
Key issues to watch
Ø
Update on demand scenario, channel inventory, discounting trends
and new launches.
Ø
Ø
Gujarat plant product pipeline.
Impact of GST on demand.
(INR Million)
FY17
FY18E
1,568,603
9.8
433,729
7.9
680,348
18.4
68.7
3.4
12.5
104,710
15.4
26,021
894
22,798
99,413
26.2
74,248
40.8
1,806,406
15.2
451,680
4.1
815,918
19.9
68.9
3.5
12.4
123,452
15.1
30,546
850
25,487
117,543
26.3
86,688
16.8
Quarterly Performance
Total Volumes (nos)
Change (%)
Realizations (INR/car)
Change (%)
Net operating revenues
Change (%)
RM Cost (% of sales)
Staff Cost (% of sales)
Other Cost (% of sales)
EBITDA
EBITDA Margins (%)
Depreciation
Interest
Non-Operating Income
PBT
Effective Tax Rate (%)
Adjusted PAT
Change (%)
E:MOSL Estimates
1Q
348,443
2.1
428,202
9.3
149,204
11.5
67.9
3.9
13.4
22,157
14.9
6,389
181
4,833
20,420
27.2
14,862
23.0
FY17
2Q
3Q
418,470 387,251
18.4
3.5
426,382 435,500
8.8
8.5
178,428 168,648
28.8
12.3
67.7
69.2
2.9
3.7
12.4
12.4
30,374
24,890
17.0
14.8
6,300
6,349
197
290
8,126
5,919
32,003
24,170
25.1
27.8
23,980
17,445
60.2
47.5
4Q
414,439
15.0
442,367
4.6
183,334
20.3
69.6
3.4
12.4
26,787
14.6
7,010
226
4,449
22,820
25.1
17,974
21.8
1QE
394,571
13.2
444,579
3.8
175,418
17.6
69.4
4.0
12.8
24,276
13.8
7,500
210
5,500
22,066
26.3
16,274
9.5
FY18E
2QE
3QE
461,664 435,255
10.3
12.4
447,913 452,392
5.0
3.9
206,785 196,906
15.9
16.8
69.7
68.6
3.4
3.8
12.5
12.2
29,800
30,403
14.4
15.4
7,600
7,700
210
210
6,250
6,750
28,240
29,243
26.3
26.3
20,827
21,567
-13.1
23.6
4QE
514,916
24.2
459,899
4.0
236,809
29.2
68.2
3.2
12.1
38,972
16.5
7,746
220
6,987
37,994
26.3
28,020
55.9
27 July 2017
31

June 2017 Results Preview | Sector: Oil & Gas
ONGC
Bloomberg
Equity Shares (m)
M. Cap. (INR b)/(USD b)
52-Week Range (INR)
1,6,12 Rel Perf. (%)
ONGC IN
12833.3
2053 / 32
212 / 144
-8 / -35 / -11
CMP: INR160
n
n
n
n
n
TP: INR195 (+22%)
Buy
Financial snapshot (INR b)
y/e march
2017 2018E 2019E 2020E
Sales
EBITDA
Adj. PAT
Adj.EPS (INR)
EPS Gr. (%)
BV/Sh.(INR)
RoE (%)
RoCE (%)
Payout (%)
Valuation
P/E (x)
P/BV (x)
EV/EBITDA
(x)
Div. Yield (%)
9.7
0.9
4.9
4.7
9.2
0.9
3.8
6.0
8.1
0.9
3.3
6.8
8.5
0.8
2.9
9.8
1421
471
211
16.4
20.8
172
10.1
8.5
52.5
1501
605
223
17.4
6.0
178
9.9
8.7
64.9
1706
700
253
19.7
13.4
185
10.8
9.3
64.9
1755
726
241
18.8
-4.7
192
10.0
8.5
64.9
We expect ONGC to report adjusted PAT of INR52b in 1QFY18 (v/s
INR43.4b in 4QFY17 and INR42.3b in 1QFY17).
We estimate EBITDA at INR109.7b (v/s INR67.3b in 4QFY17 and
INR92.7b in 1QFY17), led by lower opex assumption.
We estimate gross and net realization at USD51.2/bbl, as we
expect the entire subsidy to be borne by the government.
Our Brent price assumption is USD50/bbl for FY18 and USD55/bbl
for FY19/20.
The stock trades at 8.1x FY19E consolidated EPS of INR19.7, with
implied dividend yield of ~5%. Maintain Buy.
Key issues to watch for
Ø
Ø
Ø
Ø
Subsidy sharing.
DD&A charges.
Oil & gas production volumes.
Development plan for KG Basin.
Standalone - Quarterly Earning Model
Y/E March
Net Sales
YoY Change (%)
Total Expenditure
EBITDA
Margins (%)
Depreciation
Interest
Other Income
PBT before EO expense
Extra-Ord expense
PBT
Tax
Rate (%)
Reported PAT
Adj. PAT
YoY Change (%)
Margins (%)
Key Assumptions (USD/bbl)
Fx rate (INR/USD)
Gross Oil Realization
Subsidy
Net Oil Realization
Subsidy (INR b)
E: MOSL Estimates
1Q
176,704
-21.5
83,942
92,761
52.5
36,997
2,920
10,668
63,512
0
63,512
21,186
33.4
42,325
42,325
-21.2
24.0
66.9
46.1
0.0
46.1
0.0
FY17
FY18E
2Q
3Q
4Q
1QE
2QE
3QE
4QE
182,866 199,338 217,140 202,876 202,369 206,958 208,471 776,048
-11.1
9.2
33.7
14.8
10.7
3.8
-4.0
0.1
87,476 96,440 149,889 93,195 93,388 94,116 94,475 417,746
95,391 102,898 67,252 109,681 108,982 112,842 113,996 358,302
52.2
51.6
31.0
54.1
53.9
54.5
54.7
46.2
34,529 47,039 53,875 44,451 44,451 44,451 44,451 172,440
3,034
3,062
3,202
960
960
960
960 12,217
12,920
9,727 45,195 13,931 13,931 13,931 13,931 78,511
70,748 62,524 55,371 78,201 77,502 81,362 82,516 252,155
0
0
0
0
0
0
0
0
70,748 62,524 55,371 78,201 77,502 81,362 82,516 252,155
20,999 19,001 11,969 26,064 25,831 27,118 27,503 73,155
29.7
30.4
21.6
33.3
33.3
33.3
33.3
29.0
49,749 43,523 43,402 52,137 51,670 54,244 55,013 179,000
49,749 43,523 43,402 52,137 51,670 54,244 55,013 179,000
2.7
3.3
-0.3
23.2
3.9
24.6
26.8
-8.3
27.2
21.8
20.0
25.7
25.5
26.2
26.4
23.1
67.0
47.9
0.0
47.9
0.0
67.4
50.1
0.0
50.1
0.0
67.2
54.9
0.0
54.9
0.0
64.4
51.2
0.0
51.2
0.0
65.5
50.9
0.0
50.9
0.0
66.0
50.9
0.0
50.9
0.0
66.5
50.9
0.0
50.9
0.0
67.1
49.8
0.0
49.8
0.0
(INR Million)
FY17
FY18E
820,674
5.8
375,174
445,500
54.3
177,805
3,840
55,725
319,581
0
319,581
106,516
33
213,065
213,065
19.0
26.0
65.6
51.0
0.0
51.0
0.0
27 July 2017
32

June 2017 Results Preview | Sector: Technology
Tata Elxsi
Bloomberg
Equity Shares (m)
M. Cap. (INR b)/(USD b)
1863
1,6,12 Rel Perf. (%)
TELX IN
31.1
52 / 1
1783 / 1022
23 / 0 / -20
n
CMP: INR1,669 TP: INR1,848 (11%)
n
Buy
We expect revenue to grow 12% YoY to INR3.3b in 1QFY18, driven
by steady growth in both Transportation and Broadcast business.
We expect EBITDA margin to expand 30bp YoY to 23.8%.
Consequently, we expect EBITDA to increase 14% YoY to
INR785m.
We expect adjusted PAT to grow 16% to INR488m.
Buy.
Financial Snapshot (INR Billion)
2017 2018E 2019E 2020E
Y/E March
Sales
EBITDA
NP
EPS (Rs)
EPS Gr. (%)
BV/Share
RoE (%)
RoCE (%)
Valuations
P/E (x)
P/BV (x)
EV/EBITDA (x)
Div. Yield (%)
29.7
9.3
16.9
1.0
24.6
7.5
13.7
1.2
20.8
6.1
11.3
1.5
17.2
5.1
9.9
-2.2
12.3
2.9
1.8
56.3
13.2
37.1
37.1
14.2
3.4
2.1
68.0
20.8
33.7
33.7
16.4
4.0
2.5
80.4
18.2
32.3
32.3
19.7
4.9
3.0
96.8
20.5
32.2
48.6
n
179.5 223.5 273.9 327.5
Key things to watch for
Ø
Addition of new customers and subsequent realization.
Ø
JLR’s contribution to revenues.
Consolidated Quarterly Performance
Y/E March
Net Sales
YoY Change (%)
Total Expenditure
EBITDA
Margins (%)
Depreciation
Interest
Other Income
PBT before EO expense
Extra-Ord expense
PBT
Tax
Rate (%)
Reported PAT
Adj PAT
YoY Change (%)
Margins (%)
E: MOSL Estimates
1Q
2,943
20.9
2,253
691
23.5
67
0
11
634
0
634
215
33.8
419
419
17.4
14.2
FY17
2Q
3,033
15.0
2,288
745
24.6
64
0
26
707
57
651
220
33.8
431
468
22.9
15.4
3Q
3,094
12.9
2,355
739
23.9
69
0
23
693
31
662
224
33.9
438
458
12.5
14.8
4Q
3,260
10.9
2,503
758
23.2
68
0
-21
669
0
669
224
33.4
445
445
8.3
13.6
1QE
3,296
12.0
2,512
785
23.8
68
0
15
732
0
732
244
33.3
488
488
16.4
14.8
FY18
2QE
3,488
15.0
2,605
882
25.3
78
0
12
816
0
816
275
33.7
541
541
15.6
15.5
3QE
3,620
17.0
2,744
876
24.2
70
0
13
819
0
819
280
34.2
539
539
17.6
14.9
4QE
3,815
17.0
2,918
896
23.5
82
0
10
824
0
824
277
33.6
547
547
23.0
14.4
(INR Million)
FY17
FY18E
12,330
14.7
9,398
2,932
23.8
269
0
-48
2,615
0
2,615
862
33.0
1,753
1,753
12.6
14.2
14,220
15.3
10,778
3,441
24.2
298
0
50
3,194
0
3,194
1,077
33.7
2,116
2,116
20.8
14.9
27 July 2017
33

In conversation
1. No plans to exit insurance biz; to maintain slippages at Rs 240-
250 Cr: Federal Bank; Shyam Srinivasan, MD and CEO
n
n
n
n
n
n
n
n
n
Fall in net interest margins (NIM) was on a pre-guided large corporate account
that slipped.
For a normal quarter the slippages have been around Rs 250-260 crore but in Q1
it was around Rs 425 crore because of that large account. There was also a small
uptick in retail and agri slippages. The incremental slippage is a restructured
account
The large account is a steel account in the East of the size of Rs 140 crore.
GNPAs and restructured book has been trending down and it did in this quarter
as well.
The trend line of slippages has been in the tune of Rs 240-250 crore, and that
will continue.
There could be a minor uptick of Rs 20-30 crore because of demonetisation led
retail accounts but not that will not shift the trend line of slippage
One of the finest quarters in a long time both in terms of operating profit and
growth. The operating strength of the bank is only getting better
Was an excellent Q in terms of retail disbursement
Will not be exiting IDBI Federal Life insurance business but the three partners
are trying to come at the value of the company because the JV agreement allow
for the two domestic partners to reduce their stake provided the international
partner want to raise their holding. That process is underway
2. Looking at acquisitions worth Rs 200cr this year: Allcargo
Logistics; Shashi Kiran Shetty
n
n
n
n
Country adopted GST very well and no one is talking negative about it.
On business front, Allcargo will cross 10 million square feet of warehouse by
2020.
Actively working towards a foray into last mile delivery.
Looking at acquisitions worth Rs 200 crore in this year
3. Expect retail growth to continue: Axis Bank; V Srinivasan,
Deputy MD
n
n
n
n
n
n
At the start of the year, Axis Bank had indicated that the credit cost for this year
would be in the range of 175 basis points (bps) to 225 bps, which is substantially
lower than last year. Expect credit cost to go further down towards a long-term
average in FY19
NII is a function of topline as well as interest reversals. As stress comes off,
growth and NII will pick up
Watchlist has reduced compared to where we started in April 2016
Indicated at the beginning of the year that 20 bps dilution of net interest
margins (NIMs) from full year NIMs of last year
Enough capital for growth as far as bank is concerned
Retail has been a big driver for growth and he expects it to continue throughout
this year.
27 July 2017
34

4. To focus on asset-light growth; aiming at double-digit roce
FOR FY18: Raymond; Sanjay Bahl, Group CFO
n
n
n
n
n
n
Upcoming festive season there will be lot of stocking that will happen and so the
outlook is more positive going ahead. Due to GST destocking had taken place.
Volume growth for apparel business to continue with higher offtake from
channel partners. Moreover, good monsoons will help consumption.
Outlook for Q2 remains positive. Earlier the guidance was of growing in double-
digits in terms of volumes, adding that margin growth will also be significantly
higher compared to last year, which was impacted due to demonetisation.
Ahead of our internal plans for the current year. Hope of return on capital (RoC)
getting back to double-digits in FY18,however, one must also keep in mind that
the capex investment plans for FY18 are high.
With regards to 2020 plans, the capex investments will reduce and RoCE will be
higher. The focus going forward will be on asset-light growth through franchise
model to help return on capital employed plans.
The company is still working on the monetization of land bank at Thane.
5. Expect to get NBFC licence by q3 of FY18: Welspun
enterprises; Sandeep Garg, MD
n
n
n
n
MBL has financial difficulty right now, it is a very profitable project for them but
given the situation with MBL Infra, they have chosen to take us as a sponsor
On NBFC plans, there is no plan to spin-off NBFC into separate unit.
Expects to get the NBFC licence by Q3 of FY18.
On core business, order book target is at Rs 4,000-4,500 crore for this year.
Welspun Enterprises will invest around Rs 250 crore in the hybrid annuity model
projects.
6. No concrete plans to acquire housing finance co: Hudco;
Rakesh Kumar Arora, Director Finance
n
n
n
n
n
n
n
91 percent of the loan book is to the government and government related
agencies and 9 percent is to private sector.
Government book NNPAs at 0.01 percent and for the private sector the total
outstanding is around Rs 3600 crore, out of that Rs 1900 crore has been
provided for.
The two NPAs that were added in Q1 are related to the private sector, but as per
regulatory norms provisions were made for that.
The two accounts under stress are worth Rs 700 crore.
Retail loan book stands at only 1.5 percent of the total book and lending is only
for projects.
Clarified that as of now there was nothing on the cards with respect of
acquisition of Housing Finance Companies.
The disbursements last year grew at 12 percent and looking at growth in the
first quarter, hope to grow at a similar pace
27 July 2017
35

From the think tank
1. Telecom interconnect charges: economic principles, not
popular voice should be deciding factor
n
Trai recently conclude the consultation on the issue of Interconnection Usage
Charge (IUC) where it had raised some questions for consultation. Should there
be an IUC? Since interconnect plus usage charge translates into IUC it is clear
that when we discuss the issue of IUC we are acknowledging that
interconnection between various telecom operators is mandatory. This, indeed,
is the case in our licensing and regulatory regime. Interconnection and IUC, may
be two different things but are complementary and in the absence of one the
other may not be workable. That there is a charge involved in interconnecting
different networks is a fact that cannot be ignored. If this charge is not defined
and mandated, differences can arise with operators not willing to interconnect.
Of course, this charge cannot be zero and there has to be a cost-based IUC
charge.
2. A greater market role in bankruptcy process
n
One of the major challenges for the Narendra Modi government in the next two
years is the revival of private investment in the country. Failure on this count
could hurt employment generation, exacerbate economic inequality and
threaten social unrest. An International Monetary Fund paper (goo.gl/cfp4cm)
by Sonali Das and Volodymyr Tulin, released last month, noted that the rise in
gross fixed capital formation over the last five years in India averaged only 3.5%,
compared to 12% per year over the decade ending 2011-12. A major cause of
investment slowdown, the paper argues, is the rise in financial leverage of firms.
This is especially true for firms whose earnings are insufficient to service their
debt. Higher leverage not only cripples the ability of firms to undertake new
investments, but also impedes the completion of ongoing projects. As a result,
these firms continue to suffer from low productivity. In such situations, a strong
exit mechanism goes a long way in ensuring an efficient reallocation of both
capital and labour to productive businesses, thereby contributing to higher
output.
3. The vexed question of financing Indian cities
n
About 814 million people are expected to live in Indian cities by 2050. Just in
terms of scale, the task of effectively managing cities in India will potentially be
touted as the world’s greatest managerial challenge. And while China might
have an almost equal number living in its cities, it is better poised to handle its
urban explosion than India. The numbers paint a disappointing picture. A 2010
McKinsey report estimates that India will need to spend $1.2 trillion by 2030, a
far cry from current spending estimates. India’s annual per capita spending on
cities stands at a measly $50. The corresponding figures for China and the UK
are about $362 and $1,772, respectively. The financial health of Indian cities is in
such a pathetic state that revenue generated by urban local bodies accounts for
less than 0.9% of the total GDP (gross domestic product) despite cities
contributing almost 60% towards GDP.
27 July 2017
36

4. Trade agreements: theory and reality
n
Ever since the days of David Ricardo in the early 19th century, it has been
established, and remains unquestioned to date, that free trade is a win-win for
everybody. The key word is “free”, meaning without coercion, fully voluntary.
Ricardo’s clever insight was that trade between nations could be mutually
beneficial, even if one nation was more efficient than the other in all
commodities. This was his theory of comparative advantage. Most economists
swear by this maxim. The simplest illustration is this: a lawyer may be a faster
typist than her assistant, but her time should be spent in legal stuff, not in
typing, which should be left to the assistant. The lawyer thus specializes in law,
not in typing.
International
5. Banking union will transform Europe’s politics
n
In our excitement over what is new, we often miss what is important. The
election of Emmanuel Macron has triggered expectations of a Franco-German
entente on further fiscal integration in the eurozone. Brexit has given new
momentum to proposals for a multi-speed Europe. But behind these speculative
possibilities real, profound change is proceeding relatively unnoticed except by
technical experts. The European banking union, launched in 2012 for the
eurozone but enjoying increasing interest by non-euro countries, is shaping up
to be the most significant transformation brought about by the financial crisis —
not just of Europe’s economic structure, but of its political economy. Within
weeks in June, unrelated failing banks in Spain and Italy were wound down.
Together, they illustrate how much banking union has transformed Europe’s
financial governance.
27 July 2017
37

Click excel icon
for detailed
valuation guide
Rs
Valuation snapshot
P/E (x)
FY17 FY18E
30.2
23.3
21.5
43.5
51.2
20.1
47.2
38.9
32.6
26.6
22.0
26.0
47.1
30.5
23.1
48.6
28.7
34.4
28.3
35.7
23.8
30.8
20.3
20.1
33.0
NM
36.8
44.4
14.0
23.5
29.5
27.3
NM
19.0
40.6
10.7
NM
25.5
994.3
20.9
110.2
50.2
37.6
24.9
15.5
56.3
34.9
17.2
30.7
19.3
25.1
20.5
20.7
30.2
37.3
19.5
33.6
29.9
17.6
22.4
19.6
21.2
25.6
25.9
14.8
35.1
22.5
24.2
23.7
34.9
21.0
25.6
19.8
17.2
25.5
22.7
30.4
29.3
10.7
18.9
23.6
8.9
11.7
11.9
9.6
9.1
8.9
15.5
16.5
6.5
13.3
35.4
19.1
20.8
12.2
46.1
32.2
13.8
22.4
15.4
P/B (x)
FY17 FY18E
5.6
5.1
4.8
6.4
8.4
3.1
16.4
7.4
3.3
3.7
7.3
3.3
2.9
6.3
2.7
11.3
4.9
2.3
2.9
2.6
2.3
5.2
2.3
1.4
4.8
0.8
4.8
4.7
1.2
3.7
3.4
1.1
0.7
0.8
0.6
1.0
0.4
0.9
1.4
0.5
1.0
9.6
4.4
4.2
1.8
16.9
6.5
4.1
3.6
3.5
4.7
4.5
4.4
5.6
7.4
2.8
11.8
6.1
2.8
3.3
6.3
3.0
2.6
5.5
2.2
9.0
4.2
2.2
2.4
2.4
1.8
4.5
2.1
1.3
4.1
0.8
4.2
3.3
1.1
3.2
3.0
1.0
0.7
0.7
0.5
1.0
0.4
0.8
1.3
0.5
0.9
7.8
3.6
3.6
1.6
13.8
5.9
3.7
3.2
2.9
ROE (%)
FY17 FY18E FY19E
20.3
23.1
25.3
16.2
15.8
16.9
40.3
20.8
10.6
14.0
35.7
14.2
6.4
20.3
9.8
25.6
17.1
6.9
10.8
8.9
9.9
18.3
10.2
7.2
15.4
-27.0
13.8
12.3
9.5
18.9
11.5
4.1
-6.7
4.2
1.4
10.1
-8.4
3.6
-0.2
2.7
0.9
21.7
15.1
18.1
14.4
32.5
19.3
25.5
12.4
19.4
20.4
23.2
22.2
19.8
21.1
15.1
40.8
22.4
17.3
14.8
34.6
14.1
10.8
20.8
16.5
28.6
18.9
9.3
11.4
7.1
10.2
18.8
9.4
7.9
17.3
3.5
15.0
13.6
10.8
18.0
12.7
11.9
6.1
6.2
5.8
10.9
4.6
5.6
8.7
8.1
6.7
24.3
20.9
18.5
14.1
33.0
18.3
28.2
15.3
20.6
20.7
27.0
24.0
22.3
21.9
17.8
38.0
23.6
18.3
15.9
31.5
14.6
11.5
22.8
27.3
35.2
22.6
14.7
11.8
10.1
10.5
19.6
10.1
8.8
18.5
7.2
16.3
13.9
12.7
19.5
14.4
13.2
9.0
9.1
7.3
11.2
5.4
7.5
10.0
10.5
8.3
25.9
21.6
18.9
15.6
32.8
17.4
31.3
17.5
19.7
Company
Automobiles
Amara Raja
Ashok Ley.
Bajaj Auto
Bharat Forge
Bosch
CEAT
Eicher Mot.
Endurance Tech.
Escorts
Exide Ind
Hero Moto
M&M
Mahindra CIE
Maruti Suzuki
Tata Motors
TVS Motor
Aggregate
Banks - Private
Axis Bank
DCB Bank
Equitas Hold.
Federal Bank
HDFC Bank
ICICI Bank
IDFC Bank
IndusInd
J&K Bank
Kotak Mah. Bk
RBL Bank
South Indian
Yes Bank
Aggregate
Banks - PSU
BOB
BOI
Canara
IDBI Bk
Indian Bk
OBC
PNB
SBI
Union Bk
Aggregate
NBFCs
Bajaj Fin.
Bharat Fin.
Cholaman.Inv.&F
n
Dewan Hsg.
GRUH Fin.
HDFC
Indiabulls Hsg
L&T Fin Holdings
LIC Hsg Fin
Reco
Buy
Buy
Buy
Buy
Neutral
Buy
Buy
Buy
Neutral
Buy
Neutral
Buy
Not Rated
Buy
Buy
Buy
CMP
(INR)
847
106
2,838
1,138
24,237
1,873
28,959
913
651
217
3,718
1,413
252
7,578
457
571
TP
% Upside
EPS (INR)
(INR) Downside FY17 FY18E FY19E
1,073
118
3,281
1,330
23,738
2,100
31,326
1,025
731
286
3,818
1,625
-
8,483
666
606
27
11
16
17
-2
12
8
12
12
32
3
15
12
46
6
28.0
4.6
132.3
26.2
473.1
93.3
613.8
23.5
20.0
8.2
169.1
54.3
5.4
248.6
19.8
11.7
33.8
40.5
5.2
7.0
137.2 163.6
37.7
49.7
649.9 766.2
96.2
131.3
861.2 1,102.9
30.5
38.8
36.9
45.7
9.7
11.9
189.3 199.1
66.7
79.9
9.9
11.8
292.6 379.7
30.9
64.3
16.3
25.9
Neutral
529
Neutral
198
Buy
169
Buy
115
Buy
1,750
Buy
310
Neutral
60
Buy
1,580
Neutral
87
Buy
987
Under Review 528
Buy
31
Buy
1,713
545
192
207
134
2,000
340
62
1,800
91
1,153
-
34
2,121
3
-3
23
17
14
10
3
14
5
17
11
24
15.4
7.0
4.7
4.8
56.8
15.3
3.0
47.9
-31.3
26.8
11.9
2.2
73.0
21.8
8.4
4.8
5.5
68.2
15.6
3.5
61.9
3.8
32.4
18.0
2.9
90.7
38.1
10.4
7.4
6.8
82.1
17.9
4.2
76.8
8.2
41.0
23.7
3.7
114.6
Buy
Neutral
Neutral
Neutral
Buy
Neutral
Buy
Buy
Neutral
163
161
357
62
315
152
159
296
160
212
147
360
49
382
150
184
362
162
30
-8
1
-21
21
-1
16
22
2
6.0
-14.8
18.8
1.5
29.3
-31.6
6.2
0.3
7.6
18.4
13.7
30.1
6.4
34.4
17.1
10.3
17.9
24.6
22.5
22.0
47.0
8.6
38.3
21.4
14.5
23.3
34.5
Buy
Neutral
Buy
1,686
789
1,145
1,800
800
1,300
630
450
-
1,350
180
750
7
1
14
37
-2
14
12
2
33.6
21.0
46.0
29.6
8.1
46.8
69.0
5.2
38.2
47.6
41.3
55.0
37.7
9.9
50.7
86.3
7.2
47.9
62.9
53.0
66.4
47.1
12.1
55.9
108.4
9.6
53.8
Buy
460
Neutral
458
Under Review 1,633
Buy
1,187
Buy
161
Neutral
737
27 July 2017
38

Company
Reco
Manappuram
Not Rated
M&M Fin.
Buy
Muthoot Fin
Buy
PFC
Neutral
Repco Home
Buy
REC
Neutral
Shriram
City
Buy
Union
STF
Buy
Aggregate
Capital Goods
ABB
Sell
Bharat Elec.
Buy
BHEL
Sell
Blue Star
Neutral
CG Cons. Elec.
Buy
CG Power & Indu. Sell
Cummins
Buy
GE T&D
Neutral
Havells
Neutral
K E C Intl
Neutral
L&T
Buy
Pennar Eng.
Not Rated
Siemens
Neutral
Solar Ind
Neutral
Suzlon Energy
Not Rated
Thermax
Sell
Va Tech Wab.
Buy
Voltas
Sell
Aggregate
Cement
Ambuja Cem.
Buy
ACC
Neutral
Birla Corp.
Buy
Dalmia Bharat
Buy
Grasim Inds.
Neutral
India Cem
Neutral
J K Cements
Buy
JK Lakshmi Ce
Buy
Ramco Cem
Buy
Orient Cem
Buy
Prism Cem
Buy
Shree Cem
Buy
Ultratech
Buy
Aggregate
Consumer
Asian Paints
Neutral
Britannia
Buy
Colgate
Buy
Dabur
Neutral
Emami
Buy
Godrej Cons.
Neutral
GSK Cons.
Sell
HUL
Buy
ITC
Neutral
CMP
(INR)
107
396
478
123
781
176
2,279
983
TP
% Upside
EPS (INR)
(INR) Downside FY17 FY18E FY19E
-
8.6
10.8
12.5
459
16
7.1
13.9
17.8
550
15
29.5
41.0
43.3
117
-5
25.7
27.2
30.2
936
20
29.1
35.8
42.5
134
-24
31.4
35.0
40.4
2,900
1,340
27
36
84.3
55.6
132.8
78.5
171.2
98.5
P/E (x)
FY17 FY18E
12.4
9.9
55.9
28.6
16.2
11.7
4.8
4.5
26.8
21.8
5.6
5.0
27.0
17.7
19.8
73.3
25.4
67.0
54.2
43.9
20.7
37.7
68.5
48.2
25.5
27.9
17.1
77.7
43.4
30.1
29.4
20.6
32.2
35.3
54.2
47.4
32.0
67.2
15.7
37.7
29.3
65.9
24.5
NM
353.7
45.4
42.4
36.6
53.9
52.3
50.2
42.2
41.9
54.2
35.3
59.3
34.9
17.2
12.5
16.6
64.5
24.5
40.4
39.2
37.4
37.1
34.2
54.9
42.1
23.6
25.1
13.3
57.0
39.6
21.7
27.7
17.1
32.0
31.1
38.1
34.4
23.0
39.0
15.0
22.7
24.4
40.2
21.5
34.7
33.2
38.4
44.5
31.0
51.1
45.1
41.5
39.6
39.4
47.0
33.1
50.7
31.7
P/B (x)
FY17 FY18E
2.7
2.4
3.5
3.3
2.9
2.5
0.8
0.7
4.3
3.6
1.0
0.9
3.0
2.0
3.4
9.3
5.2
1.1
8.8
23.9
1.3
7.4
9.7
8.8
4.9
3.3
1.8
7.2
8.0
-1.7
4.0
3.3
5.0
4.0
2.7
3.7
2.2
4.7
1.7
1.3
3.9
3.8
4.4
3.3
6.2
8.6
4.7
3.5
14.3
17.2
22.8
11.1
14.4
13.2
7.4
37.8
7.9
2.6
1.7
2.9
8.1
4.0
1.1
8.3
17.2
1.2
6.8
8.8
7.9
4.2
3.1
1.5
6.3
6.9
-1.9
3.6
2.8
4.5
3.6
2.6
3.6
2.1
4.2
1.6
1.2
3.4
3.5
3.7
3.1
5.3
7.2
4.3
3.2
13.0
14.1
21.5
9.5
12.1
10.2
7.2
36.4
7.8
FY17
24.0
6.5
19.4
17.9
17.4
19.9
11.7
11.7
16.9
12.7
20.6
1.6
18.0
76.4
6.2
21.2
12.4
18.2
21.2
12.2
10.2
9.3
19.8
NM
14.3
16.3
18.0
11.2
5.1
7.9
7.5
7.2
11.5
3.4
14.4
6.0
19.2
-3.2
1.8
20.2
11.6
9.7
28.5
36.9
50.4
28.4
35.8
24.6
22.2
65.6
23.5
ROE (%)
FY18E
25.9
12.0
23.2
17.0
18.1
19.1
16.2
14.7
17.8
12.6
16.5
2.7
21.7
53.4
3.4
20.7
16.8
18.6
19.2
12.6
11.6
11.0
18.6
-8.8
13.7
17.7
14.7
11.6
7.0
10.6
9.2
11.3
10.9
5.5
15.0
9.2
18.6
9.2
17.2
20.4
10.1
10.5
26.7
34.4
53.2
26.0
33.4
24.5
22.1
73.1
24.8
FY19E
26.9
14.2
21.4
16.8
18.2
19.1
18.1
16.3
17.9
15.8
16.8
3.4
30.1
49.8
4.2
23.5
18.0
20.7
20.9
13.4
12.6
13.7
19.9
-11.0
12.9
17.5
14.9
12.8
7.9
13.1
12.2
13.1
13.9
7.2
17.2
13.8
19.1
12.6
22.0
21.3
14.0
12.9
28.1
34.7
60.3
26.3
34.1
23.0
22.4
82.8
26.3
1,445
176
144
697
205
85
999
393
461
302
1,180
121
1,385
895
19
906
596
498
1,200
200
100
610
240
65
1,200
320
455
250
1,340
-
1,355
825
-
850
800
400
-17
14
-31
-13
17
-23
20
-18
-1
-17
14
-2
-8
-6
34
-20
19.7
6.9
2.1
12.9
4.7
4.1
26.5
5.7
9.6
11.9
42.3
7.1
17.8
20.6
0.6
30.8
28.9
15.5
22.4
7.2
3.6
17.8
5.5
2.3
29.2
7.2
10.9
12.8
47.1
9.1
24.3
22.6
0.9
32.7
34.9
15.6
31.6
8.1
4.7
26.6
6.6
4.5
36.0
8.5
13.8
16.4
54.0
11.2
33.3
28.2
1.0
34.0
39.8
17.6
265
1,710
940
2,604
1,069
212
988
459
669
160
123
17,450
4,077
308
1,622
1,205
3,162
1,384
219
1,287
553
823
178
145
21,052
4,936
16
-5
28
21
30
3
30
21
23
11
18
21
21
4.9
36.1
29.4
38.8
67.9
5.6
33.7
7.0
27.3
-1.6
0.3
384.4
96.1
7.0
49.8
40.9
66.7
71.2
9.3
40.4
11.4
31.1
4.6
3.7
454.7
91.5
8.2
65.0
58.9
87.1
102.6
12.9
53.5
19.2
37.5
7.0
5.6
575.2
138.8
1,134
3,854
1,066
306
1,113
1,025
5,504
1,164
293
1,200
4,450
1,335
315
1,265
930
4,500
1,285
280
6
15
25
3
14
-9
-18
10
-5
21.0
73.7
21.2
7.2
26.5
18.9
156.1
19.6
8.4
22.2
85.4
25.7
7.7
28.3
21.8
166.3
22.9
9.3
26.5
105.5
31.1
9.1
33.9
25.0
181.9
27.3
10.3
27 July 2017
39

Company
Jyothy Lab
Marico
Nestle
Page Inds
Parag Milk
Pidilite Ind.
P&G Hygiene
Prabhat Dairy
United Brew
United Spirits
Aggregate
Healthcare
Alembic Phar
Alkem Lab
Ajanta Pharma
Aurobindo
Biocon
Cadila
Cipla
Divis Lab
Dr Reddy’s
Fortis Health
Glenmark
Granules
GSK Pharma
IPCA Labs
Jubilant Life
Lupin
Sanofi India
Sun Pharma
Syngene Intl
Torrent Pharma
Aggregate
Logistics
Allcargo Logistics
Blue Dart
Concor
Gateway
Distriparks
Gati
Transport Corp.
Aggregate
Media
Dish TV
D B Corp
Den Net.
Ent.Network
Hind. Media
HT Media
Jagran Prak.
Music Broadcast
PVR
Siti Net.
Sun TV
Zee Ent.
Reco
Neutral
Neutral
Sell
Buy
Neutral
Neutral
Buy
Not Rated
Neutral
Neutral
CMP
(INR)
376
326
6,787
16,786
255
805
8,063
137
816
2,572
TP
% Upside
(INR) Downside
405
8
360
10
5,990
-12
20,195
20
240
-6
835
4
9,082
13
-
850
4
2,525
-2
FY17
11.2
6.3
118.0
238.7
3.6
16.7
144.9
3.5
8.7
26.7
EPS (INR)
FY18E FY19E
8.9
11.0
6.9
8.4
118.6 139.5
317.0 400.0
7.4
12.3
18.4
21.2
155.8 181.6
3.5
6.4
9.7
14.7
34.5
51.5
P/E (x)
FY17 FY18E
33.5
42.0
51.9
47.0
57.5
57.2
70.3
52.9
70.8
34.3
48.1
43.6
55.6
51.7
38.9
39.5
93.9
84.1
96.2
74.5
46.8
42.0
25.1
24.4
24.6
19.0
39.6
38.6
36.2
17.1
37.3
16.1
18.0
19.4
72.1
30.6
20.0
19.0
33.3
22.1
37.3
23.1
25.0
17.5
42.8
30.9
40.0
14.8
18.8
29.3
80.5
18.5
NM
80.4
10.8
11.7
16.3
56.5
65.9
NM
32.4
22.9
26.5
23.2
21.7
16.4
38.9
30.8
28.8
20.2
25.5
78.7
16.5
17.2
53.0
23.1
15.7
19.4
32.1
22.9
30.1
22.4
23.5
14.1
33.8
29.9
25.4
7.8
15.1
24.9
55.9
15.9
NM
66.6
9.9
10.9
14.2
36.2
46.8
NM
28.2
35.9
P/B (x)
FY17 FY18E
6.3
6.4
18.1 15.4
21.7 20.0
28.1 22.2
3.3
3.0
12.5 10.1
46.0 36.7
1.9
1.9
9.4
8.6
19.3 13.4
12.9 11.9
5.4
5.2
8.1
4.8
5.4
8.8
3.7
3.8
3.7
1.7
4.4
3.6
10.5
2.5
3.3
3.8
5.7
3.8
7.5
5.4
4.4
2.6
19.0
3.2
2.4
2.0
2.9
3.6
17.3
4.3
1.5
5.1
1.9
0.8
2.4
3.8
6.6
3.6
8.1
8.7
4.7
4.4
6.2
3.7
4.9
7.2
3.3
3.5
3.0
1.5
3.6
2.5
12.2
2.3
2.8
3.3
5.3
3.6
6.2
4.7
3.8
2.3
14.5
3.1
2.3
1.8
2.5
3.3
13.2
3.9
1.7
4.8
1.6
0.7
2.3
3.4
5.8
3.7
7.4
7.5
FY17
21.1
36.7
39.0
40.0
5.9
28.2
45.3
5.2
10.4
21.3
27.6
23.0
23.4
37.7
28.3
13.6
24.8
10.2
23.5
9.6
11.3
24.7
21.1
14.5
8.6
18.1
22.0
17.1
18.5
22.2
25.3
17.4
12.6
50.5
10.8
5.9
12.4
16.7
12.2
24.1
25.5
-12.0
6.7
19.0
7.1
17.6
11.2
10.4
-23.5
25.0
24.7
ROE (%)
FY18E
15.1
35.5
36.4
42.0
9.1
25.6
78.9
4.9
10.7
18.0
28.4
19.0
20.7
32.2
25.5
12.6
25.7
11.5
18.1
13.2
2.0
21.6
17.7
23.0
10.5
19.5
18.2
16.6
16.1
22.5
22.4
16.3
17.2
48.6
10.6
9.1
19.4
17.8
13.4
26.8
25.8
-5.3
7.4
17.3
6.9
16.4
9.9
13.2
-2.0
26.3
22.6
FY19E
18.4
38.1
39.0
42.8
13.4
24.0
74.0
8.5
14.6
20.3
29.4
20.4
21.0
29.9
22.3
15.6
27.2
12.8
19.4
14.9
5.3
20.9
18.8
30.9
12.7
19.6
19.4
18.1
17.9
20.7
24.2
17.4
17.8
46.8
11.8
11.1
25.4
18.6
15.0
327.5
26.6
0.7
10.5
17.3
6.4
17.2
12.6
17.7
6.9
30.2
24.5
Neutral
Neutral
Buy
Buy
Sell
Buy
Neutral
Neutral
Neutral
Buy
Neutral
Buy
Neutral
Neutral
Buy
Buy
Buy
Buy
Not Rated
Buy
543
1,845
1,435
748
404
548
575
679
2,711
166
707
140
2,479
493
739
1,124
4,294
578
485
1,273
510
1,900
2,028
850
300
510
500
680
2,600
240
800
200
2,500
480
905
1,475
4,820
650
-
1,450
-6
3
41
14
-26
-7
-13
0
-4
44
13
42
1
-3
22
31
12
12
14
21.6
75.7
58.4
39.3
10.2
14.2
15.9
39.7
72.6
10.3
39.3
7.2
34.4
16.1
37.0
59.2
129.1
26.1
13.0
55.2
20.5
79.7
66.1
45.7
10.4
17.8
20.0
33.6
106.2
2.1
42.9
8.2
46.8
21.3
47.1
57.9
133.6
25.2
16.1
56.8
25.5
95.0
79.6
50.0
14.4
23.2
25.0
40.0
143.0
6.1
51.7
11.5
54.9
28.5
56.7
72.0
160.6
30.8
18.0
71.4
Buy
Not Rated
Neutral
Buy
Not Rated
Not Rated
172
4,386
1,173
272
124
318
228
-
1,236
313
-
-
33
5
15
9.8
102.5
38.0
6.8
8.4
16.9
12.2
129.9
39.2
10.7
15.9
21.0
14.3
163.2
45.8
13.6
23.9
25.9
Buy
Buy
Neutral
Neutral
Buy
Neutral
Buy
Buy
Buy
Neutral
Neutral
Buy
79
377
82
919
281
87
175
363
1,353
26
805
529
105
450
90
928
350
90
225
469
1,588
32
860
630
32
19
10
1
25
4
29
29
17
24
7
19
1.0
20.4
-8.6
11.4
25.9
7.4
10.8
6.4
20.5
-1.8
24.9
23.1
1.4
23.7
-2.7
13.8
28.3
7.9
12.3
10.0
28.9
-0.1
28.5
14.7
4.0
27.6
0.3
21.2
33.6
8.1
14.0
14.3
45.1
0.5
35.9
18.9
27 July 2017
40

Company
Aggregate
Metals
Hindalco
Hind. Zinc
JSPL
JSW Steel
Nalco
NMDC
SAIL
Vedanta
Tata Steel
Aggregate
Oil & Gas
BPCL
GAIL
Gujarat Gas
Gujarat St. Pet.
HPCL
IOC
IGL
MRPL
Oil India
ONGC
PLNG
Reliance Ind.
Aggregate
Retail
Jubilant Food
Titan Co.
Aggregate
Technology
Cyient
HCL Tech.
Hexaware
Infosys
KPIT Tech
L&T Infotech
Mindtree
Mphasis
NIIT Tech
Persistent Sys
Tata Elxsi
TCS
Tech Mah
Wipro
Zensar Tech
Aggregate
Telecom
Bharti Airtel
Bharti Infratel
Idea Cellular
Tata Comm
Aggregate
Utiltites
Coal India
Reco
CMP
(INR)
TP
% Upside
EPS (INR)
(INR) Downside FY17 FY18E FY19E
P/E (x)
FY17 FY18E
40.8
31.1
13.7
14.5
NM
14.8
19.2
12.4
NM
18.6
14.9
19.3
9.8
16.6
37.4
21.0
9.1
8.7
26.7
8.2
14.6
10.0
18.3
16.8
12.3
128.1
59.5
64.7
17.5
14.9
18.7
15.8
10.7
13.9
19.3
15.3
13.7
17.0
29.8
19.1
12.6
17.1
15.6
17.2
38.4
27.9
NM
25.0
40.2
17.4
10.1
12.6
NM
11.6
18.8
10.2
NM
11.3
11.4
14.8
12.9
14.3
22.7
16.7
12.5
10.4
24.3
12.8
10.1
9.4
24.2
14.0
12.4
86.6
52.3
55.6
15.1
14.5
16.7
15.6
12.1
12.8
16.7
14.0
12.4
14.8
24.7
19.1
12.6
16.0
15.6
17.2
106.1
23.1
NM
78.0
182.7
14.8
P/B (x)
FY17 FY18E
5.8
5.3
1.7
3.9
0.5
2.3
1.3
1.7
0.7
1.7
1.7
1.6
3.0
1.7
6.4
2.3
2.8
1.7
5.4
2.1
0.8
1.0
3.8
1.7
1.6
10.5
11.3
11.1
2.8
3.7
4.6
3.3
1.6
4.8
3.1
2.0
1.8
2.6
9.4
5.7
2.1
2.7
2.5
3.9
2.5
4.9
1.4
12.2
2.8
6.6
1.4
4.2
0.5
2.0
1.3
1.6
0.8
1.6
1.6
1.5
2.6
1.6
5.2
2.1
2.4
1.6
4.6
1.9
0.7
0.9
3.5
1.5
1.5
9.6
10.3
10.2
2.5
3.7
4.0
3.0
1.5
3.8
3.1
2.3
1.7
2.5
7.5
6.1
1.9
2.7
2.2
3.9
2.5
4.3
1.6
10.5
2.8
6.6
ROE (%)
FY17 FY18E FY19E
14.2
17.0
22.1
14.0
24.4
-7.9
17.3
7.2
12.4
-6.7
9.7
15.7
8.2
32.4
9.6
17.8
11.6
32.4
21.2
21.0
31.4
5.7
10.1
23.2
11.6
13.3
8.2
20.6
17.2
16.2
27.5
26.5
22.0
14.3
40.4
16.8
13.2
13.7
17.0
37.1
32.6
18.4
16.9
17.2
22.9
6.7
16.2
-1.6
132.2
6.9
37.8
15.2
32.0
-5.4
18.7
7.0
15.0
-12.6
14.8
14.3
10.4
21.7
11.3
25.3
13.1
20.6
15.8
20.6
15.5
7.5
9.9
15.1
12.3
12.1
11.1
20.6
18.4
16.6
25.2
25.3
20.0
13.0
33.0
17.3
14.2
14.4
17.9
33.7
31.1
16.0
16.1
15.0
22.9
2.4
19.8
-15.3
14.5
1.5
44.5
15.4
35.1
0.8
19.0
7.5
15.5
-5.5
18.4
16.8
13.3
22.3
11.8
28.0
14.0
20.0
15.8
19.6
17.0
7.8
10.8
26.4
12.3
12.6
14.0
21.6
19.2
17.3
25.8
23.5
19.8
14.2
29.4
20.1
16.1
15.4
20.7
32.3
33.5
16.9
16.1
17.9
22.3
3.7
19.4
-20.8
33.6
2.8
47.0
Buy
Sell
Buy
Buy
Neutral
Buy
Sell
Buy
Neutral
221
285
152
219
71
124
64
281
565
308
246
190
281
70
180
37
316
583
39
-14
25
28
-1
45
-42
13
3
16.2
19.7
-20.9
14.8
3.7
10.0
-6.2
15.1
37.9
21.8
22.6
-17.2
19.0
3.8
12.1
-10.6
24.8
49.6
26.1
26.9
2.4
22.6
4.2
12.2
-4.2
33.1
65.6
Neutral
Sell
Sell
Neutral
Buy
Neutral
Neutral
Sell
Buy
Buy
Buy
Neutral
471
376
765
185
370
374
1,136
121
282
164
208
1,622
511
340
697
168
420
459
1,070
113
305
195
259
1,499
9
-10
-9
-9
13
23
-6
-7
8
19
25
-8
48.3
22.6
20.4
8.8
40.7
43.0
42.5
14.8
19.3
16.4
11.4
96.7
36.7
26.3
33.7
11.0
29.5
36.0
46.8
9.4
27.9
17.4
8.6
115.5
43.5
29.8
46.5
13.1
32.6
40.0
51.9
11.7
30.1
19.7
17.6
128.1
Sell
Neutral
1,282
537
850
545
-34
1
10.0
9.0
14.8
10.3
20.7
12.1
Buy
Buy
Neutral
Buy
Neutral
Buy
Sell
Neutral
Neutral
Buy
Buy
Neutral
Buy
Neutral
Buy
535
891
256
994
128
772
481
595
522
640
1,679
2,555
389
290
811
600
960
235
1,200
140
880
450
600
540
750
1,607
2,350
465
270
950
12
8
-8
21
10
14
-6
1
3
17
-4
-8
20
-7
17
30.6
59.8
13.7
62.9
11.9
55.5
24.9
38.9
38.0
37.7
56.3
133.4
30.9
16.9
52.1
35.4
61.4
15.4
63.7
10.6
60.2
28.7
42.3
42.3
43.3
68.0
133.6
31.0
18.1
51.9
41.9
66.7
16.7
69.5
13.1
68.0
32.9
46.2
48.7
52.0
80.4
147.7
36.2
19.1
70.0
Buy
Buy
Buy
Buy
426
414
95
680
435
480
110
775
2
16
16
14
11.1
14.9
-1.1
27.2
4.0
17.9
-9.7
8.7
6.5
20.4
-11.2
26.1
Buy
260
315
21
14.9
17.6
18.6
27 July 2017
41

Company
CESC
JSW Energy
NTPC
Power Grid
Tata Power
Aggregate
Others
Arvind
Avenue
Supermarts
Bata India
Castrol India
Century Ply.
Coromandel Intl
Delta Corp
Dynamatic Tech
Eveready Inds.
Interglobe
Indo Count
Info Edge
Inox Leisure
Jain Irrigation
Just Dial
Kaveri Seed
Kitex Garm.
Manpasand
MCX
Monsanto
Navneet
Education
PI Inds.
Piramal Enterp.
SRF
S H Kelkar
Symphony
TTK Prestige
V-Guard
Wonderla
Reco
Buy
Buy
Buy
Buy
Sell
CMP
(INR)
897
68
166
217
82
TP
% Upside
(INR) Downside
1,140
27
85
25
198
19
242
12
68
-17
FY17
51.9
3.9
13.0
14.2
5.2
EPS (INR)
FY18E FY19E
78.6
86.0
3.2
3.1
13.4
16.2
17.6
20.6
6.4
6.7
P/E (x)
FY17 FY18E
17.3
11.4
17.6
21.6
12.8
12.4
15.2
12.3
15.9
12.9
15.0
13.2
29.9
118.7
43.2
29.9
34.4
26.6
55.7
35.2
25.1
26.8
11.9
62.8
79.3
19.4
21.2
34.7
15.7
62.5
46.0
32.0
21.8
23.3
40.0
18.2
38.0
61.2
48.3
53.0
50.5
29.6
71.6
37.2
28.2
30.4
20.3
29.9
21.1
22.4
21.3
11.8
45.2
32.9
14.2
20.0
21.1
13.1
39.2
40.8
26.3
17.9
23.2
27.9
18.1
32.1
41.2
46.3
42.3
29.6
P/B (x)
FY17 FY18E
1.7
1.5
1.1
1.1
1.4
1.3
2.3
2.0
1.9
1.7
2.3
2.1
2.7
14.8
5.7
33.9
9.3
4.5
4.3
4.9
8.1
22.0
3.6
6.0
4.6
1.7
2.8
4.5
4.2
3.9
4.3
9.0
5.4
6.6
3.8
2.9
4.9
22.7
8.7
12.6
4.6
2.5
12.9
5.1
30.3
7.7
3.9
2.9
4.0
6.5
19.8
2.7
5.5
4.1
1.6
2.5
4.8
3.4
3.7
4.1
8.1
4.6
5.4
3.5
2.6
4.4
20.0
7.9
10.3
4.1
FY17
10.5
6.3
11.5
16.2
11.2
15.2
10.3
17.9
13.9
115.2
31.1
17.5
8.1
15.1
37.7
86.2
34.8
10.2
5.9
8.6
14.8
13.6
29.8
7.3
10.2
31.6
26.8
32.8
9.8
16.6
13.7
43.3
19.5
27.4
9.5
ROE (%)
FY18E
14.4
4.9
10.9
17.5
13.9
16.1
8.8
19.3
14.4
113.3
27.7
20.6
12.1
20.7
32.3
98.0
26.4
12.7
12.5
11.7
13.4
21.6
28.6
8.5
10.2
32.5
27.8
25.4
13.0
14.7
14.5
51.6
18.0
26.9
14.8
FY19E
13.9
4.8
12.3
17.8
12.1
16.8
11.8
23.0
15.8
106.1
29.6
21.6
11.5
24.3
31.6
136.2
23.5
13.1
16.2
14.8
13.7
26.0
27.6
13.5
14.5
34.5
28.2
23.8
16.4
16.7
15.6
54.5
20.7
28.8
17.5
Neutral
Neutral
Under Review
Buy
Neutral
Under Review
Buy
Buy
Buy
Neutral
Buy
Buy
Sell
Under Review
Neutral
Buy
Buy
Buy
Buy
Buy
Buy
Buy
Buy
Buy
Buy
Sell
Neutral
Neutral
Buy
370
911
584
408
299
443
170
2,382
323
1,233
155
984
264
108
370
662
291
794
1,142
2,760
169
777
2,901
1,562
276
1,448
6,384
189
353
359
882
-
527
323
-
215
3,334
368
1,283
200
1,130
240
-
465
755
394
927
1,300
3,295
226
952
3,044
1,816
287
1,288
5,281
167
393
-3
-3
29
8
26
40
14
4
29
15
-9
26
14
35
17
14
19
34
23
5
16
4
-11
-17
-12
11
12.4
7.7
13.5
13.6
8.7
16.6
3.1
67.6
12.9
46.0
13.0
15.7
3.3
5.5
17.5
19.1
18.6
12.7
24.8
86.2
7.8
33.4
72.6
85.9
7.2
23.7
132.1
3.6
7.0
12.5
12.7
15.7
14.4
9.8
21.8
5.7
112.9
14.4
57.9
13.2
21.8
8.0
7.6
18.5
31.3
22.1
20.3
28.0
105.1
9.4
33.4
104.1
86.3
8.6
35.1
137.8
4.5
11.9
18.1
17.6
19.4
15.0
12.9
26.1
7.2
166.7
17.5
91.6
15.4
24.7
12.0
10.0
21.1
37.7
26.2
30.9
42.2
126.7
11.3
38.1
144.6
109.2
10.3
42.9
176.1
6.0
16.0
27 July 2017
42

MOSL Universe stock performance
Company
Automobiles
Amara Raja
Ashok Ley.
Bajaj Auto
Bharat Forge
Bosch
CEAT
Eicher Mot.
Endurance Tech.
Escorts
Exide Ind
Hero Moto
M&M
Mahindra CIE
Maruti Suzuki
Tata Motors
TVS Motor
Banks - Private
Axis Bank
DCB Bank
Equitas Hold.
Federal Bank
HDFC Bank
ICICI Bank
IDFC Bank
IndusInd
J&K Bank
Kotak Mah. Bk
RBL Bank
South Indian
Yes Bank
Banks - PSU
BOB
BOI
Canara
IDBI Bk
Indian Bk
OBC
PNB
SBI
Union Bk
NBFCs
Bajaj Fin.
Bharat Fin.
Cholaman.Inv.&Fn
Dewan Hsg.
GRUH Fin.
HDFC
Indiabulls Hsg
L&T Fin.Holdings
LIC Hsg Fin
Manappuram
M&M Fin.
Muthoot Fin
PFC
Repco Home
REC
STF
Shriram City Union
1 Day (%)
0.1
1.2
-0.2
1.6
0.2
-0.2
2.1
0.0
0.7
0.1
0.3
1.7
0.2
0.8
0.1
0.1
-2.9
0.3
0.3
-3.6
0.6
2.1
-0.2
2.4
-2.8
-0.1
-0.4
3.2
6.1
-1.0
-2.1
0.0
0.8
-2.0
-3.3
-2.5
-0.2
-1.0
3.9
-0.4
-0.8
-0.5
-0.8
0.1
-1.0
3.7
0.7
-1.2
-0.8
2.3
-1.6
-0.4
-1.1
-1.4
-1.1
1M (%)
0.9
15.1
0.5
2.6
1.7
3.8
6.6
4.0
-3.9
0.2
1.6
2.7
9.3
4.7
3.1
6.4
4.8
-0.9
10.4
-0.1
4.2
6.4
6.0
6.0
-4.1
0.1
4.4
8.5
19.2
1.6
19.8
5.2
10.7
8.9
5.6
10.4
2.4
8.8
20.3
11.2
7.7
4.5
5.1
-1.1
7.4
14.8
-2.1
12.5
19.7
7.0
0.5
-7.3
-0.1
1.8
-5.8
12M (%)
-4.9
12.3
6.3
54.5
0.7
116.4
43.9
160.7
22.5
15.8
-2.6
41.6
69.0
-9.2
95.9
-4.5
99.1
-13.1
78.4
41.3
30.2
14.5
37.0
28.2
31.6
58.0
42.7
5.8
45.2
42.5
-15.4
107.0
31.5
22.7
30.6
23.0
71.1
-10.2
10.0
107.0
58.8
19.4
55.3
105.5
43.7
37.8
26.0
66.2
13.5
-5.8
64.8
-18.9
20.8
Company
Capital Goods
ABB
Bharat Elec.
BHEL
Blue Star
CG Cons. Elec.
CG Power & Inds Sol.
Cummins
GE T&D
Havells
K E C Intl
L&T
Pennar Eng.
Siemens
Solar Ind
Suzlon Energy
Thermax
Va Tech Wab.
Voltas
Cement
Ambuja Cem.
ACC
Birla Corp.
Dalmia Bharat
Grasim Inds.
India Cem
J K Cements
JK Lakshmi Ce
Ramco Cem
Orient Cem
Prism Cem
Shree Cem
Ultratech
Consumer
Asian Paints
Britannia
Colgate
Dabur
Emami
Godrej Cons.
GSK Cons.
HUL
ITC
Jyothy Lab
Marico
Nestle
Page Inds
Parag Milk
Pidilite Ind.
P&G Hygiene
Prabhat Dairy
United Brew
United Spirits
Healthcare
Alembic Phar
Alkem Lab
Ajanta Pharma
Aurobindo
Biocon
Cadila
1 Day (%)
0.9
1.9
-1.0
-1.1
0.5
-0.1
-0.6
19.9
0.7
2.4
0.7
0.5
1.4
0.1
0.8
-0.4
2.0
-1.2
-1.0
-0.9
-1.6
0.5
-0.6
0.8
1.6
-1.9
0.2
-0.2
1.9
-0.7
-0.7
-1.6
-0.1
-0.3
-0.3
0.7
2.8
0.3
1.3
0.7
-0.9
-1.6
-0.4
0.4
-0.2
-2.7
-0.7
0.8
0.7
-0.9
0.2
1.3
-1.1
-0.4
-0.1
0.6
1M (%)
0.3
6.6
6.8
13.2
-6.3
4.3
10.3
14.8
-0.6
23.4
2.7
-10.4
4.2
10.2
4.1
-3.3
-15.0
9.6
9.0
4.5
6.9
5.2
9.3
5.3
2.3
-6.2
-1.9
11.7
3.5
3.1
1.9
-1.8
5.6
-3.7
6.0
1.8
7.2
2.3
6.2
-5.6
2.7
4.8
2.6
2.8
20.3
-2.8
0.1
4.1
4.6
14.5
6.8
1.1
-5.1
11.4
22.4
4.3
12M (%)
12.1
43.1
-2.2
46.8
33.1
16.8
12.1
9.9
24.3
113.8
11.2
-35.3
4.3
33.1
8.8
1.6
2.9
45.4
-1.9
2.3
74.5
87.4
31.8
84.6
41.3
9.0
20.2
-4.5
16.3
9.2
12.3
6.9
36.9
10.1
0.9
-1.6
28.9
-12.3
29.0
16.6
29.9
13.9
-5.0
26.0
-20.9
10.8
26.4
44.2
4.4
4.5
-8.6
21.2
-15.6
-4.7
50.3
46.0
27 July 2017
43

MOSL Universe stock performance
Company
Cipla
Divis Lab
Dr Reddy’s
Fortis Health
Glenmark
Granules
GSK Pharma
IPCA Labs
Jubilant Life
Lupin
Sanofi India
Sun Pharma
Syngene Intl
Torrent Pharma
Logistics
Allcargo Logistics
Blue Dart
Concor
Gateway Distriparks
Gati
Transport Corp.
Media
Dish TV
D B Corp
Den Net.
Ent.Network
Hind. Media
HT Media
Jagran Prak.
Music Broadcast
PVR
Siti Net.
Sun TV
Zee Ent.
Metals
Hindalco
Hind. Zinc
JSPL
JSW Steel
Nalco
NMDC
SAIL
Vedanta
Tata Steel
Oil & Gas
BPCL
GAIL
Gujarat Gas
Gujarat St. Pet.
HPCL
IOC
IGL
MRPL
Oil India
ONGC
PLNG
Reliance Ind.
Retail
Jubilant Food
Titan Co.
1 Day (%)
1.8
0.5
0.8
-1.5
0.7
0.1
-1.3
2.6
0.4
0.4
0.8
2.1
3.0
0.6
-1.3
-0.1
0.0
2.0
-0.4
-0.8
0.0
2.5
3.4
-0.8
-2.4
-2.0
1.1
-1.0
-2.2
0.6
-1.2
-1.8
0.7
0.9
8.4
1.9
-0.2
2.1
0.6
2.3
2.2
1.0
0.7
0.2
1.3
-0.8
-0.1
0.8
-1.3
0.9
0.2
0.8
1.2
-1.0
0.2
1M (%)
6.3
6.3
2.6
-3.6
12.6
3.6
0.6
4.0
9.9
6.0
3.4
6.3
5.7
8.1
-0.9
3.6
0.7
5.6
-3.8
8.0
7.5
-1.3
1.1
-0.2
2.5
4.2
-2.8
1.9
-10.4
-10.7
-0.6
4.0
17.2
13.4
27.9
12.0
14.5
15.4
11.3
18.6
11.4
12.1
6.1
0.7
16.3
9.2
-2.5
6.3
2.8
2.4
3.8
-5.2
13.0
39.2
4.9
12M (%)
9.9
-42.7
-18.4
-3.2
-16.2
0.2
-26.8
1.9
125.5
-33.9
-6.3
-27.7
16.0
-12.9
-9.8
-25.8
1.4
2.0
-28.1
50.1
-19.5
-6.5
-6.7
30.9
2.5
8.7
-2.2
24.2
-30.9
87.6
11.5
67.9
40.5
88.6
32.1
50.3
24.1
31.5
65.5
53.8
20.2
30.0
39.0
42.5
37.7
40.3
83.3
40.4
0.8
9.8
40.2
58.5
7.3
29.9
Company
Technology
Cyient
HCL Tech.
Hexaware
Infosys
KPIT Tech
L&T Infotech
Mindtree
Mphasis
NIIT Tech
Persistent Sys
Tata Elxsi
TCS
Tech Mah
Wipro
Zensar Tech
Telecom
Bharti Airtel
Bharti Infratel
Idea Cellular
Tata Comm
Utiltites
Coal India
CESC
JSW Energy
NTPC
Power Grid
Tata Power
Others
Arvind
Avenue Super.
Bata India
Castrol India
Century Ply.
Coromandel Intl
Delta Corp
Dynamatic Tech
Eveready Inds.
Interglobe
Indo Count
Info Edge
Inox Leisure
Jain Irrigation
Just Dial
Kaveri Seed
Kitex Garm.
Manpasand
MCX
Monsanto
Navneet Educat.
PI Inds.
Piramal Enterp.
SRF
S H Kelkar
Symphony
TTK Prestige
V-Guard
Wonderla
1 Day (%)
0.0
-0.3
3.7
0.0
3.2
0.1
-0.1
3.1
-1.1
-0.8
1.0
-0.6
-0.6
0.0
0.6
-0.3
-0.6
-3.2
1.2
0.6
0.2
2.3
1.2
0.2
-0.5
0.7
-1.6
0.0
-1.1
4.1
-0.8
0.8
-0.7
-1.3
-1.0
1.1
-1.0
-0.8
-1.1
-3.2
1.2
7.1
1.2
-1.2
1.4
1.0
3.0
-0.4
2.9
-0.4
-1.4
-0.1
4.6
-0.9
1M (%)
4.1
4.8
3.8
5.3
6.6
-4.3
-9.6
0.4
-7.0
-3.1
4.5
8.2
2.2
12.9
-6.4
16.5
11.2
19.3
-6.0
6.0
3.2
7.5
5.1
5.6
1.2
0.3
13.9
12.1
0.0
-0.4
4.1
11.9
-0.1
-7.8
-0.7
-11.6
-0.4
-3.2
2.2
-5.5
4.4
3.6
1.9
5.6
3.3
-5.0
-4.0
2.8
-1.8
1.8
8.9
-4.6
5.5
-5.2
12M (%)
10.5
19.7
13.6
-8.7
-4.3
11.4
-15.0
11.1
11.8
-7.1
1.3
0.3
-22.5
6.0
-19.9
15.3
14.2
-12.1
48.0
-20.8
46.7
-14.5
5.0
26.5
15.2
21.5
2.4
-0.8
28.1
91.2
88.0
-7.2
22.1
30.9
-10.5
18.9
8.1
54.0
-30.7
76.9
-16.8
16.4
11.0
15.0
76.8
6.8
82.9
12.4
14.1
17.4
36.3
70.8
-13.6
27 July 2017
44

THEMATIC/STRATEGY RESEARCH GALLERY

REPORT GALLERY
RECENT INITIATING COVERAGE REPORTS
Rs

DIFFERENTIATED PRODUCT GALLERY

Disclosures:
The following Disclosures are being made in compliance with the SEBI Research Analyst Regulations 2014 (herein after referred to as the Regulations).
Motilal Oswal Securities Ltd. (MOSL) is a SEBI Registered Research Analyst having registration no. INH000000412. MOSL, the Research Entity (RE) as defined in the Regulations, is engaged in the business of providing Stock
broking services, Investment Advisory Services, Depository participant services & distribution of various financial products. MOSL is a subsidiary company of Motilal Oswal Financial Service Ltd. (MOFSL). MOFSL is a listed
public company, the details in respect of which are available on
www.motilaloswal.com.
MOSL is registered with the Securities & Exchange Board of India (SEBI) and is a registered Trading Member with National Stock
Exchange of India Ltd. (NSE) and Bombay Stock Exchange Limited (BSE), Metropolitan Stock Exchange Of India Ltd. (MSE) for its stock broking activities & is Depository participant with Central Depository Services Limited
(CDSL) & National Securities Depository Limited (NSDL) and is member of Association of Mutual Funds of India (AMFI) for distribution of financial products. Details of associate entities of Motilal Oswal Securities Limited are
available on the website at
http://onlinereports.motilaloswal.com/Dormant/documents/Associate%20Details.pdf
Pending Regulatory Enquiries against Motilal Oswal Securities Limited by SEBI:
SEBI pursuant to a complaint from client Shri C.R. Mohanraj alleging unauthorized trading, issued a letter dated 29th April 2014 to MOSL notifying appointment of an Adjudicating Officer as per SEBI regulations to hold
inquiry and adjudge violation of SEBI Regulations; MOSL requested SEBI to provide all documents, records, investigation report relied upon by SEBI which were referred in Show Cause Notice and also sought personal
hearing. The matter is currently pending.
MOSL, it’s associates, Research Analyst or their relative may have any financial interest in the subject company. MOSL and/or its associates and/or Research Analyst may have beneficial ownership of 1% or more securities in
the subject company at the end of the month immediately preceding the date of publication of the Research Report.
MOSL and its associate company(ies), their directors and Research Analyst and their relatives may; (a)
from time to time, have a long or short position in, act as principal in, and buy or sell the securities or derivatives thereof of companies mentioned herein. (b) be engaged in any other transaction involving such securities and
earn brokerage or other compensation or act as a market maker in the financial instruments of the company(ies) discussed herein or act as an advisor or lender/borrower to such company(ies) or may have any other
potential conflict of interests with respect to any recommendation and other related information and opinions.; however the same shall have no bearing whatsoever on the specific recommendations made by the analyst(s),
as the recommendations made by the analyst(s) are completely independent of the views of the associates of MOSL even though there might exist an inherent conflict of interest in some of the stocks mentioned in the
research report.
Research Analyst may have served as director/officer, etc. in the subject company in the last 12 month period. MOSL and/or its associates may have received any compensation from the subject company in
the past 12 months.
In the last 12 months period ending on the last day of the month immediately preceding the date of publication of this research report, MOSL or any of its associates may have:
a)
managed or co-managed public offering of securities from subject company of this research report,
b)
received compensation for investment banking or merchant banking or brokerage services from subject company of this research report,
c)
received compensation for products or services other than investment banking or merchant banking or brokerage services from the subject company of this research report.
d)
Subject Company may have been a client of MOSL or its associates during twelve months preceding the date of distribution of the research report.
MOSL and it’s associates have not received any compensation or other benefits from the subject company or third party in connection with the research report. To enhance transparency, MOSL has incorporated a Disclosure
of Interest Statement in this document. This should, however, not be treated as endorsement of the views expressed in the report. MOSL and / or its affiliates do and seek to do business including investment banking with
companies covered in its research reports. As a result, the recipients of this report should be aware that MOSL may have a potential conflict of interest that may affect the objectivity of this report. Compensation of Research
Analysts is not based on any specific merchant banking, investment banking or brokerage service transactions.
Terms & Conditions:
This report has been prepared by MOSL and is meant for sole use by the recipient and not for circulation. The report and information contained herein is strictly confidential and may not be altered in any way, transmitted to,
copied or distributed, in part or in whole, to any other person or to the media or reproduced in any form, without prior written consent of MOSL. The report is based on the facts, figures and information that are considered
true, correct, reliable and accurate. The intent of this report is not recommendatory in nature. The information is obtained from publicly available media or other sources believed to be reliable. Such information has not
been independently verified and no guaranty, representation of warranty, express or implied, is made as to its accuracy, completeness or correctness. All such information and opinions are subject to change without notice.
The report is prepared solely for informational purpose and does not constitute an offer document or solicitation of offer to buy or sell or subscribe for securities or other financial instruments for the clients. Though
disseminated to all the customers simultaneously, not all customers may receive this report at the same time. MOSL will not treat recipients as customers by virtue of their receiving this report.
Analyst Certification
The views expressed in this research report accurately reflect the personal views of the analyst(s) about the subject securities or issues, and no part of the compensation of the research analyst(s) was, is, or will be directly or
indirectly related to the specific recommendations and views expressed by research analyst(s) in this report.
India Strategy | Index Reconstitution
Disclosure of Interest Statement
Analyst ownership of the stock
Companies where there is interest
No
A graph of daily closing prices of securities is available at
www.nseindia.com, www.bseindia.com.
Research Analyst views on Subject Company may vary based on Fundamental research and Technical Research. Proprietary
trading desk of MOSL or its associates maintains arm’s length distance with Research Team as all the activities are segregated from MOSL research activity and therefore it can have an independent view with regards to
subject company for which Research Team have expressed their views.
Regional Disclosures (outside India)
This report is not directed or intended for distribution to or use by any person or entity resident in a state, country or any jurisdiction, where such distribution, publication, availability or use would be contrary to law,
regulation or which would subject MOSL & its group companies to registration or licensing requirements within such jurisdictions.
For Hong Kong:
This report is distributed in Hong Kong by Motilal Oswal capital Markets (Hong Kong) Private Limited, a licensed corporation (CE AYY-301) licensed and regulated by the Hong Kong Securities and Futures Commission (SFC)
pursuant to the Securities and Futures Ordinance (Chapter 571 of the Laws of Hong Kong) “SFO”. As per SEBI (Research Analyst Regulations) 2014 Motilal Oswal Securities (SEBI Reg No. INH000000412) has an agreement with
Motilal Oswal capital Markets (Hong Kong) Private Limited for distribution of research report in Hong Kong. This report is intended for distribution only to “Professional Investors” as defined in Part I of Schedule 1 to SFO. Any
investment or investment activity to which this document relates is only available to professional investor and will be engaged only with professional investors.” Nothing here is an offer or solicitation of these securities,
products and services in any jurisdiction where their offer or sale is not qualified or exempt from registration. The Indian Analyst(s) who compile this report is/are not located in Hong Kong & are not conducting Research
Analysis in Hong Kong.
For U.S.
Motilal Oswal Securities Limited (MOSL) is not a registered broker - dealer under the U.S. Securities Exchange Act of 1934, as amended (the"1934 act") and under applicable state laws in the United States. In addition MOSL is
not a registered investment adviser under the U.S. Investment Advisers Act of 1940, as amended (the "Advisers Act" and together with the 1934 Act, the "Acts), and under applicable state laws in the United States.
Accordingly, in the absence of specific exemption under the Acts, any brokerage and investment services provided by MOSL, including the products and services described herein are not available to or intended for U.S.
persons. This report is intended for distribution only to "Major Institutional Investors" as defined by Rule 15a-6(b)(4) of the Exchange Act and interpretations thereof by SEC (henceforth referred to as "major institutional
investors"). This document must not be acted on or relied on by persons who are not major institutional investors. Any investment or investment activity to which this document relates is only available to major institutional
investors and will be engaged in only with major institutional investors. In reliance on the exemption from registration provided by Rule 15a-6 of the U.S. Securities Exchange Act of 1934, as amended (the "Exchange Act") and
interpretations thereof by the U.S. Securities and Exchange Commission ("SEC") in order to conduct business with Institutional Investors based in the U.S., MOSL has entered into a chaperoning agreement with a U.S.
registered broker-dealer, Motilal Oswal Securities International Private Limited. ("MOSIPL"). Any business interaction pursuant to this report will have to be executed within the provisions of this chaperoning agreement.
The Research Analysts contributing to the report may not be registered /qualified as research analyst with FINRA. Such research analyst may not be associated persons of the U.S. registered broker-dealer, MOSIPL, and
therefore, may not be subject to NASD rule 2711 and NYSE Rule 472 restrictions on communication with a subject company, public appearances and trading securities held by a research analyst account.
For Singapore
Motilal Oswal Capital Markets Singapore Pte Limited is acting as an exempt financial advisor under section 23(1)(f) of the Financial Advisers Act(FAA) read with regulation 17(1)(d) of the Financial Advisors Regulations and is a
subsidiary of Motilal Oswal Securities Limited in India. This research is distributed in Singapore by Motilal Oswal Capital Markets Singapore Pte Limited and it is only directed in Singapore to accredited investors, as defined in
the Financial Advisers Regulations and the Securities and Futures Act (Chapter 289), as amended from time to time. In respect of any matter arising from or in connection with the research you could contact the following
representatives of Motilal Oswal Capital Markets Singapore Pte Limited:
Disclaimer:
The report and information contained herein is strictly confidential and meant solely for the selected recipient and may not be altered in any way, transmitted to, copied or distributed, in part or in whole, to any other person
or to the media or reproduced in any form, without prior written consent. This report and information herein is solely for informational purpose and may not be used or considered as an offer document or solicitation of
offer to buy or sell or subscribe for securities or other financial instruments. Nothing in this report constitutes investment, legal, accounting and tax advice or a representation that any investment or strategy is suitable or
appropriate to your specific circumstances. The securities discussed and opinions expressed in this report may not be suitable for all investors, who must make their own investment decisions, based on their own investment
objectives, financial positions and needs of specific recipient. This may not be taken in substitution for the exercise of independent judgment by any recipient. Each recipient of this document should make such investigations
as it deems necessary to arrive at an independent evaluation of an investment in the securities of companies referred to in this document (including the merits and risks involved), and should consult its own advisors to
determine the merits and risks of such an investment. The investment discussed or views expressed may not be suitable for all investors. Certain transactions -including those involving futures, options, another derivative
products as well as non-investment grade securities - involve substantial risk and are not suitable for all investors. No representation or warranty, express or implied, is made as to the accuracy, completeness or fairness of
the information and opinions contained in this document. The Disclosures of Interest Statement incorporated in this document is provided solely to enhance the transparency and should not be treated as endorsement of the
views expressed in the report. This information is subject to change without any prior notice. The Company reserves the right to make modifications and alternations to this statement as may be required from time to time
without any prior approval. MOSL, its associates, their directors and the employees may from time to time, effect or have effected an own account transaction in, or deal as principal or agent in or for the securities
mentioned in this document. They may perform or seek to perform investment banking or other services for, or solicit investment banking or other business from, any company referred to in this report. Each of these entities
functions as a separate, distinct and independent of each other. The recipient should take this into account before interpreting the document. This report has been prepared on the basis of information that is already
available in publicly accessible media or developed through analysis of MOSL. The views expressed are those of the analyst, and the Company may or may not subscribe to all the views expressed therein. This document is
being supplied to you solely for your information and may not be reproduced, redistributed or passed on, directly or indirectly, to any other person or published, copied, in whole or in part, for any purpose. This report is not
directed or intended for distribution to, or use by, any person or entity who is a citizen or resident of or located in any locality, state, country or other jurisdiction, where such distribution, publication, availability or use would
be contrary to law, regulation or which would subject MOSL to any registration or licensing requirement within such jurisdiction. The securities described herein may or may not be eligible for sale in all jurisdictions or to
certain category of investors. Persons in whose possession this document may come are required to inform themselves of and to observe such restriction. Neither the Firm, not its directors, employees, agents or
representatives shall be liable for any damages whether direct or indirect, incidental, special or consequential including lost revenue or lost profits that may arise from or in connection with the use of the information.
The
person accessing this information specifically agrees to exempt MOSL or any of its affiliates or employees from, any and all responsibility/liability arising from such misuse and agrees not to hold MOSL or any of its affiliates or
employees responsible for any such misuse and further agrees to hold MOSL or any of its affiliates or employees free and harmless from all losses, costs, damages, expenses that may be suffered by the person accessing this
information due to any errors and delays.
Registered Office Address: Motilal Oswal Tower, Rahimtullah Sayani Road, Opposite Parel ST Depot, Prabhadevi, Mumbai-400025; Tel No.: 022-3980 4263; www.motilaloswal.com. Correspondence Address: Palm Spring
Centre, 2nd Floor, Palm Court Complex, New Link Road, Malad (West), Mumbai- 400 064. Tel No: 022 3080 1000. Compliance Officer: Neeraj Agarwal, Email Id:
na@motilaloswal.com,
Contact No.:022-30801085.
Registration details of group entities.: MOSL: NSE (Cash): INB231041238; NSE (F&O): INF231041238; NSE (CD): INE231041238; BSE (Cash): INB011041257; BSE(F&O): INF011041257; BSE(CD); MSE(Cash): INB261041231;
MSE(F&O): INF261041231; MSE(CD): INE261041231; CDSL: IN-DP-16-2015; NSDL: IN-DP-NSDL-152-2000; Research Analyst: INH000000412. AMFI: ARN 17397. Investment Adviser: INA000007100. Motilal Oswal Asset
Management Company Ltd. (MOAMC): PMS (Registration No.: INP000000670) offers PMS and Mutual Funds products. Motilal Oswal Wealth Management Ltd. (MOWML): PMS (Registration No.: INP000004409) offers wealth
26 July
solutions.
10
management
2017
*Motilal Oswal Securities Ltd. is a distributor of Mutual Funds, PMS, Fixed Deposit, Bond, NCDs, Insurance and IPO products. * Motilal Oswal Commodities Broker Pvt. Ltd. offers Commodities
Products. * Motilal Oswal Real Estate Investment Advisors II Pvt. Ltd. offers Real Estate products. * Motilal Oswal Private Equity Investment Advisors Pvt. Ltd. offers Private Equity products