26 July 2017
1QFY18 Results Update | Sector: Financials
Federal Bank
Buy
BSE SENSEX
32,382
S&P CNX
10,021
CMP: INR115
TP:INR139 (+21%)
Motilal Oswal values your support in
the Asiamoney Brokers Poll 2017 for
India Research, Sales and Trading
team. We
request your ballot.
Slippages dent profitability; Underlying story intact
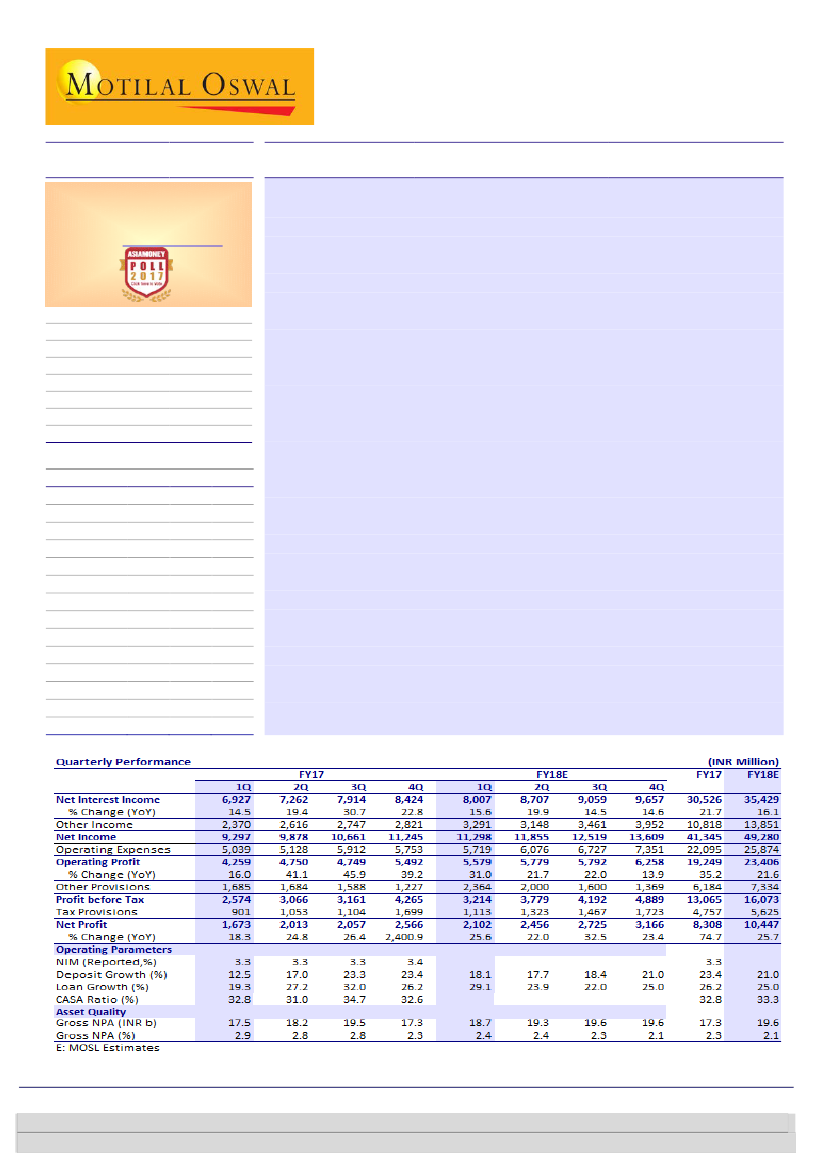
Federal Bank’s (FB) 1QFY18 PAT declined 18% QoQ (+26% YoY) to INR2.1b (14%
miss), despite in-line PPoP (+2%/31% QoQ/YoY), due to the twin impact on NII
and provisions from a spike in corporate slippages, with a restructured account
slipping into NPA.
NII growth came in at -5%/16% QoQ/YoY (7% miss) owing to interest reversals
of ~INR160m, adjusted for which, calculated NIM would stand at 3.11% instead
of 3.05%. Capital raise benefit (+15bp) will help near-term NIMs. Other income
grew 17%/39% QoQ/YoY due to a lumpy contribution of INR2b of treasury
income. CI ratio improved 60bp QoQ to 50.6%.
Loan growth of 4%/29% QoQ/YoY was broad-based, with strong growth across
segments. Corporate growth was the strongest at 6%/39% QoQ/YoY. Retail &
agri loans grew by 3%/27% QoQ/YoY, and SME loans by 3%/17% QoQ/YoY.
Asset quality deteriorated, with one bulky restructured account of INR1.05b
(62% of corporate slippages) slipping into NPA; GNPA/NNPA increased to
2.42%/1.39% (+9bp/+11bp QoQ), with slippage ratio shooting up to 2.88% v/s
1.68% in 4QFY17. Recoveries and upgrades declined 34% QoQ. During the
quarter, the bank sold ~INR480m from existing accounts to ARCs.
Other highlights: a) CASA increased 33% YoY led by 28% CA growth. b) Growth
picking up outside Kerala with 20%/25% growth in loans/SA, while overall
loans/SA growth was 14%/19%.
Valuation and view:
We believe FB’s asset quality concerns, which are largely
legacy issues, are largely behind. The bank is ahead of corporate lending peer
banks on the asset quality curve, especially with opportunistic entry into the
mid-commercial segment. Considering asset quality distractions in the PSU
space, we believe FB is well positioned to gain market share in highly rated
corporates. Post QIP, the bank is comfortably positioned with respect to capital
(Tier 1 ratio of 14.7%). We largely maintain estimates for FY18/19 and reiterate
Buy
with a target price of INR139 (2x June 2019 BV) based on RI model.
Bloomberg
Equity Shares (m)
M.Cap.(INRb)/(USDb)
52-Week Range (INR)
1, 6, 12 Rel. Per (%)
Avg Val, INRm
Free float (%)
FB IN
1,719.0
139.2/2.1
82/41
13/61/40
414
100.0
Financials & Valuations (INR b)
Y/E Mar
2018E 2019E 2020E
NII
35.4
43.4
52.0
OP
23.4
27.5
33.9
NP
10.4
13.3
16.7
NIM (%)
3.1
3.1
3.0
EPS (INR)
5.4
6.8
8.6
EPS Gr. (%)
11.6
27.0
25.7
BV/Sh. (INR)
62.3
67.7
74.6
ABV/Sh. (INR) 58.9
64.1
71.7
ROE (%)
10.0
10.5
12.1
ROA (%)
0.8
0.9
0.9
Payout (%)
20.3
19.7
19.7
Valuations
P/E(X)
21.3
16.7
13.3
P/BV (X)
1.8
1.7
1.5
Alpesh Mehta - Research analyst
(Alpesh.Mehta@MotilalOswal.com); +91 22 6129 1526
Subham Banka - Research analyst
(Subham.Banka@MotilalOswal.com)
/
Anirvan Sarkar - Research analyst
(Anirvan.Sarkar@MotilalOswal.com)
Investors are advised to refer through important disclosures made at the last page of the Research Report.
Motilal Oswal research is available on www.motilaloswal.com/Institutional-Equities, Bloomberg, Thomson Reuters, Factset and S&P Capital.

Federal Bank
Exhibit 1: Quarterly Performance
Y/E MARCH
Interest Income
Interest Expense
Net Interest Income
% Change (YoY)
Other Income
Net Income
Operating Expenses
Operating Profit
% Change (YoY)
Other Provisions
Profit before Tax
Tax Provisions
Net Profit
% Change (YoY)
1QFY18A
23,241
15,234
8,007
15.6
3,291
11,298
5,719
5,579
31.0
2,364
3,214
1,113
2,102
25.6
1QFY18E
23,842
15,251
8,591
24.0
2,612
11,203
5,714
5,490
28.9
1,750
3,740
1,309
2,431
45.3
Var (%)
-3
0
-7
26
1
0
2
35
-14
-15
-14
Provisions lead to PAT miss
Source: MOSL, Company
Provisions soared with increased slippages
Comments
NIMs were impacted by interest reversals
Beat led by treasury income
70%+ of FB’s wholesale
book is now rated A or
above, compared to 67% in
4QFY16
Strong growth across segments; pick up in corporate growth encouraging
Loan growth of 5% QoQ (+29% YoY) was broad based with strong growth across
segments. Corporate growth was the strongest at 6%/39% QoQ/YoY. Retail &
agri loans grew 3%/27% QoQ/YoY, and SME loans grew 3%/17% QoQ/YoY. The
management is treading cautiously in the SME space due to problems with
rubber and cashew industry
Although corporate loan book now constitutes 39% of overall loan book, we
believe this is largely opportunistic acquisition of new corporate relationships
Although FB remains committed to its overarching strategy of calibrating its loan
mix towards SME and retail lending, we believe that the current environment is
offering the bank opportunities to acquire high-quality corporate customers,
especially in the mid-corporate space which is the focus area of the bank. Over
half (71%) of FB’s corporate portfolio is now rated A and above, compared to
67% a year ago period
Asset quality bump-up a one-off legacy issue
GNPA increased 8% QoQ;
sale to ARC of INR1.9b, of
which INR480m was from
existing accounts
Slippages spiked to INR4.25b led by corporate slippage of INR1.7b (of which
INR1.05b came from a restructured account) and retail slippages (INR970m v/s
550m in 4QFY17). However, the restructured account is a legacy issue and
largely asset quality problems are behind the bank. We expect incremental
stress additions to be minimal for the bank going ahead.
SME delinquencies were largely stable at INR1.14b and remain key monitorable
for the bank. Agri slippages increased to INR450m v/s INR300m in 4Q.
Recoveries and upgradations came in at ~INR980m. During the quarter the bank
sold INR1.9b to ARCs of which ~INR480m was from existing accounts. Write-offs
were high at INR1.46b (highest in the last 5 quarters)
Consequently, GNPL and NNPL increased 8% and 13% QoQ respectively; GNPA %
increased 9bp QoQ to 2.42% while NNPA% increased 11bp to 1.39%. Calculated
PCR declined 230bp to 43.2%
OSRL book stood at INR13.3b (~1.74% of loans).
26 July 2017
2

Federal Bank
Strong CASA growth; Share of retail deposits at 96.7% of overall
FB registered healthy CASA growth of 20% YoY, driving CASA ratio up 80bp QoQ
to 33.4% v/s 32.6% in 4Q.
The proportion of retail deposits stood at 96.7%, one of the best within the
banking system.
Risk adjusted NIMs declined
to 2.2% v/s 3.1% in 4QFY17
and 2.7% in 1QFY17
Risk-adjusted NIMs trended lower
Overall NIMs declined 29bp/15bp QoQ/YoY to 3.13%. 30 bps QoQ fall in yield on
advances was partly due to interest income reversals while cost of deposits
declined 3bp QoQ.
Risk-adjusted NIMs clocked in at 2.23%, 88bp lower on a QoQ basis (-45bp YoY).
QoQ decline is understandable from the twin impact of interest income reversal
combined with higher credit costs
1QFY18 conference call highlights
Balance-sheet related
Management is focusing on INR250-500m ticket size loans (mid commercial)
which are growing well.
Not growing Kerala book because of stress from NRI-related accounts, tourism
hit from liquor ban, and cashew and rubber industry problems; also, going slow
on SME book.
One bulk deposit that came in at the end of 4QFY17 was sold off in April.
10% of retail book was bought in FY17.
Asset quality
Retail slippages should be ~INR800m for another 2 quarters.
SDR, S4A, 5:25 are now classified within the restructured book.
Of IBC accounts, they have sold 3 accounts to ARCs, 2 have been written off, one
account of INR230m remains whose impact should be insignificant. The bank
has no exposure to next expected set of 20-30 accounts.
Provision expense had an INR400m impact for the restructured account
slippage.
Movement of GNPA: recoveries and upgrade – INR980m, INR1.46b of write-off,
sale to ARC of INR48.
Total NPA sale during the quarter was INR1.9b, of which INR480m was from
older existing accounts.
Slippage rate from SDR/S4A etc. has historically been 18-20% (without
accounting for bulky accounts).
P&L-related
1QFY18 interest income had impact of INR60m due to reversals from
incremental corporate slippages and INR100m due to reversals from
demonetization-related stress in retail/SME. 4QFY17 had INR150m of interest
on IT refunds.
Targeting FY18 NIM of 3.2% - 3.25%, which may go up to 3.3% due to capital
raise
26 July 2017
3

Federal Bank
Other expenses had a one-time service charge of INR250m for buying a portfolio
Others
The bank is focusing on a branch light, distribution heavy model with more RMs,
feet on street, digital etc. The don’t plan to add branches in FY18
85% of loan origination happening internally and 15% from FedFina
60% overlap between asset and liability customers in Kerala
Witnessed INR10b+ retail disbursements for the first time in the quarter
Buy with a target price of
INR139 based on
Residual income model
(2x June 19 BV)
Valuation and view
FB’s cautious approach to loan growth over the past few years is now beginning
to manifest itself in a calibrated loan mix towards highly-rated corporate assets
and retail loans, resulting in upward-trending risk-adjusted NIMs (likely to settle
upwards of 3% over the next 12 months).
On the back of a consistently stable deposit franchise (highest proportion of
retail sub-INR10m deposits amongst its peers) and rising confidence in its
conscious asset-side strategy, we believe FB’s loan growth (29% YoY in 1QFY18)
engine is perfectly poised to fire. Our confidence also stems from the structural
process improvements in its corporate underwriting procedures, which will
drive the quality of FB’s incremental loan growth (25% CAGR over FY17-FY20).
Given the enormous credit challenges that other corporate lenders are facing,
FB’s relative competitive positioning within the sector continues to improve. We
expect FB to capitalize on this relative competitive position by acquiring new-to-
bank (NTB) relationships with highly-rated corporates and generate SME / retail
leads from such accounts.
While FB boasts of a very strong mix of savers (continually rising granularity of
deposits), the bank now needs to convert a higher proportion of its savers to
begin transacting through its own platforms. In this context, we build in 20%
CAGR in non-employee expenses as we believe that FB’s digital investments are
absolutely essential.
We believe that an improvement in FB’s efficiency will need to be driven by non-
linearity in its fee income. While we build in stable core fee income at ~70bp of
average assets over FY17-FY20E, we believe that greater traction on high-quality
transaction fee income will be an upside risk to our forecasts.
Post capital raise of INR25b via QIP in 1QFY18 Federal Bank is well-positioned in
terms of capital (Tier 1 ratio of 14.7%) that should support healthy growth over
the next 3 years.
We expect PAT CAGR (with an upside bias) of ~26% over FY17-20. Stock trades
at FY19 PE and PBV of 16.7x/1.7x. On the back of a healthy capitalization ratio
(Tier 1 of 14.7%) and improving ROE profile, we
maintain Buy
with a target price
of INR139 (Residual income model –2x June 19 BV). Key assumptions are a) risk
free rate of 7% b) Beta of 1.35x c) Risk Premium of 5% d) average growth of
~17% over FY16-36E and e) Terminal growth rate of 5%.
26 July 2017
4

Federal Bank
Exhibit 2: We largely maintain estimates
(INR b)
Net Interest Income
Other Income
Total Income
Operating Expenses
Operating Profits
Provisions
PBT
Tax
PAT
Loans
Deposits
Margins (%)
Credit Cost (%)
RoA (%)
RoE (%)
EPS
BV
ABV
Old Estimates
FY18 FY19 FY20
37.3
44.0
52.8
11.9
13.8
16.4
49.2
57.8
69.2
25.9
29.9
34.6
23.3
27.9
34.6
6.9
7.6
8.9
16.4
20.2
25.7
5.7
7.1
9.0
10.6
13.2
16.7
917 1,146 1,432
1,182 1,477 1,846
3.22
3.10
3.02
0.75
0.65
0.60
0.8
0.8
0.9
10.2
10.4
12.1
5.5
6.8
8.6
62.3
67.8
74.7
58.8
64.2
72.0
Revised Estimates
FY18
FY19
FY20
35.4
43.4
52.0
13.9
14.3
17.1
49.3
57.7
69.0
25.9
30.1
35.1
23.4
27.5
33.9
7.3
7.1
8.2
16.1
20.4
25.6
5.6
7.1
9.0
10.4
13.3
16.7
917
1,146 1,432
1,182 1,477 1,846
3.06
3.05
2.97
0.80
0.60
0.55
0.8
0.9
0.9
10.0
10.5
12.1
5.4
6.8
8.6
62.3
67.7
74.6
58.9
64.1
71.7
Change (%)
FY18 FY19 FY20
-5.0 -1.5 -1.6
16.1 3.7
3.9
0.1 -0.2 -0.3
-0.2 0.7
1.6
0.5 -1.2 -2.1
6.0 -6.8 -7.3
-1.9 0.9 -0.3
-1.9 0.9 -0.3
-1.9 0.9 -0.3
0.0
0.0
0.0
0.0
0.0
0.0
-1.9
-0.1
0.1
0.9
0.0
-0.1
-0.3
-0.1
-0.4
Source: MOSL, Company
Exhibit 3: One year forward P/BV
2.3
1.9
1.5
1.1
0.7
0.3
1.1
0.5
PB (x)
Peak(x)
Avg(x)
2.0
Min(x)
2.0
Exhibit 4: One year forward P/E
35
27
19
11
3
4.5
10.7
PE (x)
Peak(x)
Avg(x)
23.9
18.4
Min(x)
Source: MOSL, Company
26 July 2017
5

Federal Bank
Exhibit 5: DuPont Analysis: Core Operating performance will drive higher return ratios
Y/E March
Interest Income
Interest Expended
Net Interest Income
Core Fee Income
Fee to core Income
Core Income
Operating Expenses
Cost to Core Income
Employee cost
Employee to total exp (%)
Others
Core operating Profits
Non Interest income
Trading and others
Operating Profits
Provisions
NPA
Others
PBT
Tax
Tax Rate
RoA
Leverage (x)
RoE
FY12
9.92
6.43
3.49
0.65
14.66
4.14
1.75
42.2
0.97
55.5
0.78
2.39
0.95
0.30
2.69
0.60
0.40
0.21
2.09
0.70
33.6
1.4
10.4
14.4
FY13
9.37
6.37
3.00
0.62
15.56
3.62
1.79
49.5
0.95
53.1
0.84
1.83
1.01
0.39
2.22
0.40
0.29
0.12
1.81
0.54
29.8
1.3
10.9
13.9
FY14
9.54
6.48
3.06
0.68
16.97
3.74
1.98
52.9
1.06
53.5
0.92
1.76
0.95
0.27
2.03
0.37
0.31
0.06
1.66
0.51
30.8
1.2
10.9
12.6
FY15
9.42
6.40
3.02
0.66
15.83
3.68
2.07
56.3
1.13
54.7
0.94
1.61
1.12
0.46
2.07
0.14
0.26
-0.12
1.93
0.65
33.9
1.3
10.7
13.7
FY16
8.89
6.01
2.88
0.68
17.85
3.56
2.17
61.0
1.21
55.6
0.96
1.39
0.93
0.25
1.63
0.81
0.64
0.17
0.83
0.28
33.9
0.5
11.0
6.0
FY17
8.41
5.45
2.96
0.70
17.37
3.65
2.14
58.6
1.13
52.7
1.01
1.51
1.05
0.35
1.87
0.60
0.39
0.21
1.27
0.46
36.4
0.8
12.3
9.9
FY18E
7.80
5.02
2.79
0.68
17.48
3.46
2.03
58.7
1.01
49.5
1.03
1.43
1.09
0.41
1.84
0.58
0.52
0.06
1.26
0.44
35.0
0.82
12.2
10.0
FY19E
7.57
4.77
2.80
0.69
18.53
3.49
1.94
55.8
0.95
48.8
0.99
1.54
0.92
0.23
1.77
0.46
0.40
0.06
1.32
0.46
35.0
0.86
12.3
10.5
FY20E
7.45
4.71
2.73
0.70
19.20
3.43
1.85
53.9
0.89
48.2
0.96
1.58
0.90
0.20
1.78
0.43
0.37
0.06
1.35
0.47
35.0
0.88
13.8
12.1
Source: MOSL, Company
Exhibit 6: DuPont Analysis: steady improvement in core profitability
Net interest income
Fee income
Core Income
Operating cost
- Employee Expenses
- Other Expenses
Core operating profit
Fx and other non core Income
Operating Profit
Provisions
Tax
ROAA
Leverage (x)
ROAE
1QFY16
2.89
0.41
3.31
2.07
1.21
0.86
1.24
0.52
1.76
0.73
0.35
0.68
10.7
7.2
2QFY16
2.85
0.48
3.34
2.13
1.17
0.96
1.21
0.37
1.58
0.41
0.41
0.76
10.7
8.1
3QFY16
2.77
0.46
3.23
2.12
1.18
0.94
1.11
0.38
1.49
0.34
0.40
0.74
10.7
8.0
4QFY16
3.05
0.60
3.65
2.35
1.30
1.04
1.30
0.45
1.75
1.73
-0.02
0.05
11.0
0.5
1QFY17
2.99
0.49
3.48
2.18
1.25
0.93
1.31
0.53
1.84
0.73
0.39
0.72
11.3
8.2
2QFY17
2.99
0.52
3.51
2.11
1.20
0.91
1.40
0.56
1.96
0.69
0.43
0.83
11.6
9.6
3QFY17
2.99
0.52
3.51
2.23
1.21
1.02
1.28
0.52
1.79
0.60
0.42
0.78
12.4
9.6
4QFY17
2.98
0.60
3.58
2.03
0.93
1.10
1.55
0.39
1.94
0.43
0.60
0.91
12.9
11.6
4QFY17
2.77
0.51
3.27
1.98
1.03
0.95
1.30
0.63
1.93
0.82
0.38
0.73
11.2
8.2
1QFY18
2.92
0.52
3.44
2.03
1.07
0.96
1.40
0.53
1.93
0.67
0.44
0.82
10.2
8.4
Source: MOSL, Company
26 July 2017
6

Federal Bank
Story in charts
Exhibit 7: NIMs declined ~29bp QoQ to 3.13%
Exhibit 8: Funding cost benefits largely passed on
Yield on Loans (%)
Cost of Deposits (%)
NIMs (%)
3.6
3.3
3.1
3.2
3.3
3.4
3.2
3.3
3.1 3.1
3.0
3.3 3.3 3.3 3.3
3.4
3.1
7.1
11.4
11.1
10.9
10.9
10.6
10.6
10.5
10.3
10.0
7.0
6.9
6.8
6.5
6.4
6.3
6.1
6.1
Source: MOSL, Company
Exhibit 9: Comfortable loan-to-deposit ratio (%)
C-D Ratio %
Exhibit 10: Deposit growth came in at 18% YoY
Deposits (INR b)
YoY Gr. (%)
23 23
19
13
15
12
4
14 14
8
17
14 14
17
12 12
18
Source: Company, MOSL
Exhibit 11: CASA growth continued with increase in CASA
ratio
CASA Ratio (%)
23
15
16
CASA growth YoY (%)
33
17 19 19 20 19 18
24
14
20
Exhibit 12: Proportion of granular retail deposits remains
high (%)
19
15 13 14
88
92 94
98 98
97
96 95 95 95 95 96 97 98
94 96 94
Source: MOSL, Company
26 July 2017
7

Federal Bank
Exhibit 13: Growth led by highly rated corporates (%)
Retail
SME and Agri Loans
Corporate Advances
Exhibit 14: Declining emphasis on bulk gold lending (%)
Housing
Gold
Mortgage
Others
39 38 34 32 33 33 32 32 31 30 32 39 35 35 37 37 39
21 22 24 25 25 24 25 25 26 27 27 26 26 25 23 24 22
32 32 33 33 32 32 33 31 32 32 32 30 29 31 31 30 29
23 21 20 21 21 22 21 22 23 23 22 29 33 31 30
10 12 12 13 14 15 15 16 17 18 19
18 17 18 18
27 25 26 25 23 21 19 17 15 14 13 11
10 10 9
40 42 42 41 41 42 44 45 45 45 46 42 40 42 42
Source: MOSL, Company
Exhibit 15: Rating mix remains healthy (%)
A and above
31
8
61
28
7
65
BBB
19
14
67
< BBB
16
12
72
17
13
70
11
19
71
12
18
70
Exhibit 16: Slippages spiked in the quarter (INR b)
5.4
3.0
1.5 1.5
1.9 1.8 1.8
3.2
2.3
1.8
4.0 3.9
2.8 2.7 2.7
2.4
4.3
45
17
38
43
15
42
41
22
37
45
15
40
Source: MOSL, Company
Exhibit 17: GNPAs increase 8% sequentially; PCR declines
230bp QoQ
GNPA (%)
NNPA (%)
PCR (%)
Exhibit 19: Credit costs* spiked in the quarter (%)
Credit Cost
2.0
75 72 70 70 70 69 69
65 63
55
48 43 43 43 44 46 43
0.5 0.6 0.5
1.3
0.9 1.0
0.1
0.2
0.2
0.9
0.3
0.6 0.6
0.4
Source: MOSL, Company
*calculated on total provisions for 1QFY18
Source: MOSL, Company
26 July 2017
8

Federal Bank
Exhibit 20: Quarterly Snapshot (INR b)
FY16
INR m
Profit and Loss
Net Interest Income
Other Income
Trading profits
Forex Income
Recoveries
Other Non interest inc.
Total Income
Operating Expenses
Employee
Others
Operating Profits
Provisions
NPA provisions
PBT
Taxes
PAT
Asset Quality
GNPA
NNPA
GNPA (%)
NNPA (%)
PCR (Calculated, %)
Slippages
Slippage Ratio (%)
Margins (%)
Yield on loans
Cost of Deposits
NIM
Balance sheet (INR b)
Deposits
CASA Deposits
% of overall Deposits
Savings Deposits
Current Deposits
Core Deposits
% of overall Deposits
Investments
Advances
Retail
Total Assets
1Q
6,048
1,939
380
410
290
859
7,987
4,315
2,523
1,792
3,672
1,531
1,170
2,141
727
1,414
13,046
4,845
2.6
1.0
63
3,170
2.8
11.4
7.1
3.1
721
226
31.3
189
37
696
96.5
270
496
160
843
2Q
6,083
1,823
260
340
190
1,033
7,906
4,540
2,489
2,051
3,366
873
1,270
2,493
880
1,613
14,987
6,748
2.9
1.3
55
4,030
3.3
11.1
7.0
3.1
738
235
31.9
193
42
719
97.5
232
509
164
863
3Q
6,057
1,828
230
190
410
998
7,885
4,630
2,586
2,044
3,255
751
390
2,504
877
1,627
16,841
8,761
3.2
1.7
48
3,870
3.2
10.9
6.9
3.0
748
240
32.1
201
39
731
97.8
246
528
168
885
4Q
6,861
2,363
410
360
240
1,353
9,224
5,278
2,930
2,348
3,945
3,886
2,720
59
-44
103
16,678
9,500
2.8
1.6
43
5,360
4.2
10.9
6.8
3.3
792
257
32.5
214
43
775
97.9
222
581
173
914
1Q
6,927
2,370
830
270
130
1,140
9,297
5,039
2,894
2,144
4,259
1,685
1,268
2,574
901
1,673
17,473
9,945
2.9
1.7
43
2,800
2.3
10.6
6.5
3.3
811
266
32.8
227
40
793
97.7
229
591
174
938
2Q
7,262
2,616
860
270
230
1,256
9,878
5,128
2,916
2,212
4,750
1,684
980
3,066
1,053
2,013
18,197
10,397
2.8
1.6
43
2,660
2.1
10.6
6.4
3.3
863
268
31.0
224
44
815
94.5
242
647
200
1,005
FY17
3Q
7,914
2,747
860
330
180
1,377
10,661
5,912
3,197
2,714
4,749
1,588
1,040
3,161
1,104
2,057
19,516
11,024
2.8
1.6
44
2,740
2.1
10.5
6.3
3.3
922
320
34.7
266
53
888
96.2
285
696
213
1,115
4Q
8,424
2,821
540
410
160
1,711
11,245
5,753
2,630
3,123
5,492
1,227
770
4,265
1,699
2,566
17,271
9,412
2
1
46
2,440
2
10
6
3
977
318
32.6
264
54
919
94.1
282
733
218
1,150
FY18
1Q
8,007
3,291
1,120
340
370
1,461
11,298
5,719
2,985
2,735
5,579
2,364
2,364
3,214
1,113
2,102
18,679
10,613
2.4
1.4
43
4,250
2.9
10.0
6.1
3.1
958
320
33.4
270
51
927
96.7
267
763
222
1,164
Variation (%)
QoQ
YoY
-5
17
107
-17
131
-15
0
-1
13
-12
2
93
207
-25
-35
-18
8
13
9
11
-232
74
120
-30
-3
-29
-2
1
84
2
-7
1
261
-5
4
2
1
16
39
35
26
185
28
22
14
3
28
31
40
86
NA
NA
26
7
7
-50
-29
10
52
62
-65
-36
-15
18
20
61
19
28
17
-99
17
29
28
24
Source: MOSL, Company
26 July 2017
9

Federal Bank
Exhibit 21: Valuation metrics
Rating
66
ICICIBC*
HDFCB
AXSB
KMB*
YES
IIB
IDFC Bk
FB
DCBB
JKBK
SIB
Equitas
RBL
Private Aggregate
SBIN (cons)*
PNB
BOI
BOB
CBK
UNBK
OBC
INBK
Public Aggregate
Banks Aggregate
HDFC*
LICHF
IHFL
GRHF
REPCO
DEWH
Housing Finance
RECL
POWF
Infra Finance
SHTF
MMFS
BAF
CIFC
SCUF
MUTH
SKSM
Asset Finance
NBFC Aggregate
Financials
FY19E
Buy
Buy
Neutral
Buy
Buy
Buy
Neutral
Buy
Neutral
Neutral
Buy
Buy
Under
Review
Buy
Buy
Neutral
Buy
Neutral
Neutral
Neutral
Buy
CMP
Mcap
EPS (INR)
P/E (x)
BV (INR)
P/BV (x)
RoA (%)
FY19E
1.23
1.84
1.19
1.99
1.80
1.95
0.91
0.85
0.96
0.44
0.74
2.16
1.35
0.50
0.37
0.33
0.66
0.41
0.47
0.26
0.72
RoE (%)
FY18E
9.4
18.8
9.3
15.0
18.0
17.3
7.9
10.2
11.4
3.5
10.8
7.1
13.6
8.7
5.6
6.1
11.9
6.2
8.1
4.6
10.9
FY19E
10.1
19.6
14.7
16.3
19.5
18.5
8.8
10.5
11.8
7.2
12.7
10.1
13.9
10.0
7.5
9.0
13.2
9.1
10.5
5.4
11.2
(INR) (USDb) FY18E FY19E FY18E FY19E FY18E FY19E
310
30.3 15.6 17.9 14.2 11.5 146.6 159.2
1,750
69.3 68.2 82.1 25.6 21.3 388 451
529
20.3 21.8 38.1 24.2 13.9 243 274
987
28.1 32.4 41.0 30.4 24.0 232 272
1,713
11.4 90.7 114.6 18.9 14.9 541 632
1,580
14.3 61.9 76.8 25.5 20.6 383 446
60
3.2
3.5
4.2
17.2 14.5
46
49
115
3.2
5.5
6.8
21.0 16.9
62
68
198
0.9
8.4 10.4 23.7 19.1
83
93
87
0.7
3.8
8.2
22.7 10.6 112 118
31
0.6
2.9
3.7
10.7
8.3
28
30
169
0.9
4.8
7.4
34.9 22.7
70
77
528
296
159
161
163
357
160
152
315
3.1
39.7
5.4
2.7
5.9
3.0
1.7
0.8
2.4
18.0
17.9
10.3
13.7
18.4
30.1
24.6
17.1
34.4
23.7
23.3
14.5
22.0
22.5
47.0
34.5
21.4
38.3
29.3
14.7
15.5
11.7
8.9
11.9
6.5
8.9
9.1
22.3
11.2
11.0
7.3
7.3
7.6
4.6
7.1
8.2
160
230
187
233
162
498
315
382
327
180
249
199
255
179
540
345
404
357
FY18E FY19E FY18E
1.51 1.30 1.23
4.51 3.88 1.84
2.18 1.93 0.81
4.25 3.63 1.84
3.17 2.71 1.75
4.13 3.54 1.90
1.31 1.23 0.93
1.84 1.70 0.83
2.38 2.14 0.95
0.78 0.74 0.23
1.11 1.01 0.65
2.39 2.18 1.66
3.29
1.15
0.85
0.69
1.01
0.72
0.51
0.40
0.96
2.93
1.05
0.80
0.63
0.91
0.66
0.46
0.38
0.88
1.34
0.44
0.29
0.22
0.59
0.29
0.37
0.22
0.73
Under
Review
Neutral
Buy
Neutral
Buy
Buy
Neutral
Neutral
Buy
Buy
Buy
Buy
Buy
Buy
Neutral
1,633
737
1,187
458
781
460
176
123
983
396
1,686
1,145
2,279
478
789
39.9
5.7
7.8
2.6
0.8
2.2
5.5
5.1
3.5
3.5
13.8
2.8
2.4
2.9
1.7
41.4
47.0
21.8
16.9
13.7
11.0
38.0
18.4
9.8
4.4
4.1
10.0
22.3
26.8
17.2
13.3
11.0
14.9
228
252
324
33
214
282
196
169
287
295
368
40
253
321
227
191
3.95
2.77
1.79
1.82
1.63
3.24
2.43
2.21
1.33
3.12
2.72
2.91
1.90
3.51
2.78
3.96
4.61
4.26
18.3
20.6
28.2
33.0
18.1
14.1
19.1
17.0
14.7
12.0
24.3
18.5
16.2
23.2
20.9
17.4
19.7
31.3
32.8
18.2
15.6
19.1
16.8
16.3
14.2
25.9
18.9
18.1
21.4
21.6
47.9 53.8 15.4
86.3 108.4 13.8
9.9 12.1 46.1
35.8 42.5 21.8
37.7 47.1 12.2
35.0
27.2
78.5
13.9
47.6
55.0
132.8
41.0
41.3
40.4
30.2
98.5
17.8
62.9
66.4
171.2
43.3
53.0
5.0
4.5
12.5
28.6
35.4
20.8
17.2
11.7
19.1
2.93 2.50 1.64
3.67 3.22 3.28
13.82 11.33 2.43
3.64 3.08 2.25
1.63 1.43 1.25
0.90
0.72
0.77
0.64
1.52
3.03
6.25
3.02
2.24
2.20
2.90
3.10
2.76
2.60
1.73
3.51
2.74
3.63
4.99
4.49
564 646 1.74
120 131 3.30
216 270 7.80
322 380 3.56
874 1,019 2.61
189 217 2.52
219 272 3.61
Source: MOSL, Company
26 July 2017
10

Federal Bank
Financials and Valuations
Income Statement
Y/E March
Net Interest Income
Change (%)
Non Interest Income
Net Income
Change (%)
Operating Expenses
Pre Provision Profits
Change (%)
Provisions (excl tax)
PBT
Tax
Tax Rate (%)
PAT
Change (%)
Equity Dividend (Incl tax)
Core PPP*
Change (%)
*Core PPP is (NII+Fee income-Opex)
2012
19,534
11.8
5,323
24,857
9.8
9,793
15,065
5.6
3,370
11,695
3,927
33.6
7,768
32.3
1,789
14,244
3.1
2013
19,747
1.1
6,644
26,391
6.2
11,795
14,596
-3.1
2,658
11,938
3,556
29.8
8,382
7.9
1,801
12,538
-12.0
2014
22,286
12.9
6,938
29,225
10.7
14,421
14,804
1.4
2,684
12,120
3,731
30.8
8,389
0.1
1,989
13,242
5.6
2015
23,804
6.8
8,783
32,587
11.5
16,309
16,278
10.0
1,067
15,210
5,153
33.9
10,057
19.9
2,268
13,721
3.6
2016
25,077
5.3
8,082
33,159
1.8
18,921
14,238
-12.5
7,041
7,197
2,440
33.9
4,757
-52.7
1,449
12,963
-5.5
2017
30,526
21.7
10,818
41,345
24.7
22,095
19,249
35.2
6,184
13,065
4,757
36.4
8,308
74.7
1,868
16,163
24.7
2018E
35,429
16.1
13,851
49,280
19.2
25,874
23,406
21.6
7,334
16,073
5,625
35.0
10,447
25.7
2,130
19,570
21.1
(INR Million)
2019E
43,378
22.4
14,283
57,661
17.0
30,147
27,514
17.6
7,104
20,410
7,143
35.0
13,266
27.0
2,627
25,514
30.4
2020E
51,963
19.8
17,051
69,014
19.7
35,132
33,883
23.1
8,236
25,647
8,976
35.0
16,670
25.7
3,302
31,883
25.0
Balance Sheet
Y/E March
Share Capital
Reserves & Surplus
Net Worth
Deposits
Change (%)
of which CASA Dep
Change (%)
Borrowings
Other Liabilities & Prov.
Total Liabilities
Current Assets
Investments
Change (%)
Loans
Change (%)
Fixed Assets
Other Assets
Total Assets
2012
3,421
53,642
57,063
4,89,371
13.8
1,34,759
16.6
42,410
17,423
6,06,268
35,326
1,74,025
19.7
3,77,560
18.2
3,261
16,096
6,06,268
2013
3,421
60,225
63,647
5,76,149
17.7
1,56,521
16.1
51,870
18,831
7,10,496
37,200
2,11,546
21.6
4,40,967
16.8
3,975
16,808
7,10,496
2014
3,421
66,085
69,506
5,97,313
3.7
1,86,638
19.2
56,880
22,243
7,45,941
45,294
2,41,179
14.0
4,34,361
-1.5
4,250
20,859
7,45,941
2015
3,427
73,955
77,381
7,08,250
18.6
2,17,835
16.7
23,082
19,791
8,28,505
47,800
2,05,688
-14.7
5,12,850
18.1
4,666
57,500
8,28,505
2016
2017E
2018E
3,438
3,448
3,885
77,474
84,108 1,17,055
80,912
87,556 1,20,939
7,91,717 9,76,646 11,81,741
11.8
23.4
21.0
2,60,526 3,20,528 3,94,062
19.6
23.0
22.9
21,766
58,973
59,723
19,905
26,594
31,857
9,14,300 11,49,769 13,94,260
54,198
74,522
79,588
2,22,175 2,81,961 3,32,714
8.0
26.9
18.0
5,80,901 7,33,363 9,16,703
13.3
26.2
25.0
5,200
4,895
4,723
51,826
55,029
60,532
9,14,300 11,49,769 13,94,260
2019E
3,885
1,27,694
1,31,578
14,77,176
25.0
4,84,633
23.0
60,473
38,208
17,07,436
97,818
3,92,602
18.0
11,45,879
25.0
4,551
66,585
17,07,436
2020E
3,885
1,41,062
1,44,947
18,46,471
25.0
5,96,221
23.0
61,223
45,876
20,98,516
1,25,273
4,63,271
18.0
14,32,349
25.0
4,380
73,244
20,98,516
Asset Quality
GNPA (INR m)
NNPA (INR m)
GNPA Ratio
NNPA Ratio
Slippage Ratio
Credit Cost
PCR (Excl Tech. write off)
E: MOSL Estimates
13,009
1,990
3.4
0.5
2.18
0.74
84.7
15,540
4,319
3.4
1.0
2.14
0.58
72.2
10,874
3,216
2.5
0.7
1.18
0.55
70.4
10,576
3,733
2.0
0.7
1.87
0.55
64.7
16,677
9,500
2.8
1.6
3.70
1.07
43.0
17,270
9,412
2.3
1.3
1.85
0.74
45.5
19,556
10,098
2.1
1.1
1.7
0.8
48.4
21,523
10,877
1.9
0.9
1.4
0.6
49.5
(%)
21,525
8,789
1.5
0.6
1.0
0.6
59.2
26 July 2017
11

Federal Bank
Financials and Valuations
Ratios
Y/E March
Spreads Analysis (%)
Avg. Yield-Earning Assets
Avg. Yield on loans
Avg. Yield on Investments
Avg. Cost-Int. Bear. Liab.
Avg. Cost of Deposits
Interest Spread
Net Interest Margin
Profitability Ratios (%)
RoE
RoA
Int. Expense/Int.Income
Fee Income/Net Income
Non Int. Inc./Net Income
Efficiency Ratios (%)
Cost/Income*
Empl. Cost/Op. Exps.
Busi. per Empl. (INR m)
NP per Empl. (INR lac)
* ex treasury
Asset-Liability Profile (%)
Loans/Deposit Ratio
CASA Ratio
Investment/Deposit Ratio
G-Sec/Investment Ratio
CAR
Tier 1
2012
10.7
12.0
8.2
7.4
7.2
3.4
3.8
2013
10.1
11.3
7.6
7.2
7.2
2.8
3.2
2014
10.3
11.4
7.8
7.4
7.2
2.9
3.3
2015
10.4
11.5
7.4
7.3
7.1
3.2
3.3
2016
10.0
10.4
8.2
6.8
6.7
3.2
3.2
2017E
9.3
10.0
7.1
6.1
6.1
3.2
3.3
2018E
8.6
9.2
6.4
5.6
5.7
3.0
3.1
2019E
8.3
8.8
6.1
5.3
5.4
2.9
3.1
2020E
8.1
8.6
6.1
5.2
5.2
2.9
3.0
14.4
1.4
64.9
14.7
21.4
13.9
1.3
68.0
15.6
25.2
12.6
1.2
67.9
17.0
23.7
13.7
1.3
67.9
15.8
27.0
6.0
0.5
67.6
17.8
24.4
9.9
0.8
64.8
17.4
26.2
10.0
0.8
64.3
17.5
28.1
10.5
0.9
63.0
18.5
24.8
12.1
0.9
63.3
19.2
24.7
40.7
55.5
92.4
8.9
48.5
53.1
100.1
8.9
52.1
53.5
99.8
8.2
54.3
54.7
102.6
9.2
59.3
55.6
110.5
4.1
57.8
52.7
128.6
6.9
56.9
49.5
155.0
8.5
54.2
48.8
187.6
10.5
52.4
48.2
229.0
12.9
77.2
27.5
35.6
66.3
16.6
15.9
76.5
27.2
36.7
68.9
14.7
14.1
72.7
31.2
40.4
65.6
15.1
14.6
72.4
30.8
29.0
82.0
15.5
14.8
73.4
32.9
28.1
97.1
13.9
13.4
75.1
32.8
28.9
70.7
12.4
11.8
77.6
33.3
28.2
78.1
13.9
13.4
77.6
32.8
26.6
82.8
12.3
11.9
77.6
32.3
25.1
87.7
11.0
10.7
Valuation
Book Value (INR)
Change (%)
Price-BV (x)
Adjusted BV (INR)
Price-ABV (x)
EPS (INR)
Change (%)
Price-Earnings (x)
Dividend Per Share (INR)
Dividend Yield (%)
E: MOSL Estimates
33.4
11.7
32.6
4.5
32.3
0.9
37.2
11.5
35.6
4.9
7.9
0.9
40.6
9.2
39.4
4.9
0.1
1.0
45.2
11.2
43.7
5.9
19.7
1.1
47.1
4.2
43.5
2.8
-52.9
0.7
50.8
7.9
2.3
47.2
2.4
4.8
74.1
23.7
1.1
0.9
62.3
22.6
1.8
58.9
1.9
5.4
11.6
21.3
0.9
0.8
67.7
8.8
1.7
64.1
1.8
6.8
27.0
16.7
1.2
1.0
74.6
10.2
1.5
71.7
1.6
8.6
25.7
13.3
1.5
1.3
26 July 2017
12

Federal Bank
Corporate profile
Company description
Federal Bank is an old age Private Sector Bank with
a history that dates back to the pre-independence
era. The bank has a dominant presence in Southern
India especially in Kerala. Mr. Shyam Srinivasan,
with experience of over 20 years with MNC banks,
took charge as the MD&CEO of the bank in 2010.
Under his leadership the bank is increasing the
presence and visibility at the national level. Federal
Bank has 1,252 branches and 1,655 ATMs across the
country.
Exhibit 1: Sensex rebased
Source: MOSL/Bloomberg
Exhibit 2: Shareholding pattern (%)
Jun-17
Promoter
DII
FII
Others
0.0
33.9
39.3
26.8
Mar-17
0.0
30.3
32.5
37.1
Jun-16
0.0
29.4
15.5
55.1
Source: Capitaline
Exhibit 3: Top holders
Holder Name
HDFC Trustee Company Limited Along with
various schemes
Amansa Holdings Private Limited
Reliane Capital Trusteees Co Ltd Along with
various schemes
Yusuffali Musaliam Veettil Abdul Kader
DSP Black Rock Along with various schemes
% Holding
4.3
3.7
3.4
3.3
3.1
Source: Capitaline
Note: FII Includes depository receipts
Exhibit 4: Top management
Name
Shyam Srinivasan
Ashutosh Khajuria
Ganesh Sankaran
Girish Kumar Ganapathy
Designation
Managing Director & CEO
Executive Director
Executive Director
Company Secretary
Exhibit 5: Directors
Name
Dilip Gena Sadarangani
Harish H Engineer
Nilesh S Vakamsey
Balagopal Chandrasekhar
Name
Grace Elizabeth Koshie
K M Chandrasekhar
Sudhir M Joshi
Shubhalakshmi Panse
Source: Capitaline
*Independent
Exhibit 6: Auditors
Name
Deloitte Haskins & Sells
M P Chitale & Co
Type
Statutory
Statutory
Exhibit 7: MOSL forecast v/s consensus
EPS
(INR)
FY18
FY19
FY20
MOSL
forecast
5.4
6.8
8.6
Consensus
forecast
6.3
8.1
10.0
Variation (%)
-14.7
-16.3
-13.7
Source: Bloomberg
Source: Capitaline
26 July 2017
13

Disclosures:
The following Disclosures are being made in compliance with the SEBI Research Analyst Regulations 2014 (herein after referred to as the Regulations).
Federal Bank
Motilal Oswal Securities Ltd. (MOSL) is a SEBI Registered Research Analyst having registration no. INH000000412. MOSL, the Research Entity (RE) as defined in the Regulations, is engaged in the business of providing Stock
broking services, Investment Advisory Services, Depository participant services & distribution of various financial products. MOSL is a subsidiary company of Motilal Oswal Financial Service Ltd. (MOFSL). MOFSL is a listed
public company, the details in respect of which are available on
www.motilaloswal.com.
MOSL is registered with the Securities & Exchange Board of India (SEBI) and is a registered Trading Member with National Stock
Exchange of India Ltd. (NSE) and Bombay Stock Exchange Limited (BSE), Metropolitan Stock Exchange Of India Ltd. (MSE) for its stock broking activities & is Depository participant with Central Depository Services Limited
(CDSL) & National Securities Depository Limited (NSDL) and is member of Association of Mutual Funds of India (AMFI) for distribution of financial products. Details of associate entities of Motilal Oswal Securities Limited are
available on the website at
http://onlinereports.motilaloswal.com/Dormant/documents/Associate%20Details.pdf
Pending Regulatory Enquiries against Motilal Oswal Securities Limited by SEBI:
SEBI pursuant to a complaint from client Shri C.R. Mohanraj alleging unauthorized trading, issued a letter dated 29th April 2014 to MOSL notifying appointment of an Adjudicating Officer as per SEBI regulations to hold
inquiry and adjudge violation of SEBI Regulations; MOSL requested SEBI to provide all documents, records, investigation report relied upon by SEBI which were referred in Show Cause Notice and also sought personal
hearing. The matter is currently pending.
MOSL, it’s associates, Research Analyst or their relative may have any financial interest in the subject company. MOSL and/or its associates and/or Research Analyst may have beneficial ownership of 1% or more securities in
the subject company at the end of the month immediately preceding the date of publication of the Research Report.
MOSL and its associate company(ies), their directors and Research Analyst and their relatives may; (a)
from time to time, have a long or short position in, act as principal in, and buy or sell the securities or derivatives thereof of companies mentioned herein. (b) be engaged in any other transaction involving such securities and
earn brokerage or other compensation or act as a market maker in the financial instruments of the company(ies) discussed herein or act as an advisor or lender/borrower to such company(ies) or may have any other
potential conflict of interests with respect to any recommendation and other related information and opinions.; however the same shall have no bearing whatsoever on the specific recommendations made by the analyst(s),
as the recommendations made by the analyst(s) are completely independent of the views of the associates of MOSL even though there might exist an inherent conflict of interest in some of the stocks mentioned in the
research report.
Research Analyst may have served as director/officer, etc. in the subject company in the last 12 month period. MOSL and/or its associates may have received any compensation from the subject company in
the past 12 months.
In the last 12 months period ending on the last day of the month immediately preceding the date of publication of this research report, MOSL or any of its associates may have:
a)
managed or co-managed public offering of securities from subject company of this research report,
b)
received compensation for investment banking or merchant banking or brokerage services from subject company of this research report,
c)
received compensation for products or services other than investment banking or merchant banking or brokerage services from the subject company of this research report.
d)
Subject Company may have been a client of MOSL or its associates during twelve months preceding the date of distribution of the research report.
MOSL and it’s associates have not received any compensation or other benefits from the subject company or third party in connection with the research report. To enhance transparency, MOSL has incorporated a Disclosure
of Interest Statement in this document. This should, however, not be treated as endorsement of the views expressed in the report. MOSL and / or its affiliates do and seek to do business including investment banking with
companies covered in its research reports. As a result, the recipients of this report should be aware that MOSL may have a potential conflict of interest that may affect the objectivity of this report. Compensation of Research
Analysts is not based on any specific merchant banking, investment banking or brokerage service transactions.
Terms & Conditions:
This report has been prepared by MOSL and is meant for sole use by the recipient and not for circulation. The report and information contained herein is strictly confidential and may not be altered in any way, transmitted to,
copied or distributed, in part or in whole, to any other person or to the media or reproduced in any form, without prior written consent of MOSL. The report is based on the facts, figures and information that are considered
true, correct, reliable and accurate. The intent of this report is not recommendatory in nature. The information is obtained from publicly available media or other sources believed to be reliable. Such information has not
been independently verified and no guaranty, representation of warranty, express or implied, is made as to its accuracy, completeness or correctness. All such information and opinions are subject to change without notice.
The report is prepared solely for informational purpose and does not constitute an offer document or solicitation of offer to buy or sell or subscribe for securities or other financial instruments for the clients. Though
disseminated to all the customers simultaneously, not all customers may receive this report at the same time. MOSL will not treat recipients as customers by virtue of their receiving this report.
Analyst Certification
The views expressed in this research report accurately reflect the personal views of the analyst(s) about the subject securities or issues, and no part of the compensation of the research analyst(s) was, is, or will be directly or
indirectly related to the specific recommendations and views expressed by research analyst(s) in this report.
Disclosure of Interest Statement
Analyst ownership of the stock
Federal Bank
No
A graph of daily closing prices of securities is available at
www.nseindia.com, www.bseindia.com.
Research Analyst views on Subject Company may vary based on Fundamental research and Technical Research. Proprietary
trading desk of MOSL or its associates maintains arm’s length distance with Research Team as all the activities are segregated from MOSL research activity and therefore it can have an independent view with regards to
subject company for which Research Team have expressed their views.
Regional Disclosures (outside India)
This report is not directed or intended for distribution to or use by any person or entity resident in a state, country or any jurisdiction, where such distribution, publication, availability or use would be contrary to law,
regulation or which would subject MOSL & its group companies to registration or licensing requirements within such jurisdictions.
For Hong Kong:
This report is distributed in Hong Kong by Motilal Oswal capital Markets (Hong Kong) Private Limited, a licensed corporation (CE AYY-301) licensed and regulated by the Hong Kong Securities and Futures Commission (SFC)
pursuant to the Securities and Futures Ordinance (Chapter 571 of the Laws of Hong Kong) “SFO”. As per SEBI (Research Analyst Regulations) 2014 Motilal Oswal Securities (SEBI Reg No. INH000000412) has an agreement with
Motilal Oswal capital Markets (Hong Kong) Private Limited for distribution of research report in Hong Kong. This report is intended for distribution only to “Professional Investors” as defined in Part I of Schedule 1 to SFO. Any
investment or investment activity to which this document relates is only available to professional investor and will be engaged only with professional investors.” Nothing here is an offer or solicitation of these securities,
products and services in any jurisdiction where their offer or sale is not qualified or exempt from registration. The Indian Analyst(s) who compile this report is/are not located in Hong Kong & are not conducting Research
Analysis in Hong Kong.
For U.S.
Motilal Oswal Securities Limited (MOSL) is not a registered broker - dealer under the U.S. Securities Exchange Act of 1934, as amended (the"1934 act") and under applicable state laws in the United States. In addition MOSL is
not a registered investment adviser under the U.S. Investment Advisers Act of 1940, as amended (the "Advisers Act" and together with the 1934 Act, the "Acts), and under applicable state laws in the United States.
Accordingly, in the absence of specific exemption under the Acts, any brokerage and investment services provided by MOSL, including the products and services described herein are not available to or intended for U.S.
persons. This report is intended for distribution only to "Major Institutional Investors" as defined by Rule 15a-6(b)(4) of the Exchange Act and interpretations thereof by SEC (henceforth referred to as "major institutional
investors"). This document must not be acted on or relied on by persons who are not major institutional investors. Any investment or investment activity to which this document relates is only available to major institutional
investors and will be engaged in only with major institutional investors. In reliance on the exemption from registration provided by Rule 15a-6 of the U.S. Securities Exchange Act of 1934, as amended (the "Exchange Act") and
interpretations thereof by the U.S. Securities and Exchange Commission ("SEC") in order to conduct business with Institutional Investors based in the U.S., MOSL has entered into a chaperoning agreement with a U.S.
registered broker-dealer, Motilal Oswal Securities International Private Limited. ("MOSIPL"). Any business interaction pursuant to this report will have to be executed within the provisions of this chaperoning agreement.
The Research Analysts contributing to the report may not be registered /qualified as research analyst with FINRA. Such research analyst may not be associated persons of the U.S. registered broker-dealer, MOSIPL, and
therefore, may not be subject to NASD rule 2711 and NYSE Rule 472 restrictions on communication with a subject company, public appearances and trading securities held by a research analyst account.
For Singapore
Motilal Oswal Capital Markets Singapore Pte Limited is acting as an exempt financial advisor under section 23(1)(f) of the Financial Advisers Act(FAA) read with regulation 17(1)(d) of the Financial Advisors Regulations and is a
subsidiary of Motilal Oswal Securities Limited in India. This research is distributed in Singapore by Motilal Oswal Capital Markets Singapore Pte Limited and it is only directed in Singapore to accredited investors, as defined in
the Financial Advisers Regulations and the Securities and Futures Act (Chapter 289), as amended from time to time. In respect of any matter arising from or in connection with the research you could contact the following
representatives of Motilal Oswal Capital Markets Singapore Pte Limited:
Disclaimer:
The report and information contained herein is strictly confidential and meant solely for the selected recipient and may not be altered in any way, transmitted to, copied or distributed, in part or in whole, to any other person
or to the media or reproduced in any form, without prior written consent. This report and information herein is solely for informational purpose and may not be used or considered as an offer document or solicitation of
offer to buy or sell or subscribe for securities or other financial instruments. Nothing in this report constitutes investment, legal, accounting and tax advice or a representation that any investment or strategy is suitable or
appropriate to your specific circumstances. The securities discussed and opinions expressed in this report may not be suitable for all investors, who must make their own investment decisions, based on their own investment
objectives, financial positions and needs of specific recipient. This may not be taken in substitution for the exercise of independent judgment by any recipient. Each recipient of this document should make such investigations
as it deems necessary to arrive at an independent evaluation of an investment in the securities of companies referred to in this document (including the merits and risks involved), and should consult its own advisors to
determine the merits and risks of such an investment. The investment discussed or views expressed may not be suitable for all investors. Certain transactions -including those involving futures, options, another derivative
products as well as non-investment grade securities - involve substantial risk and are not suitable for all investors. No representation or warranty, express or implied, is made as to the accuracy, completeness or fairness of
the information and opinions contained in this document. The Disclosures of Interest Statement incorporated in this document is provided solely to enhance the transparency and should not be treated as endorsement of the
views expressed in the report. This information is subject to change without any prior notice. The Company reserves the right to make modifications and alternations to this statement as may be required from time to time
without any prior approval. MOSL, its associates, their directors and the employees may from time to time, effect or have effected an own account transaction in, or deal as principal or agent in or for the securities
mentioned in this document. They may perform or seek to perform investment banking or other services for, or solicit investment banking or other business from, any company referred to in this report. Each of these entities
functions as a separate, distinct and independent of each other. The recipient should take this into account before interpreting the document. This report has been prepared on the basis of information that is already
available in publicly accessible media or developed through analysis of MOSL. The views expressed are those of the analyst, and the Company may or may not subscribe to all the views expressed therein. This document is
being supplied to you solely for your information and may not be reproduced, redistributed or passed on, directly or indirectly, to any other person or published, copied, in whole or in part, for any purpose. This report is not
directed or intended for distribution to, or use by, any person or entity who is a citizen or resident of or located in any locality, state, country or other jurisdiction, where such distribution, publication, availability or use would
be contrary to law, regulation or which would subject MOSL to any registration or licensing requirement within such jurisdiction. The securities described herein may or may not be eligible for sale in all jurisdictions or to
certain category of investors. Persons in whose possession this document may come are required to inform themselves of and to observe such restriction. Neither the Firm, not its directors, employees, agents or
representatives shall be liable for any damages whether direct or indirect, incidental, special or consequential including lost revenue or lost profits that may arise from or in connection with the use of the information.
The
person accessing this information specifically agrees to exempt MOSL or any of its affiliates or employees from, any and all responsibility/liability arising from such misuse and agrees not to hold MOSL or any of its affiliates or
employees responsible for any such misuse and further agrees to hold MOSL or any of its affiliates or employees free and harmless from all losses, costs, damages, expenses that may be suffered by the person accessing this
information due to any errors and delays.
Registered Office Address: Motilal Oswal Tower, Rahimtullah Sayani Road, Opposite Parel ST Depot, Prabhadevi, Mumbai-400025; Tel No.: 022-3980 4263; www.motilaloswal.com. Correspondence Address: Palm Spring
Centre, 2nd Floor, Palm Court Complex, New Link Road, Malad (West), Mumbai- 400 064. Tel No: 022 3080 1000. Compliance Officer: Neeraj Agarwal, Email Id:
na@motilaloswal.com,
Contact No.:022-30801085.
Registration details of group entities.: MOSL: NSE (Cash): INB231041238; NSE (F&O): INF231041238; NSE (CD): INE231041238; BSE (Cash): INB011041257; BSE(F&O): INF011041257; BSE(CD); MSE(Cash): INB261041231;
MSE(F&O): INF261041231; MSE(CD): INE261041231; CDSL: IN-DP-16-2015; NSDL: IN-DP-NSDL-152-2000; Research Analyst: INH000000412. AMFI: ARN 17397. Investment Adviser: INA000007100. Motilal Oswal Asset
Management Company Ltd. (MOAMC): PMS (Registration No.: INP000000670) offers PMS and Mutual Funds products. Motilal Oswal Wealth Management Ltd. (MOWML): PMS (Registration No.: INP000004409) offers wealth
management solutions. *Motilal Oswal Securities Ltd. is a distributor of Mutual Funds, PMS, Fixed Deposit, Bond, NCDs, Insurance and IPO products. * Motilal Oswal Commodities Broker Pvt. Ltd. offers Commodities
Products. * Motilal Oswal Real Estate Investment Advisors II Pvt. Ltd. offers Real Estate products. * Motilal Oswal Private Equity Investment Advisors Pvt. Ltd. offers Private Equity products
26 July 2017
14