L&T Finance Holdings
BSE SENSEX
32,383
S&P CNX
10,021
27 July 2017
1QFY18 Results Update | Sector: Financials
CMP: INR161
n
TP: INR200 (+24%)
Buy
Motilal Oswal values your support in
the Asiamoney Brokers Poll 2017 for
India Research, Sales and Trading
team. We
request your ballot.
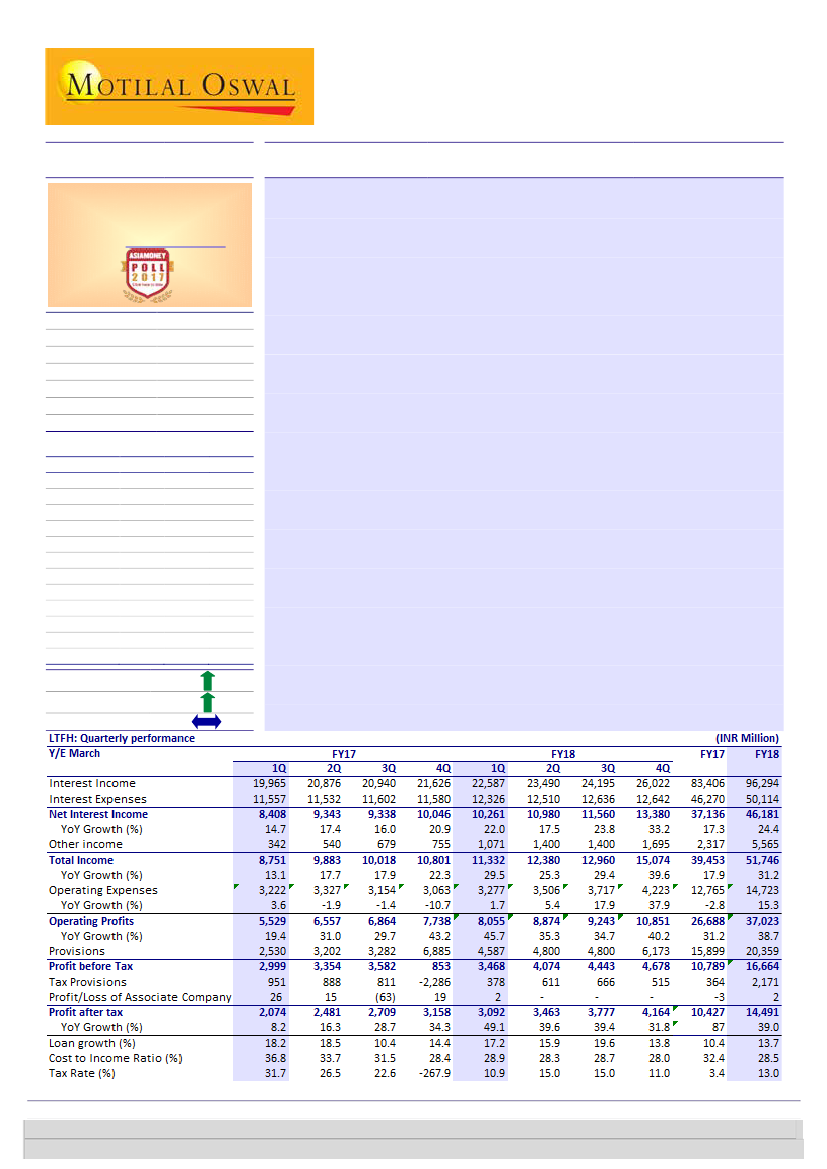
Strong fee income traction; meaningful asset quality improvement
n
Bloomberg
Equity Shares (m)
M.Cap.(INRb)/(USDb)
52-Week Range (INR)
1, 6, 12 Rel. Per (%)
Avg Val, INRm
Free float (%)
LTFH IN
1,817
293 / 4.6
167 / 79
11/43/74
662
35.8
2019E
42.1
42.9
19.3
10.6
60.0
2.3
19.1
14.8
15.2
2.7
0.8
n
Financials & Valuations (INR b)
Y/E March
2017 2018E
NII
31.4
37.6
PPP
26.7
37.0
PAT
9.2
13.3
EPS (INR)
5.2
7.3
BV/Sh. (INR)
44.3
50.9
RoAA (%)
1.5
1.9
RoE (%)
12.4
15.6
Payout (%)
19.8
15.2
Valuation
P/E (x)
30.8
22.0
P/BV (x)
3.6
3.2
Div. Yield (%)
0.6
0.6
n
n
Estimate change
TP change
Rating change
L&T Finance Holding’s (LTFH) 1QFY18 PAT grew 49% YoY to INR3.09b. Robust
core disbursement growth of 95% YoY, strong fee income across all lending
segments, sharp reduction in the GNPL ratio and shoring up of the provision
buffer were key highlights of the quarter.
Rural business:
2W/tractor disbursements increased 82%/169% YoY. While
such strong growth in the tractors segments was expected (LTFH has been
gaining market share from the lows of 4% in FY16 to 11% now), growth in the
2W financing segment was a positive surprise. With PPoP margins improving
180bp YoY to 10.72%, management chose to incur higher provisions and
maintain RoE at 21-22% levels.
Housing business:
Growth in the retail home loan/LAP segment remains
sluggish, but was compensated by 4x disbursements in the builder loans
segment. Consequently, strong fee income helped improve RoA/RoE to
3.2%/30% in 1QFY18. However, we expect RoE to normalize to 18-19% by
FY19.
Wholesale business:
LTFH has also started last mile financing for road projects
in the past few quarters. This, coupled with a large number of operational
projects coming up for refinance, drove 4.5x disbursement growth in the
quarter. While margins are under pressure, fee income traction is strong. RoE
remained largely stable YoY at 10%.
Valuation view:
LTFH has scripted an impressive turnaround over the past five
quarters, with a renewed focus on profitable segments. It has delivered strong
growth and consistent improvement in profitability. We are also encouraged by
the strong fee income traction witnessed this quarter – we believe this will play
a key role in achieving 18%+ RoE by FY19/20. We marginally reduce our FY18E
EPS to factor in higher provisions, but increase our FY19/20 estimates by 5-7%.
Buy
with a TP of INR200 (3.3x FY19E BVPS).
Investors are advised to refer through important disclosures made at the last page of the Research Report.
Motilal Oswal research is available on www.motilaloswal.com/Institutional-Equities, Bloomberg, Thomson Reuters, Factset and S&P Capital.
Piran Engineer
(Piran.Engineer@motilaloswal.com); +91 22 6129 1539
Alpesh Mehta
(Alpesh.Mehta@MotilalOswal.com); +91 22 6129 1526;
Anirvan Sarkar
(Anirvan.Sarkar@MotilalOswal.com);

L&T Finance Holdings
22% RoE despite increased
provisioning
Rural Business
n
n
n
n
Disbursement grew 65% YoY, with 169%/82% YoY growth in tractor/2W
financing. LTFH is now the second largest tractor financier in India and has
steadily increased its market share from 4% to 11% over the past 4-6 quarters.
Fee income increased almost 3x YoY to INR360m.
The GNPL ratio declined 85bp QoQ (both at 90dpd basis) to 11.35%.
Management chose to utilize its strong PPoP margin of 10.7% to shore up
provisions in this segment. As a result, NNPL ratio declined more than 200bp
(90dpd basis) to 7.6%.
Despite the increased provisioning, PAT grew 13% YoY to INR760m. This
segment continues to make 21-22% RoE.
Growth driven primarily by
the real estate finance
business
Housing Business
n
n
n
While disbursement growth in the retail home loan segment remains sluggish at
9% YoY, disbursements were up 4x in the builder loans segment.
Due to this, fee income increased more than 4x YoY to INR440m.
PAT grew 180% YoY to INR1.09b resulting in RoA/RoE of 3.2%/30% in the
quarter.
Fee income increased 3.5x
YoY to INR1.29b driven by
increased sell-downs (up
3.3x YoY to INR26b)
Wholesale Business
n
n
n
n
In the infrastructure finance segment, there was strong traction in the operating
roads financing business. Disbursements were up 4.5x YoY in this business.
The company disbursed IPO Finance of INR80b in the quarter. However, this is a
one-off. Management commented that this is a low-risk, low-return and low-
tenure business.
Fee income increased 3.5x YoY to INR1.29b driven by increased sell-downs (up
3.3x YoY to INR26b).
The GNPL ratio (90dpd) declined more than 200bp QoQ to 4.3%. Part of this
decline is attributable to sale of NPLs to ARCs. Interestingly, the company
maintained its PCR at 48% despite migration from 120dpd to 90dpd in the
quarter.
Other Business
n
n
PAT in the Investment Management business grew 163% YoY to INR190mn. This
was driven by robust Avg. AUM growth of 57% YoY to INR446b.
The Wealth Management business recorded PAT of INR30m in the quarter v/s a
loss of INR20m in 1QFY17. AAUS increased 71% YoY to INR166b.
Valuation and view
n
n
L&T Finance Holdings (LTFH) is a quintessential turnaround story, in our view.
From a company with 20+ product lines and sub-standard return ratios, it is
gradually transforming itself to a focused financier with eight product lines
across three verticals, with a target to achieve 18-20% RoE by FY20 (12% in
FY17).
With focused management and strong execution skills, the company is set to
deliver 14-15% loan CAGR over FY17-20, driven by growth in the rural and
housing finance segments. In addition, continued origination and down-selling in
the infra finance book will drive fee income traction and thus RoE elevated.
2
27 July 2017

L&T Finance Holdings
n
n
Strong growth, pick-up in core fee income and a decline in the expense
ratio/credit costs should elevate RoA/RoE from 1.5%/12.4% in FY17 to
2.5%/19.8% in FY20. While the stock has re-rated well over the past year on
account of strong execution by management, we expect re-rating to continue.
We marginally reduce our FY18 EPS estimates to factor in higher provisions, but
increase our FY19/20 estimates by 5-7%. We use RI model with Rf of 7%, CoE of
13% and terminal growth rate of 5% to arrive at a TP of INR200 (3.3x FY19E
BVPS).
BUY.
Conference call highlights
Business Updates
n
LTFH regained no 2 position in tractor financing, with 11% market share. No. 1
player in 9 out of 17 geographies it operates in.
n
Management is comfortable with the perceived risks in renewable energy
portfolio.
n
Renewables book – 83% operational projects in wind energy and 73%
operational in solar.
n
The company sold down only 1 loan from real estate and 1 from structured
finance in the quarter. All the rest are from the infra book.
n
Funded 17,000 tractors in the quarter.
n
2/3rd of fees come from underwriting and sell-down fees.
n
In the last one year, LTFH has also started doing last mile financing for road
projects.
Asset Quality
n
Total number of defaulters in MFI has remained stable QoQ. The company has
taken provisions of INR0.63b in 4Q and INR0.95b in 1QFY18 against it. The
company will look at individual lending in MFI too
Others
n
The consultation exercise with Oliver Wyman (on risk management) is over and
implementation is underway.
n
While tariffs in solar have dropped drastically, the overall share of solar in the
power sector is small; so even if an SEB is buying renewable power at erstwhile
high rates, it won’t impact overall financials of the SEB much.
n
Disbursements in 2W and tractors also include trade advance to dealers.
n
Growth in solar power projects in India is exponential. Every year, the installed
base has been growing at almost 100%. Management expects such traction to
continue.
27 July 2017
3

L&T Finance Holdings
Exhibit 1: Quarterly Snapshot
FY16
1Q
Profit and Loss (INR m)
Net Interest Income
Operating Expenses
Employee
Others
Operating Profits
Provisions
PBT
Taxes
Share of profit of associates
PAT
Asset Quality
Gross NPAs (%)
Net NPAs (%)
PCR (Calculated, %)
Ratios (%)
Cost to Income
Provision to operating profit
Tax Rate
RoA - calculated
RoE - calculated
Margins Reported (%)
Yield on earning assets
Cost of Funds
Spreads
NIMs
Business Details (INR b)
Total Loans
Total Borrowings
AUM Break-up (INR b)
Rural
Micro Finance
2W
Farm Equipment
Housing
Home loans & LAP
Real Estate Finance
Wholesale
Infra Finance
Structured Finance
Supply Chain Finance
De-focused loan book
Total
Total Borrowing Mix (%)
Term Loan
NCD
LOC/CC/WCL/STL
CP
Others
7,331
3,108
1,148
1,961
4,631
1,878
2,752
831
4
1,925
5.5
4.4
20.0
40.2
40.6
30.2
1.6
2Q
7,957
3,392
1,312
2,081
5,007
1,834
3,173
1,029
11
2,154
5.1
4.1
20.6
40.4
36.6
32.4
1.7
3Q
8,052
3,200
1,348
1,852
5,294
2,035
3,259
1,147
7
2,120
5.0
3.9
21.7
37.7
38.4
35.2
1.6
4Q
8,306
3,428
1,070
2,359
5,405
2,063
3,343
983
9
2,369
3.1
2.1
32.8
41.3
38.2
29.4
1.7
1Q
8,408
3,222
1,095
2,127
5,529
2,530
2,999
951
26
2,074
4.6
3.1
31.7
36.8
45.8
31.7
1.4
2Q
9,343
3,327
1,277
2,050
6,557
3,202
3,354
888
15
2,481
4.7
3.1
34.7
33.7
48.8
26.5
1.7
FY17
3Q
9,338
3,154
1,226
1,928
6,864
3,282
3,582
811
-63
2,709
4.9
3.1
36.1
31.5
47.8
22.6
1.8
4Q
10,046
3,063
1,338
1,725
7,738
6,885
853
-2,286
19
3,158
4.9
3.8
22.7
30.5
89.0
-267.9
2.0
FY18
1Q
10,261
3,277
1,104
2,173
8,055
4,587
3,468
378
2
3,092
5.7
3.3
42.0
28.9
56.9
10.9
1.8
Variation (%)
QoQ
YoY
2
7
-17
26
4
-33
306
-117
-91
-2
22
2
1
2
46
81
16
-60
-94
49
14.2
8.8
5.5
6.1
492
461
75
12
15
48
68
41
26
290
222
50
18
60
492
24.0
38.0
15.0
13.0
10.0
14.3
8.5
5.7
6.3
514
474
79
15
16
48
75
48
27
305
240
45
20
55
514
21.0
39.0
19.0
11.0
10.0
13.5
8.3
5.3
6.0
561
509
82
17
17
48
87
55
32
341
272
49
20
52
561
22.0
35.0
17.0
14.0
11.0
13.7
8.7
5.0
5.8
583
528
86
22
18
46
98
63
35
349
276
50
23
49
583
32.0
28.0
19.0
11.0
10.0
13.7
8.6
5.1
5.8
582
541
86
24
18
44
104
66
38
348
280
47
21
44
582
20.0
34.0
23.0
15.0
9.0
14.0
8.5
5.6
6.3
609
550
92
31
18
43
114
72
42
365
294
48
22
38
609
13.0
34.0
26.0
14.0
13.0
13.6
8.3
5.3
6.1
620
564
96
32
20
43
116
74
41
377
305
50
22
32
620
13.0
34.0
27.0
13.0
13.0
13.5
7.9
5.6
6.2
666
610
100
36
21
44
125
76
49
414
329
64
21
27
667
15.0
33.0
22.0
18.0
11.0
13.4
8.0
5.4
6.1
682
620
105
38
22
45
136
77
59
417
343
57
18
24
682
14.0
37.0
25.0
13.0
11.0
Source: Company, MOSL
2
2
5
7
4
2
8
0
21
1
4
-12
-14
-11
2
17
15
22
57
25
2
30
16
56
20
22
21
-14
-46
17
27 July 2017
4

L&T Finance Holdings
Exhibit 2: We increase our estimates marginally to factor in growth
INR b
NII
Other Income
Total Income
Operating Expenses
Operating Profits
Provisions
PBT
Tax
PAT
Loan book
NIM (%)
Spreads (%)
ROAA (%)
RoAE (%)
FY18
36.5
13.9
50.4
14.3
36.2
15.6
20.5
5.7
14.8
740
4.9
5.1
1.9
17.3
Old Est.
FY19
41.0
14.9
55.9
14.8
41.1
13.9
27.1
8.0
19.2
840
4.8
5.3
2.1
19.1
FY20
46.2
17.6
63.8
16.3
47.5
14.7
32.7
9.1
23.7
960
4.7
5.5
2.3
20.1
FY18
37.6
14.2
51.7
14.7
37.0
20.4
16.7
2.2
14.5
708
5.2
4.8
1.9
17.0
New Est.
FY19
42.1
16.2
58.3
15.4
42.9
18.0
24.9
4.4
20.5
803
5.1
4.9
2.3
20.3
FY20
47.9
19.1
67.1
17.0
50.0
19.1
30.9
6.1
24.8
933
5.1
5.0
2.5
20.8
FY18
2.8
2.0
2.6
3.2
2.4
-18.8
-2.0
-4.3
Change %
FY19
FY20
2.6
3.7
9.0
9.0
4.3
5.2
3.8
4.5
4.5
5.4
-8.5
6.7
-4.5
-5.6
4.8
-2.8
Source: MOSL, Company
27 July 2017
5

L&T Finance Holdings
Story in charts
Exhibit 3: Focused loan book grew by 22% YoY
Loan Book (INR b)
17
Loan Growth (%)
17
16
80
18
433
459
509
533
538
571
588
640
658
65
87
127
102
77
28
111
(4)
122
183
231
22
Exhibit 4: Disbursement growth due to IPO Financing
Disbursements (INRb)
Growth (%)
200
15
Source: Company, MOSL
Exhibit 5: Cost to income ratio improving
Exhibit 6: Trend in asset quality (1QFY18 data at 90dpd)
GNPA (%)
NNPA (%)
5.7
5.5
5.1 5.0
4.9
4.6 4.7 4.9
4.4
4.1 3.9
3.8
3.3
3.1 3.1 3.1
3.1
2.1
40.2
40.4
37.7
38.8
36.8
33.7
31.5
28.4
28.9
Source: Company, MOSL
Exhibit 7: NII grew 22% YoY driven by stable spreads
27
19
NII (INR m)
19
18
NII Growth (%)
21
16
22
Exhibit 8: PAT growth of 49% YoY
PAT (INR b)
PAT Growth (%)
28
33
49
15
17
19
17
15
8
15
7.3
8.0
8.1
8.3
8.4
9.3
9.3
10.0
10.3
-33
1.9
2.2
2.1
2.4
2.1
2.5
2.7
3.2
3.1
Source: Company, MOSL
27 July 2017
6

L&T Finance Holdings
Exhibit 9: Financials: Valuation metrics
Rating
66
ICICIBC*
HDFCB
AXSB
KMB*
YES
IIB
IDFC Bk
FB
DCBB
JKBK
SIB
Equitas
RBL
Private Aggregate
SBIN (cons)*
PNB
BOI
BOB
CBK
UNBK
OBC
INBK
Public Aggregate
Banks Aggregate
HDFC*
LICHF
IHFL
GRHF
REPCO
DEWH
Housing Finance
RECL
POWF
Infra Finance
SHTF
MMFS
BAF
CIFC
SCUF
LTFH
MUTH
SKSM
FY19E
Buy
Buy
Neutral
Buy
Buy
Buy
Neutral
Buy
Neutral
Neutral
Buy
Buy
Under
Review
Buy
Buy
Neutral
Buy
Neutral
Neutral
Neutral
Buy
CMP
Mcap
EPS (INR)
P/E (x)
BV (INR)
P/BV (x)
RoA (%)
RoE (%)
(INR) (USDb) FY18E FY19E FY18E FY19E FY18E FY19E FY18E FY19E FY18E FY19E FY18E FY19E
307
31.0
15.6 17.9 14.0 11.4 146.6 159.2 1.49 1.28 1.23 1.23
9.4
10.1
1,788 69.9
68.2 82.1 26.2 21.8
388
451
4.61 3.96 1.84 1.84 18.8 19.6
525
19.8
21.8 38.1 24.0 13.8
243
274
2.16 1.91 0.81 1.19
9.3
14.7
999
28.2
32.4 41.0 30.8 24.3
232
272
4.30 3.67 1.84 1.99 15.0 16.3
1,787 12.2
92.3 114.5 19.4 15.6
542
633
3.30 2.82 1.78 1.80 18.3 19.5
1,607 14.7
61.9 76.8 26.0 20.9
383
446
4.20 3.60 1.90 1.95 17.3 18.5
59
3.2
3.5
4.2
16.9 14.2
46
49
1.29 1.21 0.93 0.91
7.9
8.8
113
3.1
5.4
6.8
21.0 16.5
62
68
1.81 1.67 0.82 0.86 10.0 10.5
197
0.9
8.4
10.4 23.5 18.9
83
93
2.36 2.12 0.95 0.96 11.4 11.8
86
0.7
3.8
8.2
22.4 10.4
112
118
0.77 0.73 0.23 0.44
3.5
7.2
31
0.6
2.9
3.7
10.7
8.3
28
30
1.11 1.01 0.65 0.74 10.8 12.7
166
0.9
4.8
7.4
34.3 22.3
70
77
2.35 2.15 1.66 2.16
7.1
10.1
534
298
154
155
161
354
155
147
310
3.1
39.8
5.3
2.6
5.9
3.0
1.7
0.8
2.4
18.0
17.9
10.3
13.7
18.4
30.1
24.6
17.1
34.4
23.7
23.3
14.5
22.0
22.5
47.0
34.5
21.4
38.3
29.7
14.9
15.0
11.3
8.7
11.8
6.3
8.6
9.0
22.6
11.3
10.6
7.0
7.2
7.5
4.5
6.9
8.1
160
230
187
233
162
498
315
382
327
180
249
199
255
179
540
345
404
357
3.33
1.16
0.82
0.67
0.99
0.71
0.49
0.38
0.95
2.97
1.06
0.77
0.61
0.90
0.66
0.45
0.36
0.87
1.34
0.44
0.29
0.22
0.59
0.29
0.37
0.22
0.73
1.35
0.50
0.37
0.33
0.66
0.41
0.47
0.26
0.72
13.6
8.7
5.6
6.1
11.9
6.2
8.1
4.6
10.9
13.9
10.0
7.5
9.0
13.2
9.1
10.5
5.4
11.2
Buy
Neutral
Buy
Neutral
Buy
Buy
Neutral
Neutral
Buy
Buy
Buy
Buy
Buy
Buy
Buy
Neutral
1,729
738
1,161
478
771
451
174
122
981
400
1,682
1,175
2,250
161
466
820
40.1
5.8
7.8
2.6
0.8
2.2
5.4
5.1
3.5
3.5
14.4
2.8
2.3
4.6
3.0
1.7
41.4
47.9
86.3
9.9
35.8
37.7
35.0
27.2
47.0
53.8
108.4
12.1
42.5
47.1
40.4
30.2
24.1
15.4
13.5
48.1
21.5
12.0
5.0
4.5
12.5
28.8
35.3
21.4
16.9
22.5
11.4
25.8
18.9
13.7
10.7
39.6
18.1
9.6
4.3
4.0
10.0
22.5
26.7
17.7
13.1
16.8
10.7
11.9
228
252
324
33
214
282
196
169
564
120
216
322
874
51
189
219
287
295
368
40
253
321
227
191
646
131
270
380
1,019
59
217
272
4.37 3.10
2.93 2.50
3.59 3.15
14.42 11.83
3.60 3.04
1.60 1.41
0.89
0.72
1.74
3.33
7.78
3.65
2.57
3.17
2.46
3.75
0.77
0.64
1.52
3.06
6.23
3.10
2.21
2.73
2.15
3.02
1.86
1.64
3.28
2.43
2.25
1.25
3.10
2.76
2.60
1.73
3.51
2.74
3.63
1.79
4.99
3.44
1.87
1.63
3.24
2.43
2.21
1.33
3.12
2.72
2.91
1.90
3.51
2.78
3.96
2.03
4.61
5.29
19.3
20.6
28.2
33.0
18.1
14.1
19.1
17.0
14.7
12.0
24.3
18.5
16.2
15.3
23.2
16.1
18.4
19.7
31.3
32.8
18.2
15.6
19.1
16.8
16.3
14.2
25.9
18.9
18.1
17.5
21.4
28.0
78.5 98.5
13.9 17.8
47.6 62.9
55.0 66.4
132.8 171.2
7.2
9.6
41.0 43.3
31.8 68.7
*Multiples adj. for value of key ventures/Investments; For ICICI Bank and HDFC Ltd BV is adjusted for investments in subsidiaries
Source: MOSL, Company
27 July 2017
7

L&T Finance Holdings
Financials and valuations
Income statement
Y/E March
Interest Income
Interest Expended
Net Interest Income
Change (%)
Other Operating Income
Net Income
Change (%)
Operating Expenses
Operating Income
Change (%)
Provisions/write offs
PBT
Tax
Tax Rate (%)
PAT
Change (%)
Preference Dividend
Change (%)
PAT
Change (%)
2013
38,191
23,286
14,905
24.2
1,757
16,662
27.7
6,225
10,437
20.3
2,731
7,706
2,594
34
7,292
60.3
15
7,277
60.0
2014
48,719
30,739
17,980
20.6
3,653
21,633
29.8
9,123
12,510
19.9
4,261
8,249
2,300
28
5,948
-18.4
760
4,965.3
5,189
-28.7
2015
59,025
35,678
23,347
29.9
4,349
27,697
28.0
10,771
16,926
35.3
6,617
10,309
3,014
29
8,734
46.8
1,102
45.0
7,632
47.1
2016
68,174
41,241
26,933
15.4
6,533
33,466
20.8
13,129
20,337
20.2
7,810
12,527
3,990
32
8,537
-2.3
1,671
51.7
6,866
-10.0
2017
77,710
46,270
31,439
16.7
8,013
39,453
17.9
12,765
26,688
31.2
15,899
10,789
364
3
10,425
22.1
1,244
-25.5
9,180
33.7
2018E
87,677
50,114
37,563
19.5
14,182
51,746
31.2
14,723
37,023
38.7
20,359
16,664
2,171
13
14,493
39.0
1,200
-3.6
13,293
44.8
(INR Million)
2019E
2020E
98,826
112,079
56,727
64,166
42,099
47,912
12.1
13.8
16,187
19,146
58,286
67,059
12.6
15.1
15,397
17,048
42,889
50,010
15.8
16.6
18,039
19,093
24,850
30,917
4,390
6,136
18
20
20,460
24,782
41.2
21.1
1,200
1,200
0.0
0.0
19,260
23,582
44.9
22.4
(INR Million)
2019E
2020E
29,691
29,691
18,172
18,172
90,793
110,925
120,484
140,616
774,504
889,397
14.1
14.8
43,502
47,852
938,490 1,077,866
802,638
932,668
13.3
16.2
72,740
80,013
10.0
10.0
6,823
7,164
939,671 1,079,046
Balance sheet
Y/E March
Capital
- of which equity share capital
Reserves & Surplus
Net Worth
Borrowings
Change (%)
Other liabilities
Total Liabilities
Loans
Change (%)
Investments
Change (%)
Net Fixed Assets
Total Assets
E: MOSL Estimates
2013
24,668
17,168
37,535
62,202
282,474
34.0
21,019
365,696
323,750
30.0
18,427
139.4
5,767
365,696
2014
27,184
17,184
41,072
68,257
358,536
26.9
21,817
448,609
388,936
20.1
27,303
48.2
7,287
448,609
2015
30,837
17,203
46,562
77,399
420,906
17.4
29,117
527,422
460,425
18.4
26,492
-3.0
7,185
527,422
2016
29,668
17,534
53,237
82,905
516,157
22.6
37,221
636,283
564,679
22.6
35,633
34.5
6,962
637,463
2017
29,691
17,534
60,202
89,893
598,111
15.9
35,952
723,955
623,145
10.4
60,115
68.7
6,189
725,136
2018E
29,691
18,172
74,381
104,072
678,728
13.5
39,547
822,347
708,323
13.7
66,127
10.0
6,498
823,528
27 July 2017
8

L&T Finance Holdings
Financials and valuations
Ratios
Y/E March
Spreads Analysis (%)
Avg Yield on Loans
Avg. Yield on Earning Assets
Avg. Cost-Int. Bear. Liab.
Interest Spread
Net Interest Margin
Profitability Ratios (%)
RoE
RoA
Int. Expended/Int.Earned
Other Inc./Net Income
Efficiency Ratios (%)
Op. Exps./Net Income
Empl. Cost/Op. Exps.
Asset Quality (%)
Gross NPAs
Gross NPAs to Adv.
Net NPAs
Net NPAs to Adv.
VALUATION
Book Value (INR)
Price-BV (x)
EPS (INR)
EPS Growth YoY
Price-Earnings (x)
Dividend per share (INR)
Dividend yield (%)
E: MOSL Estimates
2013
12.8
12.8
9.4
3.3
5.0
2014
13.1
12.8
9.6
3.3
4.7
2015
13.4
13.1
9.2
3.9
5.2
2016
12.9
12.5
8.8
3.7
5.0
2017
12.7
12.1
8.3
3.8
4.9
2018E
12.7
12.0
7.8
4.2
5.2
2019E
12.7
12.0
7.8
4.2
5.1
2020E
12.7
11.9
7.7
4.2
5.1
14.2
2.3
61.0
10.5
9.2
1.5
63.1
16.9
12.5
1.8
60.4
15.7
10.2
1.5
60.5
19.5
12.4
1.5
59.5
20.3
15.6
1.9
57.2
27.4
19.1
2.3
57.4
27.8
19.8
2.5
57.3
28.6
37.4
32.9
42.2
30.0
38.9
32.7
39.2
37.1
32.4
38.7
28.5
0.0
26.4
0.0
25.4
0.0
6,596
2.0
4,063
1.3
12,430
3.2
8,895
2.3
14,281
3.1
9,630
2.1
17,354
3.1
11,540
2.1
24,900
3.9
14,610
2.3
31,769
4.4
18,616
2.6
36,352
4.4
21,015
2.6
41,884
4.4
24,238
2.6
31.9
4.2
59.8
0.8
33.9
3.0
-28.8
0.7
37.1
4.4
46.9
0.8
40.4
3.9
-11.7
0.8
44.3
3.6
5.2
33.7
30.8
0.9
0.6
50.9
3.2
7.3
39.7
22.0
1.0
0.6
60.0
2.7
10.6
44.9
15.2
1.4
0.8
71.0
2.3
13.0
22.4
12.4
1.6
1.0
27 July 2017
9

L&T Finance Holdings
Corporate profile: L&T Finance Holdings
Company description
Exhibit 1: Exhibit 19: Sensex rebased
L&T Finance Holdings (LTFH) in the holding
company for all finance-related activities of the
L&T Group. LTFH is among the largest NBFCs in
India with a loan book in excess of INR650b and
with 700+ points of presence across 24 states. It
operates in retail/wholesale lending, as well as
across 2W finance, tractor finance, microfinance,
home loans/LAP, builder finance, infra finance and
structured finance among other product lines. LTFH
is rated AA+ by CARE. Mr Dinanath Dubhashi serves
as MD & CEO of the company. He was promoted to
the position of Managing Director in July 2016.
Exhibit 10: Shareholding pattern (%)
Jun-17
Promoter
DII
FII
Others
64.2
4.1
11.0
20.8
Mar-17
66.6
3.7
11.3
18.4
Jun-16
66.7
2.0
10.0
21.3
Exhibit 11: Top holders
Holder Name
CITIGROUP GLOBAL MARKETS MAURITIUS PRIVATE
BC ASIA GROWTH INVESTMENTS
BC INVESTMENTS VI LIMITED
Prazim Trading And Investment Co. Pvt. Ltd.
% Holding
5.5
3.5
1.8
1.3
Note: FII Includes depository receipts
Exhibit 12: Top management
Name
Shailesh V Haribhakti
Dinanath Dubhashi
Apurva Rathod
Designation
Chairman
Deputy Managing Director
Company Secretary
Exhibit 13: Directors
Name
B V Bhargava
Harsh Mariwala
Nishi Vasudeva *
Vaishali Kasture *
Name
P V Bhide
R Shankar Raman
Thomas Mathew T
*Independent
Exhibit 14: Auditors
Name
B K Khare & Co
Deloitte Haskins & Sells LLP
Naina R Desai
Sharp & Tannan
Type
Statutory
Statutory
Secretarial Audit
Statutory
Exhibit 15: MOSL forecast v/s consensus
EPS
(INR)
FY17
FY18
FY19
MOSL
forecast
7.3
10.6
13.0
Consensus
forecast
7.4
10.9
13.5
Variation
(%)
-1.4
-2.8
-3.7
27 July 2017
10

L&T Finance Holdings
NOTES
27 July 2017
11

Disclosures:
The following Disclosures are being made in compliance with the SEBI Research Analyst Regulations 2014 (herein after referred to as the Regulations).
Motilal Oswal Securities Ltd. (MOSL) is a SEBI Registered Research Analyst having registration no. INH000000412. MOSL, the Research Entity (RE) as defined in the Regulations, is engaged in the business of providing Stock
broking services, Investment Advisory Services, Depository participant services & distribution of various financial products. MOSL is a subsidiary company of Motilal Oswal Financial Service Ltd. (MOFSL). MOFSL is a listed
public company, the details in respect of which are available on
www.motilaloswal.com.
MOSL is registered with the Securities & Exchange Board of India (SEBI) and is a registered Trading Member with National Stock
Exchange of India Ltd. (NSE) and Bombay Stock Exchange Limited (BSE), Metropolitan Stock Exchange Of India Ltd. (MSE) for its stock broking activities & is Depository participant with Central Depository Services Limited
(CDSL) & National Securities Depository Limited (NSDL) and is member of Association of Mutual Funds of India (AMFI) for distribution of financial products. Details of associate entities of Motilal Oswal Securities Limited are
available on the website at
http://onlinereports.motilaloswal.com/Dormant/documents/Associate%20Details.pdf
Pending Regulatory Enquiries against Motilal Oswal Securities Limited by SEBI:
SEBI pursuant to a complaint from client Shri C.R. Mohanraj alleging unauthorized trading, issued a letter dated 29th April 2014 to MOSL notifying appointment of an Adjudicating Officer as per SEBI regulations to hold
inquiry and adjudge violation of SEBI Regulations; MOSL requested SEBI to provide all documents, records, investigation report relied upon by SEBI which were referred in Show Cause Notice and also sought personal
hearing. The matter is currently pending.
MOSL, it’s associates, Research Analyst or their relative may have any financial interest in the subject company. MOSL and/or its associates and/or Research Analyst may have beneficial ownership of 1% or more securities in
the subject company at the end of the month immediately preceding the date of publication of the Research Report.
MOSL and its associate company(ies), their directors and Research Analyst and their relatives may; (a)
from time to time, have a long or short position in, act as principal in, and buy or sell the securities or derivatives thereof of companies mentioned herein. (b) be engaged in any other transaction involving such securities and
earn brokerage or other compensation or act as a market maker in the financial instruments of the company(ies) discussed herein or act as an advisor or lender/borrower to such company(ies) or may have any other
potential conflict of interests with respect to any recommendation and other related information and opinions.; however the same shall have no bearing whatsoever on the specific recommendations made by the analyst(s),
as the recommendations made by the analyst(s) are completely independent of the views of the associates of MOSL even though there might exist an inherent conflict of interest in some of the stocks mentioned in the
research report.
Research Analyst may have served as director/officer, etc. in the subject company in the last 12 month period. MOSL and/or its associates may have received any compensation from the subject company in
the past 12 months.
In the last 12 months period ending on the last day of the month immediately preceding the date of publication of this research report, MOSL or any of its associates may have:
a)
managed or co-managed public offering of securities from subject company of this research report,
b)
received compensation for investment banking or merchant banking or brokerage services from subject company of this research report,
c)
received compensation for products or services other than investment banking or merchant banking or brokerage services from the subject company of this research report.
d)
Subject Company may have been a client of MOSL or its associates during twelve months preceding the date of distribution of the research report.
MOSL and it’s associates have not received any compensation or other benefits from the subject company or third party in connection with the research report. To enhance transparency, MOSL has incorporated a Disclosure
of Interest Statement in this document. This should, however, not be treated as endorsement of the views expressed in the report. MOSL and / or its affiliates do and seek to do business including investment banking with
companies covered in its research reports. As a result, the recipients of this report should be aware that MOSL may have a potential conflict of interest that may affect the objectivity of this report. Compensation of Research
Analysts is not based on any specific merchant banking, investment banking or brokerage service transactions.
Terms & Conditions:
This report has been prepared by MOSL and is meant for sole use by the recipient and not for circulation. The report and information contained herein is strictly confidential and may not be altered in any way, transmitted to,
copied or distributed, in part or in whole, to any other person or to the media or reproduced in any form, without prior written consent of MOSL. The report is based on the facts, figures and information that are considered
true, correct, reliable and accurate. The intent of this report is not recommendatory in nature. The information is obtained from publicly available media or other sources believed to be reliable. Such information has not
been independently verified and no guaranty, representation of warranty, express or implied, is made as to its accuracy, completeness or correctness. All such information and opinions are subject to change without notice.
The report is prepared solely for informational purpose and does not constitute an offer document or solicitation of offer to buy or sell or subscribe for securities or other financial instruments for the clients. Though
disseminated to all the customers simultaneously, not all customers may receive this report at the same time. MOSL will not treat recipients as customers by virtue of their receiving this report.
Analyst Certification
The views expressed in this research report accurately reflect the personal views of the analyst(s) about the subject securities or issues, and no part of the compensation of the research analyst(s) was, is, or will be directly or
indirectly related to the specific recommendations and views expressed by research analyst(s) in this report.
L&T Finance Holdings
Disclosure of Interest Statement
§
Analyst ownership of the stock
L&T Finance Holdings
No
A graph of daily closing prices of securities is available at
www.nseindia.com, www.bseindia.com.
Research Analyst views on Subject Company may vary based on Fundamental research and Technical Research. Proprietary
trading desk of MOSL or its associates maintains arm’s length distance with Research Team as all the activities are segregated from MOSL research activity and therefore it can have an independent view with regards to
subject company for which Research Team have expressed their views.
Regional Disclosures (outside India)
This report is not directed or intended for distribution to or use by any person or entity resident in a state, country or any jurisdiction, where such distribution, publication, availability or use would be contrary to law,
regulation or which would subject MOSL & its group companies to registration or licensing requirements within such jurisdictions.
For Hong Kong:
This report is distributed in Hong Kong by Motilal Oswal capital Markets (Hong Kong) Private Limited, a licensed corporation (CE AYY-301) licensed and regulated by the Hong Kong Securities and Futures Commission (SFC)
pursuant to the Securities and Futures Ordinance (Chapter 571 of the Laws of Hong Kong) “SFO”. As per SEBI (Research Analyst Regulations) 2014 Motilal Oswal Securities (SEBI Reg No. INH000000412) has an agreement with
Motilal Oswal capital Markets (Hong Kong) Private Limited for distribution of research report in Hong Kong. This report is intended for distribution only to “Professional Investors” as defined in Part I of Schedule 1 to SFO. Any
investment or investment activity to which this document relates is only available to professional investor and will be engaged only with professional investors.” Nothing here is an offer or solicitation of these securities,
products and services in any jurisdiction where their offer or sale is not qualified or exempt from registration. The Indian Analyst(s) who compile this report is/are not located in Hong Kong & are not conducting Research
Analysis in Hong Kong.
For U.S.
Motilal Oswal Securities Limited (MOSL) is not a registered broker - dealer under the U.S. Securities Exchange Act of 1934, as amended (the"1934 act") and under applicable state laws in the United States. In addition MOSL is
not a registered investment adviser under the U.S. Investment Advisers Act of 1940, as amended (the "Advisers Act" and together with the 1934 Act, the "Acts), and under applicable state laws in the United States.
Accordingly, in the absence of specific exemption under the Acts, any brokerage and investment services provided by MOSL, including the products and services described herein are not available to or intended for U.S.
persons. This report is intended for distribution only to "Major Institutional Investors" as defined by Rule 15a-6(b)(4) of the Exchange Act and interpretations thereof by SEC (henceforth referred to as "major institutional
investors"). This document must not be acted on or relied on by persons who are not major institutional investors. Any investment or investment activity to which this document relates is only available to major institutional
investors and will be engaged in only with major institutional investors. In reliance on the exemption from registration provided by Rule 15a-6 of the U.S. Securities Exchange Act of 1934, as amended (the "Exchange Act") and
interpretations thereof by the U.S. Securities and Exchange Commission ("SEC") in order to conduct business with Institutional Investors based in the U.S., MOSL has entered into a chaperoning agreement with a U.S.
registered broker-dealer, Motilal Oswal Securities International Private Limited. ("MOSIPL"). Any business interaction pursuant to this report will have to be executed within the provisions of this chaperoning agreement.
The Research Analysts contributing to the report may not be registered /qualified as research analyst with FINRA. Such research analyst may not be associated persons of the U.S. registered broker-dealer, MOSIPL, and
therefore, may not be subject to NASD rule 2711 and NYSE Rule 472 restrictions on communication with a subject company, public appearances and trading securities held by a research analyst account.
For Singapore
Motilal Oswal Capital Markets Singapore Pte Limited is acting as an exempt financial advisor under section 23(1)(f) of the Financial Advisers Act(FAA) read with regulation 17(1)(d) of the Financial Advisors Regulations and is a
subsidiary of Motilal Oswal Securities Limited in India. This research is distributed in Singapore by Motilal Oswal Capital Markets Singapore Pte Limited and it is only directed in Singapore to accredited investors, as defined in
the Financial Advisers Regulations and the Securities and Futures Act (Chapter 289), as amended from time to time. In respect of any matter arising from or in connection with the research you could contact the following
representatives of Motilal Oswal Capital Markets Singapore Pte Limited:
Disclaimer:
The report and information contained herein is strictly confidential and meant solely for the selected recipient and may not be altered in any way, transmitted to, copied or distributed, in part or in whole, to any other person
or to the media or reproduced in any form, without prior written consent. This report and information herein is solely for informational purpose and may not be used or considered as an offer document or solicitation of
offer to buy or sell or subscribe for securities or other financial instruments. Nothing in this report constitutes investment, legal, accounting and tax advice or a representation that any investment or strategy is suitable or
appropriate to your specific circumstances. The securities discussed and opinions expressed in this report may not be suitable for all investors, who must make their own investment decisions, based on their own investment
objectives, financial positions and needs of specific recipient. This may not be taken in substitution for the exercise of independent judgment by any recipient. Each recipient of this document should make such investigations
as it deems necessary to arrive at an independent evaluation of an investment in the securities of companies referred to in this document (including the merits and risks involved), and should consult its own advisors to
determine the merits and risks of such an investment. The investment discussed or views expressed may not be suitable for all investors. Certain transactions -including those involving futures, options, another derivative
products as well as non-investment grade securities - involve substantial risk and are not suitable for all investors. No representation or warranty, express or implied, is made as to the accuracy, completeness or fairness of
the information and opinions contained in this document. The Disclosures of Interest Statement incorporated in this document is provided solely to enhance the transparency and should not be treated as endorsement of the
views expressed in the report. This information is subject to change without any prior notice. The Company reserves the right to make modifications and alternations to this statement as may be required from time to time
without any prior approval. MOSL, its associates, their directors and the employees may from time to time, effect or have effected an own account transaction in, or deal as principal or agent in or for the securities
mentioned in this document. They may perform or seek to perform investment banking or other services for, or solicit investment banking or other business from, any company referred to in this report. Each of these entities
functions as a separate, distinct and independent of each other. The recipient should take this into account before interpreting the document. This report has been prepared on the basis of information that is already
available in publicly accessible media or developed through analysis of MOSL. The views expressed are those of the analyst, and the Company may or may not subscribe to all the views expressed therein. This document is
being supplied to you solely for your information and may not be reproduced, redistributed or passed on, directly or indirectly, to any other person or published, copied, in whole or in part, for any purpose. This report is not
directed or intended for distribution to, or use by, any person or entity who is a citizen or resident of or located in any locality, state, country or other jurisdiction, where such distribution, publication, availability or use would
be contrary to law, regulation or which would subject MOSL to any registration or licensing requirement within such jurisdiction. The securities described herein may or may not be eligible for sale in all jurisdictions or to
certain category of investors. Persons in whose possession this document may come are required to inform themselves of and to observe such restriction. Neither the Firm, not its directors, employees, agents or
representatives shall be liable for any damages whether direct or indirect, incidental, special or consequential including lost revenue or lost profits that may arise from or in connection with the use of the information.
The
person accessing this information specifically agrees to exempt MOSL or any of its affiliates or employees from, any and all responsibility/liability arising from such misuse and agrees not to hold MOSL or any of its affiliates or
employees responsible for any such misuse and further agrees to hold MOSL or any of its affiliates or employees free and harmless from all losses, costs, damages, expenses that may be suffered by the person accessing this
information due to any errors and delays.
Registered Office Address: Motilal Oswal Tower, Rahimtullah Sayani Road, Opposite Parel ST Depot, Prabhadevi, Mumbai-400025; Tel No.: 022-3980 4263; www.motilaloswal.com. Correspondence Address: Palm Spring
Centre, 2nd Floor, Palm Court Complex, New Link Road, Malad (West), Mumbai- 400 064. Tel No: 022 3080 1000. Compliance Officer: Neeraj Agarwal, Email Id:
na@motilaloswal.com,
Contact No.:022-30801085.
Registration details of group entities.: MOSL: NSE (Cash): INB231041238; NSE (F&O): INF231041238; NSE (CD): INE231041238; BSE (Cash): INB011041257; BSE(F&O): INF011041257; BSE(CD); MSE(Cash): INB261041231;
MSE(F&O): INF261041231; MSE(CD): INE261041231; CDSL: IN-DP-16-2015; NSDL: IN-DP-NSDL-152-2000; Research Analyst: INH000000412. AMFI: ARN 17397. Investment Adviser: INA000007100. Motilal Oswal Asset
Management Company Ltd. (MOAMC): PMS (Registration No.: INP000000670) offers PMS and Mutual Funds products. Motilal Oswal Wealth Management Ltd. (MOWML): PMS (Registration No.: INP000004409) offers wealth
management solutions. *Motilal Oswal Securities Ltd. is a distributor of Mutual Funds, PMS, Fixed Deposit, Bond, NCDs, Insurance and IPO products. * Motilal Oswal Commodities Broker Pvt. Ltd. offers Commodities
Products. * Motilal Oswal Real Estate Investment Advisors II Pvt. Ltd. offers Real Estate products. * Motilal Oswal Private Equity Investment Advisors Pvt. Ltd. offers Private Equity products
27 July 2017
12