28 July 2017
Update
| Sector:
Oil & Gas
BSE SENSEX
32,383
S&P CNX
10,021
HPCL
Buy
CMP: INR374
TP: INR427 (+14%)
Motilal Oswal values your support in
the Asiamoney Brokers Poll 2017 for
India Research, Sales and Trading
team. We
request your ballot.
ONGC-HPCL merger
Finding the right value for HPCL
The Department of Investment and Public Asset Management (DIPAM) has invited bids
for appointing an advisor for strategic sale of the government’s 51.11% stake in HPCL to
ONGC. The bid document mentions the following methodologies for achieving the best
valuation for HPCL: (1) discounted cash flow, (2) relative valuation, (3) asset-based
valuation, and (4) market valuation. We study the four possibilities to estimate what the
reserve price could be. We also take a look at the possibility of a control premium.
However, for this report, we leave aside the issue of open offer. While theoretically, an
open offer is likely, legal interpretations may be complex and contradictory.
Stock Info
Bloomberg
Equity Shares (m)
52-Week Range (INR)
1, 6, 12 Rel. Per (%)
M.Cap. (INR b)
M.Cap. (USD b)
Avg Val, INRm
Free float (%)
HPCL IN
1,524
393/254
7/-11/23
559.3
8.7
1893.0
48.9
2019E
2,085
100.6
49.7
32.6
10.4
173.6
20.0
12.0
11.5
2.2
Discounted cash flow method
Using a GRM of USD5.1/bbl, net marketing margin of INR1.1/liter, stretched till
2038, but taking nil terminal value, we arrive at a DCF valuation of INR470/share
for HPCL. Our valuation uses a WACC of 11%. Nil terminal growth beyond 2038
suggests the possibility of disruptive technologies like electric vehicles having an
adverse impact on refineries. We have only taken imminent capex like expansion of
Vizag refinery, and ignored larger ones like petrochemicals complex in Andhra
Pradesh and participation in 60mmtpa West Coast refinery.
Financials Snapshot (INR m)
2017 2018E
Y/E Mar
1,870 1,855
Net Sales
105.8
91.4
EBITDA
62.1
45.0
PAT
40.7
29.5
EPS (INR)
66.6 (27.5)
Gr. (%)
133.4 152.5
BV/Sh (INR)
32.4
20.6
RoE (%)
18.8
12.3
RoCE (%)
9.2
12.7
P/E (x)
2.8
2.5
P/BV (x)
Relative valuation
Global peers are trading at 6.9x FY19E EV/EBITDA and 10x FY19E P/E. Indian peers
are also trading at 6.9x FY19E EV/EBITDA and a little lower 9.5x FY19E P/E. Though
there aren’t many comparables for pure marketing plays, Caltex Australia, Z
Energy, New Zealand and Petron Corp are trading at an average 7.5x FY19E
EV/EBITDA and 12.3x FY19E PE. Our SOTP valuation of HPCL implies 7.8x FY19E
EV/EBITDA and 11.5x FY19E EPS.
Shareholding pattern (%)
As On
Jun-17 Mar-17 Jun-16
Promoter
51.1
51.1
51.1
DII
10.1
9.6
14.5
FII
16.9
16.9
19.4
Others
21.9
22.4
15.0
FII Includes depository receipts
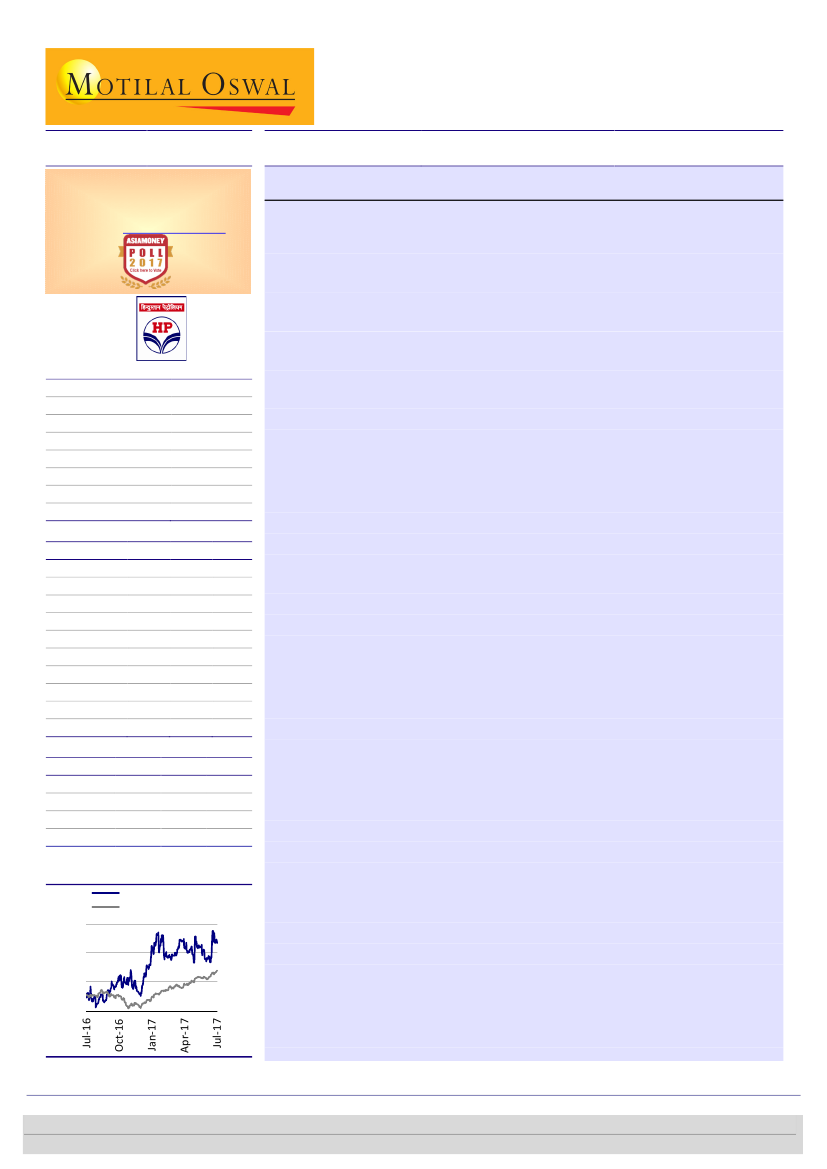
Stock Performance (1-year)
HPCL
Sensex - Rebased
400
350
300
250
Asset valuation models
HPCL’s consolidated FY18E book value is INR164. It is not correct to look at long-
term average P/BV due to regulations prior to deregulation of diesel in 2014. Since
2015, the stock has traded at average P/BV of 1.7x. For the last one year, due to
better GRMs, the stock has traded at 2.2x. At 2.2x, the stock is valued at INR361.
We also use replacement method (Exhibit 4) to value the assets. Our replacement
cost methodology suggests a value of INR350/share.
Market valuation
The stock declined 10% after 4QFY17 results, partly on account of cloud over
merger, and partly on account of expected inventory losses in 1QFY18 and
expected market share loss to private players. However, with expected premium
valuation for sale to ONGC, it has appreciated. Using the last 60 days’ average, the
valuation of the company stands at INR356/share.
Motilal Oswal research is available on www.motilaloswal.com/Institutional-Equities, Bloomberg, Thomson Reuters, Factset and S&P Capital.
Investors are advised to refer through important disclosures made at the last page of the Research Report.
Swarnendu Bhushan- Research Analyst
(Swarnendu.Bhushan@MotilalOswal.com); +91 22 6129 1529
Abhinil Dahiwale- Research Analyst
(Abhinil.Dahiwale@motilaloswal.com); +91 22 3980 4309