8 August 2017
Motilal Oswal values your support in the
Asiamoney Brokers Poll 2017 for India
Research, Sales and Trading team.
We
request your ballot.
Today’s top research idea
Strides Shasun - Initiating Coverage: Making great strides
v
Strides (STR) is set to deliver 42% earnings CAGR over FY17-20 on the back of
significant investments the company has made in the last 2-3 years.
v
Through Solara, which will house its API business, it is well-placed to capitalize
on the good opportunity in the API space. Its niche portfolio, consistent
compliance, and sizable manufacturing capacity stand it in good stead.
v
US revenue should multiply ~3x over FY17-20, driven by existing ANDAs
pending for approval and aggressive filing.
v
By expanding its product offerings, tying up with the largest distributor, and
enhancing reach by catering to standalone pharmacies, we expect STR to be
on a strong growth trajectory in Australia as well.
v
We initiate coverage with a
BUY
rating and an SOTP-based target price of
INR1,300.
Market snapshot
Equities - India
Close
Chg .%
Sensex
32,274
-0.2
Nifty-50
10,057
-0.1
Nifty-M 100
18,570
1.1
Equities-Global
Close
Chg .%
S&P 500
2,481
0.2
Nasdaq
6,384
0.5
FTSE 100
7,532
0.3
DAX
12,257
-0.3
Hang Seng
11,054
0.5
Nikkei 225
20,056
0.5
Commodities
Close
Chg .%
Brent (US$/Bbl)
52
-0.1
Gold ($/OZ)
1,258
-0.1
Cu (US$/MT)
6,384
0.6
Almn (US$/MT)
1,946
3.0
Currency
Close
Chg .%
USD/INR
63.8
0.4
USD/EUR
1.2
0.1
USD/JPY
110.7
0.0
YIELD (%)
Close
1MChg
10 Yrs G-Sec
6.5
0.0
10 Yrs AAA Corp
7.5
0.0
Flows (USD b)
7-Aug
MTD
FIIs
0.0
-0.2
DIIs
0.0
0.4
Volumes (INRb)
7-Aug
MTD*
Cash
283
295
F&O
2,981
5,492
Note: YTD is calendar year, *Avg
YTD.%
21.2
22.9
29.4
YTD.%
10.8
18.6
5.4
6.8
17.7
4.9
YTD.%
-6.5
9.2
15.6
14.2
YTD.%
-6.1
12.1
-5.3
YTDchg
-0.1
-0.1
YTD
8.6
4.4
YTD*
288
5,056
Research covered
Cos/Sector
Strides Shasun
Tata Steel
Hindalco (Novelis)
Britannia Inds.
Amara Raja Batt.
Eveready Inds.
Metals Weekly
Key Highlights
Initiating Coverage (Making great strides)
Strong operating performance; Strong markets have given flip to FY18
outlook
Novelis delivers strong operating performance
Broadly in-line performance; base business volume growth at ~1%
Below estimate; Adverse mix, competitive pressure dents profitability
LED segment robust; Flashlight segment to recover from GST setbacks
Domestic steel prices gain, sponge prices rise sharply
Results Expectation BOI | ENDU | GLXO | JAGP | JSPL | KSCL | MUTH | SRF | TMX
Hike in GST cess on luxury cars will dent Make in India, say carmakers
Piping hot news
v
Makers of sports utility vehicles (SUVs) and luxury cars are protesting the GST
Council’s plan to raise the cess on such products from 15% to as much as 25%,
warning that the move will lead to production cuts and job losses and dent the
“Make in India” initiative.
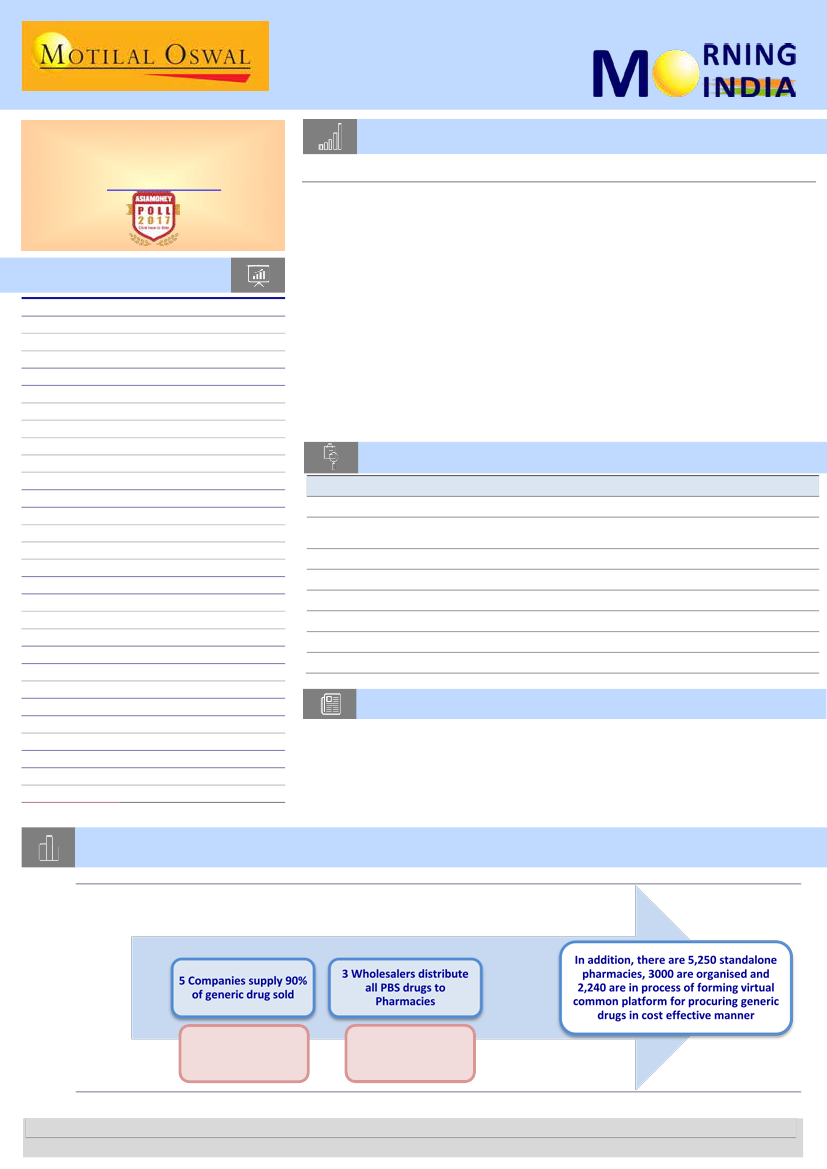
Chart of the Day: Strides Shasun - Initiating Coverage: Making great strides
Structure of Australian generic pharma market
Apotex | Mylan |
Arrow | Sandoz
Amneal
Sigma
Symbion
API
Research Team (Gautam.Duggad@MotilalOswal.com)
Motilal Oswal research is available on www.motilaloswal.com/Institutional-Equities, Bloomberg, Thomson Reuters, Factset and S&P Capital.
Investors are advised to refer through important disclosures made at the last page of the Research Report.

In the news today
Kindly click on textbox for the detailed news link
1
Sebi asks NSE, BSE to act
against 331 suspected shell
companies
Sebi on Monday directed bourses
to initiate action against 331
suspected shell companies that
are listed and these scrips will not
be available for trading this
month, according to a
communication…
2
Industry worried about ramifications from Supreme Court's Odisha
mining order
The Supreme Court’s landmark order imposing an estimated Rs 25,000
crore penalty on iron ore and manganese miners in Odisha continues to
rattle the sector, with serious implications for mining operations across the
country and clearances obtained in the past…
3
The Insurance Regulatory and
Development Authority of India
(IRDA) said its order directing the
shotgun marriage of Sahara India
Life Insurance Co. Ltd and ICICI
Prudential Life Insurance Co. Ltd
was the culmination of a two-year
process…
IRDA defends order on merger
of Sahara Life, ICICI Prudential
4
PSU banks have written off Rs
2.49 lakh crore of loans in last
5 years: Finance Ministry
Public sector banks have “written
off” nearly Rs 2.5 lakh crore loans
in the last five financial years, the
finance ministry said quoting RBI
data. As many as 27 public sector
banks, including SBI and its five
associates, in 2016-17 have
written off Rs 81,683 crore, the
highest in the last five fiscals…
5
Britannia to set up Rs1,000
crore plant in Maharashtra’s
Ranjangaon food park
Biscuit-maker Britannia Industries
Ltd will set up its biggest
manufacturing facility at
Ranjangaon in Maharashtra at an
investment of Rs1,000 crore,
managing director Varun Berry
said on Monday…
6
Banks to shut out builders
without RERA listing
Builders who have been thinking
of ways to beat the new Real
Estate Regulation Act are fast
running out of time as banks, in
consultation with the Reserve
Bank of India, have decided not to
extend loans to those projects
which have not been registered
under RERA…
7
GIC of India files for IPO to
raise Rs10,000 crore
State-owned reinsurance
company General Insurance Corp.
of India (GIC) on Monday filed the
draft red herring prospectus
(DRHP) for its initial public offering
(IPO).The IPO will see a total stake
dilution of 14.22%, according to
the DRHP available on the website
of one of the investment banks
managing the share sale...
8 August 2017
2

Initiating Coverage | Sector: Healthcare
Strides Shasun
BSE Sensex
32,325
S&P CNX
10,066
CMP: INR1000
TP: INR1,300 (+30%)
Buy
Stock Info
Bloomberg
Equity Shares (m)
52-Week Range (INR)
1, 6, 12 Rel. Per (%)
M.Cap. (INR b)
M.Cap. (USD b)
Avg Val, INRm
Free float (%)
STR IN
89.4
1259/849
-1/-30/-27
94.7
1.5
433
68.9
Strides Shasun (STR) is a first generation, vertically integrated global pharmaceuticals
company, with business interests in differentiated pharma and branded generics. It
sells formulations in regulated markets (51% of FY17 sales), emerging markets (18% of
FY17 sales), and to global institutions (16% of FY17 sales). The API business, which
would soon largely be a part of Solara, constituted 15% of FY17 sales.
Making great strides
Robust outlook led by higher sales growth and improved asset utilization
n
Financial Snapshot (INR b)
Y/E Mar
FY17 FY18E FY19E
Sales
34.8 43.9 54.5
EBITDA
6.4
8.3 11.0
NP
2.9
4.2
6.7
EPS (Rs)
32.3 47.4 74.8
EPS Gr (%)
108.2 46.9 57.9
BV/Sh (INR)
303.3 341.6 401.9
P/E (x)
31.0 21.1 13.4
P/BV (x)
3.3
2.9
2.5
RoE (%)
10.7 14.7 20.1
RoCE (%)
7.8
9.2 12.2
Shareholding pattern (%)
As On
Jun'17 Mar'17 Dec'16
Promoter
31.1
31.1
31.1
DII
14.3
12.9
11.4
FII
34.5
34.5
36.2
Others
20.1
21.6
21.3
FII Includes depository receipts
n
n
n
n
Strides Shasun
Making great strides
STR has rebuilt its R&D infrastructure, instituted a strong compliance culture
across the organization, backed by suitable IT investments, and integrated its
manufacturing operations to reduce external dependence. We believe it is now in
a position to begin reaping the benefits of the ~USD550m investments it has made
in focus geographies in the last three years.
Given the consistent compliance history of its API facilities and low cost
manufacturing, we expect the API business (through Solara) to deliver 23%
revenue CAGR over FY17-20 and 18-20% EBITDA margin.
Excluding the API business, we expect revenue to grow at a CAGR of 20% over
FY17-20 to INR52b, driven by 43% CAGR in the US business, 16% CAGR in the
Australia business, 15% CAGR in emerging markets and 15% CAGR in the
institutional business. Adjusted earnings of Strides Pharma are likely to grow at a
CAGR of 44%.
In the US, STR has 26 pending ANDAs and has guided 15-20 ANDA filings per year –
largely niche products – in the next 2-3 years. In Australia, dominated by a few
manufacturers and distributors, it is among the top-3 generic players. Its exclusive
agreement with the largest distributor and ongoing tie-ups with standalone
pharmacies stand it in good stead. In the institutional business, its backward
integration, local manufacturing for ARV/anti-malaria, and awareness drives on
Hep-C in conjunction with governments of developing nations give it an edge.
We value the STR’s pharma business at 18x FY19E earnings (industry average P/E
multiple for midcap pharma) and Solara at an EV of 13x FY19E EBITDA to arrive at
a price target of INR1,300. In addition to robust performance expected in the
pharma business, we believe there is significant value accretion potential in the
API business. We initiate coverage with a Buy rating.
Regulated market business – key growth driver
n
n
tushar.manudhane@motilaloswal.com
Tushar Manudhane
+
91 22 3010 2498
n
STR has 26 ANDAs pending for approval. The target approval dates are
within the next 6-10 months, providing visibility of higher approvals.
STR has guided 15-20 ANDA filings per year over next 2-3 years. With
reduced timeline for approval, we expect the strong pace of approvals to
continue over the next 2-3 years. STR made USD100m (annualized) from 18
products (commercialized). Based on product development capability, we
expect STR to have additional run rate of USD55m-60m per year over the
next 2-3 years.
STR has re-entered the Australia generic pharma market through the
acquisition of Aspen’s portfolio under Arrow Pharma. It has been working on
ree fronts to aid increase in sales growth and profitability
3
8 August 2017

Stock Performance (1-year)
three fronts to aid increase in sales growth and profitability. It is expanding its
generic product basket, securing supplies via tie-up with largest distributor, and
expanding reach by catering to standalone pharmacies also.
n
Overall, we expect STR to deliver 26% CAGR in regulated markets over FY17-20.
Backward integration, newer products to drive institutional business
n
n
Over the last couple of years, STR added anti-malaria products to its existing
ARV segment. Also, it is developing niche ARVs for medium-term growth. It also
added Sofosbuvir-based Hep-C products to its institutional portfolio.
In addition, STR has integrated manufacturing operations, which have not only
increased capacity but also helped secure supply of APIs for its formulations,
providing increased scope of business.
Largely inorganically, STR has expanded its reach from South India to Pan India;
in the Africa market, STR got access to East Africa, adding to its existing
presence in West and French Africa. We expect 14.8% CAGR in emerging market
sales to INR8b over FY17-20.
STR has proactively raised the bar of compliance at its facilities to reduce
regulatory risk. It has fully-integrated, compliant laboratories, with paperless
operations. It also has fully-integrated manufacturing equipment, with complete
control on operations and data management.
STR has improved compliance culture through open communication and
employee empowerment, thus reducing regulatory risk, considerably. Notably, it
has had four USFDA inspections in the recent past, with zero 483s.
With significant investments in R&D, reduced outsourcing of APIs, strong
compliance culture, increased automation, and presence in diversified markets,
we believe STR is poised to deliver strong return ratios through improved asset
turnover and higher share of better margin regulated market business.
We expect 20% CAGR in sales, 25% CAGR in EBITDA, and 44% CAGR in PAT of
Strides Pharma over FY17-20. Solara’s API business has niche portfolio and
superior margin compared to commodity business, hence, we ascribe 40%
premium multiple to 13x EV/EBITDA. We value STR on sum-of-the-parts (SOTP),
valuing the pharma business at 18x FY19E earnings (average midcap pharma P/E
multiple) and Solara at an EV of 13x FY19E EBITDA to arrive at price target of
INR1,300.
Branded generics the name of the game in emerging markets
n
Extensive efforts towards consistent compliance to reduce regulatory risk
n
n
Valuation and view
n
n
8 August 2017
4

7 August 2017
1QFY18 Results Update | Sector: Metals
Tata Steel
BSE SENSEX
32,274
Bloomberg
Equity Shares (m)
M.Cap.(INRb)/(USDb)
52-Week Range (INR)
1, 6, 12 Rel. Per (%)
Avg Val, INRm/ Vol m
Free float (%)
S&P CNX
10,057
TATA IN
971.4
583.0 / 8.7
602 / 355
5/13/43
2936
68.7
CMP: INR600
TP: INR591(-1%)
Strong operating performance
Strong markets have given flip to FY18 outlook
Neutral
Tata Steel (TATA) reported strong 1QFY18 consolidated EBITDA of INR49.7b (est.
INR38b). Operating EBITDA of India (TSI) was in-line at INR29.7b. TSE (Europe) and
forex gains in raw material SPVs surprised positively.
Financials & Valuations (INR b)
Y/E Mar
2017 2018E 2019E
Sales
1,123 1,241 1,257
EBITDA
170
208
203
Adj. PAT
37
63
62
Adj. EPS (INR)
37.9
65.1
64.3
EPS Gr(%)
394.2
71.6
-1.3
BV/Sh. (INR)
330
371
425
RoE (%)
15.7
18.6
16.2
RoCE (%)
9.4
11.4
10.4
P/E (x)
15.8
9.2
9.3
P/BV
1.8
1.6
1.4
1QFY18 highlights:
n
n
n
TSI sales increased 28% YoY to 2.75mt. EBITDA per ton declined 21% QoQ to
INR10,786/t on lower margins in FAMD & steel business.
TSE reported strong EBITDA of INR12.5b and EBITDA/t of USD81/t (est. USD48)
Other Subsidiaries contribution was strong at INR7.5b aided by forex gains.
Upgrading FY18E EBITDA on strong markets; Maintain Neutral
n
Estimate change
TP change
Rating change
n
n
n
TSE margin outlook has improved significantly on exit from all of non-strip
businesses, depreciation of GBP, de-risking of pension and anti-dumping action
against Chinese imports. Margins in 2Q and 3QFY18E are likely to lower due to
seasonal factors.
TSE is in final stages of de-risking pension scheme.
Strong international market is helping balance domestic supply and pricing
power to offset cost increase. We expect margins to be stronger during 2Q &
3QFY18E. Therefore, we are raising FY18E est. by 6% to INR144b EBITDA. We
are also raising TSE& other subs. estimate by 18% to INR64b EBITDA. Thus,
consolidated EBITDA is increased by 12% to INR208b for FY18E.
Global steel market has been trending strong on easing pressure from Chinese
exports, which has boosted margins in FY18E. But, we are not sure about its
sustainability in FY19E. Therefore, we keeping FY19 estimates unchanged.
Target price is increased marginally to INR591/share. Maintain Neutral.
FY18E
2Q
3Q
311,365 305,592
18.1
9.3
50,450 53,996
70
53
16.2
17.7
125
131
13,106 13,350
14,735 14,955
1,213 1,343
23,822 27,033
FY17
FY18E
vs Est
(%)
-1
-5
31
212
32
36
3
4
18
94
40
58
-19
29
116
Quarterly Performance (Consolidated) INR million
Y/E March
Net Sales
Change (YoY %)
EBITDA
Change (YoY %)
(% of Net Sales)
EBITDA(USD/tss)
Interest
Depreciation
Other Income
PBT (before EO Inc.)
EO Income(exp)
PBT (after EO Inc.)
Total Tax
% Tax
Reported PAT
Adj. PAT (after MI & asso)
Change (YoY %)
1Q
252,298
-16.7
32,420
16.9
12.8
90
10,707
12,417
1,367
10,662
-35,231
-24,568
7,405
69.4
-31,973
3,400
FY17
2Q
3Q
263,710 279,565
-10.0
-0.3
29,700 35,393
62.3 356.3
11.3
12.7
79
86
13,511 13,874
14,677 13,797
1,084 1,301
2,597 9,022
634
284
3,230 9,306
3,634 6,984
139.9
77.4
-403 2,322
-1,127 2,035
4Q
338,960
14.9
70,252
218.6
20.7
154
12,631
15,892
1,522
43,250
-45,199
-1,948
9,760
22.6
-11,708
33,435
1Q
4Q
1Q
295,568
328,912 1,134,532 1,241,436 297,626
17.2
-3.0
-3.2
9.4
18.0
49,740
53,769 167,764 207,955 37,964
53.4
-23
121.2
24.0
17.1
16.8
16.3
14.8
16.8
12.8
132
119
104
127
98
13,437
13,380
50,723
53,274 13,094
15,011
15,118
56,784
59,819 14,399
1,555
1,315
5,274
5,426
1,315
22,846
26,586
65,531 100,287 11,787
-6,289
-79,512
-6,289
16,557 23,822 27,033 26,586 -13,981
93,998 11,787
7,405 8,320 9,437 9,251
27,782
34,414
4,696
32.4
34.9
34.9
34.8
42.4
34.3
39.8
9,152 15,502 17,596 17,335 -41,762
59,584
7,091
15,352 15,551 17,641 17,363
37,742
65,908
7,103
307.8
74.6
8 August 2017
5

7 August 2017
Q1FY18 Results Update | Sector: Metals
Hindalco
BSE SENSEX
32,274
Bloomberg
Equity Shares (m)
M.Cap.(INRb)/(USDb)
52-Week Range (INR)
1, 6, 12 Rel. Per (%)
Avg Val, INRm
Free float (%)
S&P CNX
10,057
HNDL IN
2,243
510.7 / 8.0
229 / 139
14/9/43
2281
65.3
CMP: INR228
TP: INR310(+36%)
Buy
Novelis delivers strong operating performance
Evaluating growth options as it will soon fully sweat assets
Novelis reported another strong quarter, with adj. EBITDA growing 8% YoY to
USD289m (7% beat) in 1QFY18, driven by higher volumes and benefit of lower-cost
scrap. Interest cost declined 23% YoY to USD62m on refinancing debt at lower cost.
Adj. PAT was up~4x YoY at USD101m. FCF stood at negative USD77m (increase of
USD69m YoY) on seasonal working capital increase and higher LME.
Volumes rebound; strong performance in N. America drives margins
Shipments grew 4% YoY to 785kt, driven by a rebound in cans. Can volumes were
secured under long-term contracts, which has improved visibility. Adj. EBITDA per
ton increased by USD13 YoY to USD368 on higher margins in N. America, partly
offset by unwinding of FX gains in S. America.
EBITDA guidance of USD1.1-1.15b; FCF guidance raised
EBITDA was guided at USD1.1-1.15b for FY18 on improved visibility in cans and
higher auto mix. Pricing risk in cans is now behind with the long-term contracts.
FCF guidance is USD400-450m on higher operating profit and lower interest cost,
partly offset by likely working capital rise. Volume is expected to increase ~3% in
FY18E. Auto will drive further growth in FY19E.
Evaluating growth opportunities; Maintain Buy
Novelis is now evaluating both organic and inorganic growth opportunities, as it
has now contracted can volumes, and auto capacity will be fully utilized soon. It is
seeking opportunity in auto, leveraging on its first-mover advantage, customer
relationship and strong demand. Light-weighting and electric vehicles would
continue driving aluminum demand in auto. It expects auto FRP demand to grow at
a CAGR of 13-15% in N. America and 10-12% in Europe over 2017-21 – its target
markets. Amid Novelis’ strong market positioning and HNDL’s low-cost Indian
operations, we remain positive on the stock. TP is INR310.
Buy.
USD million
FY17
2Q
3Q
773
750
-1.9
-3.7
2,361 2,313
-4.9
-1.7
270
255
14.4
7.1
11.4
11.0
349
340
79
65
90
88
101
102
(163)
9
-62
111
27
47
-43.5
42.3
-89
64
4Q
789
0.1
2,621
9.1
292
5.4
11.1
370
59
93
140
(52)
88
41
46.6
47
1Q
785
4.0
2,669
16.2
289
7.8
10.8
368
62
90
137
7
144
43
29.9
101
FY18
2QE
3QE
788
765
2.0
2.0
2,571 2,494
8.9
7.8
282
279
4.6
9.3
11.0
11.2
358
364
58
58
94
96
130
125
-
-
130
125
39
38
30.0
30.0
91
88
FY17
4QE
805
2.0
2,624
0.1
296
1.3
11.3
368
57
97
141
-
141
42
30.0
99
3,067
-1.8
9,591
-2.8
1,085
12.6
11.3
354
283
360
442
(245)
197
151
76.6
46
FY18E
3,143
2.5
10,358
8.0
1,146
5.6
11.1
365
235
377
534
7
541
162
30.0
379
1QE
770
2.0
2,576
12.2
271
1.1
10.5
352
59
92
120
-
120
36
30.0
84
vs Est
(%)
2
4
7
5
5
-2
14
20
19
20
Financials & Valuations (INR b)
Y/E Mar
2017E 2018E
Net Sales
1,001.8 1,046
EBITDA
140.8 143.6
PAT
36.0
49.3
EPS (INR)
16.2
22.1
Gr. (%)
35.1
36.8
BV/Sh (INR)
129.9 158.3
RoE (%)
14.0
15.4
RoCE (%)
8.8
8.7
P/E (x)
14.1
10.3
P/BV (x)
1.8
1.4
2019E
1,077
150.2
58.6
26.3
18.9
183.1
15.4
9.0
8.7
1.2
Estimate change
TP change
Rating change
Quarterly Performance (Novelis)
Y/E March
Sales (000 tons)
Change (YoY %)
Net Sales
Change (YoY %)
EBITDA (adjusted)
Change (YoY %)
As % of Net Sales
EBITDA per ton (USD)
Interest
Depreciation
PBT (before EO item)
Extra-ordinary Income
PBT (after EO item)
Total Tax
% Tax
PAT before minority
1Q
755
-1.7
2,296
-12.8
268
25.8
11.7
355
80
89
99
(39)
60
36
60.0
24
8 August 2017
6

RESULTS
FLASH
Britannia Ind.
BSE SENSEX
32,274
S&P CNX
10,057
7 August 2017
Results Flash | Sector: Consumer
CMP: INR4,107
TP: INR4,450
Buy
We will revisit our estimates
post earnings call/management
interaction.
Broadly in-line performance; base business volume growth at ~1%
Consolidated performance
n
Consolidated sales growth came in at 6% YoY (est. of +4%) in 1QFY18.
Standalone (S/A) sales increased 6.6% YoY, but subsidiary sales were down by
5.9% YoY, likely due to a weak performance in the Middle East and Africa.
n
We expect base business volume growth to be ~1% (not mentioned in press
release), as against our expectation of flat volumes. This is on a base 10%
volume growth in 1QFY17.
n
Consol. gross margin contracted 120bp YoY (est. of -100bp) to 37.6% due to
commodity cost inflation (at 6% in 1QFY18).
n
Operating margin performance exceeded our expectation. Other expenses
declined 90bp YoY to 20.5% of sales (the company has not been disclosing
adspend details for the past five quarters; clubs it with other expenses).
Consol. EBITDA margin contracted 40bp YoY to 13% (est. of 12.4%) in 1QFY18.
EBITDA grew 2.8% YoY (est. of -3.8%) to INR2.9b.
n
Higher tax rate at 34.4% (est. 32%) led to adj. PAT decline of 1.5% YoY (est. of -
2.4%) to INR2.2b.
n
Standalone
sales and EBITDA increased 6.6% and 2.9%, respectively, while adj.
PAT fell 0.8% YoY. Gross margin (37.4%) contracted by 130bp YoY and
operating margin (13%) by 50bp YoY.
n
Subsidiary
sales, EBITDA and PAT posted 6% decline, 1% growth and 16%
decline, respectively.
View
n
We currently have a
Buy
rating on the stock. We will review our numbers post
the conference call.
Conference Call Details
Date:
9 August 2017
Time:
03:00pm IST
Dial-in details:
+91-22-3960 0715
th
Financials & Valuations (INR b)
2017 2018E
Y/E Mar
89.6
101.5
Net Sales
11.9
13.8
EBITDA
8.8
10.3
NP
73.7
85.4
EPS (INR)
7.3
16.0
EPS Gr. (%)
224.7
272.4
BV/Sh. (INR)
36.9
34.4
RoE (%)
31.1
28.7
RoCE (%)
55.7
48.1
P/E
41.1
35.0
EV/EBITDA
2019E
118.7
17.2
12.7
105.5
23.5
335.0
34.7
29.5
38.9
27.8
Quarterly Performance
Y/E March
Base business volume growth (%)
Net Sales
YoY Cha nge (%)
COGS
Gross Profit
Ma rgi ns (%)
Other Opera ti ng Exp
% of Sa l es
EBITDA
Ma rgi ns (%)
YoY Growth (%)
Depreci a ti on
Interes t
Other Income
PBT
Ta x
Ra te (%)
Adjusted PAT
YoY Cha nge (%)
1Q
10.0
21,063
8.5
12,879
8,184
38.9
5,367
25.5
2,817
13.4
3.5
279
15
739
3,263
1,071
32.8
2,192
13.2
E: MOSL Estimates
FY17
2Q
3Q
10.0
2.0
23,612 22,648
11.0
5.6
14,902 14,190
8,709
8,458
36.9
37.3
5,578
5,504
23.6
24.3
3,131
2,954
13.3
13.0
2.0
0.3
289
303
15
11
670
561
3,496
3,201
1,156
997
33.1
31.1
2,340
2,204
5.8
4.6
4Q
2.0
22,444
5.2
13,915
8,528
38.0
5,448
24.3
3,081
13.7
6.1
322
13
335
3,081
973
31.6
2,108
5.9
1Q
1.0
22,248
5.6
13,873
8,375
37.6
5,479
24.6
2,896
13.0
2.8
332
13
741
3,293
1,133
34.4
2,160
-1.5
FY18
2QE
3QE
10.0
9.0
27,389 26,045
16.0
15.0
17,013 16,058
10,376
9,987
37.9
38.3
6,608
6,460
24.1
24.8
3,769
3,527
13.8
13.5
20.4
19.4
376
394
15
11
737
617
4,114
3,739
1,316
1,197
32.0
32.0
2,798
2,543
19.5
15.4
4QE
9.0
25,840
15.1
15,810
10,030
38.8
6,456
25.0
3,574
13.8
16.0
488
16
863
3,934
1,180
30.0
2,754
30.7
FY17
FY18E
6.0
7.1
89,623 101,522
7.4
13.3
55,887 62,754
33,736 38,768
37.6
38.2
21,872 25,003
24.4
24.6
11,864 13,766
13.2
13.6
-5.1
16.0
1,193
1,589
55
55
2,424
2,958
13,040 15,079
4,197
4,825
32.2
32.0
8,843 10,254
7.3
16.0
FY18 Variance
1QE
(%)
0.0
21,906
1.6
4.0
13,613
8,293
1.0
37.9
5,582
25.5
2,711
6.8
12.4
-3.8
362
15
813
3,147
4.6
1,007
32.0
2,140
0.9
-2.4
(INR Million)
8 August 2017
7

Amara Raja Batteries
BSE SENSEX
32,274
Bloomberg
Equity Shares (m)
M.Cap.(INRb)/(USDb)
52-Week Range (INR)
1, 6, 12 Rel. Per (%)
Avg Val, INRm
Free float (%)
S&P CNX
10,057
AMRJ IN
171
140.5 / 2.2
1077 / 788
-7/-21/-24
348
47.9
7 August 2017
1QFY18 Results Update | Sector: Automobiles
CMP: INR228
n
TP: INR310(+36%)
Buy
Below estimate; adverse mix, competitive pressure dent profitability
Revenues in-line led by healthy growth in Automotive and Inverters:
Net sales
grew 14.5% YoY (+11.4% QoQ) to INR14.9b (in-line), driven by growth in Auto
and Inverters, while Industrial segment remained subdued. Auto segment
growth could have been better if not for the GST impact (on inventory).
Telecom segment declined ~10%, while UPS also witnessed marginal de-
growth. Inverters segment, however, grew 150% on a lower base.
Multi-quarter-low EBITDA margin at 12.9%:
EBITDA margin contracted 450bp
YoY (-250bp QoQ) to 12.9% (est. of 15%), primarily due to adverse mix (decline
in Telecom), sub-optimal utilization in inverter batteries, and the lack of lead
price pass-through in Telecom and UPS. Higher tax further restricted PAT,
resulting in a decline of 24% YoY to ~INR1b (est. of ~INR1.3b).
Takeaways from management interaction:
a) Registered volume growth in
Automotive segment, and continues to gain market share with OEMs. In
Replacement segment, volumes could have been higher, but due to GST
implementation, dealers restricted purchases. b) Took price hike in
Automotive segment, while intense competition in Telecom and UPS led to no
price pass-through. c) Lead cost for 1QFY18 was USD2,270; expects it remain
stable for next six months. d) Capex of INR5b in FY18. AMRJ is adding 2W
battery capacity of 4m (taking total 2W capacity to 15m by Mar-18) and 4W
battery capacity of 2.5m by 2QFY18 (taking total capacity to 10.5m).
Valuation view:
We cut our EPS estimates by 20%/10% for FY18/FY19 to factor
in higher RM cost, depreciation and tax rate. Significant FCF generation
(~INR9.6b over FY18-20E) and stable RoE of ~19%, coupled with potential shift
from unorganized to organized players due to GST, would continue to drive
stock re-rating. The stock trades at 29.1x/21.7x FY18/19E EPS. Maintain Buy
with a TP of INR986 (25x June 2019 EPS).
FY18
FY17 FY18E
2QE
3QE
4QE
15,877 15,538 15,687 53,172 62,076
18.0
17.0
16.7
15.1
16.7
68.0
68.0
68.1
65.6
68.5
4.8
5.0
4.8
4.7
4.2
12.8
12.9
14.3
13.9
11.6
2,278 2,188 2,010 8,499 8,405
14.4
14.1
12.8
16.0
13.5
520
550
521 1,912 2,136
14
12
12
58
51
175
220
118
492
650
1,919 1,846 1,596 7,022 6,868
31.0
31.0
28.4
31.9
31.0
1,324 1,274 1,142 4,785 4,739
-2.8
13.4
15.2
-2.7
-1.0
(INR Million)
FY18
1QE VAR (%)
14,793
1.2
12.0
67.0 300bp
4.9
50bp
13.0 -130bp
2,234
-13.7
15.1 -220bp
505
7.8
12
14.2
150
-8.8
1,867
-19.2
31.0
1,288
-22.4
-1.4
Financials & Valuations (INR b)
2018E 2019E 2020E
Y/E Mar
Net Sales
62.1
73.6
86.9
EBITDA
8.7
11.4
13.5
PAT
4.8
6.5
7.9
28.0
28.2
37.9
EPS (INR)
0.8
34.4
22.6
Gr. (%)
175
206
244
BV/Sh (INR)
17.3
19.9
20.7
RoE (%)
16.5
19.0
19.8
RoCE (%)
29.4
29.1
21.7
P/E (x)
5.4
4.7
4.0
P/BV (x)
n
n
Estimate change
TP change
Rating change
n
Quarterly Performance
Y/E March (INR m)
Net Sales
YoY Change (%)
RM Cost (% of sales)
Staff Cost (% of sales)
Other Exp (% of sales)
EBITDA
Margins (%)
Depreciation
Interest
Other Income
PBT
Rate (%)
Adj PAT
YoY Change (%)
E: MOSL Estimates
1Q
13,081
15.0
65.7
5.0
11.9
2,273
17.4
441
14
90
1,908
31.5
1,307
8.0
FY17
2Q
3Q
4Q
13,455 13,280 13,445
16.9
9.5
17.4
64.3
65.0
68.0
5.2
5.4
5.2
13.5
14.1
13.0
2,297 2,051 1,844
17.1
15.4
13.7
457
480
499
15
14
15
120
133
151
1,945 1,689 1,480
29.9
33.5
33.0
1,363 1,123
992
10.4
-17.9
-9.1
1Q
14,975
14.5
70.0
5.4
11.7
1,929
12.9
544
14
137
1,508
33.7
999
-23.6
8 August 2017
8

Eveready Industries
BSE SENSEX
32,274
Bloomberg
Equity Shares (m)
M.Cap.(INRb)/(USDb)
52-Week Range (INR)
1, 6, 12 Rel. Per (%)
Avg Val, INRm
Free float (%)
S&P CNX
10,057
7 August 2017
1QFY18 Results Update | Sector: Others
CMP: INR310
TP: INR358(+15%)
Buy
EVRIN IN
73
n
22.5 / 0.4
359 / 190
-15/10/13
49
56.0
LED segment robust; Flashlight segment to recover from GST setbacks
Revenue in-line, EBITDA and PAT below estimates:
EVRIN reported overall
revenue of INR3,577m (est. of INR3,457m) in 1QFY18 v/s INR3,718m in
1QFY17, marking de-growth of 3.8%, mainly due to a significant drop of 10%
YoY in battery volumes and 8% in flashlight turnover. Growth in the lighting
segment remained flattish, but LED products witnessed robust turnover growth
of 179% YoY. EBITDA declined 26% YoY to INR279m (est. of INR315m), with the
margin contracting 230bp to 7.8% (est. of 9.1%) on account of a significant rise
of 200bp in employee cost (11.3% of net sales v/s est. of 10%). Adj. PAT thus
fell 39.4% YoY to INR136m (est. INR169m).
Growth to accelerate backed by LED and appliances:
Appliances segment’s
revenues grew strongly by 257% YoY to ~INR180m in 1QFY18. The company’s
expectation of turnover of INR1b in FY18 from the segment would allow it to
capture ~1% of the market share, and thus, capitalize on the significant
opportunity to grow. LED products too witnessed robust turnover growth of
179% YoY to INR503m, keeping growth in lighting flattish (in spite of de-growth
in CFL), with EBITDA margin of ~7%. On account of higher margin in LED
products and changing product mix, the overall margin in the lighting segment
is expected to inch higher. Moreover, with the GST transitional phase almost
over, demand is expected to pick up, also helped by early festive season and
good monsoon.
Valuation and view:
EVRIN is expected to reap the benefits of robust growth in
LED and appliances, along with the batteries and flashlight segments
recovering from GST turbulence. We thus maintain our earnings estimates,
with revenue/PAT CAGR of 10%/13% over FY17-19E. We value the stock at 22x
FY19E EPS, and maintain
Buy
with a target price of INR358.
Financials & Valuations (INR b)
Y/E Mar
2017 2018E 2019E
Net Sales
13.6
14.9
16.6
EBITDA
1.3
1.5
1.7
n
PAT
0.9
1.0
1.2
EPS (INR)
12.9
13.6
16.3
Gr. (%)
35.5
6.0
19.3
BV/Sh (INR)
39.8
48.8
59.2
RoE (%)
37.7
30.8
30.1
RoCE (%)
27.5
24.1
25.5
P/E (x)
24.1
22.7
19.1
P/BV (x)
7.8
6.4
5.2
Estimate change
TP change
Rating change
n
8 August 2017
9

Metals Weekly
Domestic steel prices gain, sponge prices rise sharply
n
7 August 2017
Update
n
n
n
n
Indian steel: Long product (TMT Mumbai) prices were up ~2% WoW. Sponge iron prices were up ~5% WoW,
following ~4% increase last week. Domestic scrap prices were up ~3% WoW. Domestic iron ore and pellet
prices were unchanged. Domestic HRC prices were up ~4% WoW, while import HRC price offers were up ~2%
WoW.
Raw materials: Iron ore prices (China cfr) were up ~8% WoW. Chinese iron ore port inventories were
unchanged. Thermal coal prices were unchanged. Coking coal prices were up ~6% WoW on strong buying
activity in China. China’s pellet import prices were down ~4% WoW, as premium over iron ore remains strong.
Europe: HRC prices were up ~4% WoW. EU steel spreads improved on higher steel prices, partly offset by
increase in iron ore and coking coal. CIS export HRC prices were down ~2% WoW. Rotterdam scrap prices were
up ~2% WoW.
China: Local HRC prices were up ~3% WoW, while rebar prices were up ~4% WoW. Export HRC/rebar prices
were up ~2 WoW.
Base metals: Aluminum (cash LME) was unchanged. Zinc (cash LME) was up ~1% WoW, while lead was up ~3%
WoW. Copper was up ~1% WoW. Crude oil (Brent) prices were unchanged.
8 August 2017
10

July 2017 Results Preview | Sector: Financials - Banks
Bank of India
Bloomberg
Equity Shares (m)
M. Cap. (INR b)/(USD b)
52-Week Range (INR)
1,6,12 Rel Perf. (%)
BOI IN
1055.4
144 / 2
197 / 100
-6 / 10 / 11
n
CMP: INR137
n
TP: INR147 (+7%)
Neutral
Financial Snapshot (INR b)
Y/E March
2017 2018E 2019E 2020E
NII
118.3 130.1 142.4 156.7
OP
97.3 88.4 95.0 103.0
NP
-15.6 14.5 23.2 32.0
NIM (%)
2.1
2.3
2.3
2.2
EPS (INR)
-14.8 13.7 22.0 30.3
EPS Gr. (%)
NM
NM 60.5 37.8
ROE (%)
-6.7
6.1
9.0 11.2
ROA (%)
-0.3
0.2
0.3
0.4
BV/Sh. (INR)
219
233
255
285
ABV/Sh. (INR)
63
111
153
187
Div. Payout (%)
0.0
0.0
0.0
0.0
Valuations
P/E(X)
-9.3 10.0
6.2
4.5
P/BV (X)
0.63 0.59 0.54 0.48
P/ABV (X)
2.17 1.24 0.89 0.73
n
n
n
Continued asset quality strain and capital conservation efforts
have led to multiple quarters of muted loan growth. We expect
1QFY18 loan growth to be 2% QoQ (+3% YoY). Deposit growth is
expected to come in strong at 9.5% YoY (+1% QoQ) owing to
strong CASA inflows over the last two quarters.
We expect NIM to improve ~22bp YoY to ~2.3%, given that
1QFY17 was impacted by interest income reversals; however,
NIMs will contract ~18bp QoQ as 4QFY17 had a large one-off
component (IT refund). Overall NII is expected to grow 16% YoY.
Contribution of non-interest income is likely to fall sharply from
previous quarters, given lower trading gains. Fee income is
expected to remain muted.
We expect stress additions to moderate, but remain high during
the quarter (slippage ratio ~4%), leading to elevated provisioning.
We expect operating profit to increase sharply to 13% YoY, led by
strong NII growth and controlled opex performance. BOI trades at
0.5x FY19E BV and 6.2x FY19E EPS.
Neutral.
Key issues to watch for
Ø
Stress addition trends and outlook for FY18.
Ø
Upgrade/recovery trends.
Ø
Outlook on balance sheet growth and further capital infusion.
Quarterly Performance
Net Interest Income
% Change (Y-o-Y)
Other Income
Net Income
Operating Expenses
Operating Profit
% Change (Y-o-Y)
Other Provisions
Profit before Tax
Tax Provisions
Net Profit
% Change (Y-o-Y)
Operating Parameters
NIM (Cal, %)
Deposit Growth (%)
Loan Growth (%)
Tax Rate (%)
Asset Quality
Gross NPA (INR b)
Gross NPA (%)
E: MOSL Estimates
1Q
27,752
-4.7
12,384
40,136
23,597
16,539
-3.0
27,702
-11,163
-3,750
-7,414
NM
2.0
-2.0
-5.2
33.6
518.7
13.4
FY17
2Q
3Q
27,197 28,626
-9.9
5.7
20,106 17,693
47,304 46,319
22,375 21,734
24,928 24,584
70.9
74.5
22,962 23,026
1,966
1,559
698
542
1,268
1,017
NM
NM
2.0
-3.8
-4.8
35.5
522.6
13.5
2.0
2.6
-5.4
34.7
517.8
13.4
4Q
34,686
8.8
17,540
52,226
20,951
31,275
113.6
47,362
-16,087
-5,632
-10,455
NM
2.5
5.3
2.0
35.0
520.4
13.2
1QE
32,181
16.0
13,065
45,246
24,052
21,194
28.1
16,500
4,694
1,619
3,075
NM
2.3
9.5
2.7
34.5
509.1
12.7
FY18E
2QE
3QE
32,185 32,551
18.3
13.7
13,614 12,815
45,799 45,366
24,342 24,242
21,457 21,124
-13.9
-14.1
16,500 16,500
4,957
4,624
1,710
1,595
3,247
3,029
156.0
197.8
2.2
9.0
4.4
34.5
489.6
12.1
2.2
2.5
6.9
34.5
471.1
11.5
4QE
33,163
-4.4
15,054
48,217
23,571
24,647
-21.2
16,833
7,814
2,696
5,118
NM
2.3
5.0
7.5
34.5
451.3
10.8
(INR Million)
FY17
118,261
0.9
67,723
185,984
88,658
97,326
61.3
121,052
-23,726
-8,142
-15,584
NM
2.1
5.3
2.0
34.3
520.4
13.2
FY18E
130,081
10.0
54,548
184,628
96,206
88,422
-9.1
66,333
22,089
7,621
14,468
NM
2.2
5.0
7.5
34.5
451.3
10.8
8 August 2017
11

June 2017 Results Preview | Sector: Automobiles
Endurance Technologies
Bloomberg
Equity Shares (m)
M. Cap. (INR b)/(USD b)
52-Week Range (INR)
1,6,12 Rel Perf. (%)
ENDU IN
140.7
66 / 1
549 / 138
6 / 27 / 258
n
n
n
n
CMP: INR875
n
TP: INR1,025(+17%)
Buy
Financial Snapshot (INR Billion)
Y/E Mar
2017 2018E 2019E 2020E
Sales
EBITDA
NP
Adj EPS (INR)
EPS Gr. (%)
BV/Sh. (INR)
RoE (%)
RoCE (%)
Valuations
P/E (x)
P/BV (x)
EV/EBITDA (x)
EV/Sales (x)
37.3
7.1
17.0
2.3
28.7
5.9
13.9
1.9
22.5
4.9
11.6
1.7
18.4
4.1
9.7
1.4
55.7
7.4
3.3
23.5
9.9
20.8
15.6
64.3
8.9
4.3
30.5
29.9
22.4
18.8
73.3
10.5
5.5
38.8
27.2
23.6
21.0
84.7
12.2
6.7
47.5
22.4
24.2
22.6
We expect 10% YoY (and 16% QoQ) growth in consolidated
revenue to INR15.8b, led by strong performance in domestic as
well as export segments.
Consolidated EBITDA would grow 17% YoY (and 23% QoQ), led by
healthy growth in operating performance of European subsidiary.
EBITDA margin is likely to improve 83bp YoY (and 83bp QoQ) to
13.7%.
We expect PAT to grow 21.6% YoY (and 21% QoQ) to INR1.01b.
The stock trades at 28.7x FY18E and 22.5x FY19E EPS. Maintain
Buy.
122.9 149.0 179.4 212.7
Key issues to watch for
Ø
Update on capacity expansion plan at Chennai plant and
investment thereof.
Ø
Update on new suspension products and ABS (recent tie-up with
BWI).
Ø
EU business: level of ramp-up at new plant in Germany.
Consolidated - Quarterly
Y/E March (INR m)
Net Sales
YoY Change (%)
RM Cost (% of sales)
Staff Cost (% of sales)
Other Expenses (% of sales)
EBITDA
Margins (%)
Depreciation
Interest
Other Income
PBT
Tax
Eff. Tax Rate (%)
Reported PAT
YoY Change (%)
E: MOSL Estimates
1Q
14,381
13.1
58.1
9.8
19.3
1,844
12.8
684
104
110
1,166
334
28.7
832
8.9
FY17
2Q
3Q
14,482 13,203
7.5
2.4
57.8
57.8
8.9
10.5
19.4
18.3
2,008
1,769
13.9
13.4
699
741
81
88
54
73
1,281
1,014
388
271
30.3
26.7
893
743
14.8
13.6
4Q
13,661
3.7
58.0
10.0
19.1
1,751
12.8
781
49
265
1,186
351
29.6
835
3.3
1QE
15,819
10.0
57.4
9.8
19.0
2,159
13.7
775
55
100
1,429
418
29.3
1,011
21.6
FY18E
2QE
3QE
16,518 15,808
14.1
19.7
58.3
57.8
8.8
9.7
18.7
18.4
2,309
2,207
14.0
14.0
790
790
57
57
105
110
1,567
1,470
445
425
28.4
28.9
1,121
1,046
25.6
40.7
FY17
4QE
16,130
18.1
58.1
9.9
17.9
2,268
14.1
845
57
200
1,566
452
28.8
1,114
33.4
55,739
6.6
57.9
9.8
19.0
7,393
13.3
2,905
322
481
4,646
1,343
28.9
3,303
9.9
FY18E
64,275
15.3
57.9
9.5
18.6
8,943
13.9
3,200
226
515
6,032
1,740
28.8
4,292
29.9
8 August 2017
12

June 2017 Results Preview | Sector: Healthcare
GSK Pharma
Bloomberg
Equity Shares (m)
M. Cap. (INR b)/(USD b)
52-Week Range (INR)
1,6,12 Rel Perf. (%)
GLXO IN
84.7
214 / 3
3540 / 2309
3 / -25 / -42
CMP: INR2,527 TP:INR2,700(7%)
Neutral
Financial Snapshot (INR Billion)
Y/E MARCH
2017 2018E 2019E 2020E
Sales
EBITDA
NP
EPS (INR)
EPS Gro. (%)
BV/Sh. (INR)
RoE (%)
RoCE (%)
Valuations
P/E (x)
P/BV (x)
EV/EBITDA
(x)
D. Yield (%)
73.5
15.8
60.0
2.9
48.6
19.3
41.2
2.9
42.1
22.9
33.9
2.9
38.9
22.9
30.5
2.9
29.3
3.5
2.9
34.4
-22.2
159.5
21.5
19.1
32.8
5.1
4.4
51.9
51.2
131.0
39.7
35.7
36.7
6.2
5.1
60.1
15.6
110.5
54.4
49.7
41.1
6.9
5.5
64.9
8.0
110.5
58.7
58.6
n
In 1QFY18, we expect GlaxoSmithKline Pharmaceuticals (GLXO) to
report modest 12% YoY increase in revenues to INR7.7b.
n
EBITDA is expected to increase ~73% YoY to INR1.2b due to
expansion in margin by 560bp to 15.8%.
n
Decline in EBITDA margin will impact adj. PAT, which is expected to
decline ~2% YoY to INR881m. Growth and profitability are expected
to gradually improve with volume ramp-up in key NLEM products.
n
We believe GLXO has strong parent support, superior brand
portfolio (competitive advantage), high payout ratio (>100%) and
industry-leading return ratios (RoCE of ~50%). We maintain our
Neutral rating with a target price of INR2,700 @ 45x FY19E PER.
Key issues to watch out
Ø
New product introductions in FY18E.
Ø
Market performance of products impacted by DPCO 2013.
Quarterly performance
Y/E March
(Standalone)
Net Sales
YoY Change (%)
Total Expenditure
EBITDA
Margins (%)
Depreciation
Other Income
PBT before EO Expense
Tax
Rate (%)
Adjusted PAT
YoY Change (%)
Margins (%)
Extra-Ord Expense
Reported PAT
1Q
6,852
10.2
6,150
702
10.2
54
441
1,090
386
35.4
705
-26.4
10.3
-18
723
FY17
2Q
7,829
11.8
6,584
1,245
15.9
66
343
1,522
536
35.2
987
-4.5
12.6
-2
988
3Q
6,893
-5.4
6,543
350
5.1
66
319
603
252
41.8
351
-57.8
5.1
-179
530
4Q
7,634
11.3
6,469
1,165
15.3
78
351
1,438
570
39.6
869
-3.3
11.4
-259
1,127
1QE
7,674
12.0
6,462
1,213
15.8
74
506
1,645
584
35.5
1,061
50.6
13.8
0
1,061
FY18E
2QE
8,768
12.0
7,383
1,385
15.8
74
506
1,817
645
35.5
1,172
18.8
13.4
0
1,172
3QE
7,720
12.0
6,500
1,220
15.8
74
506
1,652
586
35.5
1,065
203.8
13.8
0
1,065
4QE
8,606
12.7
7,331
1,276
14.8
74
506
1,708
606
35.5
1,102
26.8
12.8
0
1,102
(INR million)
FY17
29,265
6.8
25,810
3,455
11.8
264
1,463
4,655
1,744
37.5
2,911
-22.2
9.9
-457
3,368
FY18E
32,769
12.0
27,675
5,094
15.5
296
2,024
6,822
2,422
35.5
4,400
51.2
13.4
0
4,400
8 August 2017
13

June 2017 Results Preview | Sector: Media
Jagran Prakashan
Bloomberg
Equity Shares (m)
M. Cap. (INR b)/(USD b)
52-Week Range (INR)
1,6,12 Rel Perf. (%)
JAGP IN
326.9
61 / 1
213 / 163
4 / -15 / -10
CMP: INR186
n
n
n
n
n
n
TP: INR225 (+21%)
Buy
Financial Snapshot (INR Billion)
Y/E March
2017 2018E 2019E 2020E
Net Sales
EBITDA
Adj. NP
Adj. EPS (INR)
Adj.EPS Gr (%)
BV/Sh (INR)
RoE (%)
RoCE (%)
Div. Payout (%)
Valuations
P/E (x)
P/BV (x)
EV/EBITDA (x)
Div. Yield (%)
17.3
2.5
8.3
1.6
15.1
2.5
7.2
1.6
13.3
2.1
6.2
1.6
12.0
1.9
5.2
1.6
22.8
6.4
3.5
10.8
2.7
73.7
17.6
15.2
33.6
24.6
7.0
3.9
12.3
14.1
74.5
16.4
14.7
28.7
26.6
7.6
4.4
14.0
14.1
86.4
17.2
15.6
25.7
28.8
8.4
4.8
15.5
10.7
98.3
16.8
15.3
23.2
We expect Print advertising revenue to grow 4% YoY to INR3.63b.
We expect circulation revenue to grow 4% YoY to INR1.11b.
We estimate Radio revenue at INR0.69b and EBITDA at INR0.21b.
Aggregate revenue is expected to grow 5% YoY to INR5.85b.
We estimate EBITDA at INR1.6b and EBITDA margin at 27.4%.
Adjusted earnings are expected at INR0.9b, up 8% YoY.
We revise our TP to INR225 (16x FY19E EPS). The stock trades at
15.1x FY18E and 13.3x FY19E EPS. Buy.
Key things to watch for
Ø
YoY Print ad growth (we expect 4%).
Ø
YoY ad growth (Print+Radio) (we expect 6.6%).
Ø
EBITDA margin (we expect 27.4%).
Quarterly Performance (Consolidated)
Y/E March
Sales
YoY (%)
Operating expenses
EBITDA
YoY (%)
EBITDA margin (%)
Depreciation
Interest
Other Income
Exceptional item
PBT
Tax
Effective Tax Rate (%)
Share of Profit/(loss) of assoc./MI
Adjusted net profit
YoY (%)
1Q
5,580
17.5
4,034
1,546
15.3
27.7
244
139
89
0
1,252
407
32.5
840
8.9
FY17
2Q
4,590
-9.4
3,377
1,213
-14.3
26.4
209
91
164
0
1,077
351
32.6
726
1.7
3Q
6,041
4.8
4,162
1,878
9.1
31.1
276
100
88
0
1,591
549
34.5
1,041
11.6
4Q
5,620
6.7
4,188
1,432
7.6
25.5
297
100
145
0
1,180
342
29.0
832
7.3
1QE
5,847
4.8
4,247
1,600
3.5
27.4
320
40
116
0
1,355
447
33.0
902
7.4
FY18
2QE
5,964
29.9
4,293
1,671
37.8
28.0
330
40
93
0
1,394
460
33.0
928
27.8
(INR Million)
FY17
FY18E
3QE
6,561
8.6
4,549
2,013
7.1
30.7
340
35
78
0
1,716
566
33.0
1,144
9.8
4QE
6,203
10.4
4,488
1,715
19.7
27.6
348
32
65
0
1,399
462
33.0
932
12.0
22,829
16,435
6,395
8.5
28.0
1,289
350
412
0
5,167
1,675
32.4
-17
3,476
5.9
24,575
17,616
6,959
8.8
28.3
1,338
147
351
0
5,825
1,922
33.0
-17
3,886
11.8
Note: Only 1QFY17 & 1QFY18 numbers comparable as both are on a consolidated basis
8 August 2017
14

June 2017 Results Preview | Sector: Metals
Jindal Steel & Power
Bloomberg
Equity Shares (m)
M. Cap. (INR b)/(USD b)
52-Week Range (INR)
1,6,12 Rel Perf. (%)
JSP IN
914.9
114 / 2
132 / 58
-5 / 43 / 86
n
CMP: INR129
n
TP: 190 (+40%)
Buy
Financial Snapshot (INR Billion)
Y/E March
2017 2018E 2019E 2020E
Sales
EBITDA
Adj. PAT
Adj. EPS (INR)
EPS Gr (%)
BV/Sh. (INR)
RoE (%)
RoCE (%)
Payout (%)
Valuations
P/E (x)
P/BV
EV/EBITDA (x)
Div. Yield (%)
-6.3
0.4
12.3
0.0
-7.6
0.4
9.7
0.0
54.0
0.4
6.7
0.0
21.6
0.4
6.0
0.0
216.2 254.7 313.4 336.8
46.6
-19.1
-20.9
14.8
-7.9
1.0
0.0
60.6
-15.7
-17.2
78.4
2.2
2.4
82.8
5.6
6.1
n
-17.8 -114.1 149.7
-5.4
1.8
0.0
0.8
3.9
0.0
1.9
4.5
0.0
Standalone:
We expect standalone EBITDA to increase 22% YoY (-
12% QoQ) to INR8b on higher steel volumes and spreads.
Standalone steel sales volumes are up 10% YoY (-7% QoQ) to
858kt.
Jindal Power:
We expect Jindal Power EBITDA to increase 42%
YoY to INR3.3b, driven by higher generation (+51% YoY) and
margins. Lower coal prices and higher seasonal merchant prices
are driving margins.
Oman:
We estimate EBITDA to be marginally lower QoQ at
INR1.9b on lower steel prices.
328.5 310.8 312.8 318.5
Key issues to watch for:
Ø
Ramp-up of Angul.
Ø
Power demand growth.
Quarterly Performance (Consolidated)
Y/E March
Net Sales
Change (YoY %)
Total Expenditure
EBITDA
Change (YoY %)
As % of Net Sales
Interest
Depreciation
Other Income
PBT (before EO item)
Extra-ordinary Income
PBT (after EO item)
Total Tax
% Tax
Reported PAT
MI - Loss/(Profit)
Associate
Adjusted PAT
Change (YoY %)
E: MOSL Estimates
1Q
46,962
-1.2
37,121
9,841
-3.3
21.0
8,529
9,171
312
-7,548
-6,257
-13,805
-1,410
10.2
-12,395
-1,560
14
-4,564
34.5
FY17
2Q
48,609
-3.6
40,125
8,484
-13.1
17.5
8,716
9,986
7
-10,211
0
-10,211
-2,739
26.8
-7,473
-2
11
-7,460
317.8
3Q
55,812
21.5
43,045
12,767
132.0
22.9
8,353
10,274
3
-5,856
0
-5,856
-1,306
22.3
-4,551
-458
18
-4,074
-38.7
4Q
64,861
27.7
49,340
15,521
73.1
23.9
8,642
10,059
90
-3,090
2,534
-556
428
-76.9
-984
-505
-16
-3,029
-37.4
1QE
56,759
20.9
43,176
13,582
38.0
23.9
7,670
11,117
1
-5,204
0
-5,204
15
-0.3
-5,219
-23
100
-5,096
11.6
FY18
2QE
57,782
18.9
43,909
13,874
63.5
24.0
7,698
11,173
1
-4,996
0
-4,996
16
-0.3
-5,012
-23
100
-4,889
-34.5
3QE
66,882
19.8
50,817
16,066
25.8
24.0
7,622
11,873
1
-3,428
0
-3,428
17
-0.5
-3,445
-23
100
-3,322
-18.5
4QE
73,271
13.0
56,153
17,118
10.3
23.4
7,700
11,935
1
-2,516
0
-2,516
18
-0.7
-2,534
-23
100
-2,411
-20.4
(INR Million)
FY17
216,243
11.1
169,631
46,613
35.5
21.6
34,240
39,490
411
-26,706
-3,723
-30,429
-5,027
16.5
-25,402
-2,524
27
-19,128
14.8
FY18E
254,694
17.8
194,055
60,639
30.1
23.8
30,690
46,098
5
-16,143
0
-16,143
66
-0.4
-16,209
-91
400
-15,718
-17.8
8 August 2017
15

June 2017 Results Preview | Sector: Agri
Kaveri Seed
Bloomberg
Equity Shares (m)
M. Cap. (INR b)/(USD b)
52-Week Range (INR)
1,6,12 Rel Perf. (%)
KSCL IN
69.1
44 / 1
682 / 325
2 / 38 / 30
n
CMP: INR644
n
TP: INR755 (+17%)
Buy
We expect revenue to grow 18% YoY to INR5,829m in 1QFY18.
Cotton revenue is expected to be strong in FY18 due to increase
in cotton prices.
We expect EBITDA margin to expand 90bp to 32.9% and EBITDA
to grow 21% to INR1,918m in 1QFY18.
We expect adjusted PAT of INR1,864m in 1QFY18, as against
INR1,544m in the year-ago period.
Buy.
Financial Snapshot (INR Billion)
Y/E March
2017 2018E 2019E 2020E
Sales
EBITDA
NP
EPS (INR)
EPS Gr. (%)
BV/Sh (INR)
RoE (%)
RoCE (%)
Payout (%)
Valuations
P/E (x)
P/BV (x)
EV/EBITDA (x)
Div Yield (%)
33.8
4.4
31.8
0.5
20.6
4.7
21.1
2.2
17.1
4.2
17.3
2.5
15.1
3.7
15.1
2.5
7.0
1.4
0.8
19.1
-21.4
13.6
16.0
32.2
8.1
2.1
2.1
31.3
64.4
21.6
23.4
57.4
9.3
2.5
2.5
37.7
20.4
26.0
28.1
54.1
10.5
2.8
2.8
42.8
13.3
25.9
28.0
47.7
n
146.8 136.5 153.8 176.2
Key things to watch for
Ø
Inventory and write-off in FY18.
Ø
Ø
Rise in cotton acreages with rise in prices.
Cotton yields.
Quarterly Performance
Y/E March
Net Sales
YoY Change (%)
Total Expenditure
EBITDA
Margins (%)
Depreciation
Interest
Other Income
PBT before EO expense
PBT
Tax
Rate (%)
Minority Interest & P&L of Asso. Cos.
Reported PAT
Adj PAT
YoY Change (%)
Margins (%)
E: MOSL Estimates
1Q
4,940
-8.4
3,357
1,583
32.0
78
0
54
1,559
1,559
15
1.0
0
1,544
1,544
-29.6
31.3
FY17
2Q
678
2.2
644
34
5.0
72
0
170
132
132
54
41.1
0
77
77
NM
11.4
3Q
679
-2.7
644
34
5.0
69
0
101
66
-527
30
-5.7
0
-557
69
-40.9
10.2
4Q
403
-1.9
675
-272
-67.4
66
0
18
-320
-912
-40
4.4
0
-872
-306
NM
-75.9
1QE
5,829
18.0
3,911
1,918
32.9
82
0
49
1,885
1,885
21
1.1
0
1,864
1,864
20.7
32.0
FY18
2QE
3QE
813
814
20.0
20.0
694
661
119
153
14.6
18.8
89
76
2
2
182
117
210
192
210
192
44
38
21.0
20.0
0
0
166
153
166
153
113.7
120.9
20.4
18.8
4QE
484
20.0
554
-71
-14.6
80
0
48
-103
-103
-4
4.2
0
-99
-99
-67.7
-20.4
(INR Million)
FY17
FY18E
7,050
-1.6
5,654
1,395
19.8
302
2
344
1,435
843
70
8.3
773
1,316
-55.1
18.7
8,052
14.2
5,959
2,094
26.0
327
5
396
2,157
2,157
86
4.0
2,071
2,071
57.3
25.7
8 August 2017
16

June 2017 Results Preview | Sector: Financials
Muthoot Finance
Bloomberg
Equity Shares (m)
M. Cap. (INR b)/(USD b)
52-Week Range (INR)
1,6,12 Rel Perf. (%)
MUTH IN
399.5
180 / 3
481 / 261
6 / 40 / 42
CMP: INR450
n
n
n
n
TP: INR550 (+22%)
Buy
Financial Snapshot (INR b)
Y/E March
NII
PPP
PAT
EPS (INR)
BV/Sh.(INR)
RoA - AUM (%)
RoE (%)
Div. Yld. (%)
P/E (x)
P/BV (x)
2017 2018E 2019E 2020E
33.6
22.0
11.8
29.5
4.6
19.4
1.3
15.2
2.8
39.5
26.6
16.4
41.0
5.6
23.2
2.7
11.0
2.4
44.6
30.0
18.8
47.1
5.5
23.0
3.1
9.6
2.1
51.2
34.8
21.8
54.5
5.6
23.0
3.6
8.3
1.8
n
n
n
AUM is expected to grow 10% YoY and 4.4% QoQ to INR285b.
Calculated margins are likely to improve YoY to 13% led by decline
in funding costs.
As a result, NII is expected to grow 22% YoY to INR9b.
Asset quality is likely to remain largely stable. GNPL ratio in the
prior quarter was 2.06%.
We estimate provisions of INR300m as against INR176m in 1QFY17.
PAT is expected to grow 29% YoY to INR3.5b
The stock trades at 2.4x FY18E and 2.1x FY19E BV. Maintain Buy.
163.1 189.2 219.2 253.9
Key issues to watch for
Ø
Management commentary on business growth and steps taken to
sustain AUM growth.
Ø
Plan of branch expansion.
Ø
Movement in yields and margins, with declining cost of funds.
Ø
Progress in gold auctions.
Quarterly Performance
Y/E March
Income from operations
Other operating income
Total Operating income
YoY Growth (%)
Other income
Total Income
YoY Growth (%)
Interest Expenses
Net Income
Operating Expenses
Operating Profit
YoY Growth (%)
Provisions
Profit before Tax
Tax Provisions
Net Profit
YoY Growth (%)
E: MOSL Estimates
1Q
12,712
252
12,964
13.7
44
13,008
13.8
5,571
7,437
3,025
4,413
50.1
176
4,237
1,534
2,703
47.6
FY17
2Q
3Q
13,497 13,225
320
184
13,817 13,409
21.6
17.8
45
56
13,862 13,464
21.6
18.0
5,937
5,970
7,925
7,494
3,130
3,000
4,795
4,495
69.5
51.2
171
39
4,624
4,456
1,657
1,545
2,967
2,911
70.0
55.9
4Q
16,962
135
17,096
18.2
36
17,132
18.0
5,460
11,672
3,449
8,223
35.9
2,330
5,893
2,675
3,218
21.3
1QE
14,417
200
14,617
12.8
45
14,662
12.7
5,624
9,038
3,380
5,658
28.2
300
5,358
1,875
3,483
28.9
FY18E
2QE
3QE
14,850 15,592
225
200
15,075 15,792
9.1
17.8
50
55
15,125 15,847
9.1
17.7
5,905
6,260
9,220
9,588
3,482
3,482
5,738
6,106
19.7
35.9
200
600
5,538
5,506
1,938
1,927
3,600
3,579
21.3
23.0
(INR Million)
FY17
FY18E
4QE
18,368
275
18,643
9.0
71
18,714
9.2
5,938
12,776
3,652
9,124
11.0
355
8,769
3,069
5,700
77.1
56,395
891
57,286
17.8
181
57,467
17.9
22,938
34,529
12,603
21,926
48.2
2,716
19,211
7,411
11,799
45.7
63,228
900
64,128
11.9
221
64,348
12.0
23,726
40,622
13,996
26,627
21.4
1,455
25,172
8,810
16,362
38.7
8 August 2017
17

June 2017 Results Preview | Sector: Diversified
SRF
Bloomberg
Equity Shares (m)
M. Cap. (INR b)/(USD b)
52-Week Range (INR)
1,6,12 Rel Perf. (%)
SRF IN
57.4
89 / 1
1970 / 1296
-5 / -17 / 4
n
CMP: INR1,556
n
TP: INR1,816 (+17%)
Buy
Flouro-chemicals (refrigerants) exports business is expected to
benefit on account of anti-dumping duty levied on Chinese R-
134a in the US.
Weak global agri-chem environment is expected to continue to
impact Specialty Chemicals business in 1HFY18.
We expect SRF’s revenue to decline 6% YoY to INR11.4b, and
EBITDA to decrease 14% YoY to INR2.4b. We expect EBITDA
margin to decline 200bp YoY to 21.3%, and adjusted PAT to de-
grow 24% YoY to INR1.06b.
Buy.
Financial Snapshot (INR Billion)
Y/E March
2017 2018E 2019E 2020E
Sales
EBITDA
NP
EPS (INR)
EPS Gr. (%)
BV/Sh. (INR)
RoE (%)
RoCE (%)
Valuations
P/E (x)
P/BV (x)
EV/EBITDA (x)
EV/Sales (x)
18.1
2.9
11.2
2.2
18.0
2.5
10.0
1.9
14.2
2.2
8.0
1.6
11.2
1.9
6.6
1.4
48.2
9.7
4.9
85.9
12.8
16.6
17.7
55.5
10.6
5.0
0.4
14.7
18.7
64.3
12.9
6.4
26.6
16.7
23.3
72.6
14.9
8.1
27.4
18.4
26.5
n
86.3 109.2 139.1
544.6 610.8 696.9 812.8
Key things to watch for
Ø
Growth in Chemicals segment (particularly Specialty Chemicals).
Ø
Client additions and capex plans in Specialty Chemicals.
Ø
Margins in Technical Textiles and Packaging segments.
Consolidated Quarterly Performance
Y/E March
Net Sales
YoY Change (%)
Total Expenditure
EBITDA
Margins (%)
Depreciation
Interest
Other Income
PBT before EO expense
Extra-Ord expense
PBT
Tax
Rate (%)
Reported PAT
Adj PAT
YoY Change (%)
Margins (%)
E: MOSL Estimates
1Q
12,192
0
9,352
2,841
23.3
734
282
55
1,880
-63
1,943
501
25.8
1,442
1,395
24.1
11.4
FY17
2Q
3Q
11,438
11,330
-2
3.4
9,112
9,018
2,326
2,313
20.3
20.4
735
709
242
269
70
64
1,419
1,400
-72
45
1,491
1,355
298
271
20.0
20.0
1,193
1,084
1,135
1,120
3.5
10.1
9.9
9.9
4Q
13,258
19.1
11,101
2,157
16.3
730
228
259
1,459
-185
1,644
352
21.4
1,292
1,147
7.0
8.6
1QE
11,461
-6
9,019
2,441
21.3
817
254
61
1,431
0
1,431
368
25.7
1,063
1,063
-23.8
9.3
FY18
2QE
3QE
14,069
13,936
23
23.0
11,072
10,926
2,997
3,010
21.3
21.6
814
782
217
231
68
66
2,034
2,063
0
0
2,034
2,063
555
559
27.3
27.1
1,478
1,504
1,478
1,504
30.2
34.3
10.5
10.8
4QE
15,910
20.0
13,555
2,355
14.8
733
237
80
1,465
0
1,465
349
23.8
1,116
1,116
-2.7
7.0
(INR Million)
FY17E
FY18E
48,218
5.0
38,524
9,694
20.1
2,834
1,018
455
6,296
-276
6,572
1,422
21.6
5,150
4,934
14.4
10.2
55,483
15.1
44,886
10,597
19.1
3,146
939
275
6,788
0
6,788
1,833
27.0
4,955
4,955
0.4
8.9
8 August 2017
18

June 2017 Results Preview | Sector: Capital Goods
Thermax
Bloomberg
Equity Shares (m)
M. Cap. (INR b)/(USD b)
52-Week Range (INR)
1,6,12 Rel Perf. (%)
TMX IN
119.2
112 / 2
1071 / 738
-4 / 3 / -5
n
CMP: INR937
n
TP: INR850 (-9%)
Sell
Financial Snapshot (INR b)
Y/E March
2017 2018E 2019E 2020E
Net Sales
EBITDA
Adj. PAT
EPS (INR)
EPS Gr. (%)
BV/Sh. (INR)
RoE (%)
RoCE (%)
Payout (%)
Valuations
P/E (X)
P/BV (X)
EV/EBITDA (X)
Div Yield (%)
30.4
4.2
22.1
0.6
28.7
3.7
20.6
0.7
27.6
3.4
19.1
0.8
25.7
3.1
17.2
0.9
44.8
4.7
3.5
30.8
23.0
225.4
14.3
12.9
25.6
48.6
5.1
3.7
32.7
6.0
13.7
14.0
20.2
51.4
5.3
3.8
34.0
3.9
12.9
13.0
21.4
56.1
5.8
4.1
36.5
7.5
12.6
12.6
21.9
n
250.3 275.8 302.9
During the quarter, Thermax bagged orders worth USD157m from
an African company for the supply of utility boilers, heat recovery
steam generators and flue gas steam generators for its upcoming
refinery and petrochemical project in Nigeria.
Revenue is likely to register growth of 8.5% YoY, supported by
execution pick-up in the energy segment (+12% YoY) and an
improvement in orders available for execution. Operating margin
is expected to contract 130bp YoY to 12.1%.
Ordering activity remains muted in a weak macro environment.
We believe domestic orders have remained at the base level
(INR5b-7b per quarter) as the company has not announced any
meaningful domestic order during the quarter. Maintain
Sell.
Key issues to watch
Ø
Demand environment in domestic and overseas markets.
Ø
Sustainability of margins in the energy (12.3% in 4QFY17) and
environment (11.6% in 4QFY17) segments.
(INR Million)
Quarterly Performance
Y/E March
Sales
Change (%)
EBITDA
Change (%)
As of % Sales
Depreciation
Interest
Other Income
Extra-ordinary Items
PBT
Tax
Effective Tax Rate (%)
Reported PAT
Change (%)
Adj. PAT
Change (%)
1Q
8,145
-19.9
637
-19.1
7.8
168
7
211
673
221
32.8
452
(19.0)
452
(19.0)
FY17
2Q
8,708
-19.6
773
-14.7
8.9
166
7
289
888
292
32.8
597
(3.5)
597
(3.3)
3Q
8,136
-21.4
806
0.0
9.9
157
6
206
850
283
33.3
566
(11.1)
566
(8.3)
4Q
13,428
3.9
1,521
22.6
11.3
163
17
321
-1,328
335
502
150.0
-167
(114.4)
1,161
0.0
1Q
8,834
8.5
884
38.8
10.0
177
8
210
909
291
32.0
618
36.7
618
36.7
FY18
2Q
3Q
9,376
9,191
7.7
13.0
926
995
19.7
23.3
9.9
10.8
177
177
9
10
290
180
1,030
329
32.0
700
17.4
700
17.4
988
316
32.0
672
18.5
672
18.5
4Q
14,700
9.5
1,484
-2.4
10.1
177
9
321
0
1,619
511
31.6
1,108
(763.0)
1,108
(4.6)
FY17
37,637
-15.6
3,738
-24.5
9.9
654
36
1,027
4,074
1,298
31.8
1,448
(65.4)
2,777
(33.6)
FY18E
42,101
11.9
4,288
14.7
10.2
708
36
1,001
4,546
1,448
31.8
3,098
113.9
3,098
11.6
8 August 2017
19

In conversation
1. Slippages in next 3 quarters likely at Rs 4,150cr: Syndicate
Bank, Melwyn Rego, MD & CEO
n
n
n
n
Loan book has not grown in Q1.
Slippages in the next three quarters likely at INR 4,150 crs.
Expect FY18 gross NPAs at 8.75% and net NPA below 5% by end of FY18.
(Current gross NPAs at 9.96% and net NPAs at 6.27%)
Bank has exposure to 11 out 12 stressed accounts identified by the RBI.
2. Will see an improvement in q2 earnings: REPCO Home, R
Varadarajan, MD
n
n
n
n
n
Demonetization did have an impact on Q1 earnings.
To see an improvement in Q2 earnings.
Pain witnessed in asset quality from loan against property in non-salaried
segment.
Facing stiff competition from commercial banks offering very low rates.
Have passed on 70 bps reduction in cost of funds to customers.
3. Expect to see improvement in H2 because of cotton prices:
Arvind, Kulin Lalbhai, Executive Director
n
n
n
n
n
Main challenge in Q1 was GST implementation which led to some discontinuities
in business.
Brand and retail margin impacted due to preponement of End of Season Sale.
Bottomline pressures owing to transition impacts. Should see impacts being
resolved as market hits equilibrium in Q2.
Cotton prices have corrected QoQ but expect good crop again with good
monsoon in India. Q2 should see improvement on the back of cotton prices.
‘Unlimited’ has been successful at store level. Company plans to open 30 stores.
4. Hope to do better on operational & financial fronts going
ahead: SOBHA, JC Sharma, VC & MD
n
n
n
n
Challenges remain in real estate due to structural transformation. However,
underlying demand still intact in sentor.
Organized players will benefit from RERA.
Hope to do much better on both operational and financial fronts in this FY.
Gurugram market should be second best market after Bengaluru.
8 August 2017
20

From the think tank
1. India’s price-to-truth bank ratio is testing new heights
n
Remember the price-to-truth ratio? I coined the term three months ago for a
certain kind of overvaluation of India’s privately owned lenders, after three of
these banks, supposedly better governed than their state rivals, had to admit
that their non-performing loans were between 20 and 557% more than officially
reported. That discrepancy was because of one corporate account: a cement
company that in the Indian central bank’s opinion should have been identified
as a bad debt back in March 2016. Luckily for the lenders, the embarrassment
was short-lived. The borrower, Jaiprakash Associates Ltd, managed to sell some
units to Indian billionaire Kumar Mangalam Birla’s UltraTech Cement Ltd, a AAA-
rated firm locally. Yes Bank Ltd, ICICI Bank Ltd and Axis Bank Ltd have recovered
the bulk of their money.
2. India's villages: For want of a road
n
The Silapathikaram, a Tamil epic dating back to the fifth or sixth century AD,
paints an intriguing picture of common people moving freely for commerce and
religious purposes both. Historical records bear this out. For example, the
bazaar at Kandiyur—a village in the Thanjavur district of Tamil Nadu—in the
early medieval period was well-known, attracting people from all over the
region as well as merchants from other regions of the subcontinent. Travellers
and traders from as far afield as Turkey, China and Malaysia were also familiar
sights. Until recently, large swathes of rural India had not yet caught up. At the
turn of the century, around 40% of the villages in India lacked all-weather
connectivity, constraining them when it came to mobility. This placed limits
upon their economic well-being; the fundamental relationship between
economic activity and travel and mobility remains the same today as it was at
the time of the bazaar.
3. India's power paradox
n
In global energy markets, India takes third place in a few key metrics. The
country has the world’s third-largest electricity generation system, after China
and the United States. It is the world’s third-largest power generator, and it is
also the world’s third-largest carbon dioxide emitter, again behind China and the
US in both measures. In one category, though, it comes in first: India has the
world’s largest population without reliable access to electricity, about 250
million of its 1.3 billion people. Increased access to electricity is an infrastructure
matter, but it is also a technological one — and technology is both enabling
electrification and blunting its growth at the same time.
8 August 2017
21

International
4. The ‘haves and have-mores’ in digital america
n
Is monopoly power one of the reasons that the equity markets remain high
nearly 10 years into a bull market? It is something I have begun to wonder about
recently, since a lack of wage inflation is a key reason that the Federal Reserve is
not moving faster to raise interest rates. A rate rise off the back of inflation is
one of the most reliable ways to pop a market bubble. Yet many economists
believe that one of the reasons that wage growth — a typical driver of inflation
— remains relatively flat despite unemployment being at nearly pre-crisis lows is
because of job-disrupting technology itself. There are a few sectors, like finance
and information technology, which have seen strong wage growth. Yet they
create relatively few jobs. Finance takes 25 per cent of all corporate profits
while creating only 4 per cent of jobs, since it sits at the centre of the
dealmaking hourglass, charging whatever rent it likes.
8 August 2017
22

Click excel icon
for detailed
valuation guide
Rs
Valuation snapshot
P/E (x)
FY17 FY18E
29.4
24.4
21.8
44.4
51.6
19.4
52.1
39.1
33.7
26.6
23.4
25.8
46.7
31.5
21.7
51.3
29.3
32.9
28.0
33.2
23.8
31.5
19.6
24.7
34.5
NM
37.2
43.7
13.4
24.7
30.1
26.7
NM
18.7
37.3
10.4
NM
24.4
1,045.9
19.1
110.1
53.4
39.6
32.1
26.2
15.4
62.3
36.9
17.5
23.3
21.5
21.1
30.9
37.5
19.2
37.2
30.1
18.1
23.5
20.9
20.4
25.4
27.9
13.9
37.0
23.1
23.2
23.4
96.8
21.3
26.2
20.1
20.7
26.7
21.2
30.8
28.9
10.2
19.5
24.2
8.7
11.5
11.7
8.9
8.9
8.2
26.0
17.4
5.9
13.8
37.7
26.2
23.8
21.5
12.1
50.9
32.6
14.0
P/B (x)
FY17 FY18E
5.4
5.3
4.9
6.6
8.5
3.0
18.1
7.5
3.4
3.7
7.8
3.2
2.9
6.5
2.5
11.9
5.0
2.2
2.9
2.5
2.3
5.3
2.2
1.3
5.0
0.7
4.8
4.6
1.1
3.8
3.5
1.1
0.7
0.7
0.5
1.0
0.4
0.9
1.5
0.5
1.0
10.2
4.7
3.4
4.4
1.8
18.6
6.8
4.2
4.6
4.7
4.5
5.7
7.5
2.7
13.0
6.2
2.9
3.3
6.7
2.9
2.6
5.7
2.1
9.5
4.3
2.1
2.3
2.5
1.8
4.6
2.1
1.3
4.3
0.7
4.3
3.2
1.1
3.3
3.0
1.0
0.7
0.7
0.5
0.9
0.4
0.8
1.4
0.5
0.9
8.3
3.8
3.0
3.7
1.6
15.3
6.2
3.7
ROE (%)
FY17 FY18E FY19E
20.3
23.1
25.3
16.2
15.8
16.9
40.3
20.8
10.6
13.9
35.7
14.2
6.4
20.3
9.8
25.6
17.1
6.9
10.8
9.5
9.9
18.3
10.2
5.6
15.4
-27.0
13.8
12.3
9.5
18.9
11.5
4.1
-6.7
4.2
1.4
10.1
-8.4
3.6
-0.2
2.7
0.9
21.7
15.1
12.0
18.0
14.4
32.5
18.9
25.5
21.2
23.2
22.2
19.8
21.1
14.8
40.8
22.4
17.3
14.1
34.6
13.9
10.8
20.1
16.5
28.6
18.8
9.3
11.4
2.6
10.0
18.8
8.9
6.3
17.3
3.5
15.0
13.6
10.8
18.3
12.5
11.9
6.1
6.2
5.8
10.9
4.6
3.2
8.7
8.1
6.5
24.3
16.1
13.3
18.6
14.1
33.0
19.3
28.2
21.3
27.0
24.0
22.3
21.9
17.3
38.0
23.6
18.3
15.0
31.5
14.9
11.5
22.8
27.3
35.2
22.6
14.7
11.8
8.7
10.5
19.6
9.5
6.9
18.5
7.2
16.3
13.9
12.7
19.5
14.2
13.2
9.0
9.1
7.3
11.2
5.4
5.9
10.0
10.5
8.1
25.9
28.0
15.6
19.0
15.6
32.8
18.4
31.3
Company
Automobiles
Amara Raja
Ashok Ley.
Bajaj Auto
Bharat Forge
Bosch
CEAT
Eicher Mot.
Endurance Tech.
Escorts
Exide Ind
Hero Moto
M&M
Mahindra CIE
Maruti Suzuki
Tata Motors
TVS Motor
Aggregate
Banks - Private
Axis Bank
DCB Bank
Equitas Hold.
Federal Bank
HDFC Bank
ICICI Bank
IDFC Bank
IndusInd
J&K Bank
Kotak Mah. Bk
RBL Bank
South Indian
Yes Bank
Aggregate
Banks - PSU
BOB
BOI
Canara
IDBI Bk
Indian Bk
OBC
PNB
SBI
Union Bk
Aggregate
NBFCs
Bajaj Fin.
Bharat Fin.
Capital First
Cholaman.Inv.&F
n
Dewan Hsg.
GRUH Fin.
HDFC
Indiabulls Hsg
Reco
Buy
Buy
Buy
Buy
Neutral
Buy
Buy
Buy
Neutral
Buy
Neutral
Buy
Not Rated
Buy
Buy
Buy
CMP
(INR)
823
111
2,890
1,162
24,401
1,812
32,008
918
672
216
3,954
1,399
250
7,839
430
603
TP
% Upside
EPS (INR)
(INR) Downside FY17 FY18E FY19E
1,095
118
3,281
1,330
23,738
2,029
31,326
1,025
732
269
3,818
1,618
-
8,863
666
606
33
6
14
14
-3
12
-2
12
9
24
-3
16
13
55
1
28.0
4.6
132.3
26.2
473.1
93.3
613.8
23.5
20.0
8.1
169.1
54.3
5.4
248.6
19.8
11.7
35.3
42.1
5.2
7.0
137.2 163.6
37.7
49.7
649.9 766.2
94.2
126.8
861.2 1,102.9
30.5
38.8
37.1
45.8
9.2
11.0
189.3 199.1
68.5
82.4
9.9
11.8
281.0 375.3
30.9
64.3
16.3
25.9
Neutral
Neutral
Buy
Buy
Buy
Buy
Neutral
Buy
Neutral
Buy
Under
Review
Buy
Buy
506
196
168
115
1,787
300
58
1,654
81
998
520
29
1,801
545
192
201
139
2,000
366
62
1,800
91
1,153
-
34
2,133
8
-2
20
21
12
22
8
9
12
16
15.4
7.0
5.0
4.8
56.8
15.3
2.3
47.9
-31.3
26.8
11.9
21.8
8.4
1.7
5.4
68.2
14.9
2.8
61.9
3.8
32.4
18.0
2.9
92.3
38.1
10.4
6.1
6.8
82.1
17.0
3.2
76.8
8.2
41.0
23.7
3.7
114.5
16
18
2.2
73.0
Buy
Neutral
Neutral
Neutral
Buy
Neutral
Buy
Buy
Neutral
160
158
352
57
305
140
152
311
146
212
147
360
49
382
150
184
362
162
33
-7
2
-14
25
7
21
16
11
6.0
-14.8
18.8
1.5
29.3
-31.6
6.2
0.3
7.6
18.4
13.7
30.1
6.4
34.4
17.1
5.8
17.9
24.6
22.5
22.0
47.0
8.6
38.3
21.4
11.0
23.3
34.5
Buy
Neutral
Buy
Buy
Buy
Neutral
Buy
Buy
1,794
832
791
1,205
457
507
1,727
1,205
1,800
820
925
1,400
630
450
1,900
1,350
0
-1
17
16
38
-11
10
12
33.6
21.0
24.6
46.0
29.6
8.1
46.8
69.0
47.6
31.8
33.3
56.0
37.7
9.9
52.9
86.3
62.9
68.7
44.3
67.3
47.1
12.1
59.0
108.4
8 August 2017
23

Company
Reco
L&T Fin Holdings Buy
LIC Hsg Fin
Neutral
Manappuram
Not Rated
M&M Fin.
Buy
Muthoot Fin
Buy
PFC
Neutral
Repco Home
Buy
REC
Neutral
Shriram
City
Buy
Union
STF
Buy
Aggregate
Capital Goods
ABB
Sell
Bharat Elec.
Buy
BHEL
Sell
Blue Star
Neutral
CG Cons. Elec.
Buy
CG Power & Indu. Sell
Cummins
Buy
GE T&D
Neutral
Havells
Neutral
K E C Intl
Neutral
L&T
Buy
Pennar Eng.
Not Rated
Siemens
Neutral
Solar Ind
Neutral
Suzlon Energy
Not Rated
Thermax
Sell
Va Tech Wab.
Buy
Voltas
Sell
Aggregate
Cement
Ambuja Cem.
Buy
ACC
Neutral
Birla Corp.
Buy
Dalmia Bharat
Buy
Grasim Inds.
Neutral
India Cem
Neutral
J K Cements
Buy
JK Lakshmi Ce
Buy
Ramco Cem
Buy
Orient Cem
Buy
Prism Cem
Buy
Shree Cem
Buy
Ultratech
Buy
Aggregate
Consumer
Asian Paints
Neutral
Britannia
Buy
Colgate
Buy
Dabur
Neutral
Emami
Buy
Godrej Cons.
Neutral
GSK Cons.
Sell
CMP
(INR)
176
688
106
424
473
137
701
181
2,155
990
TP
% Upside
(INR) Downside
200
13
708
3
-
459
8
550
16
117
-14
936
34
134
-26
2,800
1,330
30
34
FY17
5.2
38.2
8.6
7.1
29.5
25.7
29.1
31.4
84.3
55.6
EPS (INR)
FY18E FY19E
7.3
10.6
41.6
48.9
10.8
12.5
13.9
17.8
41.0
43.3
27.2
30.2
35.8
42.5
35.0
40.4
121.7
80.0
164.1
102.4
P/E (x)
FY17 FY18E
33.7
24.1
18.0
16.6
12.3
9.9
59.9
30.6
16.0
11.5
5.3
5.0
24.1
19.6
5.8
5.2
25.5
17.8
20.6
71.1
26.2
64.6
53.7
46.3
20.0
35.6
65.8
51.8
25.2
27.9
17.3
76.2
43.2
27.4
29.4
21.7
34.7
35.5
57.2
50.3
32.7
68.4
16.6
35.6
30.4
64.0
25.5
NM
340.5
47.1
42.3
37.2
54.7
55.7
50.5
44.1
43.2
51.2
34.9
17.7
12.4
17.3
62.5
24.4
39.0
38.9
43.1
35.9
34.1
40.6
45.3
22.9
26.3
13.5
59.8
36.8
19.7
27.7
18.0
32.0
31.8
40.2
36.5
23.4
39.8
15.8
25.0
25.3
45.8
25.4
34.9
32.0
39.3
44.3
31.9
51.8
48.1
43.9
41.3
42.6
44.9
32.8
P/B (x)
FY17 FY18E
4.0
3.5
3.2
2.8
2.7
2.4
3.8
3.5
2.9
2.5
0.9
0.8
3.9
3.3
1.1
0.9
2.8
2.0
3.5
9.0
5.4
1.1
8.7
25.2
1.2
7.0
9.3
9.4
4.8
3.3
1.8
7.1
7.9
-1.6
4.0
3.4
5.4
4.0
2.9
3.9
2.2
4.8
1.8
1.2
4.1
3.7
4.4
3.2
5.9
8.2
4.7
3.6
14.5
18.3
22.9
11.6
14.8
12.4
7.3
2.5
1.8
3.1
7.9
4.2
1.0
8.2
18.6
1.2
6.5
8.2
8.4
4.1
3.1
1.6
6.2
6.8
-1.7
3.6
3.0
4.8
3.6
2.7
3.8
2.1
4.3
1.6
1.2
3.6
3.5
3.8
3.0
5.1
6.9
4.3
3.3
13.2
15.1
21.7
10.0
12.6
9.7
7.2
FY17
12.4
19.4
24.0
6.5
19.4
17.9
17.4
19.9
11.7
11.7
16.8
12.7
20.6
1.6
18.0
76.4
6.2
21.2
12.4
18.2
21.2
12.2
10.2
9.3
19.8
NM
14.3
16.3
18.0
11.2
5.1
7.9
7.5
7.2
11.5
3.4
14.4
6.0
19.0
-3.2
1.8
18.4
11.6
9.6
28.5
36.9
50.4
28.4
35.8
24.6
22.2
ROE (%)
FY18E
15.6
18.2
25.9
12.0
23.2
17.0
18.1
19.1
15.0
15.0
17.7
12.6
17.0
2.7
21.7
49.7
3.4
19.7
21.5
18.6
19.5
12.1
11.6
10.3
19.8
-8.8
13.7
17.7
15.8
11.5
7.0
10.6
9.2
11.3
10.9
4.7
15.0
7.9
16.1
8.8
17.2
19.1
10.1
10.3
26.7
34.4
50.8
26.0
32.0
24.2
22.1
FY19E
19.1
18.5
26.9
14.2
21.4
16.8
18.2
19.1
17.6
16.9
18.1
15.8
16.9
3.4
30.1
49.7
4.2
22.8
22.7
20.7
20.9
12.9
12.6
13.7
20.9
-11.0
12.9
17.5
16.0
12.6
7.9
13.1
12.2
13.1
13.9
6.6
17.2
12.1
17.5
12.8
22.0
19.1
14.0
12.7
28.1
34.7
58.2
26.3
33.9
22.8
22.4
1,401
182
139
691
217
82
944
377
495
299
1,179
122
1,359
890
17
907
627
537
1,200
210
100
610
240
65
1,170
395
455
295
1,345
-
1,355
900
-
850
800
430
-14
16
-28
-12
11
-21
24
5
-8
-1
14
0
1
-6
28
-20
19.7
6.9
2.1
12.9
4.7
4.1
26.5
5.7
9.6
11.9
42.3
7.1
17.8
20.6
0.6
30.8
28.9
15.5
22.4
7.4
3.6
17.8
5.0
2.3
27.7
9.3
10.9
13.1
44.8
9.1
22.7
24.2
0.9
32.7
34.9
16.8
31.6
8.3
4.7
26.6
6.4
4.5
35.0
11.3
13.8
16.4
51.7
11.2
33.0
30.0
1.0
34.0
39.8
19.1
280
1,816
960
2,653
1,125
200
1,023
445
695
155
118
18,098
4,059
308
1,622
1,205
3,162
1,384
201
1,287
519
806
185
145
22,360
4,936
10
-11
26
19
23
0
26
17
16
20
22
24
22
4.9
36.1
29.4
38.8
67.9
5.6
33.7
7.0
27.3
-1.6
0.3
384.4
96.1
7.0
49.8
40.9
66.7
71.2
8.0
40.4
9.7
27.4
4.4
3.7
460.4
91.5
8.2
65.0
58.9
87.1
102.6
11.8
53.5
16.4
34.4
7.1
5.6
547.8
138.8
1,150
4,107
1,072
319
1,145
968
5,450
1,200
4,450
1,285
315
1,310
995
4,500
4
8
20
-1
14
3
-17
21.0
73.7
21.2
7.2
26.5
18.9
156.1
22.2
85.4
24.4
7.7
26.9
21.5
166.3
26.5
105.5
29.8
9.1
33.1
24.7
181.9
8 August 2017
24

Company
HUL
ITC
Jyothy Lab
Marico
Nestle
Page Inds
Parag Milk
Pidilite Ind.
P&G Hygiene
Prabhat Dairy
United Brew
United Spirits
Aggregate
Healthcare
Alembic Phar
Alkem Lab
Ajanta Pharma
Aurobindo
Biocon
Cadila
Cipla
Divis Lab
Dr Reddy’s
Fortis Health
Glenmark
Granules
GSK Pharma
IPCA Labs
Jubilant Life
Lupin
Sanofi India
Shilpa Medicare
Strides Shasun
Sun Pharma
Syngene Intl
Torrent Pharma
Aggregate
Logistics
Allcargo Logistics
Blue Dart
Concor
Gateway
Distriparks
Gati
Transport Corp.
Aggregate
Media
Dish TV
D B Corp
Den Net.
Ent.Network
Hind. Media
HT Media
Jagran Prak.
Music Broadcast
Reco
Buy
Neutral
Neutral
Neutral
Sell
Buy
Neutral
Neutral
Buy
Not Rated
Neutral
Neutral
CMP
(INR)
1,184
280
385
334
6,734
16,407
250
812
8,045
135
824
2,573
TP
% Upside
(INR) Downside
1,285
9
280
0
395
3
355
6
5,740
-15
20,195
23
240
-4
810
0
9,082
13
-
850
3
2,525
-2
FY17
19.6
8.4
11.2
6.3
118.0
238.7
3.6
16.7
144.9
3.5
8.7
26.7
EPS (INR)
FY18E FY19E
22.9
27.3
9.3
10.3
8.9
11.0
6.8
8.2
115.1 133.6
317.0 400.0
7.4
12.3
18.1
20.6
155.8 181.6
3.5
6.4
9.7
14.7
34.5
51.5
P/E (x)
FY17 FY18E
60.3
51.6
33.3
30.2
34.2
43.1
53.2
49.0
57.1
58.5
68.7
51.8
69.5
33.7
48.6
45.0
55.5
51.6
38.2
38.8
94.7
84.9
96.2
74.6
46.5
42.0
24.6
24.8
22.9
18.4
34.8
37.6
35.5
17.2
30.4
15.9
17.5
18.3
69.6
28.8
19.0
17.6
33.3
45.7
32.5
19.4
36.1
23.4
23.8
17.4
40.5
31.2
39.7
14.4
17.6
29.0
78.2
18.6
NM
75.8
10.4
11.8
16.7
54.7
25.9
23.5
20.2
15.8
36.5
30.0
28.3
20.3
26.0
75.2
16.0
16.2
51.1
21.7
14.9
23.8
32.1
30.3
22.1
20.1
29.1
24.1
23.1
14.1
32.0
28.1
25.2
7.6
14.1
23.8
54.3
15.9
NM
64.8
9.5
11.0
14.6
37.7
P/B (x)
FY17 FY18E
38.4
37.1
7.5
7.5
6.4
6.6
18.5
15.9
21.5
20.0
27.5
21.7
3.2
2.9
12.6
10.3
45.9
36.6
1.9
1.9
9.5
8.7
19.3
13.4
12.8
11.9
5.3
5.3
7.6
4.6
4.4
8.5
3.6
3.9
3.0
1.7
4.3
3.3
10.1
2.4
3.2
3.3
5.7
5.6
3.5
3.3
7.3
5.0
4.0
2.6
18.0
3.3
2.3
2.0
2.7
3.5
16.8
4.4
1.5
4.8
1.8
0.8
2.4
3.7
4.6
4.5
5.7
3.6
4.1
7.0
3.3
3.5
2.8
1.5
3.5
2.3
11.8
2.2
2.7
3.0
5.3
4.8
3.1
3.2
6.0
4.4
3.6
2.3
13.7
3.1
2.3
1.7
2.3
3.3
12.8
3.9
1.7
4.5
1.5
0.7
2.4
3.3
FY17
65.6
23.5
21.1
36.7
39.0
40.0
5.9
28.2
45.3
5.2
10.4
21.3
27.6
23.0
23.4
37.7
28.3
12.3
24.8
10.2
23.5
9.6
11.3
24.7
21.1
14.5
8.6
18.1
20.6
17.1
14.4
10.7
18.5
22.2
23.8
17.0
12.6
50.5
10.8
5.9
12.4
16.7
12.2
24.1
25.5
-12.0
6.7
19.0
7.1
17.6
11.2
ROE (%)
FY18E
73.1
24.8
15.1
34.9
35.5
42.0
9.1
25.2
78.9
4.9
10.7
18.0
28.2
19.0
20.7
32.2
25.5
11.1
25.7
11.5
18.1
11.3
2.1
21.6
17.7
23.0
10.5
19.5
13.2
16.6
17.0
14.7
16.1
22.5
19.5
15.6
17.2
48.6
11.3
9.1
19.4
17.8
13.8
26.8
25.8
-5.3
7.2
17.3
6.9
16.4
9.3
FY19E
82.8
26.3
18.6
37.7
38.1
42.8
13.4
23.5
74.0
8.5
14.6
20.3
29.3
20.4
21.0
29.9
22.3
14.5
27.2
12.8
19.4
14.8
4.9
20.9
18.8
30.9
12.7
19.6
16.0
18.1
20.4
20.1
17.9
20.7
21.5
17.0
17.8
46.8
12.4
11.1
25.4
18.6
15.3
327.5
26.6
0.7
10.7
17.3
6.4
17.2
12.4
Neutral
Neutral
Buy
Buy
Sell
Buy
Neutral
Neutral
Neutral
Buy
Neutral
Buy
Neutral
Neutral
Buy
Buy
Buy
Buy
Buy
Buy
Not Rated
Neutral
531
1,874
1,338
724
355
534
565
683
2,210
164
688
132
2,392
462
702
985
4,294
640
1,049
506
469
1,289
510
1,900
2,028
850
330
510
500
680
2,500
220
775
200
2,500
480
905
1,125
4,820
805
1,300
650
-
1,350
-4
1
52
17
-7
-4
-12
0
13
34
13
51
5
4
29
14
12
26
24
28
5
21.6
75.7
58.4
39.3
10.2
14.2
15.9
39.7
72.6
10.3
39.3
7.2
34.4
16.1
37.0
55.8
129.1
14.0
32.3
26.1
13.0
55.2
20.5
79.7
66.1
45.7
9.7
17.8
20.0
33.6
85.1
2.2
42.9
8.2
46.8
21.3
47.1
41.4
133.6
21.1
47.4
25.2
16.1
53.4
25.5
95.0
79.6
50.0
14.2
23.2
25.0
40.0
125.2
5.6
51.7
11.5
54.9
28.5
56.7
56.3
160.6
30.4
74.8
30.8
18.0
67.3
Buy
Not Rated
Neutral
Buy
Not Rated
Not Rated
171
4,156
1,185
270
120
298
228
-
1,214
313
-
-
33
2
16
9.8
102.5
38.0
6.8
8.4
16.9
12.2
129.9
42.1
10.7
15.9
21.0
14.3
163.2
48.6
13.6
23.9
25.9
Buy
Buy
Neutral
Neutral
Buy
Neutral
Buy
Buy
77
379
83
866
270
87
180
351
105
450
90
928
350
90
225
469
36
19
8
7
29
3
25
34
1.0
20.4
-8.6
11.4
25.9
7.4
10.8
6.4
1.4
23.7
-2.7
13.4
28.3
7.9
12.3
9.3
4.0
27.6
0.3
21.7
33.6
8.1
14.0
14.0
8 August 2017
25

Company
PVR
Siti Net.
Sun TV
Zee Ent.
Aggregate
Metals
Hindalco
Hind. Zinc
JSPL
JSW Steel
Nalco
NMDC
SAIL
Vedanta
Tata Steel
Aggregate
Oil & Gas
BPCL
GAIL
Gujarat Gas
Gujarat St. Pet.
HPCL
IOC
IGL
MRPL
Oil India
ONGC
PLNG
Reliance Ind.
Aggregate
Retail
Jubilant Food
Titan Co.
Aggregate
Technology
Cyient
HCL Tech.
Hexaware
Infosys
KPIT Tech
L&T Infotech
Mindtree
Mphasis
NIIT Tech
Persistent Sys
Tata Elxsi
TCS
Tech Mah
Wipro
Zensar Tech
Aggregate
Telecom
Bharti Airtel
Bharti Infratel
Idea Cellular
Reco
Buy
Neutral
Neutral
Buy
CMP
(INR)
1,430
25
757
541
TP
% Upside
(INR) Downside
1,628
14
32
26
860
14
630
16
FY17
20.5
-1.8
24.9
23.1
EPS (INR)
FY18E FY19E
30.9
46.9
-0.1
0.5
28.5
35.9
14.7
18.9
P/E (x)
FY17 FY18E
69.6
46.3
NM
NM
30.5
26.6
23.4
36.7
40.7
31.0
14.1
14.5
NM
15.5
18.8
12.6
NM
19.0
15.8
19.8
10.9
16.9
37.0
21.2
11.3
10.0
28.1
8.9
14.9
10.1
18.7
16.7
12.8
126.4
68.0
72.2
17.1
14.8
18.5
15.4
10.4
14.0
19.4
15.4
13.1
16.5
30.7
18.8
13.2
17.1
15.3
17.0
37.6
26.8
NM
10.4
12.6
NM
10.4
18.4
10.3
NM
11.6
12.1
14.8
14.4
14.5
22.4
16.9
13.4
11.8
25.6
14.0
10.3
10.1
24.8
14.0
12.9
85.4
57.8
60.2
14.8
14.3
16.1
15.2
11.7
12.9
16.8
14.9
11.8
14.4
25.4
18.7
12.0
15.9
15.3
16.8
96.2
22.2
NM
P/B (x)
FY17 FY18E
6.9
6.1
3.5
3.6
7.6
7.0
8.9
7.7
5.8
5.3
1.8
3.9
0.4
2.4
1.3
1.8
0.7
1.8
1.8
1.6
3.4
1.7
6.3
2.3
3.4
2.0
5.7
2.3
0.8
1.0
3.9
1.7
1.7
10.4
12.9
12.4
2.8
3.7
4.5
3.2
1.6
4.9
3.2
2.1
1.7
2.6
9.6
5.6
2.2
2.7
2.4
3.9
2.5
4.8
1.4
1.4
4.2
0.5
2.0
1.3
1.7
0.8
1.7
1.7
1.6
2.9
1.6
5.1
2.1
2.9
1.8
4.9
2.0
0.8
0.9
3.5
1.5
1.6
9.5
11.7
11.4
2.5
3.3
3.9
2.9
1.4
3.8
3.1
2.2
1.7
2.5
7.7
6.0
2.0
2.6
2.2
3.8
2.4
4.1
1.6
FY17
10.4
-23.5
25.0
24.7
14.2
14.0
24.4
-7.9
17.3
7.2
12.4
-6.7
9.7
15.7
8.2
32.4
9.6
17.8
11.6
32.4
21.2
21.0
31.4
5.7
10.1
23.2
11.6
13.3
8.2
20.6
17.2
16.2
27.5
26.5
22.0
14.3
40.4
16.8
13.2
13.7
17.0
37.1
32.6
18.4
16.9
17.2
22.9
6.7
16.2
-1.6
ROE (%)
FY18E
14.0
-2.0
26.3
22.6
17.0
15.2
32.0
-5.4
21.3
7.0
15.0
-12.6
14.8
14.3
10.6
21.7
11.3
25.3
13.1
23.6
16.0
20.6
15.5
7.5
9.4
15.1
12.3
12.1
11.1
21.3
18.9
16.6
24.9
25.7
20.0
13.0
33.0
17.3
14.5
14.4
17.9
33.7
31.1
17.4
16.1
15.0
22.8
2.5
19.8
-17.3
FY19E
18.2
6.9
30.2
24.5
22.2
15.4
35.1
0.8
20.8
7.5
15.5
-5.5
18.4
16.8
13.5
22.3
11.8
28.0
14.0
21.7
15.8
19.6
17.0
7.8
10.9
26.4
12.3
12.7
14.0
22.2
19.6
17.3
23.8
23.1
19.8
14.2
29.4
20.1
16.2
15.4
20.7
32.3
33.5
16.9
16.1
17.9
22.1
3.8
19.4
-21.7
Buy
Sell
Buy
Buy
Neutral
Buy
Sell
Buy
Neutral
228
285
143
229
69
126
62
288
600
308
246
190
297
70
180
37
316
583
35
-14
33
30
1
43
-41
10
-3
16.2
19.7
-20.9
14.8
3.7
10.0
-6.2
15.1
37.9
21.8
22.6
-17.2
21.9
3.8
12.1
-10.6
24.8
49.6
26.1
26.9
2.4
25.7
4.2
12.2
-4.2
33.1
65.6
Neutral
Sell
Sell
Neutral
Buy
Buy
Neutral
Sell
Buy
Buy
Buy
Neutral
527
381
755
187
458
431
1,197
132
288
166
213
1,617
511
340
697
168
510
458
1,070
113
305
195
259
1,499
-3
-11
-8
-10
11
6
-11
-14
6
17
22
-7
48.3
22.6
20.4
8.8
40.7
43.0
42.5
14.8
19.3
16.4
11.4
96.7
36.7
26.3
33.7
11.0
34.1
36.7
46.8
9.4
27.9
16.5
8.6
115.5
43.5
29.8
46.5
13.1
36.3
40.4
51.9
11.7
30.1
19.7
17.6
128.1
Sell
Neutral
1,265
614
850
565
-33
-8
10.0
9.0
14.8
10.6
20.7
12.6
Buy
Neutral
Neutral
Buy
Neutral
Buy
Sell
Neutral
Neutral
Buy
Buy
Neutral
Buy
Neutral
Buy
525
885
253
968
124
778
484
600
500
623
1,729
2,505
407
289
796
600
950
250
1,200
140
880
450
610
540
750
1,848
2,350
490
270
950
14
7
-1
24
13
13
-7
2
8
20
7
-6
20
-6
19
30.6
59.8
13.7
62.9
11.9
55.5
24.9
38.9
38.0
37.7
56.3
133.4
30.9
16.9
52.1
35.4
61.8
15.7
63.7
10.6
60.2
28.7
40.3
42.3
43.3
68.0
133.6
34.0
18.1
51.9
41.9
65.9
16.5
69.5
13.1
68.0
32.9
43.0
48.7
52.0
80.4
147.7
36.8
19.1
70.0
Buy
Buy
Buy
418
398
93
490
480
110
17
21
18
11.1
14.9
-1.1
4.3
17.9
-10.9
6.6
20.4
-11.3
8 August 2017
26

Company
Tata Comm
Aggregate
Utiltites
Coal India
CESC
JSW Energy
NTPC
Power Grid
Tata Power
Aggregate
Others
Arvind
Avenue
Supermarts
Bata India
Reco
Buy
CMP
(INR)
653
TP
% Upside
EPS (INR)
(INR) Downside FY17 FY18E FY19E
775
19
27.2
8.7
26.1
P/E (x)
FY17 FY18E
24.0
74.9
39.3 217.5
16.8
18.9
17.9
13.4
15.9
15.5
15.4
31.4
120.3
47.3
29.1
30.7
26.7
57.5
35.1
24.1
27.9
11.3
66.2
73.9
18.4
21.4
36.5
13.4
61.3
44.8
30.9
20.8
22.5
40.8
18.0
36.3
58.5
47.6
51.7
49.4
14.3
11.0
21.9
13.0
13.0
12.6
13.5
30.1
72.6
40.7
27.5
27.1
18.4
30.4
21.0
21.5
20.1
11.2
47.7
30.7
13.4
20.2
22.2
11.2
38.4
39.7
25.3
17.1
22.4
28.5
17.9
30.7
39.4
45.6
41.2
28.9
P/B (x)
FY17 FY18E
11.7
10.1
2.7
2.7
6.4
1.2
1.1
1.5
2.4
1.8
2.3
2.8
15.0
6.2
33.0
8.3
4.5
4.4
4.9
7.8
23.0
3.4
6.4
4.3
1.6
2.9
4.7
3.6
3.9
4.2
8.7
5.2
6.3
3.9
2.8
4.7
21.7
8.6
12.3
4.5
6.3
1.1
1.1
1.4
2.1
1.7
2.1
2.6
13.1
5.6
29.6
6.8
3.9
3.0
3.9
6.3
20.4
2.6
5.8
3.8
1.5
2.6
5.1
2.9
3.6
4.0
7.8
4.4
5.2
3.5
2.5
4.2
19.1
7.8
10.1
4.0
ROE (%)
FY17 FY18E FY19E
132.2 14.5
33.6
6.9
1.2
2.8
37.8
6.5
6.3
11.5
16.2
11.2
14.9
10.3
17.9
13.9
115.2
31.1
17.5
8.1
15.1
37.7
86.2
34.8
10.2
5.9
8.6
14.8
13.6
29.8
7.3
10.2
31.6
26.8
32.8
9.8
16.6
13.7
43.3
19.5
27.4
9.5
44.5
10.6
4.9
10.9
17.3
13.9
15.8
9.1
19.3
14.4
113.3
27.7
22.5
12.3
20.7
32.3
107.5
26.4
12.7
12.5
11.7
13.4
21.6
28.6
8.5
10.2
32.5
27.8
25.4
13.0
14.7
14.5
51.6
18.0
26.9
14.8
47.0
10.8
4.8
12.3
17.8
12.1
16.6
12.0
23.0
15.8
106.1
29.6
23.4
12.6
24.3
31.6
137.7
23.5
13.1
16.2
14.8
13.7
26.0
27.6
13.5
14.5
34.5
28.2
23.8
16.4
16.7
15.6
54.5
20.7
28.8
17.5
Buy
Buy
Buy
Buy
Buy
Sell
251
978
69
174
226
80
315
1,360
85
198
262
68
25
39
23
14
16
-15
14.9
51.9
3.9
13.0
14.2
5.2
17.6
88.9
3.2
13.4
17.4
6.4
18.6
99.3
3.1
16.2
20.6
6.7
Neutral
Neutral
389
923
640
398
267
444
176
2,375
310
1,286
147
1,038
246
102
374
695
248
779
1,113
2,660
161
750
2,965
1,544
263
1,385
6,292
185
346
375
882
-
527
323
523
237
3,334
368
1,312
200
1,130
240
-
465
755
394
927
1,300
3,295
226
952
3,044
1,816
287
1,288
5,281
167
393
-4
-4
12.4
7.7
13.5
12.9
12.7
15.7
14.4
9.8
24.1
5.8
112.9
14.4
63.9
13.2
21.8
8.0
7.6
18.5
31.3
22.1
20.3
28.0
105.1
9.4
33.4
104.1
86.3
8.6
35.1
137.8
4.5
11.9
18.6
17.6
19.4
15.0
12.9
29.0
7.9
166.7
17.5
93.7
15.4
24.7
12.0
10.0
21.1
37.7
26.2
30.9
42.2
126.7
11.3
38.1
144.6
109.2
10.3
42.9
176.1
6.0
16.0
Under
Review
Castrol India
Buy
Century Ply.
Neutral
Coromandel Intl Buy
Delta Corp
Buy
Dynamatic Tech Buy
Eveready Inds. Buy
Interglobe
Neutral
Indo Count
Buy
Info Edge
Buy
Inox Leisure
Sell
Under
Jain Irrigation
Review
Just Dial
Neutral
Kaveri Seed
Buy
Kitex Garm.
Buy
Manpasand
Buy
MCX
Buy
Monsanto
Buy
Navneet
Buy
Education
PI Inds.
Buy
Piramal Enterp. Buy
SRF
Buy
S H Kelkar
Buy
Symphony
Sell
TTK Prestige
Neutral
V-Guard
Neutral
Wonderla
Buy
32
21
18
35
40
19
2
36
9
-3
13.6
8.7
16.6
3.1
67.6
12.9
46.0
13.0
15.7
3.3
5.5
24
9
59
19
17
24
40
27
3
18
9
-7
-16
-10
14
17.5
19.1
18.6
12.7
24.8
86.2
7.8
33.4
72.6
85.9
7.2
23.7
132.1
3.6
7.0
8 August 2017
27

MOSL Universe stock performance
Company
Automobiles
Amara Raja
Ashok Ley.
Bajaj Auto
Bharat Forge
Bosch
CEAT
Eicher Mot.
Endurance Tech.
Escorts
Exide Ind
Hero Moto
M&M
Mahindra CIE
Maruti Suzuki
Tata Motors
TVS Motor
Banks - Private
Axis Bank
DCB Bank
Equitas Hold.
Federal Bank
HDFC Bank
ICICI Bank
IDFC Bank
IndusInd
J&K Bank
Kotak Mah. Bk
RBL Bank
South Indian
Yes Bank
Banks - PSU
BOB
BOI
Canara
IDBI Bk
Indian Bk
OBC
PNB
SBI
Union Bk
NBFCs
Bajaj Fin.
Bharat Fin.
Capital First
Cholaman.Inv.&Fn
Dewan Hsg.
GRUH Fin.
HDFC
Indiabulls Hsg
L&T Fin.Holdings
LIC Hsg Fin
Manappuram
M&M Fin.
Muthoot Fin
PFC
Repco Home
REC
STF
Shriram City Union
1 Day (%)
2.1
2.0
0.6
0.6
-0.9
4.3
1.3
1.7
-0.1
0.2
-0.1
-1.3
2.3
0.8
-1.1
0.6
-0.5
0.4
-0.1
0.4
-0.2
1.3
0.4
-0.7
0.3
0.0
0.9
-0.2
-0.4
0.6
-0.3
0.2
0.4
0.0
0.4
0.5
1.8
0.7
4.1
-1.0
1.7
2.2
0.1
0.6
-0.4
-0.4
1.4
0.6
3.6
0.2
2.4
6.6
-8.3
4.1
-0.2
-1.2
1M (%)
-4.2
6.7
6.7
3.9
3.1
-4.7
14.9
6.5
0.0
-6.0
7.4
1.8
5.3
5.5
-1.5
5.3
0.5
1.0
5.4
-1.0
7.3
3.5
-11.0
8.5
-5.4
3.5
-1.4
3.7
19.8
-0.4
11.6
1.9
1.5
1.8
-2.0
5.3
11.0
-3.1
28.8
12.6
11.5
6.1
4.9
4.4
6.0
13.1
19.0
-7.1
4.6
17.8
5.5
8.8
-13.2
0.4
-9.2
-13.5
12M (%)
-8.8
26.3
1.1
42.8
-2.4
99.7
43.8
155.4
23.6
15.1
-5.6
38.4
58.4
-16.6
98.8
-10.5
71.6
-7.2
78.5
43.1
34.1
14.7
39.5
20.1
29.2
50.1
43.2
1.5
41.7
39.7
-17.7
51.7
14.8
23.0
33.6
6.6
77.6
1.8
11.0
7.3
85.0
69.6
28.8
51.4
102.8
32.7
23.2
27.3
34.5
24.4
-15.0
66.5
-23.9
7.8
Company
Capital Goods
ABB
Bharat Elec.
BHEL
Blue Star
CG Cons. Elec.
CG Power & Inds Sol.
Cummins
GE T&D
Havells
K E C Intl
L&T
Pennar Eng.
Siemens
Solar Ind
Suzlon Energy
Thermax
Va Tech Wab.
Voltas
Cement
Ambuja Cem.
ACC
Birla Corp.
Dalmia Bharat
Grasim Inds.
India Cem
J K Cements
JK Lakshmi Ce
Ramco Cem
Orient Cem
Prism Cem
Shree Cem
Ultratech
Consumer
Asian Paints
Britannia
Colgate
Dabur
Emami
Godrej Cons.
GSK Cons.
HUL
ITC
Jyothy Lab
Marico
Nestle
Page Inds
Parag Milk
Pidilite Ind.
P&G Hygiene
Prabhat Dairy
United Brew
United Spirits
Healthcare
Alembic Phar
Alkem Lab
Ajanta Pharma
Aurobindo
Biocon
Cadila
Cipla
1 Day (%)
-1.7
1.6
0.9
2.3
1.5
1.4
0.9
1.2
0.8
0.3
0.2
3.3
-0.3
0.5
-2.0
0.5
0.7
-0.8
0.7
0.2
0.7
3.2
-0.2
1.0
1.5
-0.8
1.3
0.1
0.0
0.2
-0.5
-0.6
5.0
-0.1
3.9
-0.5
0.7
0.1
-0.6
-0.3
0.4
2.8
0.6
0.2
-1.1
0.5
-1.1
2.0
1.2
-0.8
0.0
2.7
0.2
-0.1
-0.8
0.4
-0.3
1M (%)
-3.6
6.9
2.7
14.6
-3.7
-0.8
3.8
12.9
5.7
12.1
3.7
-2.0
0.6
5.2
-6.7
-1.5
-6.3
15.0
10.9
12.8
9.5
3.0
7.8
-1.9
5.4
-5.7
-1.2
-0.2
-3.1
-1.3
-0.9
2.9
11.2
-1.3
5.8
8.9
-0.4
-1.0
7.9
-16.2
5.3
4.0
-2.0
-2.9
7.7
-0.3
0.0
1.7
2.2
-1.8
3.0
3.3
-13.6
3.9
5.2
3.4
3.5
12M (%)
15.2
44.4
0.8
39.9
32.6
2.0
9.9
8.4
21.9
112.4
16.9
-35.1
4.9
40.4
1.2
4.7
7.9
54.0
1.4
5.5
65.5
83.8
27.9
62.0
36.8
4.1
23.2
-8.0
8.9
8.1
6.8
0.6
42.5
12.0
7.9
0.0
21.8
-11.8
28.2
11.4
32.0
13.2
-1.2
18.0
-23.1
11.9
26.0
51.1
3.0
14.3
-16.2
22.5
-26.7
-6.0
27.6
42.0
6.2
8 August 2017
28

MOSL Universe stock performance
Company
Divis Lab
Dr Reddy’s
Fortis Health
Glenmark
Granules
GSK Pharma
IPCA Labs
Jubilant Life
Lupin
Sanofi India
Shilpa Medicare
Strides Shasun
Sun Pharma
Syngene Intl
Torrent Pharma
Logistics
Allcargo Logistics
Blue Dart
Concor
Gateway Distriparks
Gati
Transport Corp.
Media
Dish TV
D B Corp
Den Net.
Ent.Network
Hind. Media
HT Media
Jagran Prak.
Music Broadcast
PVR
Siti Net.
Sun TV
Zee Ent.
Metals
Hindalco
Hind. Zinc
JSPL
JSW Steel
Nalco
NMDC
SAIL
Vedanta
Tata Steel
Oil & Gas
BPCL
GAIL
Gujarat Gas
Gujarat St. Pet.
HPCL
IOC
IGL
MRPL
Oil India
ONGC
PLNG
Reliance Ind.
Retail
Jubilant Food
Titan Co.
1 Day (%)
0.2
-1.5
-1.1
-0.1
0.5
-0.4
0.2
0.3
-0.8
1.1
-0.8
3.7
-0.1
1.2
1.3
-0.1
-0.9
0.4
0.0
-0.2
-0.2
-3.0
-0.2
0.0
-0.7
0.4
0.9
1.5
-0.2
2.2
-0.6
-3.7
-0.2
1.2
-0.3
3.4
0.2
0.2
0.6
1.4
-0.4
4.3
2.1
0.6
0.4
1.4
6.1
3.2
1.3
1.7
1.4
-0.3
2.5
-0.4
-1.1
0.5
1M (%)
0.4
-18.3
3.7
3.4
-6.3
-7.1
-1.2
-2.0
-11.8
2.3
-3.1
7.7
-8.0
-1.1
-0.7
0.7
-14.0
0.1
-4.9
-6.1
-12.4
-2.7
-1.4
1.5
-9.1
-3.4
6.7
0.4
-1.6
0.8
-4.5
-8.8
6.8
16.8
6.8
8.6
5.8
2.4
8.5
1.2
11.8
8.3
19.2
6.2
0.0
8.2
37.3
12.9
11.8
8.2
9.2
4.0
-2.0
8.4
15.6
15.2
12M (%)
-42.3
-26.4
-12.9
-18.3
-6.0
-24.0
-10.9
111.9
-41.2
-4.1
11.9
-8.4
-39.9
12.8
-15.2
-8.2
-27.1
2.3
-0.7
-27.2
37.1
-21.4
-7.7
-7.3
21.8
0.2
9.7
-1.1
17.3
-33.4
64.1
8.8
58.3
30.4
73.3
31.7
40.7
22.6
29.7
70.2
57.5
35.0
32.8
21.6
39.8
64.0
50.0
80.0
66.8
2.4
10.3
37.1
59.3
7.9
47.4
Company
Technology
Cyient
HCL Tech.
Hexaware
Infosys
KPIT Tech
L&T Infotech
Mindtree
Mphasis
NIIT Tech
Persistent Sys
Tata Elxsi
TCS
Tech Mah
Wipro
Zensar Tech
Telecom
Bharti Airtel
Bharti Infratel
Idea Cellular
Tata Comm
Utiltites
Coal India
CESC
JSW Energy
NTPC
Power Grid
Tata Power
Others
Arvind
Avenue Super.
Bata India
Castrol India
Century Ply.
Coromandel Intl
Delta Corp
Dynamatic Tech
Eveready Inds.
Interglobe
Indo Count
Info Edge
Inox Leisure
Jain Irrigation
Just Dial
Kaveri Seed
Kitex Garm.
Manpasand
MCX
Monsanto
Navneet Educat.
PI Inds.
Piramal Enterp.
SRF
S H Kelkar
Symphony
TTK Prestige
V-Guard
Wonderla
1 Day (%)
-0.2
-0.6
0.6
-1.7
-0.3
0.6
2.5
0.2
-0.7
-2.0
1.8
-0.7
-0.4
-0.3
0.9
-0.8
-2.1
0.4
1.8
0.8
1.2
1.3
-1.6
0.5
-0.3
6.7
1.5
1.6
0.6
2.0
-0.7
6.0
-0.3
2.3
0.9
4.2
2.1
-1.3
-0.4
6.2
-0.4
0.1
-0.2
-0.2
-1.4
1.5
2.0
0.9
1.7
-0.2
-0.1
-0.9
1.6
-0.3
1M (%)
1.1
6.5
6.4
3.4
-6.9
-2.1
-10.3
0.6
-10.3
-6.4
2.1
7.4
7.0
12.4
-1.4
8.6
-1.5
11.6
-2.3
0.1
12.1
7.6
9.6
7.9
-1.9
4.9
3.0
11.6
-0.7
-7.4
8.3
4.6
-2.0
-12.2
3.3
-10.4
-0.7
-10.4
-3.3
2.7
10.2
-9.1
0.3
2.2
-5.5
-8.7
-6.7
0.7
0.6
0.8
3.1
-1.0
3.0
-4.0
12M (%)
0.7
7.7
14.7
-9.3
-6.6
11.4
-20.8
11.8
18.1
-8.0
5.4
-5.4
-17.9
5.9
-27.9
15.0
2.2
-12.3
44.6
-23.7
58.6
-15.3
8.1
27.9
12.5
25.8
20.5
-5.6
19.0
74.6
48.2
-3.7
27.5
56.6
-16.7
23.4
-7.9
37.6
-20.0
84.7
-26.6
12.0
9.1
16.8
61.3
-4.4
88.2
0.8
2.3
21.2
30.4
52.0
-13.5
8 August 2017
29

NOTES
8 August 2017
30

THEMATIC/STRATEGY RESEARCH GALLERY

REPORT GALLERY
RECENT INITIATING COVERAGE REPORTS
Rs

DIFFERENTIATED PRODUCT GALLERY

Disclosures:
The following Disclosures are being made in compliance with the SEBI Research Analyst Regulations 2014 (herein after referred to as the Regulations).
Motilal Oswal Securities Ltd. (MOSL) is a SEBI Registered Research Analyst having registration no. INH000000412. MOSL, the Research Entity (RE) as defined in the Regulations, is engaged in the business of providing Stock
broking services, Investment Advisory Services, Depository participant services & distribution of various financial products. MOSL is a subsidiary company of Motilal Oswal Financial Service Ltd. (MOFSL). MOFSL is a listed
public company, the details in respect of which are available on
www.motilaloswal.com.
MOSL is registered with the Securities & Exchange Board of India (SEBI) and is a registered Trading Member with National Stock
Exchange of India Ltd. (NSE) and Bombay Stock Exchange Limited (BSE), Metropolitan Stock Exchange Of India Ltd. (MSE) for its stock broking activities & is Depository participant with Central Depository Services Limited
(CDSL) & National Securities Depository Limited (NSDL) and is member of Association of Mutual Funds of India (AMFI) for distribution of financial products. Details of associate entities of Motilal Oswal Securities Limited are
available on the website at
http://onlinereports.motilaloswal.com/Dormant/documents/Associate%20Details.pdf
Pending Regulatory Enquiries against Motilal Oswal Securities Limited by SEBI:
SEBI pursuant to a complaint from client Shri C.R. Mohanraj alleging unauthorized trading, issued a letter dated 29th April 2014 to MOSL notifying appointment of an Adjudicating Officer as per SEBI regulations to hold
inquiry and adjudge violation of SEBI Regulations; MOSL requested SEBI to provide all documents, records, investigation report relied upon by SEBI which were referred in Show Cause Notice and also sought personal
hearing. The matter is currently pending.
MOSL, it’s associates, Research Analyst or their relative may have any financial interest in the subject company. MOSL and/or its associates and/or Research Analyst may have beneficial ownership of 1% or more securities in
the subject company at the end of the month immediately preceding the date of publication of the Research Report.
MOSL and its associate company(ies), their directors and Research Analyst and their relatives may; (a) from
time to time, have a long or short position in, act as principal in, and buy or sell the securities or derivatives thereof of companies mentioned herein. (b) be engaged in any other transaction involving such securities and earn
brokerage or other compensation or act as a market maker in the financial instruments of the company(ies) discussed herein or act as an advisor or lender/borrower to such company(ies) or may have any other potential
conflict of interests with respect to any recommendation and other related information and opinions.; however the same shall have no bearing whatsoever on the specific recommendations made by the analyst(s), as the
recommendations made by the analyst(s) are completely independent of the views of the associates of MOSL even though there might exist an inherent conflict of interest in some of the stocks mentioned in the research
report.
Research Analyst may have served as director/officer, etc. in the subject company in the last 12 month period. MOSL and/or its associates may have received any compensation from the subject company in the past
12 months.
In the last 12 months period ending on the last day of the month immediately preceding the date of publication of this research report, MOSL or any of its associates may have:
a)
managed or co-managed public offering of securities from subject company of this research report,
b)
received compensation for investment banking or merchant banking or brokerage services from subject company of this research report,
c)
received compensation for products or services other than investment banking or merchant banking or brokerage services from the subject company of this research report.
d)
Subject Company may have been a client of MOSL or its associates during twelve months preceding the date of distribution of the research report.
MOSL and it’s associates have not received any compensation or other benefits from the subject company or third party in connection with the research report. To enhance transparency, MOSL has incorporated a Disclosure
of Interest Statement in this document. This should, however, not be treated as endorsement of the views expressed in the report. MOSL and / or its affiliates do and seek to do business including investment banking with
companies covered in its research reports. As a result, the recipients of this report should be aware that MOSL may have a potential conflict of interest that may affect the objectivity of this report. Compensation of Research
Analysts is not based on any specific merchant banking, investment banking or brokerage service transactions.
Terms & Conditions:
This report has been prepared by MOSL and is meant for sole use by the recipient and not for circulation. The report and information contained herein is strictly confidential and may not be altered in any way, transmitted to,
copied or distributed, in part or in whole, to any other person or to the media or reproduced in any form, without prior written consent of MOSL. The report is based on the facts, figures and information that are considered
true, correct, reliable and accurate. The intent of this report is not recommendatory in nature. The information is obtained from publicly available media or other sources believed to be reliable. Such information has not
been independently verified and no guaranty, representation of warranty, express or implied, is made as to its accuracy, completeness or correctness. All such information and opinions are subject to change without notice.
The report is prepared solely for informational purpose and does not constitute an offer document or solicitation of offer to buy or sell or subscribe for securities or other financial instruments for the clients. Though
disseminated to all the customers simultaneously, not all customers may receive this report at the same time. MOSL will not treat recipients as customers by virtue of their receiving this report.
Analyst Certification
The views expressed in this research report accurately reflect the personal views of the analyst(s) about the subject securities or issues, and no part of the compensation of the research analyst(s) was, is, or will be directly or
indirectly related to the specific recommendations and views expressed by research analyst(s) in this report.
Disclosure of Interest Statement
§
Analyst ownership of the stock
Companies where there is interest
No
A graph of daily closing prices of securities is available at
www.nseindia.com, www.bseindia.com.
Research Analyst views on Subject Company may vary based on Fundamental research and Technical Research. Proprietary
trading desk of MOSL or its associates maintains arm’s length distance with Research Team as all the activities are segregated from MOSL research activity and therefore it can have an independent view with regards to
subject company for which Research Team have expressed their views.
Regional Disclosures (outside India)
This report is not directed or intended for distribution to or use by any person or entity resident in a state, country or any jurisdiction, where such distribution, publication, availability or use would be contrary to law,
regulation or which would subject MOSL & its group companies to registration or licensing requirements within such jurisdictions.
For Hong Kong:
This report is distributed in Hong Kong by Motilal Oswal capital Markets (Hong Kong) Private Limited, a licensed corporation (CE AYY-301) licensed and regulated by the Hong Kong Securities and Futures Commission (SFC)
pursuant to the Securities and Futures Ordinance (Chapter 571 of the Laws of Hong Kong) “SFO”. As per SEBI (Research Analyst Regulations) 2014 Motilal Oswal Securities (SEBI Reg No. INH000000412) has an agreement with
Motilal Oswal capital Markets (Hong Kong) Private Limited for distribution of research report in Hong Kong. This report is intended for distribution only to “Professional Investors” as defined in Part I of Schedule 1 to SFO. Any
investment or investment activity to which this document relates is only available to professional investor and will be engaged only with professional investors.” Nothing here is an offer or solicitation of these securities,
products and services in any jurisdiction where their offer or sale is not qualified or exempt from registration. The Indian Analyst(s) who compile this report is/are not located in Hong Kong & are not conducting Research
Analysis in Hong Kong.
For U.S.
Motilal Oswal Securities Limited (MOSL) is not a registered broker - dealer under the U.S. Securities Exchange Act of 1934, as amended (the"1934 act") and under applicable state laws in the United States. In addition MOSL is
not a registered investment adviser under the U.S. Investment Advisers Act of 1940, as amended (the "Advisers Act" and together with the 1934 Act, the "Acts), and under applicable state laws in the United States.
Accordingly, in the absence of specific exemption under the Acts, any brokerage and investment services provided by MOSL, including the products and services described herein are not available to or intended for U.S.
persons. This report is intended for distribution only to "Major Institutional Investors" as defined by Rule 15a-6(b)(4) of the Exchange Act and interpretations thereof by SEC (henceforth referred to as "major institutional
investors"). This document must not be acted on or relied on by persons who are not major institutional investors. Any investment or investment activity to which this document relates is only available to major institutional
investors and will be engaged in only with major institutional investors. In reliance on the exemption from registration provided by Rule 15a-6 of the U.S. Securities Exchange Act of 1934, as amended (the "Exchange Act") and
interpretations thereof by the U.S. Securities and Exchange Commission ("SEC") in order to conduct business with Institutional Investors based in the U.S., MOSL has entered into a chaperoning agreement with a U.S.
registered broker-dealer, Motilal Oswal Securities International Private Limited. ("MOSIPL"). Any business interaction pursuant to this report will have to be executed within the provisions of this chaperoning agreement.
The Research Analysts contributing to the report may not be registered /qualified as research analyst with FINRA. Such research analyst may not be associated persons of the U.S. registered broker-dealer, MOSIPL, and
therefore, may not be subject to NASD rule 2711 and NYSE Rule 472 restrictions on communication with a subject company, public appearances and trading securities held by a research analyst account.
For Singapore
Motilal Oswal Capital Markets Singapore Pte Limited is acting as an exempt financial advisor under section 23(1)(f) of the Financial Advisers Act(FAA) read with regulation 17(1)(d) of the Financial Advisors Regulations and is a
subsidiary of Motilal Oswal Securities Limited in India. This research is distributed in Singapore by Motilal Oswal Capital Markets Singapore Pte Limited and it is only directed in Singapore to accredited investors, as defined in
the Financial Advisers Regulations and the Securities and Futures Act (Chapter 289), as amended from time to time. In respect of any matter arising from or in connection with the research you could contact the following
representatives of Motilal Oswal Capital Markets Singapore Pte Limited:
Disclaimer:
The report and information contained herein is strictly confidential and meant solely for the selected recipient and may not be altered in any way, transmitted to, copied or distributed, in part or in whole, to any other person
or to the media or reproduced in any form, without prior written consent. This report and information herein is solely for informational purpose and may not be used or considered as an offer document or solicitation of
offer to buy or sell or subscribe for securities or other financial instruments. Nothing in this report constitutes investment, legal, accounting and tax advice or a representation that any investment or strategy is suitable or
appropriate to your specific circumstances. The securities discussed and opinions expressed in this report may not be suitable for all investors, who must make their own investment decisions, based on their own investment
objectives, financial positions and needs of specific recipient. This may not be taken in substitution for the exercise of independent judgment by any recipient. Each recipient of this document should make such investigations
as it deems necessary to arrive at an independent evaluation of an investment in the securities of companies referred to in this document (including the merits and risks involved), and should consult its own advisors to
determine the merits and risks of such an investment. The investment discussed or views expressed may not be suitable for all investors. Certain transactions -including those involving futures, options, another derivative
products as well as non-investment grade securities - involve substantial risk and are not suitable for all investors. No representation or warranty, express or implied, is made as to the accuracy, completeness or fairness of
the information and opinions contained in this document. The Disclosures of Interest Statement incorporated in this document is provided solely to enhance the transparency and should not be treated as endorsement of the
views expressed in the report. This information is subject to change without any prior notice. The Company reserves the right to make modifications and alternations to this statement as may be required from time to time
without any prior approval. MOSL, its associates, their directors and the employees may from time to time, effect or have effected an own account transaction in, or deal as principal or agent in or for the securities
mentioned in this document. They may perform or seek to perform investment banking or other services for, or solicit investment banking or other business from, any company referred to in this report. Each of these entities
functions as a separate, distinct and independent of each other. The recipient should take this into account before interpreting the document. This report has been prepared on the basis of information that is already
available in publicly accessible media or developed through analysis of MOSL. The views expressed are those of the analyst, and the Company may or may not subscribe to all the views expressed therein. This document is
being supplied to you solely for your information and may not be reproduced, redistributed or passed on, directly or indirectly, to any other person or published, copied, in whole or in part, for any purpose. This report is not
directed or intended for distribution to, or use by, any person or entity who is a citizen or resident of or located in any locality, state, country or other jurisdiction, where such distribution, publication, availability or use would
be contrary to law, regulation or which would subject MOSL to any registration or licensing requirement within such jurisdiction. The securities described herein may or may not be eligible for sale in all jurisdictions or to
certain category of investors. Persons in whose possession this document may come are required to inform themselves of and to observe such restriction. Neither the Firm, not its directors, employees, agents or
representatives shall be liable for any damages whether direct or indirect, incidental, special or consequential including lost revenue or lost profits that may arise from or in connection with the use of the information.
The
person accessing this information specifically agrees to exempt MOSL or any of its affiliates or employees from, any and all responsibility/liability arising from such misuse and agrees not to hold MOSL or any of its affiliates or
employees responsible for any such misuse and further agrees to hold MOSL or any of its affiliates or employees free and harmless from all losses, costs, damages, expenses that may be suffered by the person accessing this
information due to any errors and delays.
Registered Office Address: Motilal Oswal Tower, Rahimtullah Sayani Road, Opposite Parel ST Depot, Prabhadevi, Mumbai-400025; Tel No.: 022-3980 4263; www.motilaloswal.com. Correspondence Address: Palm Spring
Centre, 2nd Floor, Palm Court Complex, New Link Road, Malad (West), Mumbai- 400 064. Tel No: 022 3080 1000. Compliance Officer: Neeraj Agarwal, Email Id:
na@motilaloswal.com,
Contact No.:022-30801085.
Registration details of group entities.: MOSL: NSE (Cash): INB231041238; NSE (F&O): INF231041238; NSE (CD): INE231041238; BSE (Cash): INB011041257; BSE(F&O): INF011041257; BSE(CD); MSE(Cash): INB261041231;
MSE(F&O): INF261041231; MSE(CD): INE261041231; CDSL: IN-DP-16-2015; NSDL: IN-DP-NSDL-152-2000; Research Analyst: INH000000412. AMFI: ARN 17397. Investment Adviser: INA000007100. Motilal Oswal Asset
Management Company Ltd. (MOAMC): PMS (Registration No.: INP000000670) offers PMS and Mutual Funds products. Motilal Oswal Wealth Management Ltd. (MOWML): PMS (Registration No.: INP000004409) offers wealth
management solutions. *Motilal Oswal Securities Ltd. is a distributor of Mutual Funds, PMS, Fixed Deposit, Bond, NCDs, Insurance and IPO products. * Motilal Oswal Commodities Broker Pvt. Ltd. offers Commodities
Products. * Motilal Oswal Real Estate Investment Advisors II Pvt. Ltd. offers Real Estate products. * Motilal Oswal Private Equity Investment Advisors Pvt. Ltd. offers Private Equity products
13 December 2016
31