Alkem Laboratories
BSE SENSEX
31,214
S&P CNX
9,711
12 August 2017
1QFY18 Results Update | Sector: Healthcare
CMP: INR1,707
TP: INR1,830(+7%)
Neutral
Motilal Oswal values your support in
the Asiamoney Brokers Poll 2017 for
India Research, Sales and Trading
team. We
request your ballot.
Weak 1Q due to GST impact; recovery expected in coming quarters
Bloomberg
Equity Shares (m)
M.Cap.(INRb)/(USDb)
52-Week Range (INR)
1, 6, 12 Rel. Per (%)
Avg Val, INRm
Free float (%)
ALKEM IN
120
263.9 / 4.1
2238 / 1400
-5/-17/-5
97
33.0
Financials & Valuations (INR b)
2017 2018E 2019E
Y/E Mar
Net Sales
58.5
63.8
74.4
EBITDA
10.0
10.9
13.5
PAT
9.0
8.8
11.0
EPS (INR)
75.7
73.5
91.6
Gr. (%)
7.5
-2.9
24.7
BV/Sh (INR)
353.4 410.4 481.4
RoE (%)
23.4
19.2
20.5
RoCE (%)
21.3
17.7
22.6
P/E (x)
22.5
23.2
18.6
P/BV (x)
4.8
4.2
3.5
Estimate change
TP change
Rating change
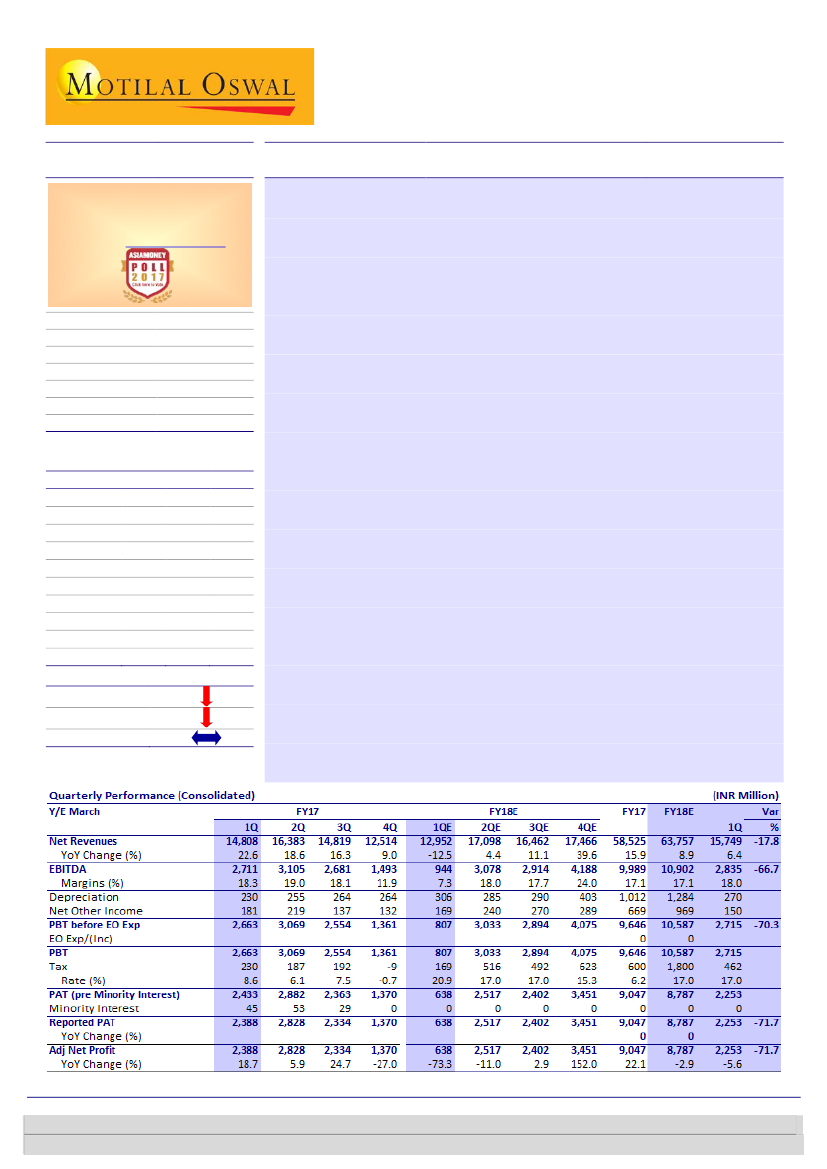
Revenue declined 12.5% YoY to INR12.9b (17% miss). Adjusted for accounting
treatment of excise duty cost of INR520m, gross margin remained flat. EBITDA
stood at INR944m, with the margin of ~7% coming in significantly below our
estimate due to poor performance in the domestic business (-21% YoY). R&D
expense stood at INR701m (5.4% of sales). PAT was at INR638m v/s INR2.4b in
1QFY17.
Weak domestic business growth; recovery expected in coming quarters:
Alkem’s domestic business declined 21% YoY to INR8.7b. The company lost
almost one month of sales due to destocking in the channel prior to GST
implementation. Given that 1H is seasonally strong, if full recovery of sales
does not happen by 2Q-end, then company may lose some sales in FY18. Full-
year growth guidance for the domestic business has been brought down to
low-double-digits from mid-teens earlier.
US – continues to grow at steady pace:
US sales came in at USD45m (up
~12.5% YoY). We expect ramp-up in the US business in the coming quarters, led
by the expected launch of 8-10 products in FY18. Also, 2H is seasonally strong
for Alkem due to products like Benzonatate.
Key concall takeaways:
a) Guided for low to mid-teens growth in 2QFY18. b)
Inventory days declined to 17 days by end of June as against 40 days in May . c)
Expect higher than market growth rate going ahead. d) Planning to file 12-15
ANDAs in FY18. e) Tax rate guidance of ~MAT rate in FY18E and 12-15% in
FY19E (lower in FY19E due to annual impact of tax benefit from the new Sikkim
plant).
Maintain Neutral:
We continue believing that Alkem is the best way to play the
domestic growth story (>70% of revenue and >85% of EBITDA came from India
in FY17). Having said that, at current valuations, the stock provides limited
room for upside. Our target price of INR1,830 for Alkem is based on 20x FY19E
PER (v/s INR1,900 @ 20x FY19E PER). We have cut our FY18/19E EPS estimate
by 8%/4%, as we build in the impact of slower domestic growth and INR
appreciation.
Investors are advised to refer through important disclosures made at the last page of the Research Report.
Motilal Oswal research is available on www.motilaloswal.com/Institutional-Equities, Bloomberg, Thomson Reuters, Factset and S&P Capital.
Kumar Saurabh
(Kumar.Saurabh@MotilalOswal.com); +91 22 6129 1519
Ankeet Pandya
(Ankeet.Pandya@MotilalOswal.com );

Alkem Laboratories
Key highlights from earnings call
India business (68% of sales)
Alkem’s India sales reported INR8.7b sales in 1QFY18, declining 20% YoY.
Decline in domestic market due challenging business environment
GST led to a sharp decline in inventory at the stockist leven which impacted the
domestic business.
Alkem exhibited robust growth in emerging therapies of Neuro/CNS, Cardiac, Anti-
Diabetic and derma outperforming the market growth. Alkem’s established therapy
areas of anti-infectives, gastro intenstinal and vitamins/minerals/nutrients reported
muted growth largely due to regulatory price cuts taken during FY17, which pulled
down the overall YoY growth for the company.
Exhibit 1: India business impacted by GST
India sales (INR m)
10803
1QFY17
8675
1QFY18
Source: Company, MOSL
Exhibit 2: Alkem’s therapy wise performance
Source: Company
US business (23% of sales)
US sales grew 9% YoY to INR INR3b. Company has launched 2 products during the
quarter and expects higher single digit launches which will drive the US business. In
1QFY18, Alkem received final approval for 2 ANDA from US FDA.
Cumulatively, it has filed 93 ANDAs (including 1 NDA) and received 40 approvals till
date including 6 tentative approvals. Company expects to file ~12-15 filings in FY18.
12 August 2017
2

Alkem Laboratories
Exhibit 3: US business grew 9% in 1QFY18
US sales (INR m)
2719
1QFY17
2962
1QFY18
Source: Company, MOSL
Exhibit 4: Cumulative US ANDA filings
93
Exhibit 5: 79% of pending ANDA’s are Para IVs
US Filings
Total ANDAs filed
Para IV (including FTFs)
NDAs
# Nos.
93
33
1
Source: Company, MOSL
53
34
6
Final Approval
Tentative
Approvals
Pending Total
Total
Source: Company, MOSL
Other international business (9% of sales)
Other international business grew 26% YoY to INR1.1b. Its key markets lke Australia,
Philippines and Kazakhstan recorded health growth. For other international market
growth was even high in constant currency.
Other highlights
Revenue R&D expenses for the quarter were at INR701m (5.4% of sales),
Successfully closed the US FDA inspection at bioequivalent facility at Taloja
without any form 483 observation
Tax rate higher for the FY18 due to MAT and lower in FY19 due to annual impact
of tax benefit from Sikkim plant
12 August 2017
3

Alkem Laboratories
Valuations
Over last 10 years, Alkem has outperformed the most of the Indian pharma
companies in domestic market, driven by consistent launches in acute therapies like
Anti Infective, Pain/Analgesic, and Vitamins while growing its presence in high
growth chronic therapies like CNS, Cardiac, Derma and Anti-Diabetic. Besides India
segment, Alkem has also launched ~25 products in US market and has 53 pending
approvals. Although India business faces regulatory issues & impact of GST and
structural changes along with pricing pressure in the US business, we expect Alkem’s
revenues to grow 13% CAGR and earnings growth of 10% CAGR FY17-19E.
We continue believing that Alkem is the best way to play the domestic growth story
(>70% of revenue and >85% of EBITDA came from India in FY17). Having said that, at
current valuations, the stock provides limited room for upside. Our target price of
INR1,830 for Alkem is based on 20x FY19E PER (v/s INR1,900 @ 20x FY19E PER). We
have cut our FY18/19E EPS estimate by 8%/4%, as we build in the impact of slower
domestic growth and INR appreciation.
12 August 2017
4

Alkem Laboratories
Story in charts
Exhibit 6: Overall sales declined 13% YoY to INR13b in 1Q
Sales (INR b)
17.3
14.5
Exhibit 7: EBITDA margin declined significantly
EBITDA (INR b)
17.1
18.5 18.5
13.6
EBITDA margin (%)
18.3 19.0 18.1
11.9
7.3
1.7
1.3
2.1
2.6
2.4
1.6
2.7
3.1
2.7
1.5
0.9
9.9
9.1
14.8 16.4 14.8
12.5 13.0
12.1 13.8 12.7 11.5
Source: Company, MOSL
Exhibit 8: Gross margins declined due to regrouping of
excise duty
Gross Profit (INR b)
60.7 60.3 60.1
57.1
5.2
7.3
8.3
7.7
7.2
9.0 10.0 9.4
7.9
62.5
Gross margin (%)
60.9 60.9
63.5 63.2
56.6
7.3
Exhibit 9: 1Q reported EPS stood at INR5.3/share
EPS (INR/sh)
58.3
5.8
13.5 10.9
16.8
22.3
15.8
20.0
7.2
23.7
19.5
11.5
5.3
Source: Company, MOSL
Exhibit 10: Revenues to exhibit 13% CAGR over FY16-19E
Revenue (INR b)
Exhibit 11: India sales to exhibit 14% CAGR over FY17-19E
India business (INR b)
16.9
20.2
25.0
31.3
37.9
50.5
58.5
63.8
74.4
14.8
17.5
20.5
23.6
28.3
36.5
42.2
47.2
54.8
Source: Company, MOSL
12 August 2017
5

Alkem Laboratories
Story in charts
Exhibit 12: US sales to be driven by new launches
US sales (INR m)
150.6
56.5
127.8
53.2
53.3
13.5
21.5
12.0
8.0
13.0
30.8
17.0
2.8
5.9
7.4
YoY Growth (%)
Exhibit 13: Increasing US sales contribution
% of sales
19.9
20.8
20.1
22.7
17.1
0.5
1.2
1.9
4.2
6.5
9.9
Source: Company, MOSL
Exhibit 14: R&D expense to be 5.5-6% of sales in FY18-19
R&D expense (INR m)
5.0%
5.2%
As % of sales
6.0%
6.0%
Exhibit 15: Better business mix to drive profitability
EBITDA (INR b)
17.0
18.6
14.5
13.1
14.4
EBITDA margin (%)
16.9
17.1
17.1
18.1
4.3%
4.5%
4.3%
1082
1570
1696
2171
3043
3825
4463
2.9
3.8
3.6
4.1
5.4
8.5
10.0
10.9
13.5
Source: Company, MOSL
Exhibit 16: Improving return ratios
RoE (%)
25.0
19.2
17.8
18.3
18.4
19.3
14.3
14.2
14.6
21.3
25.9
RoCE (%)
23.4
20.5
22.6
17.7
Exhibit 17: Earnings to grow at 10% CAGR over FY17-19E
EPS (INR/sh)
19.2
24.7
34.0
32.1
36.4
38.7
70.4
75.7
73.5
91.6
Source: Company, MOSL
12 August 2017
6

Alkem Laboratories
Financials and Valuations
Income Statement
Y/E Mar
Net Sales
Change (%)
EBITDA
EBITDA Margin (%)
Depreciation
EBIT
Interest
Other Income
Extraordinary items
PBT
Tax
Tax Rate (%)
Min. Int. & Assoc. Share
Reported PAT
Adjusted PAT
Change (%)
Y/E Mar
Share Capital
Reserves
Net Worth
Minority Interest
Debt
Deferred Tax
Total Capital Employed
Net Fixed Assets
Capital WIP
Goodwill on consolidation
Investments
Current Assets
Inventory
Debtors
Cash & Bank
Loans & Adv, Others
Curr Liabs & Provns
Curr. Liabilities
Provisions
Net Current Assets
Total Assets
2012
20,156
19.2
3,752
18.6
290
3,462
581
1,453
0
4,334
275
6.4
-7
4,065
4,065
37.5
2012
120
18,081
18,201
2
10,048
357
28,607
6,741
0
2,451
3,227
22,239
3,849
2,466
5,138
10,785
6,050
3,622
2,428
16,189
28,607
2013
24,952
23.8
3,625
14.5
398
3,227
882
1,672
0
4,016
180
4.5
-2
3,838
3,838
-5.6
2013
120
21,654
21,773
0
15,485
487
37,745
8,964
0
1,758
4,776
27,202
5,540
3,182
9,955
8,526
4,955
4,049
906
22,247
37,745
2014
31,260
25.3
4,100
13.1
523
3,578
931
1,653
0
4,300
-54
-1.2
0
4,353
4,353
13.4
2014
120
25,730
25,850
0
11,284
609
37,743
9,797
0
1,903
5,880
25,414
6,203
3,669
2,063
13,478
5,251
4,325
926
20,163
37,743
2015
37,887
21.2
5,445
14.4
703
4,742
811
1,810
-574
5,167
542
10.5
0
4,625
5,139
18.1
2015
239
29,752
29,991
857
13,059
964
44,870
11,429
0
3,421
4,808
33,008
7,842
5,271
7,908
11,987
7,796
6,286
1,510
25,212
44,870
2016
50,479
33.2
8,533
16.9
933
7,599
712
2,397
0
9,284
1,762
19.0
114
7,409
8,419
63.8
2016
239
34,787
35,027
965
5,885
945
42,822
11,589
1,093
3,531
4,220
33,944
9,094
5,645
7,964
11,241
11,482
9,487
1,995
22,462
42,895
2017
58,525
15.9
9,990
17.1
1,012
8,978
452
1,120
0
9,646
600
6.2
0
9,047
9,047
7.5
2017
239
42,012
42,251
965
5,885
937
50,038
14,202
2,969
3,531
4,220
39,928
10,904
7,215
9,292
12,516
14,214
10,267
3,947
25,714
50,636
2018E
63,757
8.9
10,902
17.1
1,284
9,618
(INR Million)
2019E
74,385
16.7
13,464
18.1
1,469
11,994
383
1,351
0
10,587
1,800
17.0
0
8,787
8,787
-2.9
2018E
239
48,821
49,060
965
5,885
937
56,847
16,793
2,094
3,531
4,220
46,933
10,861
6,987
15,739
13,346
16,125
11,617
4,509
30,807
57,444
353
1,397
0
13,038
2,086
16.0
0
10,952
10,952
24.6
2019E
239
57,307
57,546
965
5,885
937
65,333
18,498
1,919
3,531
4,220
56,702
12,518
8,152
24,237
11,794
18,939
13,455
5,483
37,763
65,931
Balance Sheet
(INR Million)
12 August 2017
7

Alkem Laboratories
Financials and Valuations
Y/E Mar
Basic (INR)
EPS
Cash EPS
Book Value
DPS
Payout (incl. Div. Tax.)
Valuation(x)
P/E
Price / Book Value
EV/Sales
EV/EBITDA
Dividend Yield (%)
Profitability Ratios (%)
RoE
RoCE
RoIC
Turnover Ratios (%)
Asset Turnover (x)
Debtors (No. of Days)
Inventory (No. of Days)
Creditors (No. of Days)
Leverage Ratios (%)
Net Debt/Equity (x)
Ratios
2012
34.0
36.4
152.2
2.0
6.8
0.0
0.0
0.0
0.0
0.1
25.0
17.8
19.3
0.7
43
70
50
0.1
2012
3,752
243
-1,448
-966
10
1,591
-2,481
-890
-2,612
-1,147
-6,240
0
646
-547
-210
-111
-4,760
9,898
5,138
2013
32.1
35.4
182.1
2.0
7.2
0.0
0.0
0.0
0.0
0.1
19.2
14.3
14.2
0.7
45
81
42
0.0
2013
3,625
59
-1,827
-1,102
26
781
-2,335
-1,554
-281
3,095
480
0
4,870
-797
-517
3,556
4,816
5,138
9,955
2014
36.4
40.8
216.2
2.0
6.4
46.9
7.9
6.8
52.0
0.1
18.3
14.2
13.7
0.8
41
72
36
0.1
2014
4,100
167
-364
-1,111
107
2,900
-1,004
1,897
25
-3,814
-4,792
0
-4,732
-914
-354
-6,000
-7,892
9,955
2,063
2015
38.7
48.9
250.9
4.0
12.3
44.1
6.8
5.5
38.4
0.2
18.4
14.6
13.6
0.8
49
76
45
0.0
2015
5,445
-796
-963
-1,056
652
3,281
-1,354
1,928
1,028
3,406
3,081
0
871
-793
-596
-518
5,845
2,063
7,908
2016
70.4
78.2
293.0
6.2
11.9
24.2
5.8
4.0
23.7
0.4
25.9
19.3
19.8
1.2
40
66
42
-0.2
2016
8,533
0
1,992
-1,762
-517
8,245
-2,296
5,950
588
2,397
689
0
-7,174
-712
-992
-8,878
56
7,908
7,964
2017
75.7
84.1
353.4
12.9
20.1
22.5
4.8
3.4
20.1
0.8
23.4
21.3
26.6
1.2
45
68
37
-0.2
2017
9,990
0
-1,924
-600
0
7,466
-5,500
1,966
0
1,120
-4,380
0
0
-452
-1,822
-2,274
812
8,481
9,292
2018E
73.5
84.2
410.4
14.0
22.5
23.2
4.2
3.0
17.8
0.8
19.2
17.7
23.3
1.1
39
62
40
-0.3
2018E
10,902
0
1,354
-1,800
0
10,457
-3,000
7,457
0
1,351
-1,649
0
0
-383
-1,978
-2,361
6,447
9,292
15,739
2019E
91.6
103.9
481.4
17.4
22.5
18.6
3.5
2.5
13.8
1.0
20.5
22.6
28.8
1.1
39
61
39
-0.4
2019E
13,464
0
1,542
-2,086
0
12,920
-3,000
9,920
0
1,397
-1,603
0
0
-353
-2,466
-2,819
8,498
15,739
24,237
Cash Flow Statement
Y/E Mar
Adjusted EBITDA
Non cash opr. exp (inc)
(Inc)/Dec in Wkg. Cap.
Tax Paid
Other operating activities
CF from Op. Activity
(Inc)/Dec in FA & CWIP
Free cash flows
(Pur)/Sale of Invt
Others
CF from Inv. Activity
Inc/(Dec) in Net Worth
Inc / (Dec) in Debt
Interest Paid
Divd Paid (incl Tax) & Others
CF from Fin. Activity
Inc/(Dec) in Cash
Add: Opening Balance
Closing Balance
(INR Million)
12 August 2017
8

Alkem Laboratories
Corporate profile
Company description
Established in 1973 and headquartered in Mumbai,
Alkem is a leading India pharmaceutical company
with global operations, engaged in the
development, manufacture and sale of
pharmaceutical and nutraceutical products. With a
portfolio of more than 700 brands in India, Alkem is
ranked fifth largest pharmaceutical company in
India in terms of domestic sales.
Source: MOSL/Bloomberg
Exhibit 1: Sensex rebased
Exhibit 2: Shareholding pattern (%)
Jun-17
Promoter
DII
FII
Others
67.0
2.4
4.2
26.4
Mar-17
67.0
2.5
4.2
26.3
Jun-16
66.9
3.4
3.5
26.2
Source: Capitaline
Exhibit 3: Top holders
Holder Name
Prabhat Narain Singh
Rajesh Kumar
Rajeev Ranjan
Deepak Kumar Singh
Kishor Kumar Singh
% Holding
3.1
2.8
2.5
2.3
2.3
Source: Capitaline
Note: FII Includes depository receipts
Exhibit 4: Top management
Name
Basudeo N Singh
Samprada Singh
Dhananjay Kumar Singh.
SANDEEP SINGH
Balmiki Prasad Singh
Mritunjay Kumar Singh
Manish Narang
Designation
Executive Chairman
Chairman Emeritus
Joint
Managing
Director
Joint
Managing
Director
Executive Director
Executive Director
Company Secretary
Exhibit 5: Directors
Name
A K Purwar
Mangaldas Chhaganlal Shah
SANGEETA KAPILJIT SINGH
Name
Akhouri Maheshwar Prasad
Ranjal Laxmana Shenoy
SUDHA RAVI
*Independent
Source: Capitaline
Exhibit 6: Auditors
Name
BSR & Co LLP
Manish Ghia & Associates
Suresh D Shenoy
Type
Statutory
Secretarial Audit
Cost Auditor
Exhibit 7: MOSL forecast v/s consensus
EPS
(INR)
FY18
FY19
MOSL
forecast
73.5
91.6
Consensus
forecast
78.5
99.5
Variation (%)
-6.4
-7.9
Source: Bloomberg
Source: Capitaline
12 August 2017
9

Disclosures:
The following Disclosures are being made in compliance with the SEBI Research Analyst Regulations 2014 (herein after referred to as the Regulations).
Motilal Oswal Securities Ltd. (MOSL) is a SEBI Registered Research Analyst having registration no. INH000000412. MOSL, the Research Entity (RE) as defined in the Regulations, is engaged in the business of providing Stock
broking services, Investment Advisory Services, Depository participant services & distribution of various financial products. MOSL is a subsidiary company of Motilal Oswal Financial Service Ltd. (MOFSL). MOFSL is a listed
public company, the details in respect of which are available on
www.motilaloswal.com.
MOSL is registered with the Securities & Exchange Board of India (SEBI) and is a registered Trading Member with National Stock
Exchange of India Ltd. (NSE) and Bombay Stock Exchange Limited (BSE), Metropolitan Stock Exchange Of India Ltd. (MSE) for its stock broking activities & is Depository participant with Central Depository Services Limited
(CDSL) & National Securities Depository Limited (NSDL) and is member of Association of Mutual Funds of India (AMFI) for distribution of financial products. Details of associate entities of Motilal Oswal Securities Limited are
available on the website at
http://onlinereports.motilaloswal.com/Dormant/documents/Associate%20Details.pdf
Pending Regulatory Enquiries against Motilal Oswal Securities Limited by SEBI:
SEBI pursuant to a complaint from client Shri C.R. Mohanraj alleging unauthorized trading, issued a letter dated 29th April 2014 to MOSL notifying appointment of an Adjudicating Officer as per SEBI regulations to hold
inquiry and adjudge violation of SEBI Regulations; MOSL requested SEBI to provide all documents, records, investigation report relied upon by SEBI which were referred in Show Cause Notice and also sought personal
hearing. The matter is currently pending.
MOSL, it’s associates, Research Analyst or their relative may have any financial interest in the subject company. MOSL and/or its associates and/or Research Analyst may have beneficial ownership of 1% or more securities in
the subject company at the end of the month immediately preceding the date of publication of the Research Report.
MOSL and its associate company(ies), their directors and Research Analyst and their relatives may; (a)
from time to time, have a long or short position in, act as principal in, and buy or sell the securities or derivatives thereof of companies mentioned herein. (b) be engaged in any other transaction involving such securities and
earn brokerage or other compensation or act as a market maker in the financial instruments of the company(ies) discussed herein or act as an advisor or lender/borrower to such company(ies) or may have any other
potential conflict of interests with respect to any recommendation and other related information and opinions.; however the same shall have no bearing whatsoever on the specific recommendations made by the analyst(s),
as the recommendations made by the analyst(s) are completely independent of the views of the associates of MOSL even though there might exist an inherent conflict of interest in some of the stocks mentioned in the
research report.
Research Analyst may have served as director/officer, etc. in the subject company in the last 12 month period. MOSL and/or its associates may have received any compensation from the subject company in
the past 12 months.
In the last 12 months period ending on the last day of the month immediately preceding the date of publication of this research report, MOSL or any of its associates may have:
a)
managed or co-managed public offering of securities from subject company of this research report,
b)
received compensation for investment banking or merchant banking or brokerage services from subject company of this research report,
c)
received compensation for products or services other than investment banking or merchant banking or brokerage services from the subject company of this research report.
d)
Subject Company may have been a client of MOSL or its associates during twelve months preceding the date of distribution of the research report.
MOSL and it’s associates have not received any compensation or other benefits from the subject company or third party in connection with the research report. To enhance transparency, MOSL has incorporated a Disclosure
of Interest Statement in this document. This should, however, not be treated as endorsement of the views expressed in the report. MOSL and / or its affiliates do and seek to do business including investment banking with
companies covered in its research reports. As a result, the recipients of this report should be aware that MOSL may have a potential conflict of interest that may affect the objectivity of this report. Compensation of Research
Analysts is not based on any specific merchant banking, investment banking or brokerage service transactions.
Terms & Conditions:
This report has been prepared by MOSL and is meant for sole use by the recipient and not for circulation. The report and information contained herein is strictly confidential and may not be altered in any way, transmitted to,
copied or distributed, in part or in whole, to any other person or to the media or reproduced in any form, without prior written consent of MOSL. The report is based on the facts, figures and information that are considered
true, correct, reliable and accurate. The intent of this report is not recommendatory in nature. The information is obtained from publicly available media or other sources believed to be reliable. Such information has not
been independently verified and no guaranty, representation of warranty, express or implied, is made as to its accuracy, completeness or correctness. All such information and opinions are subject to change without notice.
The report is prepared solely for informational purpose and does not constitute an offer document or solicitation of offer to buy or sell or subscribe for securities or other financial instruments for the clients. Though
disseminated to all the customers simultaneously, not all customers may receive this report at the same time. MOSL will not treat recipients as customers by virtue of their receiving this report.
Analyst Certification
The views expressed in this research report accurately reflect the personal views of the analyst(s) about the subject securities or issues, and no part of the compensation of the research analyst(s) was, is, or will be directly or
indirectly related to the specific recommendations and views expressed by research analyst(s) in this report.
Alkem Laboratories
Disclosure of Interest Statement
Analyst ownership of the stock
Alkem Laboratories
No
A graph of daily closing prices of securities is available at
www.nseindia.com, www.bseindia.com.
Research Analyst views on Subject Company may vary based on Fundamental research and Technical Research. Proprietary
trading desk of MOSL or its associates maintains arm’s length distance with Research Team as all the activities are segregated from MOSL research activity and therefore it can have an independent view with regards to
subject company for which Research Team have expressed their views.
Regional Disclosures (outside India)
This report is not directed or intended for distribution to or use by any person or entity resident in a state, country or any jurisdiction, where such distribution, publication, availability or use would be contrary to law,
regulation or which would subject MOSL & its group companies to registration or licensing requirements within such jurisdictions.
For Hong Kong:
This report is distributed in Hong Kong by Motilal Oswal capital Markets (Hong Kong) Private Limited, a licensed corporation (CE AYY-301) licensed and regulated by the Hong Kong Securities and Futures Commission (SFC)
pursuant to the Securities and Futures Ordinance (Chapter 571 of the Laws of Hong Kong) “SFO”. As per SEBI (Research Analyst Regulations) 2014 Motilal Oswal Securities (SEBI Reg No. INH000000412) has an agreement with
Motilal Oswal capital Markets (Hong Kong) Private Limited for distribution of research report in Hong Kong. This report is intended for distribution only to “Professional Investors” as defined in Part I of Schedule 1 to SFO. Any
investment or investment activity to which this document relates is only available to professional investor and will be engaged only with professional investors.” Nothing here is an offer or solicitation of these securities,
products and services in any jurisdiction where their offer or sale is not qualified or exempt from registration. The Indian Analyst(s) who compile this report is/are not located in Hong Kong & are not conducting Research
Analysis in Hong Kong.
For U.S.
Motilal Oswal Securities Limited (MOSL) is not a registered broker - dealer under the U.S. Securities Exchange Act of 1934, as amended (the"1934 act") and under applicable state laws in the United States. In addition MOSL is
not a registered investment adviser under the U.S. Investment Advisers Act of 1940, as amended (the "Advisers Act" and together with the 1934 Act, the "Acts), and under applicable state laws in the United States.
Accordingly, in the absence of specific exemption under the Acts, any brokerage and investment services provided by MOSL, including the products and services described herein are not available to or intended for U.S.
persons. This report is intended for distribution only to "Major Institutional Investors" as defined by Rule 15a-6(b)(4) of the Exchange Act and interpretations thereof by SEC (henceforth referred to as "major institutional
investors"). This document must not be acted on or relied on by persons who are not major institutional investors. Any investment or investment activity to which this document relates is only available to major institutional
investors and will be engaged in only with major institutional investors. In reliance on the exemption from registration provided by Rule 15a-6 of the U.S. Securities Exchange Act of 1934, as amended (the "Exchange Act") and
interpretations thereof by the U.S. Securities and Exchange Commission ("SEC") in order to conduct business with Institutional Investors based in the U.S., MOSL has entered into a chaperoning agreement with a U.S.
registered broker-dealer, Motilal Oswal Securities International Private Limited. ("MOSIPL"). Any business interaction pursuant to this report will have to be executed within the provisions of this chaperoning agreement.
The Research Analysts contributing to the report may not be registered /qualified as research analyst with FINRA. Such research analyst may not be associated persons of the U.S. registered broker-dealer, MOSIPL, and
therefore, may not be subject to NASD rule 2711 and NYSE Rule 472 restrictions on communication with a subject company, public appearances and trading securities held by a research analyst account.
For Singapore
Motilal Oswal Capital Markets Singapore Pte Limited is acting as an exempt financial advisor under section 23(1)(f) of the Financial Advisers Act(FAA) read with regulation 17(1)(d) of the Financial Advisors Regulations and is a
subsidiary of Motilal Oswal Securities Limited in India. This research is distributed in Singapore by Motilal Oswal Capital Markets Singapore Pte Limited and it is only directed in Singapore to accredited investors, as defined in
the Financial Advisers Regulations and the Securities and Futures Act (Chapter 289), as amended from time to time. In respect of any matter arising from or in connection with the research you could contact the following
representatives of Motilal Oswal Capital Markets Singapore Pte Limited:
Disclaimer:
The report and information contained herein is strictly confidential and meant solely for the selected recipient and may not be altered in any way, transmitted to, copied or distributed, in part or in whole, to any other person
or to the media or reproduced in any form, without prior written consent. This report and information herein is solely for informational purpose and may not be used or considered as an offer document or solicitation of
offer to buy or sell or subscribe for securities or other financial instruments. Nothing in this report constitutes investment, legal, accounting and tax advice or a representation that any investment or strategy is suitable or
appropriate to your specific circumstances. The securities discussed and opinions expressed in this report may not be suitable for all investors, who must make their own investment decisions, based on their own investment
objectives, financial positions and needs of specific recipient. This may not be taken in substitution for the exercise of independent judgment by any recipient. Each recipient of this document should make such investigations
as it deems necessary to arrive at an independent evaluation of an investment in the securities of companies referred to in this document (including the merits and risks involved), and should consult its own advisors to
determine the merits and risks of such an investment. The investment discussed or views expressed may not be suitable for all investors. Certain transactions -including those involving futures, options, another derivative
products as well as non-investment grade securities - involve substantial risk and are not suitable for all investors. No representation or warranty, express or implied, is made as to the accuracy, completeness or fairness of
the information and opinions contained in this document. The Disclosures of Interest Statement incorporated in this document is provided solely to enhance the transparency and should not be treated as endorsement of the
views expressed in the report. This information is subject to change without any prior notice. The Company reserves the right to make modifications and alternations to this statement as may be required from time to time
without any prior approval. MOSL, its associates, their directors and the employees may from time to time, effect or have effected an own account transaction in, or deal as principal or agent in or for the securities
mentioned in this document. They may perform or seek to perform investment banking or other services for, or solicit investment banking or other business from, any company referred to in this report. Each of these entities
functions as a separate, distinct and independent of each other. The recipient should take this into account before interpreting the document. This report has been prepared on the basis of information that is already
available in publicly accessible media or developed through analysis of MOSL. The views expressed are those of the analyst, and the Company may or may not subscribe to all the views expressed therein. This document is
being supplied to you solely for your information and may not be reproduced, redistributed or passed on, directly or indirectly, to any other person or published, copied, in whole or in part, for any purpose. This report is not
directed or intended for distribution to, or use by, any person or entity who is a citizen or resident of or located in any locality, state, country or other jurisdiction, where such distribution, publication, availability or use would
be contrary to law, regulation or which would subject MOSL to any registration or licensing requirement within such jurisdiction. The securities described herein may or may not be eligible for sale in all jurisdictions or to
certain category of investors. Persons in whose possession this document may come are required to inform themselves of and to observe such restriction. Neither the Firm, not its directors, employees, agents or
representatives shall be liable for any damages whether direct or indirect, incidental, special or consequential including lost revenue or lost profits that may arise from or in connection with the use of the information.
The
person accessing this information specifically agrees to exempt MOSL or any of its affiliates or employees from, any and all responsibility/liability arising from such misuse and agrees not to hold MOSL or any of its affiliates or
employees responsible for any such misuse and further agrees to hold MOSL or any of its affiliates or employees free and harmless from all losses, costs, damages, expenses that may be suffered by the person accessing this
information due to any errors and delays.
Registered Office Address: Motilal Oswal Tower, Rahimtullah Sayani Road, Opposite Parel ST Depot, Prabhadevi, Mumbai-400025; Tel No.: 022-3980 4263; www.motilaloswal.com. Correspondence Address: Palm Spring
Centre, 2nd Floor, Palm Court Complex, New Link Road, Malad (West), Mumbai- 400 064. Tel No: 022 3080 1000. Compliance Officer: Neeraj Agarwal, Email Id:
na@motilaloswal.com,
Contact No.:022-30801085.
Registration details of group entities.: MOSL: NSE (Cash): INB231041238; NSE (F&O): INF231041238; NSE (CD): INE231041238; BSE (Cash): INB011041257; BSE(F&O): INF011041257; BSE(CD); MSE(Cash): INB261041231;
MSE(F&O): INF261041231; MSE(CD): INE261041231; CDSL: IN-DP-16-2015; NSDL: IN-DP-NSDL-152-2000; Research Analyst: INH000000412. AMFI: ARN 17397. Investment Adviser: INA000007100. Motilal Oswal Asset
Management Company Ltd. (MOAMC): PMS (Registration No.: INP000000670) offers PMS and Mutual Funds products. Motilal Oswal Wealth Management Ltd. (MOWML): PMS (Registration No.: INP000004409) offers wealth
management solutions. *Motilal Oswal Securities Ltd. is a distributor of Mutual Funds, PMS, Fixed Deposit, Bond, NCDs, Insurance and IPO products. * Motilal Oswal Commodities Broker Pvt. Ltd. offers Commodities
Products. * Motilal Oswal Real Estate Investment Advisors II Pvt. Ltd. offers Real Estate products. * Motilal Oswal Private Equity Investment Advisors Pvt. Ltd. offers Private Equity products
12 August 2017
10