24 August 2017
Market snapshot
Equities - India
Close
Chg .%
Sensex
31,568
0.9
Nifty-50
9,853
0.9
Nifty-M 100
17,857
1.2
Equities-Global
Close
Chg .%
S&P 500
2,444
-0.3
Nasdaq
6,278
-0.3
FTSE 100
7,383
0.0
DAX
12,174
-0.5
Hang Seng
10,955
0.0
Nikkei 225
19,435
0.3
Commodities
Close
Chg .%
Brent (US$/Bbl)
52
1.3
Gold ($/OZ)
1,287
0.1
Cu (US$/MT)
6,537
-0.2
Almn (US$/MT)
2,101
0.7
Currency
Close
Chg .%
USD/INR
64.1
0.0
USD/EUR
1.2
0.2
USD/JPY
109.5
0.1
YIELD (%)
Close
1MChg
10 Yrs G-Sec
6.5
0.0
10 Yrs AAA Corp
7.5
0.0
Flows (USD b)
23-Aug
MTD
FIIs
-0.1
-2.0
DIIs
0.1
2.0
Volumes (INRb)
23-Aug
MTD*
Cash
269
304
F&O
7,159
6,631
Note: YTD is calendar year, *Avg
YTD.%
18.6
20.4
24.4
YTD.%
9.2
16.6
3.4
6.0
16.6
1.7
YTD.%
-6.5
11.0
18.4
23.3
YTD.%
-5.5
11.7
-6.5
YTDchg
0.0
-0.1
YTD
6.8
6.0
YTD*
289
5,200
Today’s top research idea
Trident - Initiating Coverage: An attractive utilization play
v
TRID is set to deliver CAGR of 9% in revenue and 24% in earnings over FY17-
20, driven by revenue CAGR of 44% in bed linen and 12% in bath linen.
v
The recently ventured bed linen segment is expected to turn EBITDA
profitable by 3QFY18 as utilization touches 40%. The segment’s share in
overall revenue should increase from 4% in FY17 to 9% in FY20.
v
After significant capacity expansion in bath linen in FY15, TRID is expected to
reap its benefits and witness higher utilization (65% in FY20 v/s 50% in FY17),
which would not require further addition of spindles as yarn capacity would
be utilized in-house.
v
The rising share of copier paper should lead to paper business margin
expansion of 340bp to 38% in FY20.
v
We value TRID at 11x FY19E EPS, arriving at a TP of INR114. Initiating with Buy.
Research covered
Cos/Sector
Trident
India Strategy
P & G Hygiene
Castrol India
Key Highlights
An attractive utilization play
Contrarian Investing: Digging deeper; Exploring more angles
P&G Hygiene And Healthcare: Downgrade to Neutral
EBITDA below estimate; lower volumes due to pre-GST destocking
Piping hot news
Infosys row: Chorus grows for Seshasayee’s exit, Nandan Nilekani’s entry
v
Infosys Ltd chairman R. Seshasayee may be on his way out even as a chorus
calling for the return of co-founder Nandan Nilekani grows louder, five days
after CEO Vishal Sikka abruptly resigned and the board blamed former
chairman and promoter N.R. Narayana Murthy for the exit.
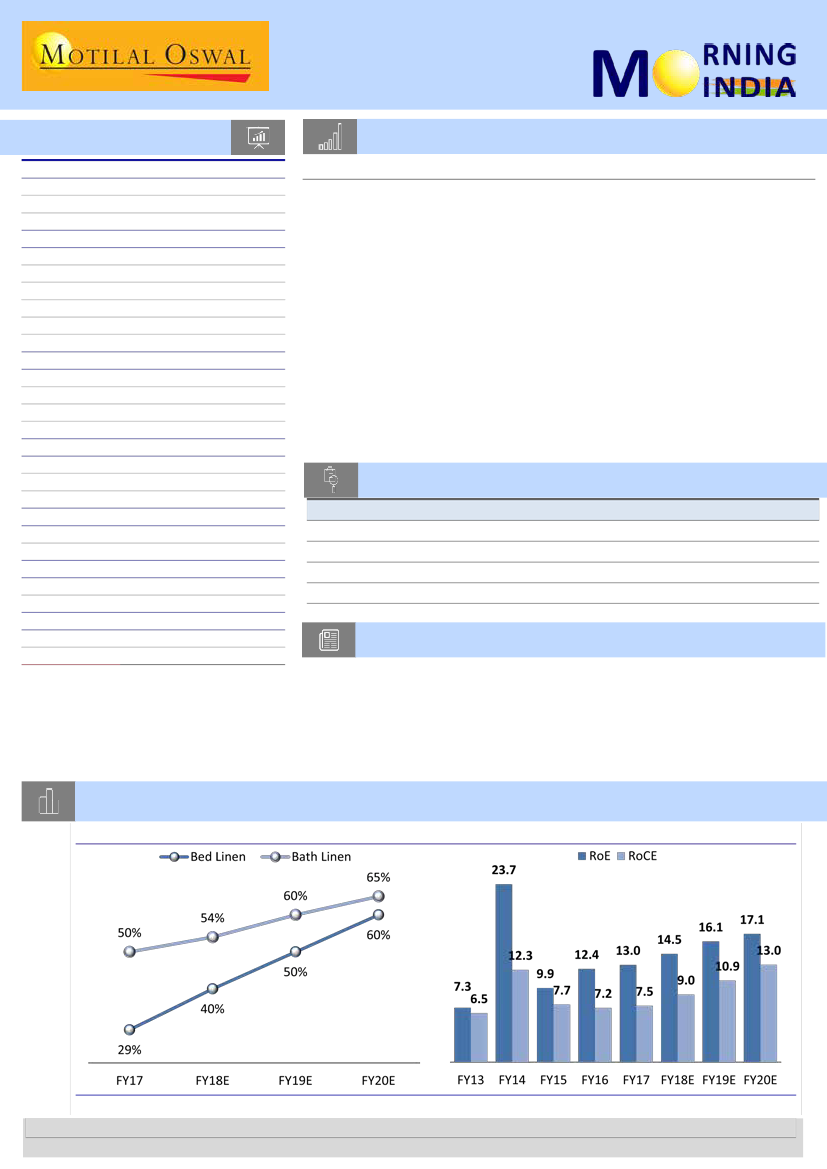
Chart of the Day: Trident - An attractive utilization play
Increased utilization in home textile to bolster growth
Higher utilization to improve return ratios
Research Team (Gautam.Duggad@MotilalOswal.com)
Motilal Oswal research is available on www.motilaloswal.com/Institutional-Equities, Bloomberg, Thomson Reuters, Factset and S&P Capital.
Investors are advised to refer through important disclosures made at the last page of the Research Report.

In the news today
Kindly click on textbox for the detailed news link
1
India’s rain deficit widens to
6%, raises crop yield concerns
India’s rainfall deficit for the June-
September monsoon season has
widened to 6 percent as of
Wednesday, the highest since the
season’s start on June 1, data
compiled by India Meteorological
Department (IMD) showed…
2
Tata Steel, India’s second-largest private steelmaker, has expressed
interest in bidding for debt-ridden Essar Steel, whose lenders have filed for
revival of the company under the Insolvency and Bankruptcy Code, two
people with knowledge of the development said. “Tata Steel has
informally conveyed to us their interest in bidding for Essar Steel,” a senior
executive at one of the lenders told ET. An investment banker familiar with
the matter said Tata Group’s new chairman, N Chandrasekaran, is keen to
get back the ‘top steelmaker’ tag that it lost to JSW Steel…
Tatas eye Essar Steel to regain steel crown
3
Chinese solar module firms
reneging on India contracts
In what has come as a shock to
India’s solar power developers,
Chinese module manufacturers
are reneging on their contracts
and are demanding an upward
price revision to supply the
equipment already contracted for,
said several people aware of the
development…
4
Reliance Industries eyes $300
million boost from switch to
ethane
The ongoing switch to ethane as
feedstock at Reliance Industries
Ltd’s petrochemical units in Dahej,
Hazira and Nagothane will drive
up operating profit by $300
million, company executives said…
5
To bring down its around Rs
49,000 crore gross debt, private
utility Tata Power is planning to
sell its non-core assets even as it
continues to explore viable
options to resolve issues
pertaining to the financially
crippled 4,000-megawatts (Mw)
Coastal Gujarat Power (CGPL) at
Mundra…
Tata Power to monetise non-
core assets to trim its near Rs
49,000-cr debt
6
Karnataka has received an
investment proposal from TVS
Motor Company to set up a
₹1,100-crore two-wheeler plant in
the State. “TVS plans to set up its
two-wheeler plant at Bytahalli,
Kadakola, in Mysuru…
7
Fortis promoters seek SC
approval to sell shares pledged
with banks, FIs
Fortis promoters Malvinder and
Shivinder Singh have approached
the Supreme Court (SC) asking for
permission to sell their Fortis
Healthcare shares already pledged
with banks and financial
institutions to reduce debt…
TVS Motor to set up ₹1,110-cr
2-wheeler plant in Mysuru
24 August 2017
2

Initiating Coverage | Sector: Textiles
Trident
Buy
BSE Sensex
31,292
S&P CNX
9,766
CMP: INR82
TP: INR114 (+39%)
Stock Info
Bloomberg
Equity Shares (m)
52-Week Range (INR)
M.Cap. (INR b)
M.Cap. (USD b)
1, 6, 12 Rel. Per (%)
Avg Val, (INR m)
Free float (%)
Financial Snapshot (INR b)
Y/E Mar
2017 2018E
Sales
47.4
52.2
EBITDA
8.9
9.9
NP
3.4
4.2
EPS (INR)
6.6
8.3
EPS Gr (%)
39.3
25.2
BV/Sh (INR)
54.1
60.5
RoE (%)
13.0
14.5
RoCE (%)
7.5
9.0
P/E (x)
12.4
9.9
P/BV (x)
1.5
1.4
TRID IN
509.4
92/45
41.7
0.7
-3/9/62
129
32.2
2019E
57.1
11.1
5.3
10.4
25.5
68.6
16.1
10.9
7.9
1.2
Trident (TRID) is one of India’s leading diversified group of businesses headquartered
in Ludhiana, Punjab. The company is one of the world’s largest manufacturers of
integrated home textile (bed and bath linen) and the largest manufacturer of wheat
straw-based paper. In FY17, the Home Textile business contributed 82% of its overall
revenue, while Paper accounted for 18%. It has manufacturing plants at Budni (MP)
and Barnala (Punjab) with combined installed capacity of 115mn kg of yarn, 175k MT
of paper, 90MT of bath linen and 43m mtrs of bed linen. TRID also owns the world’s
largest compact yarn spinning unit under single roof.
An attractive utilization play
Increasing utilization and entry into bed linen – the key growth drivers
n
n
Shareholding pattern (%)
As On
Jun-17 Mar-17 Jun-16
Promoter
DII
FII
Others
67.8
2.1
1.5
28.6
67.8
2.2
1.6
28.5
66.5
1.6
1.0
30.9
n
Home Textile contributes 82% of TRID’s revenues. Improving productivity and
operating efficiencies are expected to significantly boost utilization in this
segment over the coming years (65% utilization in its stronghold bath linen v/s
current level of 50%, and 60% utilization in the recently forayed bed linen v/s
current level of 29%). The focus on value-added products should help the
company improve realization impressively in Home Textile.
Paper accounts for 18% of its revenues. The company has presence in copier
paper (~60% of TRID’s Paper sales volume), which is among the top-selling brands
in India and commands high margins. TRID plans to implement a debottlenecking
project to release capacity of 250-275 TPD, improving capacity utilization and
allowing further expansion in the copier segment. Increased focus on copier
paper is expected to expand TRID’s Paper margin by 340bp to 38% in FY20E.
We estimate a CAGR of 9% in revenue and 24% in PAT over FY17-20, driven by
EBITDA margin expansion of 110bp and lower interest expense. We value the
stock at 11x FY19E EPS. We initiate coverage with a Buy rating and a target price
of INR114, implying 39% upside.
Margin expansion in Paper business led by copier
Copier paper is among the top selling brands in India and commands high
margins. Copier paper contributed 45% of Paper sales volume in FY13, which
increased to 60% in FY17. The company intends to leverage strong growth in
copier paper in India (CAGR of ~8% v/s ~4% in other paper and stationery) to
improve Paper realization and margin (+340bp to 38% in FY20E).
An attractive utilization play
Trident
Enhanced profitability led by bed linen
The company most recently ventured into bed linen, with installed capacity of
43m meters. In the first year of operations, bed linen had 29% utilization, and
the company expects to ramp-up operations by adding new clients. TRID has
already added more than 10 clients in FY18 so far, including large replenishment
clients like IKEA and Amazon. Bed linen currently posts EBITDA loss, which is
expected to turnaround by 3QFY18 as utilization reaches 40%. We believe new
customer acquisition and the expanding share of TRID in the global textile
market should help the bed linen segment increase utilization to 60% in FY20.
Niket Shah
+
91 22 3980 5436
Niket.Shah@motilaloswal.com
24 August 2017
3

Stock Performance (1-year)
Bath linen (towel) inching toward higher utilization
TRID is the market leader in the towel segment in India, and accounts for a
significant part (32%) of Indian towel exports to the US. The company used to run at
high utilization of 74% in FY13, which declined thereafter as TRID invested heavily in
capex and nearly doubled its capacities from 42MT to 90MT to make itself future-
ready. Since there would be no further capex, the company expects the plants to
return to higher utilization, resulting in margin expansion (as yarn capacity would be
utilized in-house and no further spinning capacity would be required). Capacity
utilization is expected to reach 65% in FY20E from the current level of 50%.
Rising share of India in global home textile market
In terry towel category, India accounts for 40% of the global market, which has
increased at 15% YoY. India also commands the third largest market share in the
Asia-Pacific home textile market, and is expected to grow fastest in the world at a
CAGR of 7.2% over 2015-2020. The growing share of India in the global home textile
market puts TRID in a sweet spot to garner more market share (evident from the
increase in the company’s market share in towel exports to the US, from 10% in
CY14 to 13% in CY16), particularly in bath linen, where it is the domestic market
leader.
Robust free cash flow generation with major capex cycle behind
In FY16, the company executed greenfield expansion, with total outlay of INR7.5b
for 1.9 lac spindles capable of producing compact yarn up to 120 counts. The
initiative was taken to attain 100% backward integration for the bed linen unit. The
company is not expected to invest heavily in expanding capacities, but is rather
likely to improve efficiencies by initiatives such as debottlenecking, which would
result in better capacity utilization and thus steady generation of free cash flows in
both Paper and Home Textile segments.
24 August 2017
4

Valuation and view
TRID appears to be at the onset of a high growth cycle, driven by:
1. Growth in bed linen segment:
The company is expected to turn EBITDA
profitable in the recently ventured bed linen segment by 3QFY18 as utilization
touches 40%. In the first year of operations, bed linen witnessed utilization of
29%, which is expected to increase to 60% in FY20. Also, the segment’s share in
overall revenue is expected to increase from 4% in FY17 to 9% in FY20.
2. Higher utilization in bath linen:
TRID used to run at high utilization of 74% in the
towel segment in FY13. However, utilization declined thereafter as the company
almost doubled its capacity in the segment from 42MT in FY13 to 90MT in FY15
to make itself future-ready. Going forward, the company is expected to witness
higher utilization (65% in FY20E v/s 50% in FY17), which would not require
further addition of spindles as yarn capacity would be utilized in-house.
3. TRID’s rising share in global market:
The share of Indian companies in the global
textile market is on the rise as the country is becoming highly competitive in
terms of raw material cost, labor cost and level of automation, leading to
improved quality. TRID has been proactive in capitalizing on this opportunity,
leading to an increase in the company’s share in global towel exports to the US
(from 10% in CY14 to 13% in CY16). Also, the company’s share in Indian towel
exports to the US has also increased from 28% in CY14 to 32% in CY16.
4. Paper biz margin driven by branded copier paper:
TRID has consistently
increased its share of copier paper over the years. Copier paper contributed 45%
of the company’s overall Paper sales volume in FY13, which increased to 60% in
FY17. Since, copier paper commands high margins, we expect Paper business
margin to expand 340bp to 38% in FY20.
We believe TRID is set to benefit from multiple factors, including industry growth
and expanding share of bed linen/copier paper. Hence, we estimate 9% sales CAGR
and 24% PAT CAGR over FY17-20, with improving RoCE and RoE (from 7.5% and 13%
in FY17 to 13% and 17.1% in FY20, respectively). IND AS adjustment recognized on
fair valuation of PPE to the tune of INR7,582m has resulted in a depressed return
ratios, with RoE and RoCE standing at 18.3% and 8.6% in FY17 pre-adjustment v/s
13% and 7.5% in FY17 post-adjustment. Consequently, pre-adjusted RoE and RoCE is
expected to increase to 21.4% and 15.1% in FY20E respectively. We value TRID at
11x FY19E EPS, arriving at a TP of INR114, implying 39% upside. We initiate coverage
with
Buy.
24 August 2017
5

24 August 2017
India Strategy
BSE Sensex: 31,568
Please refer our report dated
23 June 2017
S&P CNX: 9,853
Contrarian Investing: Digging deeper
Exploring more angles
We interacted with 100+ investors to discuss our recently released thematic report
on
Contrarian Investing.
Interestingly, the discussions have brought to light several
fresh angles, which we will explore in this sequel report.
Price-to-Cash flow theme of Contrarian Investing: Does it work?
In the first version of ‘Contrarian Investing,’ we explored the theme using relative
valuation multiples and dwelt upon P/E and P/B. We concluded that stocks
belonging to low P/E quintile have significantly outperformed those from high P/E
quintile over the last decade, and that the margin of outperformance is higher on
trailing multiples compared to forward multiples. In this report, we will explore if it
works the same way for the price-to-cash-flow (P/CF) multiple.
Our analysis reaches a similar conclusion and suggests that, in India, low P/CF stocks
outperform high P/CF stocks, and that the margin of outperformance is higher with
trailing multiples compared to forward multiples.
Telecom sector: A review of our framework
Telecom sector popularity with
analysts is very low relative to
history
Telecom popularity
Popularity rel. to history(rhs)
Popularity
Average
0.5
4.3
3.8
3.3
The Telecom sector is attracting significant attention, especially after the disruptive
entry of RJio. In the previous version, we applied our framework to Metals, IT and
Pharma, and concluded that (i) Metals qualified as a Contrarian Investing sector in
Mar’16 quarter and (ii) Pharmaceuticals is a sector ripe for Contrarian Investing
now. In this sequel, we look at the Telecom sector.
Popularity of the Telecom sector is at a multi-year low, whereas valuation is at an
11% discount to its long-term average EV/EBITDA. The combination of (a)
discounted valuations relative to historical averages and (b) low popularity on
ratings vis-à-vis history makes Telecom a good contrarian bet, in our view.
0.0
Migration of stocks in Q4: Does it make big difference?
In the previous version, we concluded that Quintile-4 offers the best returns. In
most of our subsequent investor meetings on the Contrarian Investing study, we
came across questions pertaining to stock migration and stock duration in Q4 (the
quintile that delivered the best returns as per our framework). Do stocks stay in Q4
for a reasonable span of time? How many stocks are upgraded from Q5 to Q4, or
downgraded from Q3 to Q4? Is return contribution more from members that are
upgraded or from those that are part of Q4 for a longer time horizon?
In this sequel, we have studied the returns for stocks that are migrating to Q4 from
other quintiles. In the 43 quarters covered under our study, we find out that, on
average, 11 stocks have remained unchanged from one quarter to another, five are
downgraded from Q3 of previous quarter, three are upgraded from Q5 of previous
quarter, whereas one member is a new entry from either Q1/Q2 or a new entry in
BSE100. Post analyzing returns of these subgroups, we see a marginal difference
among members of these groups, though Q4 members from previous quarter have
done marginally better.
-0.5
Source: Bloomberg
24 August 2017
6

Stock positioning: Interesting anomalies
Another interesting angle that we came across relates to the frequency distribution
of stocks across quintiles and stock positioning. In the 43 quarters covered under
our study, for how many quarters has a stock remained in each quintile and how is it
placed currently compared to its most likely position?
Among the Nifty stocks,
Axis Bank, SBI, BOB, NTPC, Dr Reddy’s, Sun Pharma,
Hindalco, IOCL
and
Vedanta
are positioned differently compared to their most likely
position.
24 August 2017
7

24 August 2017
P&G Hygiene and
Healthcare
BSE SENSEX
31,568
Bloomberg
Equity Shares (m)
M.Cap.(INRb)/(USDb)
52-Week Range (INR)
1, 6, 12 Rel. Per (%)
Avg Val, INRm/ Vol m
Free float (%)
S&P CNX
9,853
PG IN
32.5
264.7 /4.1
8,390/6,126
3/7/8
52
29.4
4QFY17 Results Update
| Sector: Consumer
CMP: INR8,155
TP: INR8,800 (+8%)
Downgrade to Neutral
GST led destocking impacts sales
Downgrading to Neutral on fair near term valuations
n
Financials & Valuations (INR b)
FY17 FY18E FY19E
Y/E June
Sales
23.2
26.6
31.1
EBITDA
6.6
7.6
8.9
Adj. PAT
4.3
4.9
5.7
Adj. EPS (INR)
132.9 151.6 176.0
EPS Gr. (%)
2.3
14.0
16.1
BV/Sh. (INR)
212.2 255.6 306.0
RoE (%)
39.3
64.9
62.8
RoCE (%)
40.2
66.0
63.7
P/E (x)
61.3
53.8
46.3
P/BV (x)
38.4
31.9
26.7
n
n
n
Estimate change
TP change
Rating change
4QFY17 Net sales (June year-end) declined 5.8% YoY (est. of +7.6%) to INR5b.
EBITDA declined by 17.7% YoY (est +2.7%) to INR 1.31b. Adj PAT declined by
28.6% YoY (est. +6%) INR 780m. GST led destocking and higher than expected
depreciation and tax rates affected profitability.
EBITDA margins declined by 380bp YoY to 26.1%
in 4QFY17 off a high base as
against our expectations of 130bp YoY decline. The operating margin decline
was led by gross margins which declined by 390bp YoY to 61.6%. Other
expenses increased by 330bp YoY as percentage to sales, while there was
240bp/100bp reduction on staff costs and on A&P.
Full year FY17 results-
Being a June year end company P&GHH witnessed the
impact of both demonetization and GST related destocking in a single financial
year, unlike peers. The company therefore did a fair job to grow full year
sales/EBITDA and PAT at 2%/10% and 2% respectively. Nevertheless weak FY17
base augurs well for recovery going forward.
Valuation and view:
Two factors make PGHH a highly attractive long term core
holding (1) Huge category growth potential in the feminine hygiene segment
(~70% of sales) and potential for market share growth because of its
considerable moats, a combination of which we believe is unsurpassed by
other consumer peers and (2) Potentially huge margin gains from
premiumization over the longer term in feminine hygiene. With the payout of
the huge cash pile, ROCEs have more than doubled and an investor concern has
been addressed. Nevertheless near term valuations will look expensive
because of the lower other income in FY18/FY19 compared to earlier years.
While PGHH remains one of our top long term picks, valuations of 46.3xFY19
EPS do not leave much room for upside over a 1 year horizon leading to
downgrade to
Neutral.
24 August 2017
8

RESULTS
FLASH
Castrol India
TP: Under Review
Buy
23 August 2017
Results Flash | Sector: Others
BSE SENSEX
31,568
S&P CNX
9,853
CMP: INR389
n
We will revisit our estimates
post earnings call/management
interaction.
EBITDA below estimate; lower volumes due to pre-GST destocking
CSTRL’s 2QCY17 revenue declined 10% YoY (+12% QoQ) to INR8.7b (below est.
of INR9.4b), driven largely by lower volumes due to impact of GST transition
and lingering effect of demonetization.
Reported EBITDA of INR2.1b (-33% YoY, -3% QoQ) was significantly below our
estimate of INR2.9b, led by an increase in base oil prices due to major
supply/demand imbalance in the Asia region.
EBITDA margin shrunk to 24.1% in 2QCY17 (v/s 29.8% in 1QCY17 and 32.5% in
2QCY16).
PAT stood at INR1.4b (est. of INR1.9b; -33% YoY, -11% QoQ).
Management declared an interim dividend of INR4.5/share for CY17; record
date is 6 September 2017.
Lower total volumes:
CSTLRL’s total volumes were lower due to pre-GST
destocking and lingering effect of demonetization. Volume growth was positive
for PCMO category (~40% volume share), power brands and industrial
segment.
CSTRL renewed its distribution agreement with Essar Oils for the sale of Castrol
lubricants through Essar’s retail network.
The company launched its new product Castrol Hysol XBB in the industrial
lubricant segment.
CSTRL’s >80% payout policy, RoE/RoCE of ~100% and FCF to PAT conversion at
>80% reflect its superior balance sheet and high-quality cash flows, which
warrant higher valuation multiples, in our view.
We will revisit our estimates/target price post the earnings call on 24 August.
CSTRL trades at 26.9x/25.8x CY17/CY18E EPS of INR14.4/15. Maintain
Buy.
(INR Million)
1Q
8,521
7.1
6,005
2,516
34.3
29.5
86
4
223
2,649
925
35
1,724
48.4
20.2
CY16
2Q
9,679
5.2
6,535
3,144
15.2
32.5
149
7
202
3,190
1,121
35
2,069
12.1
21.4
3Q
7,589
-2.8
5,488
2,101
-1.2
27.7
107
1
183
2,176
778
36
1,398
-2.4
18.4
4Q
7,791
-1.2
5,627
2,164
3.4
27.8
108
3
389
2,442
884
36
1,558
10.7
20.0
1Q
8,822
3.5
6,189
2,633
4.7
29.8
123
3
185
2,692
902
34
1,790
3.8
20.3
2QE
9,357
-3.3
6,450
2,907
-7.5
31.1
143
4
212
2,972
1,040
35
1,932
-6.6
20.6
CY17
2QAct Var (%) YoY (%)
8,704
-7%
-10%
-10.1
6,609
2%
1%
2,095
-28%
-33%
-33.4
24.1
118
-17%
-21%
1
-75%
-86%
155
-27%
-23%
2,131
-28%
-33%
752
-28%
-33%
35
1,379
-29%
-33%
-33.3
15.8
QoQ (%)
12%
17%
-3%
Conference Call Details
Date:
24 August 2017
Time:
2:00 PM IST
Dial-in details:
+91-22-3938 1094
th
n
n
n
Financials & Valuations (INR b)
Y/E Dec
2016 2017E 2018E
Net Sales
33.6
36.0
38.5
EBITDA
9.9
10.7
10.9
PAT
6.7
7.1
7.4
EPS (INR)
13.6
14.4
15.0
Gr. (%)
6.3
5.9
4.1
BV/Sh (INR)
12.0
13.5
14.9
RoE (%)
115.2 113.3 106.1
RoCE (%)
115.4 113.5 106.2
P/E (x)
28.5
26.9
25.8
P/BV (x)
32.3
28.9
26.1
n
n
n
n
Valuations and view
n
n
Quarterly Performance
Y/E December
Net Sales
YoY Change (%)
Total Expenditure
EBITDA
YoY Change (%)
Margins (%)
Depreciation
Interest
Other Income
PBT
Tax
Rate (%)
PAT
YoY Change (%)
Margins (%)
E: MOSL Estimates
9%
-67%
-60%
-13%
-15%
-11%
24 August 2017
9

In conversation
1. Growth in demand for steel may be around 5%: JSW Steel;
Seshagiri Rao, Joint MD & Group CFO
n
n
n
n
Internationally steel prices went up further therefore there is a scope for Indian
steel prices to go up.
Considering overall demand situation and outlook, expect steel prices to remain
buoyant in international market and domestic steel prices to fluctuate in line
with that.
Generally growth in demand in second half of the year is much better. Hope to
see repeat of same thing so growth in demand for steel will be around 5
percent.
Wanted to be a 40 million tonne steel company by 2025. Could be by way of
inorganic or organic growth.
2. Looking at improvement in operating margin for MEP Biz: Blue
Star; Vir Advani, MD
n
n
n
n
n
Rs
Have built up MEP business over the last ten years. Have executed over 75 MEP
projects in the country.
Three new projects significant; much larger in value than earlier ones.
Expect new orders to be completed within 2 years.
Current order is about Rs 210 crore as of June 30. About 80-85% are MEP
projects.
Looking at improvement in operation margin for MEP business
3. Not searching for another partner; focusing on growing
business: Max Life; Rajesh Sud, CEO & MD
n
n
n
n
n
Not searching for another partner currently. Focusing on growing business.
Yes Bank a strong partner for company with regard to bancassurance business.
Bancassurance is an important channel for company.
First year premium grew by 19% in Q1.
Financial savings in India have improved after demonetization and other events.
More money coming through formal channels.
24 August 2017
10

From the think tank
1. Fixing the trade deficit with china won’t be easy
n
The ongoing military stand-off with China in the icy Himalayan mountain range
has once again brought the issue of trade imbalances with that country to the
fore. A bilateral trade deficit should not be a worry in normal circumstances.
What really matters is the overall trade balance rather than its individual
components. China is quite another matter. Its quest for regional military
dominance makes trade imbalances with it a strategic concern for a country
such as India. The problem is that the strategic response to this bilateral trade
deficit has to go beyond vacuous statements about trade wars or boycotts of
Chinese goods. Some soul-searching will also be necessary.
2. Creating well-paid jobs for Indians
n
NITI Aayog has recently issued a set of three documents which give us a fair idea
about where national economic policy is headed in the coming years. One of
these documents charts out an action agenda for policymakers over the next
three years. This article looks past the policy changes that are needed in
individual sectors; it focuses on the broader agenda for trade, industry and
services outlined by NITI Aayog. The emphasis of the action plan for trade,
industry and services is clearly on creating well-paid jobs. NITI Aayog, after
making a strong case for export-led re-industrialization, argues, “India needs a
focused strategy for creating an environment in which export competitive firms
can emerge, especially in labour-intensive sectors.
3. The republic of statistical scramble
n
Many a caustic word has been exchanged in the acrimonious debate over the
Indian economy’s employment data. One set of numbers claims the current
phase of economic growth as jobless. Alternative data sets have accompanied
vigorous assertions of rising employment. And then there are many in the
middle, trying to make sense of the scant (and outdated) data and wondering
how anybody reached any conclusion at all. Welcome to the republic of
statistical scramble in the age of Big Data. The Bharatiya Janata Party’s (BJP’s)
2014 election victory was predicated partly on the promise of enhanced
economic well-being; straightening out data inconsistencies should be a priority
on the path to fulfilling that promise.
24 August 2017
11

International
4. Next fed chair won’t really control the fed
n
Economists seem increasingly confident that Gary Cohn, the investment banker
and White House adviser, will succeed Janet Yellen as head of the Federal
Reserve (Fed) when her term ends in February. Whether Cohn or someone else
gets the nod, the horse race masks some of the broader dynamics at work in the
past decade that have fundamentally altered the Fed, mostly for the better, and
continue to shape it in ways once thought inconceivable. The central bank,
rightly, gets far more scrutiny from Congress, the media and the public than
ever before. That scrutiny stems mainly from the searing 2008-2009 recession
and the dramatic steps the Fed took to shore up the financial system and the
broader economy. Some public reckoning was bound to result and, properly,
seems here to stay.
24 August 2017
12

Click excel icon
for detailed
valuation guide
Rs
Valuation snapshot
P/E (x)
P/B (x)
ROE (%)
FY17 FY18E FY17 FY18E FY17 FY18E FY19E
27.3
22.6
20.9
44.6
46.2
17.9
50.0
40.9
30.7
24.5
23.0
25.3
44.8
30.5
19.2
49.7
27.6
32.7
26.2
31.3
22.1
31.2
19.5
23.8
34.6
NM
36.5
42.9
12.5
23.6
29.3
23.5
NM
17.9
35.7
10.2
NM
22.9
937.1
16.6
99.1
53.0
42.3
29.1
25.0
15.8
61.8
37.6
17.6
33.1
17.3
27.1
19.9
20.1
32.0
39.9
17.7
35.9
32.8
16.5
21.6
20.5
20.0
24.3
26.9
16.9
40.6
23.8
23.0
21.9
91.1
19.8
26.0
20.0
20.0
26.8
21.0
30.2
28.3
9.5
18.7
23.6
14.8
NM
11.2
8.5
8.7
7.2
24.4
19.1
14.8
17.6
37.3
27.9
21.6
20.5
12.4
50.6
33.3
14.1
23.7
15.9
5.0
4.9
4.7
6.6
7.6
2.8
15.6
7.8
3.1
3.4
7.7
3.2
2.8
6.3
2.2
11.5
4.7
2.2
2.7
2.4
2.1
5.3
2.2
1.3
5.0
0.7
4.7
4.5
1.1
3.7
3.4
0.9
0.6
0.7
0.5
1.0
0.3
0.8
1.3
0.4
0.9
10.1
5.0
3.1
4.2
1.9
18.5
7.0
4.2
3.9
3.1
4.4
4.3
4.3
5.8
6.8
2.5
11.6
6.5
2.7
3.1
6.6
2.9
2.5
5.5
2.0
9.5
4.1
2.1
2.2
2.3
1.7
4.6
2.0
1.2
4.3
0.7
4.2
3.2
1.0
3.2
3.0
0.9
0.7
0.7
0.5
0.9
0.3
0.8
1.2
0.4
0.8
8.2
4.1
2.7
3.5
1.7
15.2
6.3
3.8
3.4
2.7
20.3
23.1
25.3
16.2
15.8
16.9
37.1
20.8
10.6
13.9
35.7
14.2
6.4
20.3
9.8
25.6
17.1
6.9
10.8
9.5
9.9
18.3
10.2
5.6
15.4
-27.0
13.8
12.3
9.5
18.9
11.5
4.0
-6.7
4.2
1.4
10.1
-8.4
3.6
-0.2
2.7
0.9
21.7
15.1
12.0
18.0
14.4
32.5
18.9
25.5
12.4
19.4
17.3
23.2
22.2
19.2
18.0
14.8
37.0
21.6
17.3
14.1
34.6
13.9
10.8
20.1
12.3
25.7
17.4
9.3
11.4
2.6
10.0
18.8
8.9
6.3
17.3
3.5
15.0
13.6
10.8
18.3
12.5
6.1
-5.2
6.2
5.8
10.9
4.6
3.2
7.0
3.0
4.6
24.3
16.1
13.3
18.6
14.1
33.0
19.3
28.2
15.6
18.2
19.9
27.0
24.0
22.8
20.7
17.3
35.4
23.3
18.3
15.0
31.5
14.9
11.5
22.8
26.6
33.6
22.3
14.7
11.8
8.7
10.5
19.6
9.5
6.9
18.5
7.2
16.3
13.9
12.7
19.5
14.2
12.4
3.0
9.1
7.3
11.2
5.4
5.9
11.4
6.1
8.3
25.9
28.0
15.6
19.0
15.6
32.8
18.4
31.3
19.1
18.5
Company
Automobiles
Amara Raja
Ashok Ley.
Bajaj Auto
Bharat Forge
Bosch
CEAT
Eicher Mot.
Endurance Tech.
Escorts
Exide Ind
Hero Moto
M&M
Mahindra CIE
Maruti Suzuki
Tata Motors
TVS Motor
Aggregate
Banks - Private
Axis Bank
DCB Bank
Equitas Hold.
Federal Bank
HDFC Bank
ICICI Bank
IDFC Bank
IndusInd
J&K Bank
Kotak Mah. Bk
RBL Bank
South Indian
Yes Bank
Aggregate
Banks - PSU
BOB
BOI
Canara
IDBI Bk
Indian Bk
OBC
PNB
SBI
Union Bk
Aggregate
NBFCs
Bajaj Fin.
Bharat Fin.
Capital First
Cholaman.Inv.&Fn
Dewan Hsg.
GRUH Fin.
HDFC
Indiabulls Hsg
L&T Fin Holdings
LIC Hsg Fin
Reco
Buy
Buy
Buy
Buy
Neutral
Buy
Buy
Buy
Neutral
Buy
Neutral
Buy
Not Rated
Buy
Buy
Buy
CMP
(INR)
TP
% Upside
EPS (INR)
(INR) Downside FY17 FY18E FY19E
29
15
19
16
1
21
17
10
19
35
-2
18
16
43
5
28.0
4.6
132.3
26.2
473.1
93.3
612.7
23.5
20.0
8.1
169.1
54.3
5.4
248.6
19.8
11.7
28.2
37.9
5.2
7.0
137.2 163.6
36.5
50.5
547.2 705.7
94.2 126.8
852.9 1,092.8
29.3
37.9
37.1
45.8
9.2
11.0
189.3 199.1
68.5
82.4
9.9
11.8
281.7 374.5
22.4
59.8
14.4
23.7
765
986
103
118
2,761 3,281
1,168 1,353
21,841 21,994
1,671 2,029
30,652 35,854
960
1,059
613
732
199
269
3,890 3,818
1,373 1,618
240
-
7,575 8,819
380
542
584
612
Neutral
Neutral
Buy
Buy
Buy
Buy
Neutral
Buy
Neutral
Buy
Under Review
Buy
Buy
503
183
158
107
1,773
298
56
1,661
81
980
510
27
1,722
545
192
201
139
2,000
366
62
1,800
91
1,153
-
34
2,133
8
5
27
30
13
23
11
8
13
18
25
24
15.4
7.0
5.0
4.8
56.8
15.3
2.3
47.9
-31.3
26.8
11.9
2.2
73.0
21.8
8.4
1.7
5.4
68.2
14.9
2.8
61.9
3.8
32.4
18.0
2.9
92.3
38.1
10.4
6.1
6.8
82.1
17.0
3.2
76.8
8.2
41.0
23.7
3.7
114.5
Buy
Neutral
Neutral
Neutral
Buy
Neutral
Buy
Buy
Neutral
141
144
336
55
298
123
142
279
134
198
149
360
49
382
150
184
341
140
41
4
7
-10
28
22
29
22
4
6.0
-14.8
18.8
1.5
29.3
-31.6
6.2
0.3
8.1
9.5
-11.2
30.1
6.4
34.4
17.1
5.8
14.6
9.0
20.8
6.6
47.0
8.6
38.3
21.4
11.0
26.8
19.1
Buy
Neutral
Buy
Buy
Buy
Neutral
Buy
Buy
Buy
Neutral
1,779
888
718
1,147
468
503
1,763
1,217
173
660
1,800
820
925
1,400
630
450
1,900
1,350
200
708
1
-8
29
22
35
-11
8
11
15
7
33.6
21.0
24.6
46.0
29.6
8.1
46.8
69.0
5.2
38.2
47.6
31.8
33.3
56.0
37.7
9.9
52.9
86.3
7.3
41.6
62.9
68.7
44.3
67.3
47.1
12.1
59.0
108.4
10.6
48.9
24 August 2017
13

Company
Manappuram
M&M Fin.
Muthoot Fin
PFC
Repco Home
REC
Shriram City Union
STF
Aggregate
Capital Goods
ABB
Bharat Elec.
BHEL
Blue Star
CG Cons. Elec.
CG Power & Indu.
Cummins
GE T&D
Havells
K E C Intl
L&T
Pennar Eng.
Siemens
Solar Ind
Suzlon Energy
Thermax
Va Tech Wab.
Voltas
Aggregate
Cement
Ambuja Cem.
ACC
Birla Corp.
Dalmia Bharat
Grasim Inds.
India Cem
J K Cements
JK Lakshmi Ce
Ramco Cem
Orient Cem
Prism Cem
Shree Cem
Ultratech
Aggregate
Consumer
Asian Paints
Britannia
Colgate
Dabur
Emami
Godrej Cons.
GSK Cons.
HUL
ITC
Jyothy Lab
Reco
Not Rated
Buy
Buy
Neutral
Buy
Neutral
Buy
Buy
CMP
(INR)
93
411
445
120
647
157
2,223
972
TP
% Upside
EPS (INR)
(INR) Downside FY17 FY18E FY19E
-
8.6
10.8
12.5
459
12
7.1
13.9
17.8
550
24
29.5 38.2
44.2
117
-3
25.7 27.2
30.2
800
24
29.1 34.5
39.3
134
-15
31.4 35.0
40.4
2,800
26
84.3 121.7 164.1
1,330
37
55.6 80.0 102.4
P/E (x)
P/B (x)
ROE (%)
FY17 FY18E FY17 FY18E FY17 FY18E FY19E
10.8
8.6
2.4
2.1
24.0 25.9 26.9
58.0 29.6
3.7
3.4
6.5
12.0 14.2
15.1 11.6
2.7
2.3
19.4 21.5 21.2
4.7
4.4
0.8
0.7
17.9 17.0 16.8
22.2 18.8
3.6
3.0
17.4 17.5 17.0
5.0
4.5
0.9
0.8
19.9 19.1 19.1
26.4 18.3
2.9
2.6
11.7 15.0 17.6
17.5 12.2
2.0
1.7
11.7 15.0 16.9
20.2 16.9
3.4
3.0
16.8 17.6 18.1
68.7
26.4
59.4
57.0
45.8
19.5
33.2
67.4
49.8
25.2
26.6
13.5
70.5
41.7
25.9
28.3
20.3
33.7
34.0
56.5
49.9
32.5
66.9
16.5
31.7
30.0
59.7
24.4
NM
406.1
44.7
41.3
36.2
54.2
57.7
51.2
41.2
40.9
47.9
34.2
60.5
33.6
33.1
60.4
24.6
27.9
41.9
42.6
39.5
31.8
41.6
43.6
22.9
25.1
10.5
55.4
35.5
18.6
29.1
17.5
31.1
30.0
39.7
36.2
23.3
37.8
15.7
22.3
25.5
42.7
24.3
34.1
31.8
37.3
43.3
31.1
51.4
49.8
44.4
38.6
40.3
42.0
33.8
51.8
30.4
37.9
8.7
5.4
1.0
9.3
24.9
1.2
6.5
9.6
9.1
4.8
3.1
1.4
6.6
7.6
-1.5
3.9
3.3
5.2
3.8
2.9
3.9
2.2
4.6
1.8
1.1
4.0
3.5
4.2
3.1
5.8
7.8
4.5
3.5
14.4
18.9
23.2
10.8
14.0
11.6
7.2
38.6
7.6
6.2
7.6
4.2
0.9
8.7
18.4
1.2
6.0
8.4
8.1
4.1
2.9
1.2
5.7
6.5
-1.6
3.5
2.9
4.6
3.5
2.7
3.8
2.1
4.2
1.6
1.0
3.5
3.2
3.7
2.9
5.1
6.5
4.2
3.2
13.1
15.6
22.0
9.3
12.0
9.0
7.1
37.2
7.5
6.3
12.7
20.6
1.6
18.0
76.4
6.2
21.2
12.4
18.2
21.2
12.2
10.2
9.3
19.8
NM
14.3
16.8
18.0
11.2
5.1
7.9
7.3
7.2
11.5
3.4
14.4
6.0
19.0
-3.2
1.4
18.4
11.6
9.6
28.5
36.9
50.4
28.4
35.8
24.6
22.2
65.6
23.5
21.1
12.6
17.0
3.4
21.4
49.7
3.0
19.7
21.5
18.6
19.5
12.1
11.6
10.3
19.8
-8.8
12.7
17.6
15.8
11.6
7.0
10.6
9.2
11.6
10.9
4.7
14.8
7.9
16.1
8.8
17.0
19.1
10.1
10.3
26.7
34.3
50.8
26.0
32.0
24.2
21.1
73.1
24.8
16.5
15.8
16.9
3.5
29.6
49.7
3.7
22.8
22.7
20.7
20.9
12.9
12.6
13.7
20.9
-11.0
12.8
17.4
16.0
12.6
7.9
13.1
12.2
13.4
13.9
6.6
17.5
12.1
17.5
12.8
22.9
19.1
14.0
12.7
28.1
34.5
58.2
26.3
33.9
22.8
22.6
82.8
26.3
18.4
Sell
Buy
Sell
Neutral
Buy
Neutral
Buy
Neutral
Neutral
Neutral
Buy
Not Rated
Neutral
Neutral
Not Rated
Neutral
Buy
Sell
1,354
183
128
734
214
80
881
386
477
299
1,124
95
1,257
859
16
872
605
522
1,200
210
100
650
250
80
1,170
395
455
295
1,345
-
1,355
900
-
830
800
430
-11
15
-22
-11
17
0
33
2
-5
-1
20
8
5
-5
32
-18
19.7
6.9
2.1
12.9
4.7
4.1
26.5
5.7
9.6
11.9
42.3
7.1
17.8
20.6
0.6
30.8
29.8
15.5
22.4
7.4
4.6
17.5
5.0
2.0
27.7
9.3
10.9
13.1
44.8
9.1
22.7
24.2
0.9
30.0
34.6
16.8
31.6
8.3
4.9
26.1
6.4
2.5
35.0
11.3
13.8
16.4
51.7
11.2
33.0
30.0
1.0
33.2
39.8
19.1
Buy
Neutral
Buy
Buy
Neutral
Neutral
Buy
Buy
Buy
Buy
Buy
Buy
Buy
276
308
1,803 1,622
954
1,150
2,592 3,282
1,119 1,079
178
201
1,013 1,277
416
519
666
806
151
185
111
140
17,183 22,360
3,964 4,936
12
-10
21
27
-4
13
26
25
21
23
26
30
25
4.9
7.0
36.1 49.8
29.4 40.9
38.8 68.7
67.9 71.3
5.6
8.0
33.7 39.7
7.0
9.7
27.3 27.4
-1.6
4.4
0.3
3.5
384.4 460.4
96.1 91.5
8.2
65.0
58.9
89.9
102.7
11.8
54.4
16.4
34.4
7.1
5.6
547.8
138.8
Neutral
Buy
Buy
Neutral
Buy
Neutral
Sell
Buy
Neutral
Neutral
1,140
4,251
1,086
299
1,085
905
5,346
1,188
282
372
1,200
4,660
1,285
315
1,310
995
4,500
1,360
280
395
5
10
18
6
21
10
-16
15
-1
6
21.0 22.2
73.7 85.3
21.2 24.4
7.2
7.7
26.5 26.9
18.9 21.5
156.1 158.1
19.6 22.9
8.4
9.3
11.2
9.8
26.5
104.6
29.8
9.1
33.1
24.7
182.1
27.3
10.3
11.1
24 August 2017
14

Company
Marico
Nestle
Page Inds
Parag Milk
Pidilite Ind.
P&G Hygiene
Prabhat Dairy
United Brew
United Spirits
Aggregate
Healthcare
Alembic Phar
Alkem Lab
Ajanta Pharma
Aurobindo
Biocon
Cadila
Cipla
Divis Lab
Dr Reddy’s
Fortis Health
Glenmark
Granules
GSK Pharma
IPCA Labs
Jubilant Life
Lupin
Sanofi India
Shilpa Medicare
Strides Shasun
Sun Pharma
Syngene Intl
Torrent Pharma
Aggregate
Logistics
Allcargo Logistics
Blue Dart
Concor
Gateway
Distriparks
Gati
Transport Corp.
Aggregate
Media
Dish TV
D B Corp
Den Net.
Ent.Network
Hind. Media
HT Media
Jagran Prak.
Music Broadcast
PVR
Siti Net.
Sun TV
Reco
Neutral
Sell
Buy
Neutral
Neutral
Neutral
Not Rated
Neutral
Neutral
CMP
TP
% Upside
(INR) (INR) Downside
316
355
12
6,625 5,740
-13
17,214 19,600
14
239
245
3
815
810
-1
8,155
8,800
11
132
-
804
875
9
2,472 2,525
2
FY17
6.3
118.0
238.7
3.6
16.7
144.9
3.5
8.7
26.7
EPS (INR)
FY18E FY19E
6.8
8.2
115.1 133.6
294.7 398.4
9.1
12.5
18.1
20.6
155.8 181.6
3.5
6.4
10.1
15.0
34.5
51.5
P/E (x)
FY17 FY18E
50.2 46.3
56.1 57.6
72.1 58.4
66.2 26.2
48.7 45.1
56.3 52.3
37.5 38.0
92.5 79.9
92.4 71.6
46.3 41.9
23.4
23.8
20.4
17.8
32.4
32.6
35.2
16.1
28.0
14.7
15.3
17.7
69.3
25.6
19.5
17.1
30.9
39.6
28.4
17.9
33.7
21.9
22.1
16.7
40.1
33.2
33.8
13.6
16.1
29.7
81.1
18.2
NM
71.3
10.3
12.3
16.3
57.9
61.3
NM
28.7
24.7
24.5
22.6
15.6
34.0
25.8
26.5
19.0
23.8
69.9
14.0
15.6
50.9
24.8
15.3
23.1
29.9
26.2
19.3
31.1
27.2
22.6
24.2
14.6
31.7
30.0
25.5
7.2
13.0
24.9
61.2
15.6
NM
61.0
9.4
11.5
14.2
39.9
40.8
NM
25.1
P/B (x)
ROE (%)
FY17 FY18E FY17 FY18E FY19E
17.5 15.0 36.7 34.9 37.7
21.2 19.7 39.0 35.5 38.1
28.8 23.1 40.0 39.6 43.1
3.1
2.7
6.0
11.0 13.3
12.6 10.3 28.2 25.2 23.5
46.5 37.1 45.3 78.9 74.0
1.9
1.8
5.2
4.9
8.5
9.2
8.4
10.4 11.0 14.7
18.5 12.9 21.3 18.0 20.3
12.8 11.8 27.6 28.2 29.3
5.0
5.1
6.7
4.4
4.1
6.8
3.6
3.6
2.7
1.6
3.8
3.2
10.0
2.1
3.3
3.2
5.3
4.8
3.0
3.1
6.8
4.7
3.7
2.5
17.8
3.5
2.5
1.9
2.5
3.7
17.4
4.3
1.7
4.5
1.8
0.8
2.4
3.9
6.1
3.4
6.8
4.4
4.4
5.4
3.5
3.8
5.7
3.2
3.3
2.6
1.4
3.0
2.2
11.7
2.0
2.7
2.9
4.9
4.1
2.7
3.1
5.6
4.1
3.4
2.2
13.6
3.3
2.3
1.7
2.1
3.4
13.5
3.8
1.8
4.2
1.5
0.8
2.3
3.5
5.3
3.6
6.3
23.0
23.4
37.7
27.6
12.3
23.0
10.2
23.5
9.6
11.3
24.7
21.1
14.5
8.6
18.1
20.6
17.1
14.4
10.7
18.5
22.2
23.8
16.9
12.6
50.5
10.8
7.3
12.4
16.7
12.4
24.1
25.5
-12.0
6.7
19.0
7.1
17.6
11.2
10.4
-23.5
23.6
19.0
19.2
26.5
24.8
11.1
23.9
12.1
18.1
11.3
2.1
21.6
17.7
23.0
8.2
19.5
13.2
16.6
17.0
14.7
10.0
22.5
19.5
14.1
16.0
48.6
11.3
9.4
19.4
17.8
13.8
24.9
25.8
-5.3
7.2
17.3
6.9
16.5
9.3
14.0
-4.1
25.0
20.4
20.5
25.9
22.1
14.5
26.3
13.2
19.4
14.8
4.9
20.9
18.8
30.9
12.2
19.6
16.0
18.1
20.4
20.2
14.7
20.7
21.5
16.3
16.8
46.8
12.4
12.4
25.4
18.6
15.4
99.2
26.6
0.7
10.7
17.3
6.4
17.4
12.4
18.2
6.2
28.8
Neutral
Neutral
Buy
Buy
Sell
Buy
Neutral
Neutral
Neutral
Buy
Neutral
Buy
Neutral
Neutral
Buy
Buy
Buy
Buy
Buy
Buy
Not Rated
Neutral
506
1,798
1,191
699
330
463
560
639
2,030
153
601
128
2,381
411
719
955
3,993
554
915
469
439
1,208
510
1,830
1,606
850
330
555
520
680
2,500
220
775
200
2,500
430
905
1,125
4,820
805
1,300
515
-
1,350
1
2
35
22
0
20
-7
6
23
44
29
56
5
5
26
18
21
45
42
10
12
21.6 20.5
75.7 73.5
58.4 52.8
39.3 44.9
10.2
9.7
14.2 17.9
15.9 21.1
39.7 33.6
72.6 85.1
10.3
2.2
39.3 42.9
7.2
8.2
34.4 46.8
16.1 16.6
37.0 47.1
55.8 41.4
129.1 133.6
14.0 21.1
32.3 47.4
26.1 15.1
13.0 16.1
55.2 53.4
25.5
91.6
64.2
50.0
14.2
24.1
26.0
40.0
125.2
5.6
51.7
11.5
54.9
26.8
56.7
56.3
160.6
30.4
74.8
23.3
18.0
67.3
Buy
Not Rated
Neutral
Buy
Not Rated
Not Rated
164
4,116
1,262
230
114
273
212
-
1,214
272
-
-
29
-4
18
9.8
11.2
102.5 129.9
38.0 42.1
6.8
8.4
16.9
9.0
15.9
21.0
13.3
163.2
48.6
12.4
23.9
25.9
Buy
Buy
Neutral
Neutral
Buy
Neutral
Buy
Buy
Buy
Neutral
Neutral
80
371
91
815
267
91
175
372
1,259
25
715
106
450
90
928
350
90
225
469
1,628
32
860
32
21
-1
14
31
-2
28
26
29
30
20
1.0
20.4
-8.6
11.4
25.9
7.4
10.8
6.4
20.5
-1.8
24.9
1.3
23.7
-2.7
13.4
28.3
7.9
12.4
9.3
30.9
-0.3
28.5
4.3
27.6
0.3
21.7
33.6
8.1
14.1
14.0
46.9
0.4
35.9
24 August 2017
15

Company
Zee Ent.
Aggregate
Metals
Hindalco
Hind. Zinc
JSPL
JSW Steel
Nalco
NMDC
SAIL
Vedanta
Tata Steel
Aggregate
Oil & Gas
BPCL
GAIL
Gujarat Gas
Gujarat St. Pet.
HPCL
IOC
IGL
MRPL
Oil India
ONGC
PLNG
Reliance Ind.
Aggregate
Retail
Jubilant Food
Titan Co.
Aggregate
Technology
Cyient
HCL Tech.
Hexaware
Infosys
KPIT Tech
L&T Infotech
Mindtree
Mphasis
NIIT Tech
Persistent Sys
Tata Elxsi
TCS
Tech Mah
Wipro
Zensar Tech
Aggregate
Telecom
Bharti Airtel
Bharti Infratel
Idea Cellular
Tata Comm
Aggregate
Utiltites
Reco
Buy
CMP
(INR)
514
TP
% Upside
EPS (INR)
(INR) Downside FY17 FY18E FY19E
630
23
23.1 14.7
18.9
P/E (x)
P/B (x)
ROE (%)
FY17 FY18E FY17 FY18E FY17 FY18E FY19E
22.2 34.9
8.5
7.3
24.7 22.6 24.5
38.6 29.5
5.4
4.9
14.0 16.7 21.3
14.3
14.6
NM
16.2
19.0
12.4
NM
19.8
16.7
20.1
10.5
17.0
39.0
22.4
11.3
9.9
28.9
8.5
14.4
9.7
20.3
16.4
12.6
137.9
67.3
73.3
17.0
14.7
19.6
14.2
9.5
13.4
18.5
15.2
13.0
16.4
29.2
18.7
13.9
17.2
15.1
16.6
38.9
25.8
NM
23.4
38.5
10.5
12.7
NM
10.9
20.1
9.9
NM
12.1
9.7
13.8
14.9
14.5
21.4
17.7
13.4
11.6
25.5
13.3
10.0
9.7
16.5
13.7
12.6
93.1
57.3
61.1
14.7
14.2
17.1
14.4
10.7
12.3
16.0
14.7
11.7
14.2
24.4
18.7
12.7
16.1
15.1
16.5
99.5
21.4
NM
73.2
213.3
1.8
3.9
0.4
2.6
1.3
1.7
0.7
1.8
1.9
1.6
3.3
1.7
6.7
2.5
3.4
2.0
6.1
2.2
0.8
0.9
4.3
1.6
1.7
11.3
12.8
12.6
2.8
3.7
4.8
3.0
1.4
4.7
3.0
2.0
1.7
2.5
9.2
5.6
2.3
2.7
2.4
3.8
2.6
4.6
1.3
11.4
2.7
1.5
4.2
0.4
2.1
1.3
1.6
0.7
1.7
1.7
1.6
2.8
1.6
5.3
2.2
2.9
1.8
5.1
1.9
0.7
0.9
3.6
1.5
1.5
10.4
11.6
11.5
2.4
3.3
4.1
2.7
1.3
3.6
2.9
2.2
1.6
2.4
7.4
6.0
2.1
2.7
2.2
3.7
2.5
3.9
1.6
9.9
2.7
14.0
24.4
-7.9
17.3
7.2
12.8
-6.7
9.7
15.7
8.2
32.4
9.6
17.8
11.6
32.4
21.2
21.0
31.4
5.7
10.1
23.2
11.6
13.3
8.2
20.6
17.2
16.2
27.5
26.5
22.0
14.3
40.4
16.8
13.2
13.7
17.0
37.1
32.6
18.4
16.9
17.2
22.9
15.3
32.0
-4.9
21.3
6.5
15.2
-9.1
14.8
18.6
11.4
20.4
11.3
27.6
13.2
23.6
16.0
21.9
15.5
7.5
9.4
23.7
12.3
12.2
11.1
21.3
18.9
16.6
24.9
25.7
19.6
13.0
33.0
17.3
14.5
14.4
17.9
33.5
31.1
17.4
16.1
15.0
22.8
15.4
35.1
0.6
20.8
7.7
15.6
-5.3
18.4
16.2
13.3
21.4
12.4
27.4
14.2
21.7
15.8
20.9
17.0
8.0
10.9
25.5
12.3
12.7
14.0
22.2
19.6
17.3
23.8
23.1
19.3
14.2
29.4
20.1
16.2
15.4
20.7
32.2
33.5
16.9
16.1
17.9
22.0
3.8
19.4
-21.7
33.6
2.8
Buy
Neutral
Buy
Buy
Neutral
Buy
Sell
Buy
Neutral
231
287
133
240
70
123
61
300
633
309
301
194
297
63
180
30
316
591
34
5
46
24
-10
46
-51
5
-7
16.2
19.7
-20.9
14.8
3.7
10.0
-6.2
15.1
37.9
22.0
22.6
-15.8
21.9
3.5
12.4
-7.7
24.8
65.1
26.3
26.9
2.0
25.7
4.2
12.1
-4.2
33.1
64.3
Neutral
Sell
Sell
Neutral
Buy
Buy
Neutral
Sell
Buy
Buy
Buy
Neutral
510
384
795
197
458
426
1,270
125
278
160
231
1,581
515
346
691
171
510
458
1,152
113
316
195
274
1,499
1
-10
-13
-13
11
7
-9
-10
14
22
19
-5
48.3
22.6
20.4
8.8
40.7
43.0
44.0
14.8
19.3
16.4
11.4
96.7
34.3
26.5
37.2
11.1
34.1
36.7
49.9
9.4
27.9
16.5
14.0
115.5
41.3
31.3
46.1
13.3
36.3
40.4
56.3
11.7
31.1
19.7
17.9
128.1
Sell
Neutral
1,379
608
850
565
-38
-7
10.0
9.0
14.8
10.6
20.7
12.6
Buy
Neutral
Neutral
Buy
Neutral
Buy
Neutral
Neutral
Neutral
Buy
Buy
Neutral
Buy
Neutral
Buy
519
878
269
895
113
743
460
593
495
617
1,645
2,493
430
291
786
600
950
250
1,030
140
880
450
610
540
750
1,992
2,350
490
270
950
16
8
-7
15
24
19
-2
3
9
22
21
-6
14
-7
21
30.6 35.4
59.8 61.8
13.7 15.7
62.9 62.2
11.9 10.6
55.5 60.2
24.9 28.7
38.9 40.3
38.0 42.3
37.7 43.3
56.3 67.4
133.4 133.6
30.9 34.0
16.9 18.1
52.1 51.9
41.9
65.9
16.5
67.2
13.1
68.0
32.9
43.0
48.7
52.0
79.7
147.7
36.8
19.1
70.0
Buy
Buy
Buy
Buy
432
383
91
638
490
480
110
775
13
25
21
22
11.1
14.9
-1.1
27.2
4.3
17.9
-10.9
8.7
6.6
20.4
-11.3
26.1
6.7
2.5
16.2 19.8
-1.6 -17.3
132.2 14.5
6.9
1.2
24 August 2017
16

Company
Reco
Coal India
Buy
CESC
Buy
JSW Energy
Sell
NTPC
Buy
Power Grid
Buy
Tata Power
Sell
Aggregate
Others
Arvind
Neutral
Avenue Supermarts Neutral
Bata India
Under Review
Castrol India
Buy
Century Ply.
Neutral
Coromandel Intl Buy
Delta Corp
Buy
Dynamatic Tech
Buy
Eveready Inds.
Buy
Interglobe
Neutral
Indo Count
Neutral
Info Edge
Buy
Inox Leisure
Sell
Jain Irrigation
Under Review
Just Dial
Neutral
Kaveri Seed
Buy
Kitex Garm.
Buy
Manpasand
Buy
MCX
Buy
Monsanto
Buy
Navneet Education Buy
PI Inds.
Buy
Piramal Enterp.
Buy
SRF
Buy
S H Kelkar
Buy
Symphony
Sell
Trident
Buy
TTK Prestige
Neutral
V-Guard
Neutral
Wonderla
Buy
CMP
(INR)
241
940
61
170
219
79
TP
% Upside
EPS (INR)
(INR) Downside FY17 FY18E FY19E
275
14
14.9 18.3
19.1
1,360
45
51.9 88.9
99.3
49
-20
3.8
3.4
2.7
204
20
13.0 13.3
16.3
262
19
14.2 17.4
20.6
68
-14
5.2
6.4
6.7
P/E (x)
P/B (x)
ROE (%)
FY17 FY18E FY17 FY18E FY17 FY18E FY19E
16.1 13.2
6.1
5.8
37.8 44.2 44.2
18.1 10.6
1.2
1.1
6.5
10.6 10.8
16.0 18.1
1.0
1.0
6.3
5.3
4.2
13.1 12.8
1.4
1.3
11.5 10.8 12.4
15.4 12.6
2.3
2.0
16.2 17.3 17.8
15.3 12.4
1.8
1.6
11.2 13.9 12.1
14.8 12.8
2.2
2.0
14.9 15.9 16.6
29.4
128.9
50.3
28.5
29.9
25.4
59.6
31.5
22.9
26.4
8.4
60.5
69.8
17.1
20.6
28.5
12.4
65.5
40.7
28.7
20.2
22.1
36.2
17.0
34.1
52.8
13.1
48.2
51.1
47.9
28.1
77.8
43.2
26.9
26.5
17.5
31.5
18.8
21.6
19.0
12.3
43.6
29.0
12.5
19.5
16.0
10.4
41.2
36.1
23.5
16.6
24.2
25.2
18.3
32.5
35.6
10.5
46.2
40.8
28.0
2.6
16.1
6.6
32.3
8.1
4.3
4.6
4.3
7.4
21.7
2.5
5.8
4.0
1.5
2.8
3.7
3.3
4.1
3.8
8.1
5.0
6.2
3.4
2.7
4.4
19.6
1.6
8.7
12.2
4.4
2.5
14.0
5.9
28.9
6.7
3.7
3.1
3.5
6.0
19.3
2.1
5.3
3.6
1.4
2.5
3.9
2.7
3.8
3.6
7.3
4.3
5.2
3.1
2.4
4.0
17.3
1.4
7.9
10.0
3.9
10.3
9.1
12.0
17.9 19.3 23.0
13.9 14.4 15.8
115.2 113.3 106.1
31.1 27.7 29.6
17.5 22.5 23.4
8.1
12.3 12.6
15.1 20.7 24.3
37.7 30.8 30.1
86.2 107.5 137.7
34.8 18.6 18.3
10.2 12.7 13.1
5.9
12.5 16.2
8.6
11.7 14.8
14.8 13.4 13.7
13.6 23.3 27.4
29.8 28.6 27.6
7.3
8.5
13.5
10.2 10.2 14.5
31.6 32.5 34.5
26.8 27.8 28.2
32.8 23.4 22.9
9.8
13.0 16.4
16.6 13.7 16.0
13.7 12.9 15.2
43.3 51.6 54.5
13.0 14.5 16.1
19.5 18.0 20.7
27.4 26.9 28.8
9.5
14.8 17.5
364
989
679
389
260
423
182
2,128
295
1,217
109
948
233
95
359
544
231
831
1,011
2,474
157
736
2,625
1,465
247
1,249
87
6,371
183
335
375
882
-
527
323
523
237
3,334
358
1,312
129
1,130
240
-
465
738
394
926
1,300
3,295
226
894
3,044
1,648
298
1,288
114
5,281
167
393
3
-11
36
24
24
30
57
22
8
18
19
3
29
36
71
11
29
33
44
21
16
13
21
3
32
-17
-9
17
12.4
7.7
13.5
13.6
8.7
16.6
3.1
67.6
12.9
46.0
13.0
15.7
3.3
5.5
17.5
19.1
18.6
12.7
24.8
86.2
7.8
33.4
72.6
85.9
7.2
23.7
6.6
132.1
3.6
7.0
12.9
12.7
15.7
14.4
9.8
24.1
5.8
112.9
13.6
63.9
8.9
21.8
8.0
7.6
18.5
34.0
22.1
20.2
28.0
105.1
9.4
30.4
104.1
80.2
7.6
35.1
8.3
137.8
4.5
11.9
18.6
17.6
19.4
15.0
12.9
29.0
7.9
166.7
16.3
93.7
10.8
24.7
12.0
10.0
21.1
41.0
26.2
30.9
42.2
126.7
11.3
35.8
144.6
103.0
9.9
42.9
10.4
176.1
6.0
16.0
24 August 2017
17

MOSL Universe stock performance
Company
Automobiles
Amara Raja
Ashok Ley.
Bajaj Auto
Bharat Forge
Bosch
CEAT
Eicher Mot.
Endurance Tech.
Escorts
Exide Ind
Hero Moto
M&M
Mahindra CIE
Maruti Suzuki
Tata Motors
TVS Motor
Banks - Private
Axis Bank
DCB Bank
Equitas Hold.
Federal Bank
HDFC Bank
ICICI Bank
IDFC Bank
IndusInd
J&K Bank
Kotak Mah. Bk
RBL Bank
South Indian
Yes Bank
Banks - PSU
BOB
BOI
Canara
IDBI Bk
Indian Bk
OBC
PNB
SBI
Union Bk
NBFCs
Bajaj Fin.
Bharat Fin.
Capital First
Cholaman.Inv.&Fn
Dewan Hsg.
GRUH Fin.
HDFC
Indiabulls Hsg
L&T Fin.Holdings
LIC Hsg Fin
Manappuram
M&M Fin.
Muthoot Fin
PFC
Repco Home
REC
STF
Shriram City Union
1 Day (%)
1 Day (%)
0.9
2.4
0.7
2.5
-0.3
2.6
-1.1
-0.9
2.2
0.9
0.1
-0.1
-1.4
1.0
1.8
0.3
0.8
3.3
1.4
1.2
1.3
1.7
2.4
2.2
0.5
1.1
1.6
2.1
0.5
1.1
3.1
2.8
1.6
2.7
3.2
3.3
1.7
3.8
5.7
4.5
3.4
0.4
2.6
-0.8
0.7
3.4
2.3
3.7
1.5
1.5
0.2
3.1
2.6
2.8
1.4
1.0
1M (%)
-8.8
-0.4
-1.9
2.8
-9.0
-9.6
6.2
7.8
-6.5
-8.1
5.7
-0.7
-2.2
0.6
-18.2
2.4
-6.9
-6.1
-6.2
-9.2
4.1
-0.9
-7.9
5.9
-4.1
-1.8
-4.0
-5.1
9.1
-12.9
-7.2
-4.2
-7.5
-9.4
-17.6
-10.0
-4.0
-13.2
10.0
13.7
-5.5
0.8
2.1
5.7
7.4
6.9
13.4
-10.8
-11.4
16.1
-1.8
-6.2
-18.9
-13.9
0.9
-5.6
12M (%)
-14.0
17.0
-4.0
35.6
-7.4
95.9
39.3
88.0
13.8
17.7
-4.8
31.4
56.7
-24.5
90.3
-13.6
57.2
-12.8
58.7
41.6
31.2
3.9
39.7
13.7
26.1
33.9
28.3
-14.2
25.3
30.2
-24.1
30.9
3.7
12.4
9.5
-1.0
77.5
17.0
-0.1
5.4
72.0
58.5
28.1
51.2
82.6
19.7
7.3
24.5
33.0
0.6
-20.9
35.7
-23.1
-0.4
Company
Capital Goods
ABB
Bharat Elec.
BHEL
Blue Star
CG Cons. Elec.
CG Power & Inds Sol.
Cummins
GE T&D
Havells
K E C Intl
L&T
Pennar Eng.
Siemens
Solar Ind
Suzlon Energy
Thermax
Va Tech Wab.
Voltas
Cement
Ambuja Cem.
ACC
Birla Corp.
Dalmia Bharat
Grasim Inds.
India Cem
J K Cements
JK Lakshmi Ce
Ramco Cem
Orient Cem
Prism Cem
Shree Cem
Ultratech
Consumer
Asian Paints
Britannia
Colgate
Dabur
Emami
Godrej Cons.
GSK Cons.
HUL
ITC
Jyothy Lab
Marico
Nestle
Page Inds
Parag Milk
Pidilite Ind.
P&G Hygiene
Prabhat Dairy
United Brew
United Spirits
Healthcare
Alembic Phar
Alkem Lab
Ajanta Pharma
Aurobindo
Biocon
Cadila
Cipla
1 Day (%)
0.2
2.6
1.7
0.4
-1.3
1.8
-1.6
0.0
1.0
0.6
0.5
1.1
-0.6
0.1
2.2
-0.5
-0.8
-0.6
1.1
0.8
1.0
1.4
0.7
2.2
-0.1
0.8
0.2
0.3
2.8
0.1
-0.3
0.9
1.2
0.3
-0.8
-1.1
1.9
-0.2
-1.1
-0.3
-0.5
0.3
0.1
0.2
0.3
-0.2
0.4
1.2
0.2
-1.0
-1.2
2.7
3.5
0.4
0.7
-1.3
0.1
1M (%)
-7.3
6.8
-12.1
8.7
4.9
-6.4
-12.5
18.0
3.1
1.9
-4.6
-23.2
-7.6
-4.0
-14.4
-5.9
-0.7
4.7
4.1
5.4
0.8
-1.8
5.5
-14.6
3.0
-10.4
-1.4
-5.6
-9.3
-2.9
-5.1
-1.3
10.9
1.5
-1.4
-1.3
-5.7
-2.2
2.5
-2.2
-3.1
-4.1
-2.8
2.5
-6.2
1.4
1.3
-2.8
-1.1
-8.7
-6.4
1.4
-18.6
-6.6
-17.5
-12.4
-1.1
12M (%)
17.9
50.0
-6.9
51.1
29.8
-7.3
-0.4
20.8
15.9
119.3
14.3
-47.3
-2.4
39.3
-0.6
4.6
5.7
40.2
2.0
8.9
44.7
72.6
48.3
27.1
28.9
-5.9
21.1
-12.7
-3.1
2.5
3.6
1.4
26.8
16.0
2.5
-4.8
20.7
-14.9
28.8
12.3
27.7
9.0
-2.7
20.5
-24.3
15.9
21.0
55.1
1.2
7.4
-21.3
19.5
-39.7
-5.1
12.2
24.4
0.8
24 August 2017
18

MOSL Universe stock performance
Company
Divis Lab
Dr Reddy’s
Fortis Health
Glenmark
Granules
GSK Pharma
IPCA Labs
Jubilant Life
Lupin
Sanofi India
Shilpa Medicare
Strides Shasun
Sun Pharma
Syngene Intl
Torrent Pharma
Logistics
Allcargo Logistics
Blue Dart
Concor
Gateway Distriparks
Gati
Transport Corp.
Media
Dish TV
D B Corp
Den Net.
Ent.Network
Hind. Media
HT Media
Jagran Prak.
Music Broadcast
PVR
Siti Net.
Sun TV
Zee Ent.
Metals
Hindalco
Hind. Zinc
JSPL
JSW Steel
Nalco
NMDC
SAIL
Vedanta
Tata Steel
Oil & Gas
BPCL
GAIL
Gujarat Gas
Gujarat St. Pet.
HPCL
IOC
IGL
MRPL
Oil India
ONGC
PLNG
Reliance Ind.
Retail
Jubilant Food
Titan Co.
1 Day (%)
1.4
2.2
7.7
0.0
0.6
1.0
0.3
1.6
1.1
0.1
0.6
0.3
-0.4
-0.5
-1.2
1.8
0.7
-1.2
0.5
5.6
0.0
1.3
-2.4
8.0
1.8
-1.8
-0.4
-0.3
1.3
-0.9
-1.6
2.3
-0.5
1.2
-0.2
3.2
3.3
0.2
1.0
3.2
2.2
2.3
0.0
2.0
3.5
4.7
1.7
0.7
0.8
1.5
0.9
0.2
0.7
1.1
1.5
-1.2
1M (%)
-11.4
-26.5
-6.8
-13.7
-9.8
-6.2
-14.3
-3.8
-16.5
-4.3
-19.0
-15.3
-18.7
-8.9
-5.0
-7.0
-7.6
6.9
-13.5
-8.2
-14.9
2.6
-1.4
14.9
-10.6
-5.5
7.7
0.2
1.7
-7.8
-5.0
-11.3
-7.3
7.8
2.3
-2.6
11.8
-1.3
0.3
-2.7
11.7
14.6
9.1
1.9
4.3
13.5
24.7
12.0
11.1
-0.8
-1.5
-3.0
12.3
-0.3
10.1
12.0
12M (%)
-51.4
-32.5
-16.0
-29.1
1.0
-22.6
-19.6
42.7
-38.6
-7.5
-3.2
-4.5
-38.5
3.5
-23.5
-13.4
-24.1
16.7
-15.2
-25.9
28.9
-16.6
-9.1
3.2
15.0
-1.5
16.8
-5.2
7.0
-32.2
53.7
0.0
48.7
26.1
52.3
36.1
47.1
12.9
21.6
72.0
64.3
32.5
39.6
20.0
35.0
79.2
56.9
67.7
56.7
-0.1
0.5
38.0
56.6
12.2
49.9
Company
Technology
Cyient
HCL Tech.
Hexaware
Infosys
KPIT Tech
L&T Infotech
Mindtree
Mphasis
NIIT Tech
Persistent Sys
Tata Elxsi
TCS
Tech Mah
Wipro
Zensar Tech
Telecom
Bharti Airtel
Bharti Infratel
Idea Cellular
Tata Comm
Utiltites
Coal India
CESC
JSW Energy
NTPC
Power Grid
Tata Power
Others
Arvind
Avenue Super.
Bata India
Castrol India
Century Ply.
Coromandel Intl
Delta Corp
Dynamatic Tech
Eveready Inds.
Interglobe
Indo Count
Info Edge
Inox Leisure
Jain Irrigation
Just Dial
Kaveri Seed
Kitex Garm.
Manpasand
MCX
Monsanto
Navneet Educat.
PI Inds.
Piramal Enterp.
SRF
S H Kelkar
Symphony
Trident
TTK Prestige
V-Guard
Wonderla
1 Day (%)
1.1
0.3
1.7
2.0
2.8
0.0
1.0
0.6
2.2
-0.4
1.8
-0.1
-2.1
0.2
0.5
2.4
-1.1
3.0
3.8
0.4
0.7
0.3
1.4
-0.1
-1.4
0.7
3.4
-0.5
0.2
2.5
0.2
5.4
-0.6
-0.9
-1.2
8.9
0.8
1.0
1.7
-1.1
2.4
-0.2
1.2
3.1
1.3
1.1
1.5
1.8
0.2
0.5
1.0
5.9
0.0
1.2
-0.2
1M (%)
-2.2
-2.9
10.4
-8.7
-10.4
-3.2
-4.8
2.8
-8.7
-6.0
-2.1
0.1
8.8
1.6
-5.3
5.0
-6.7
-1.5
-2.8
-8.1
4.6
-8.5
3.3
1.8
-5.4
-1.7
8.2
17.1
-5.1
-9.6
-2.3
6.4
-10.6
-10.2
-2.0
-29.5
-6.0
-14.7
-13.0
-5.8
-14.8
-14.7
8.1
-10.4
-9.0
-9.0
-3.2
-10.0
-3.1
-8.7
-7.4
0.5
-0.3
0.9
-6.5
12M (%)
0.8
11.3
22.9
-13.9
-16.5
15.0
-18.6
11.8
20.0
-4.4
1.5
-4.2
-7.7
12.0
-27.0
22.1
10.6
-10.2
27.9
-28.4
44.0
-22.0
6.9
20.5
5.4
16.0
24.8
-6.8
17.9
56.3
25.1
-28.5
9.3
35.8
-31.2
13.9
-12.3
13.6
-21.9
44.5
-32.3
15.1
1.4
1.9
50.8
-6.0
31.6
-11.8
-15.7
8.5
88.3
29.4
48.3
-18.5
24 August 2017
19

NOTES
24 August 2017
20

THEMATIC/STRATEGY RESEARCH GALLERY

REPORT GALLERY
RECENT INITIATING COVERAGE REPORTS
Rs

DIFFERENTIATED PRODUCT GALLERY

Disclosures:
The following Disclosures are being made in compliance with the SEBI Research Analyst Regulations 2014 (herein after referred to as the Regulations).
Motilal Oswal Securities Ltd. (MOSL) is a SEBI Registered Research Analyst having registration no. INH000000412. MOSL, the Research Entity (RE) as defined in the Regulations, is engaged in the business of providing Stock
broking services, Investment Advisory Services, Depository participant services & distribution of various financial products. MOSL is a subsidiary company of Motilal Oswal Financial Service Ltd. (MOFSL). MOFSL is a listed
public company, the details in respect of which are available on
www.motilaloswal.com.
MOSL is registered with the Securities & Exchange Board of India (SEBI) and is a registered Trading Member with National Stock
Exchange of India Ltd. (NSE) and Bombay Stock Exchange Limited (BSE), Metropolitan Stock Exchange Of India Ltd. (MSE) for its stock broking activities & is Depository participant with Central Depository Services Limited
(CDSL) & National Securities Depository Limited (NSDL) and is member of Association of Mutual Funds of India (AMFI) for distribution of financial products. Details of associate entities of Motilal Oswal Securities Limited are
available on the website at
http://onlinereports.motilaloswal.com/Dormant/documents/Associate%20Details.pdf
Pending Regulatory Enquiries against Motilal Oswal Securities Limited by SEBI:
SEBI pursuant to a complaint from client Shri C.R. Mohanraj alleging unauthorized trading, issued a letter dated 29th April 2014 to MOSL notifying appointment of an Adjudicating Officer as per SEBI regulations to hold
inquiry and adjudge violation of SEBI Regulations; MOSL requested SEBI to provide all documents, records, investigation report relied upon by SEBI which were referred in Show Cause Notice and also sought personal
hearing. The matter is currently pending.
MOSL, it’s associates, Research Analyst or their relative may have any financial interest in the subject company. MOSL and/or its associates and/or Research Analyst may have beneficial ownership of 1% or more securities in
the subject company at the end of the month immediately preceding the date of publication of the Research Report.
MOSL and its associate company(ies), their directors and Research Analyst and their relatives may; (a) from
time to time, have a long or short position in, act as principal in, and buy or sell the securities or derivatives thereof of companies mentioned herein. (b) be engaged in any other transaction involving such securities and earn
brokerage or other compensation or act as a market maker in the financial instruments of the company(ies) discussed herein or act as an advisor or lender/borrower to such company(ies) or may have any other potential
conflict of interests with respect to any recommendation and other related information and opinions.; however the same shall have no bearing whatsoever on the specific recommendations made by the analyst(s), as the
recommendations made by the analyst(s) are completely independent of the views of the associates of MOSL even though there might exist an inherent conflict of interest in some of the stocks mentioned in the research
report.
Research Analyst may have served as director/officer, etc. in the subject company in the last 12 month period. MOSL and/or its associates may have received any compensation from the subject company in the past
12 months.
In the last 12 months period ending on the last day of the month immediately preceding the date of publication of this research report, MOSL or any of its associates may have:
a)
managed or co-managed public offering of securities from subject company of this research report,
b)
received compensation for investment banking or merchant banking or brokerage services from subject company of this research report,
c)
received compensation for products or services other than investment banking or merchant banking or brokerage services from the subject company of this research report.
d)
Subject Company may have been a client of MOSL or its associates during twelve months preceding the date of distribution of the research report.
MOSL and it’s associates have not received any compensation or other benefits from the subject company or third party in connection with the research report. To enhance transparency, MOSL has incorporated a Disclosure
of Interest Statement in this document. This should, however, not be treated as endorsement of the views expressed in the report. MOSL and / or its affiliates do and seek to do business including investment banking with
companies covered in its research reports. As a result, the recipients of this report should be aware that MOSL may have a potential conflict of interest that may affect the objectivity of this report. Compensation of Research
Analysts is not based on any specific merchant banking, investment banking or brokerage service transactions.
Terms & Conditions:
This report has been prepared by MOSL and is meant for sole use by the recipient and not for circulation. The report and information contained herein is strictly confidential and may not be altered in any way, transmitted to,
copied or distributed, in part or in whole, to any other person or to the media or reproduced in any form, without prior written consent of MOSL. The report is based on the facts, figures and information that are considered
true, correct, reliable and accurate. The intent of this report is not recommendatory in nature. The information is obtained from publicly available media or other sources believed to be reliable. Such information has not
been independently verified and no guaranty, representation of warranty, express or implied, is made as to its accuracy, completeness or correctness. All such information and opinions are subject to change without notice.
The report is prepared solely for informational purpose and does not constitute an offer document or solicitation of offer to buy or sell or subscribe for securities or other financial instruments for the clients. Though
disseminated to all the customers simultaneously, not all customers may receive this report at the same time. MOSL will not treat recipients as customers by virtue of their receiving this report.
Analyst Certification
The views expressed in this research report accurately reflect the personal views of the analyst(s) about the subject securities or issues, and no part of the compensation of the research analyst(s) was, is, or will be directly or
indirectly related to the specific recommendations and views expressed by research analyst(s) in this report.
Disclosure of Interest Statement
§
Analyst ownership of the stock
Companies where there is interest
No
A graph of daily closing prices of securities is available at
www.nseindia.com, www.bseindia.com.
Research Analyst views on Subject Company may vary based on Fundamental research and Technical Research. Proprietary
trading desk of MOSL or its associates maintains arm’s length distance with Research Team as all the activities are segregated from MOSL research activity and therefore it can have an independent view with regards to
subject company for which Research Team have expressed their views.
Regional Disclosures (outside India)
This report is not directed or intended for distribution to or use by any person or entity resident in a state, country or any jurisdiction, where such distribution, publication, availability or use would be contrary to law,
regulation or which would subject MOSL & its group companies to registration or licensing requirements within such jurisdictions.
For Hong Kong:
This report is distributed in Hong Kong by Motilal Oswal capital Markets (Hong Kong) Private Limited, a licensed corporation (CE AYY-301) licensed and regulated by the Hong Kong Securities and Futures Commission (SFC)
pursuant to the Securities and Futures Ordinance (Chapter 571 of the Laws of Hong Kong) “SFO”. As per SEBI (Research Analyst Regulations) 2014 Motilal Oswal Securities (SEBI Reg No. INH000000412) has an agreement with
Motilal Oswal capital Markets (Hong Kong) Private Limited for distribution of research report in Hong Kong. This report is intended for distribution only to “Professional Investors” as defined in Part I of Schedule 1 to SFO. Any
investment or investment activity to which this document relates is only available to professional investor and will be engaged only with professional investors.” Nothing here is an offer or solicitation of these securities,
products and services in any jurisdiction where their offer or sale is not qualified or exempt from registration. The Indian Analyst(s) who compile this report is/are not located in Hong Kong & are not conducting Research
Analysis in Hong Kong.
For U.S.
Motilal Oswal Securities Limited (MOSL) is not a registered broker - dealer under the U.S. Securities Exchange Act of 1934, as amended (the"1934 act") and under applicable state laws in the United States. In addition MOSL is
not a registered investment adviser under the U.S. Investment Advisers Act of 1940, as amended (the "Advisers Act" and together with the 1934 Act, the "Acts), and under applicable state laws in the United States.
Accordingly, in the absence of specific exemption under the Acts, any brokerage and investment services provided by MOSL, including the products and services described herein are not available to or intended for U.S.
persons. This report is intended for distribution only to "Major Institutional Investors" as defined by Rule 15a-6(b)(4) of the Exchange Act and interpretations thereof by SEC (henceforth referred to as "major institutional
investors"). This document must not be acted on or relied on by persons who are not major institutional investors. Any investment or investment activity to which this document relates is only available to major institutional
investors and will be engaged in only with major institutional investors. In reliance on the exemption from registration provided by Rule 15a-6 of the U.S. Securities Exchange Act of 1934, as amended (the "Exchange Act") and
interpretations thereof by the U.S. Securities and Exchange Commission ("SEC") in order to conduct business with Institutional Investors based in the U.S., MOSL has entered into a chaperoning agreement with a U.S.
registered broker-dealer, Motilal Oswal Securities International Private Limited. ("MOSIPL"). Any business interaction pursuant to this report will have to be executed within the provisions of this chaperoning agreement.
The Research Analysts contributing to the report may not be registered /qualified as research analyst with FINRA. Such research analyst may not be associated persons of the U.S. registered broker-dealer, MOSIPL, and
therefore, may not be subject to NASD rule 2711 and NYSE Rule 472 restrictions on communication with a subject company, public appearances and trading securities held by a research analyst account.
For Singapore
Motilal Oswal Capital Markets Singapore Pte Limited is acting as an exempt financial advisor under section 23(1)(f) of the Financial Advisers Act(FAA) read with regulation 17(1)(d) of the Financial Advisors Regulations and is a
subsidiary of Motilal Oswal Securities Limited in India. This research is distributed in Singapore by Motilal Oswal Capital Markets Singapore Pte Limited and it is only directed in Singapore to accredited investors, as defined in
the Financial Advisers Regulations and the Securities and Futures Act (Chapter 289), as amended from time to time. In respect of any matter arising from or in connection with the research you could contact the following
representatives of Motilal Oswal Capital Markets Singapore Pte Limited:
Disclaimer:
The report and information contained herein is strictly confidential and meant solely for the selected recipient and may not be altered in any way, transmitted to, copied or distributed, in part or in whole, to any other person
or to the media or reproduced in any form, without prior written consent. This report and information herein is solely for informational purpose and may not be used or considered as an offer document or solicitation of
offer to buy or sell or subscribe for securities or other financial instruments. Nothing in this report constitutes investment, legal, accounting and tax advice or a representation that any investment or strategy is suitable or
appropriate to your specific circumstances. The securities discussed and opinions expressed in this report may not be suitable for all investors, who must make their own investment decisions, based on their own investment
objectives, financial positions and needs of specific recipient. This may not be taken in substitution for the exercise of independent judgment by any recipient. Each recipient of this document should make such investigations
as it deems necessary to arrive at an independent evaluation of an investment in the securities of companies referred to in this document (including the merits and risks involved), and should consult its own advisors to
determine the merits and risks of such an investment. The investment discussed or views expressed may not be suitable for all investors. Certain transactions -including those involving futures, options, another derivative
products as well as non-investment grade securities - involve substantial risk and are not suitable for all investors. No representation or warranty, express or implied, is made as to the accuracy, completeness or fairness of
the information and opinions contained in this document. The Disclosures of Interest Statement incorporated in this document is provided solely to enhance the transparency and should not be treated as endorsement of the
views expressed in the report. This information is subject to change without any prior notice. The Company reserves the right to make modifications and alternations to this statement as may be required from time to time
without any prior approval. MOSL, its associates, their directors and the employees may from time to time, effect or have effected an own account transaction in, or deal as principal or agent in or for the securities
mentioned in this document. They may perform or seek to perform investment banking or other services for, or solicit investment banking or other business from, any company referred to in this report. Each of these entities
functions as a separate, distinct and independent of each other. The recipient should take this into account before interpreting the document. This report has been prepared on the basis of information that is already
available in publicly accessible media or developed through analysis of MOSL. The views expressed are those of the analyst, and the Company may or may not subscribe to all the views expressed therein. This document is
being supplied to you solely for your information and may not be reproduced, redistributed or passed on, directly or indirectly, to any other person or published, copied, in whole or in part, for any purpose. This report is not
directed or intended for distribution to, or use by, any person or entity who is a citizen or resident of or located in any locality, state, country or other jurisdiction, where such distribution, publication, availability or use would
be contrary to law, regulation or which would subject MOSL to any registration or licensing requirement within such jurisdiction. The securities described herein may or may not be eligible for sale in all jurisdictions or to
certain category of investors. Persons in whose possession this document may come are required to inform themselves of and to observe such restriction. Neither the Firm, not its directors, employees, agents or
representatives shall be liable for any damages whether direct or indirect, incidental, special or consequential including lost revenue or lost profits that may arise from or in connection with the use of the information.
The
person accessing this information specifically agrees to exempt MOSL or any of its affiliates or employees from, any and all responsibility/liability arising from such misuse and agrees not to hold MOSL or any of its affiliates or
employees responsible for any such misuse and further agrees to hold MOSL or any of its affiliates or employees free and harmless from all losses, costs, damages, expenses that may be suffered by the person accessing this
information due to any errors and delays.
Registered Office Address: Motilal Oswal Tower, Rahimtullah Sayani Road, Opposite Parel ST Depot, Prabhadevi, Mumbai-400025; Tel No.: 022-3980 4263; www.motilaloswal.com. Correspondence Address: Palm Spring
Centre, 2nd Floor, Palm Court Complex, New Link Road, Malad (West), Mumbai- 400 064. Tel No: 022 3080 1000. Compliance Officer: Neeraj Agarwal, Email Id:
na@motilaloswal.com,
Contact No.:022-30801085.
Registration details of group entities.: MOSL: NSE (Cash): INB231041238; NSE (F&O): INF231041238; NSE (CD): INE231041238; BSE (Cash): INB011041257; BSE(F&O): INF011041257; BSE(CD); MSE(Cash): INB261041231;
MSE(F&O): INF261041231; MSE(CD): INE261041231; CDSL: IN-DP-16-2015; NSDL: IN-DP-NSDL-152-2000; Research Analyst: INH000000412. AMFI: ARN 17397. Investment Adviser: INA000007100. Motilal Oswal Asset
Management Company Ltd. (MOAMC): PMS (Registration No.: INP000000670) offers PMS and Mutual Funds products. Motilal Oswal Wealth Management Ltd. (MOWML): PMS (Registration No.: INP000004409) offers wealth
management solutions. *Motilal Oswal Securities Ltd. is a distributor of Mutual Funds, PMS, Fixed Deposit, Bond, NCDs, Insurance and IPO products. * Motilal Oswal Commodities Broker Pvt. Ltd. offers Commodities
Products. * Motilal Oswal Real Estate Investment Advisors II Pvt. Ltd. offers Real Estate products. * Motilal Oswal Private Equity Investment Advisors Pvt. Ltd. offers Private Equity products
13 December 2016
21