6 September 2017
Market snapshot
Equities - India
Close
Chg .%
Sensex
31,810
0.3
Nifty-50
9,952
0.4
Nifty-M 100
18,557
1.0
Equities-Global
Close
Chg .%
S&P 500
2,458
-0.8
Nasdaq
6,376
-0.9
FTSE 100
7,373
-0.5
DAX
12,124
0.2
Hang Seng
11,192
0.1
Nikkei 225
19,386
-0.6
Commodities
Close
Chg .%
Brent (US$/Bbl)
53
2.0
Gold ($/OZ)
1,340
0.5
Cu (US$/MT)
6,870
-0.3
Almn (US$/MT)
2,072
-1.2
Currency
Close
Chg .%
USD/INR
64.0
0.2
USD/EUR
1.2
-0.2
USD/JPY
110.3
0.1
YIELD (%)
Close
1MChg
10 Yrs G-Sec
6.5
0.0
10 Yrs AAA Corp
7.5
0.0
Flows (USD b)
5-Sep
MTD
FIIs
-0.1
-2.1
DIIs
0.1
2.6
Volumes (INRb)
5-Sep
MTD*
Cash
307
302
F&O
3,264
6,846
Note: YTD is calendar year, *Avg
YTD.%
19.5
21.6
29.3
YTD.%
9.8
18.4
3.2
5.6
19.1
1.4
YTD.%
-4.5
16.3
24.4
21.6
YTD.%
-5.7
12.8
-5.7
YTDchg
0.0
-0.1
YTD
6.7
6.7
YTD*
290
5,280
Today’s top research idea
Hindalco: Remains focused on delivering stakeholder value
We hosted Mr Satish Pai, MD of Hindalco Industries, as part of ‘CEO Track’ at our
annual conference. Key takeaways:
Business model has become robust, with cost leadership and stability in Indian
upstream operations, leadership in global downstream operations, and
strengthened B/S.
Superior technology selection for smelters helped it achieve stable operations.
Novelis will continue expanding in auto space, where it enjoys global
leadership in supplying flat rolled products. Expect new investments in
US/China. Pricing pressure in can business has eased. Electric vehicles should
accelerate light weighting of vehicles, driving aluminum demand.
Continues focusing on deleveraging and allocation of capital in downstream
(less capital-intensive); pre-paid INR78b debt, plans to prepay another INR30b
in FY18.
Focus on deleveraging, operational excellence, customer centricity and cash
conservation to deliver stakeholder value.
Research covered
Cos/Sector
AGIC: CEO Track
Takeaways
AGIC: Management Says
India Electricals
Key Highlights
Hindalco | Larsen & Toubro | Bank of Baroda
Auto | Capital Goods | Cement |Consumer | Financials |
Healthcare| Metals | Oil & Gas | Telecom | Utilities | Others
Energy Efficiency Services Limited (EESL) order tracker
Piping hot news
IndiGo may buy stake in Jet Airways if Air India bid fails
InterGlobe Aviation Ltd-run IndiGo is convinced there is an opportunity for a
large India-based airline with a significant international footprint, and may
consider investing in Jet Airways (India) Ltd…
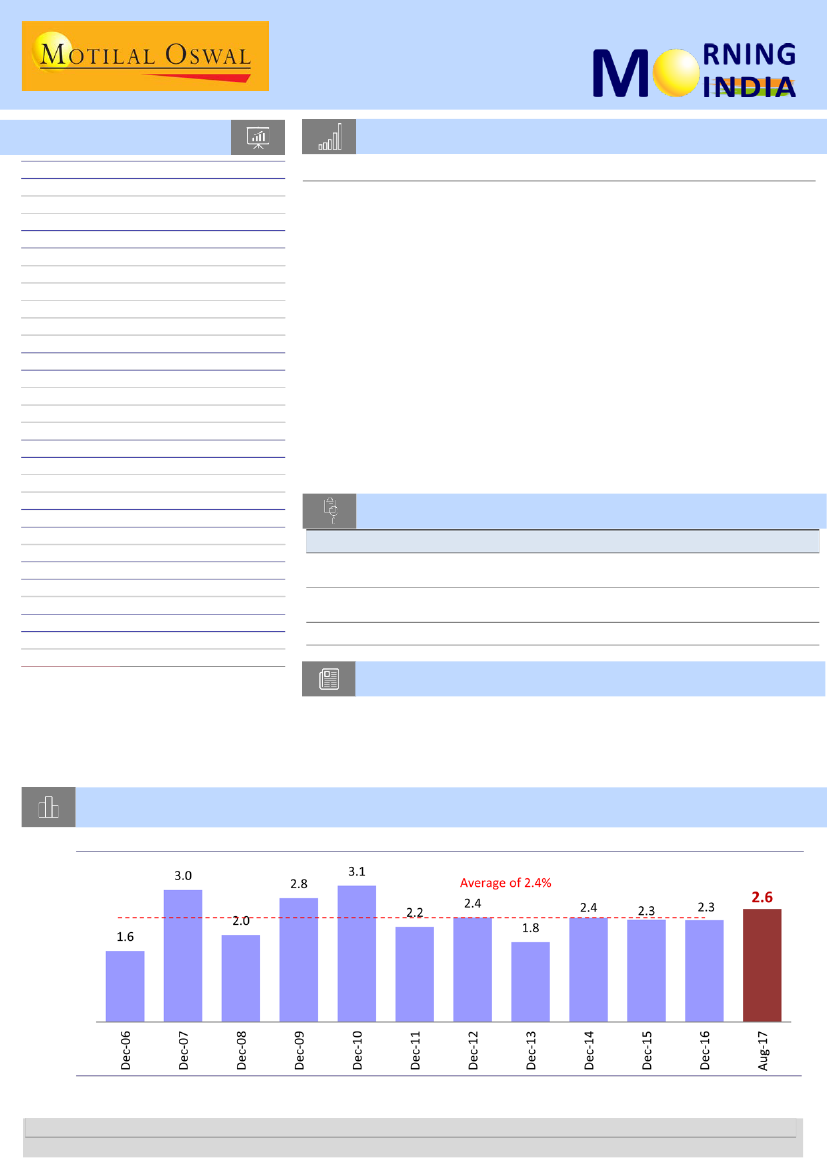
Chart of the Day: India’s share in world market cap above historical average
Trend in India's contribution to world market cap (%)
Research Team (Gautam.Duggad@MotilalOswal.com)
Motilal Oswal research is available on www.motilaloswal.com/Institutional-Equities, Bloomberg, Thomson Reuters, Factset and S&P Capital.
Investors are advised to refer through important disclosures made at the last page of the Research Report.

In the news today
Kindly click on textbox for the detailed news link
1
Bharti Airtel's $500-million IPL
bid signals strong content play
Bharti Airtel’s aggressive $500-
million bid to grab digital media
rights of the Indian Premier
League (IPL) cricket tournament
signals the market leader’s intent
to take on 4G newcomer Reliance
Jio Infocomm on the content and
digital services front…
2
Govt eyes Rs2,500 crore from selling 15% stake in NLC India
With the government successfully raising about Rs9,100 crore by selling a
stake in NTPC Ltd through an offer for sale (OFS), it is now looking at
selling a 15% stake in another power producer NLC India Ltd, two people
aware of the developments said…
3
GDR manipulation: Sebi bars
19 companies from securities
markets
The Securities and Exchange Board
of India on Tuesday barred 19
domestic and foreign firms from
securities markets for
manipulation in issuances of
global depository receipts (GDR)
and warned several others
including foreign institutional
investors (FIIs)…
4
GST impact: Nikkei India
Services PMI declines to 47.5
in August
Services sector activity remained
weak in August due to the
perceived impact of the goods and
services tax (GST), a private
monthly survey has revealed…
5
Maruti Suzuki will not hold
back in bringing in electric
cars: R.C. Bhargava
India's largest car manufacturer
Maruti Suzuki will not hold back
electric vehicles in India and will
come up with models based on
customer preference, according to
company chairman R C Bhargava.
The auto major, which has around
48% market share Indian
passenger vehicle segment, also
expects its sales to grow in double
digits over the next 3-5 years…
6
Gold prices climbed to a one-year
high on Tuesday as the U.S. dollar
eased and safe-haven buying
demand remained robust due to
continued concerns over North
Korea’s nuclear tests…
7
Indraprastha Gas (IGLBSE 4.47 %),
Indian Oil-Adani Gas combine and
Hindustan Petroleum-Oil India
joint venture are set to win
licences to distribute gas in one
city each in the latest round of
auction, according to people with
direct knowledge of the matter…
Gold jumps to one-year high as
geopolitical risks grow
IGL, IOC-Adani, HPCL-Oil India
set to win gas distribution
licences
6 September 2017
2

CEO Track
Hindalco
Mr Satish Pai
Chairman
Remains focused on delivering stakeholder value
Takeaways from CEO track
We hosted Mr Satish Pai, MD of Hindalco Industries, as part of ‘CEO Track’ at our annual
conference. Key takeaways:
Hindalco's business model has become robust, with cost leadership and stability in
Indian upstream operations, leadership in global downstream operations, and a
strengthened balance sheet. More than 60% of its EBITDA is derived from the
conversion business and is independent of LME.
Hindalco is present across the entire value chain of aluminum. There are only a few
global comparables, e.g. Hydro and Hongqiao. Most other players are either upstream
or only downstream producers.
Superior technology (Pachney) selection for its smelters has helped it achieve stable
operations, while competitors are struggling to stabilize GAMI pots (Chinese).
Novelis enjoys global leadership in supplying flat rolled products to the auto industry.
It will continue to look for expansion in auto space to cater to strong demand growth.
New investments are expected in the US and China. Pricing pressure in the can
business has eased. Electric vehicles are likely to accelerate light weighting of vehicle,
driving demand for aluminum.
Hindalco continues to focus on deleveraging and allocation of capital in downstream,
which is less capital-intensive. The company has already pre-paid INR78b debt, and
plans to prepay another INR30b in FY18.
Hindalco remains focused on accelerated deleveraging, operational excellence, higher
value addition, customer centricity and cash conservation to deliver stakeholder value.
6 September 2017
3

Larsen and Toubro
Mr. S N Subrahmanyan
MD and CEO
Government spend on infrastructure drives growth
Private sector capex still 1-2 years away from a recovery
We hosted Mr S N Subrahmanyan, MD and CEO of Larsen and Toubro (LT), as part of
‘CEO Track’ at our annual conference. Key takeaways:
Strong push by the government toward increasing infrastructure investments
continues – key areas seeing positive momentum are T&D, Water, Rail, Metros,
Defense, Smart Cities and Renewables. Private sector capex is still 1-2 years away.
Infrastructure sales can grow from INR700b currently to INR1t in the next 3-4 years.
The company continues to strongly focus on digitalization across business segments in
the construction space – using technology to track assets, material and manpower
movement – to cut costs. It expects to reduce 2-3% of operating costs via increased
use of technology and digitalization.
Despite the fall in oil prices, LT is relatively less affected since it is targeting social
infrastructure orders – key segments in focus are transmission and distribution,
metros, roads, hydrocarbons, and stadiums. Projects in these areas are on track for LT,
and payments are being received on time.
Strategy on manufacturing subsidiaries: a) Forgings – with the Fukushima tragedy,
nuclear power plant orders have slowed down. NPCIL is looking to order 7GW of new
plants, and this would help get orders for the forgings plant. b) MHPS JV – coal-fired
power plant orders have dried up and whatever little is available is taken by BHEL at
cut-throat prices. It has orders in hand, but would like to see the pace of orders to
improve. c) Shipbuilding – targets to win one of the four large projects from the Navy,
which will help it turn profitable from FY20.
Hyderabad metro: One stretch (the Nagole-Hitec City) is likely to get commissioned by
November 2017; would make losses in the first few years as depreciation and interest
costs hit P/L. Most issues with the state government have been resolved, and it
expects to get compensation for the delays and resultant cost overruns. Expect these
issues to be sorted out in the next 6-7 months.
6 September 2017
4

Bank of Baroda
Mr. P S Jayakumar
MD & CEO
Structural changes for profitable growth
Takeaways from CEO track
We hosted Mr P S Jayakumar, MD and CEO of Bank of Baroda, as part of ‘CEO Track’ at our
annual conference. Key takeaways:
Over the past two years, management has implemented significant structural changes
in credit, risk management, technology, HR division and liability branches, the benefit
of which is likely to be reaped in the ensuing years.
Post the transformation exercise, the bank remains confident of coming back to
above-industry growth rate and become more profitable. The bank is targeting 15%+
RoE in FY19.
The bank mentioned clearly that consolidation with any other PSU bank should be
value-accretive for shareholders, and would not be influenced by authorities or
market share considerations.
Mr Jayakumar mentioned that it too early to discuss about his continuity and still has
more than one year with the bank.
We like management’s focus on cleaning up the balance sheet and laying the
foundation for sustainable growth. We expect stress addition and credit costs to
moderate from FY19. Additional buffers like non-core financial investments, among
other options, will lead to dilution-free growth in the near term. Maintain Buy with a
TP of INR198 (1.1x June 2019E BV).
6 September 2017
5

‘Management Says’
Key takeaways from Motilal Oswal Annual Global Investor Conference 2017
Company
Takeaways
a. Capacity post phase-1 of Vallam plant (300k) would be 900k, assuming
old plant with capacity of ~130k stops bike production for increasing
plating capacity (biggest constraint for RE). It can do phase-2 at Vallam
(with additional capacity of 300k); can be executed in nine months.
b. RE will expand its dealer network from 750 currently to 820 by Mar-
18. It already covers all addressable markets (~480 cities). It believes it
can expand dealer network up to 1,000-1,100 without cannibalizing
existing dealers.
c. Riding gears business for RE, which was started four years back, is now
~INR1.5b. Accessories business is yet to start as currently it only offers
crash guard. In next few months, it will launch many new accessories
with a focus on quality as key differentiator vis-à-vis accessories from
3rd party. In the first six months, RE customer spends ~INR10k on
accessories.
d. Exports are huge opportunity, with targeted developing markets
having favorable biking culture and huge underlying volumes of
≤250cc motorcycle at ~47m. It is
targeting sweet spot on pricing at
USD4-5k, as volume segment has pricing of <USD2k (250cc) and high-
end motorcycles are priced at ~USD10k.
e. There is scope for further improvement in EBITDA margin with new
modern plant and leverage. Also, margin improvement so far was
driven by leverage. It is yet to focus on improvement in efficiencies.
a. FY18 guidance on volumes at high-single-digit or low-double-digit;
witnessing mid-single-digit retail growth currently.
b. Refreshed Maestro, post addressing issues, is driving recovery in
scooter volumes for HMCL. Similarly, Glamour is expected to recover
lost volumes post resolution of vendor-related issues.
c. Festive season inventory build-up is underway, with HMCL's inventory
at 8-8.5 weeks as of August-end.
d. Discounts have come off post GST, as prices have reduced by 2-3%.
HMCL is not offering any discounts post GST.
e. While monsoons have been near average level on pan-India basis,
regional disparity (like below normal in south and parts of west, and
flooding in some parts) could influence demand in the rural market.
For example, deluge in Mumbai has led to loss of momentum in
volumes, although it is expected to recover.
Impact
Automobiles
+ ve
+ ve
Eicher Motors
+ ve
+ ve
+ ve
Neutral
+ ve
+ ve
+ ve
Hero MotoCorp
- ve
6 September 2017
6

Mahindra & Mahindra
a. Expects tractor industry to grow at 10-12% in FY18. Even after strong
growth of last year, tractor industry volumes are yet to cross previous
peak. Over the long term, while tractor volumes would grow ~8%
CAGR, revenue growth for FES business could be much higher, driven
by ramp-up in the agri-implement business. It is yet to witness any
negative impact of farm loan waiver on tractor financing.
b. Expects UV industry to grow by 10-12% in FY18, with MM growing at
least in-line. Buoyancy of rural market is witnessed in automotive
products for MM. Bolero and XUV are seeing pick-up.
c. In UVs, it has several product actions in next 12-15 months, with
launch of U321 in 4QFY18 (MUV competing with Toyota Innova) and
S201 in festive season of CY18 (Compact SUV on Tivoli platform). It
also would launch refreshed KUV, TUV and XUV.
d. Volumes for Bolero have seen significant improvement over last year;
TUV is also witnessing some recovery post higher powered engine. It
is hopeful of a recovery in KUV volumes post refresh in near future.
e. Expect 2W losses to come down to INR2.5b in FY18 and INR1b in FY19
as it has been restructuring operations with a focus on niche
segments.
f. Scorpio Hybrid price increase of 3-4%; cost increase of 15%. Scorpio
Hybrid might benefit if expected increase in cess on luxury car is not
applicable to hybrid.
Takeaway
BHEL
Larsen and Toubro
Thermax
a. Executable orders have increased from INR62.5b to INR76b, as Yadadri
order has started to show traction.
b. New orders worth INR250b (5GW) expected to be finalized in the near
term.
c. For FGD, NTPC has floated tenders for 11 projects (17GW) worth
INR180b; second package of seven projects (7GW) worth INR70b is
expected to be floated soon.
d. BHEL has tied up with MHPS for FGD and with Kawasaki for Railways.
a. Private capex continues along with spending on B&F. Public sector
capex driven by a) government capex via the Union Budget, b) PSUs
and c) multilateral agencies.
b. Strong traction seen in orders for Roads, Transmission and
Distribution, Metros/Rail/DFCC, Hydrocarbons and Water.
c. T&D segment continues to see strong traction with orders worth
USD2b annually – 50% from India. While domestic substation market
is witnessing severe competition, transmission line is restricted to a
few players.
d. Water has grown to become one of the largest segments in terms of
orders inflow and sales of >INR1b.
e. 1QFY18 saw strong growth in domestic infrastructure execution as a
few large transportation infra orders got into execution. Would expect
this trend to continue in FY18.
+ ve
+ ve
+ ve
+ ve
+ ve
- ve
Company
Capital Goods
Impact
+ ve
+ ve
- ve
+ve
BHEL
+ve
+ve
- ve
+ ve
L&T
+ ve
+ ve
- ve
6 September 2017
7

Thermax
a. Private capex is expected to remain muted for a few more quarters,
given 1) banks’ reluctance to lend money and 2) underutilized capacity
across core sectors of the economy.
b. Steel, Power, Cement and Refining are key segments driving orders.
Power and Steel may remain in a downturn for some time. Cement is
seeing some enquiries for WHRG, and some small orders are being
seen from sponge iron players. Refining and fertilizers are also
witnessing an improvement in order finalization.
c. Expect orders for FGD to be finalized soon, with 5-6 credible players in
the fray for winning the orders – each player can get orders worth
INR10-15b.
d. With increased thrust on exports, can grow the a) boiler business at
10-15% CAGR, chillers from INR3b currently to INR5-6b over the next
three years, and EPC at a 10% CAGR.
Takeaway
a.
- ve
- ve
+ ve
- ve
Impact
Company
Cement
Volume growth is likely to be higher than industry, led by ramp-up of
plants in the east. New plants in eastern region can see further
utilization improvement.
ACC's profitability is likely to see improvement, led by better
utilization of both old and new units.
ACC is likely to increase only maintenance capex over the next couple
of years, with no additional capacity.
Demand in central market continues to be affected by sand mining
issue.
VSF prices continue to remain strong despite minor volatility. Cotton
prices remained stable in 1QFY18, recording 22% increase YoY.
Apparel markets growth in India is 9% v/s global average of 4%, which
augurs well for VSF business.
Domestic caustic prices remain firm, in line with global prices. Excess
supply of chlorine remains an overhang for the industry.
Liva was started as a branding initiative. The specialty fiber in VSF
gives Grasim a pricing advantage.
Total caustic demand in India is 4.5mt, and Grasim caters to 1.5mt.
Vilayat Caustic Plant Brownfield Expansion of 144ktpa will be done at
a capex of INR4.4b.
Volume in FY18 is expected to increase 10% YoY, led by growth in
eastern operations.
Cost curve is expected to remain at present levels for major part of
FY18.
The company intends to increase the capacity in the east by 3mt at a
capex of INR11b.
Gross debt for the company is at INR14.5b, of which INR8b is long-
term debt.
ACC
b.
c.
d.
a.
b.
c.
Grasim
d.
e.
f.
a.
b.
Ramco Cement
c.
d.
6 September 2017
8

a.
b.
c.
Sanghi Industries
d.
e.
f.
a.
Shree Cement
b.
c.
d.
Management expects volume growth to pick up in 2HFY18, led by
pick-up in infra spend due to upcoming elections in Gujarat.
SIL will continue to see strong volume growth, led by higher sales to
Mumbai market by way of coastal operations post the acquisition of
two ships from China.
SIL expects profitability of its core units to improve meaningfully, led
by improved utilization of present operations on account of increased
sales to Mumbai market.
Commencement of WHRS of 13MW by FY18-end would further
reduce power and fuel cost.
Significant savings are likely to be achieved as SIL plans to change its
product mix to 45% PPC as against current levels of 35%.
SIL is planning to increase its capacity from current levels of 4.1mt to
8.2mt by FY20 at a capex of INR12.5b, of which INR8b will be through
debt and INR4.5b through internal accruals.
The company plans to increase capacity from 29mt currently to 40mt
by adding capacity in East, North and South.
SRCM will venture into south markets by adding 3mt of integrated
capacity and then subsequently adding a grinding unit.
Shree Cement expects to grow at 1.5-2x times industry growth.
Capex of INR15-20b for the next one year to fund future expansion.
Impact
Company
Takeaways
a.
Consumer
Government has not scratched the surface on compliance on GST.
This process will hopefully happen over the next year, offering
benefits for organized players. Most large raw materials are imported
or are from large suppliers, and thus, can be traced back.
b.
Sales have slowed down in the past two years because of the
following factors, but will also improve because these issues have
been addressed.
1.
Commodity cost deflation was a big factor in sales slowdown and is
now a thing of the past.
2.
Rural growth which was 2x that of urban growth slowed down to
well below urban levels – an issue that is now likely to be addressed
because of two years of good monsoon and government schemes.
3.
The company was gradually reducing exposure to wholesale channel
ahead of GST implementation, which affected sales for a couple of
quarters.
4.
HUL admits that it was under-indexed in the herbal space – an issue
that it has now addressed with herbal variants in each key category,
Indulekha acquisition, launch and success of Lever Ayush range, as
well as introduction of global herbal brands like St Ives and Citra.
c.
20% of portfolio includes products of the future, including segments
like hand wash, body wash, hair conditioner, fabric conditioner and
green tea – all of which have less than 10% penetration, providing
huge opportunity for growth.
d.
Project Live Wire enables strong data analytics and decision-making,
with complete freedom given to business heads to prioritize areas of
growth based on data analytics.
Hindustan Unilever
6 September 2017
9

ITC
Marico
a.
Cigarettes
It appears that, at some level, the government may
acknowledge that there is an over-reaction and may hold taxes for
at least the next year.
Portfolio level 12% hike this year – Feb and July together.
Volumes will be under pressure for next two quarters
.
b.
Other FMCG
In Atta and noodles, its margins are equal or better than industry
peers; however, it is not so in biscuits. The company is close to
market leadership in cream biscuits, but is number 3 in cookies,
which is a higher-margin product. With increased focus on
cookies, ITC may bridge the margin gap with the market leader.
Overall, ‘other FMCG’ margins are targeted to improve by 60-70bp
every year.
c.
Hotels
Pricing has increased by 5-7% in each of the last two quarters, as
demand is outstripping supply. However, it is still early to call out
a big recovery as pricing is around 20% lower than previous peak,
whereas cost has increased substantially.
a.
Management has significant plans for direct reach expansion.
b.
Management is also making significant efforts to increase van routes,
and investing in more vans to pick up some of the slack from
wholesale disruption.
c.
The company expects B2B and B2C parts of modern retail to pick up
some of the slack from the problems that are likely to arise for
traditional wholesale.
Takeaways
Impact
Company
a. Post GST implementation, working capital demand is picking up from
SMEs.
b. CPs are the new benchmark for corporate loan pricing. AA and above
Axis Bank
rated corporates are borrowing at ~6.9%.
c. Have INR18b exposure to the next set of NCLT-related accounts,
against which it has provisions of ~INR8.5b.
a. Business has come back to normal in most geographies, except some
districts in Maharashtra.
Bharat Financial Inclusion
b. Management is confident of achieving 50% AUM growth in FY18,
driven by a pick-up in the number of loans disbursed.
c. The company will be a tax-paying entity (on P&L) from FY19.
a.
The company has not securitized any assets in the second quarter due to
Chola
Financials
confusion regarding taxation issues under GST.
b.
Growth in VF segment has been good, and the company maintained its
guidance for the year. Despite competitive pressures in this segment, margins
will remain stable due to lower cost of funds.
City Union Bank
a. Bank has guided for 15% to 18% for loan growth for full-year FY18.
Second quarter will be impacted by GST.
b. Slippage ratio guidance of 1.75% to 2%
c. Target cost-to-income ratio of 40-42%; target CD ratio of 80-82% by
FY19.
6 September 2017
10

a. With equity capital coming in post the life insurance stake sale, the
company is well capitalized for the next three years. The company
expects to grow its loan book by 18-20% over the medium term.
b. The company will now maintain 4-6 months of liquidity on its BS as a
Dewan Housing Finance
prudent measure. While this will cause some drag on yields,
management expects margins to remain stable over the medium term.
c. Expect the C/I ratio to decline by 150bp over the next 12-18 months.
The main areas for cost reduction are advertising and legal costs.
a.
Have done 9500 CLASS cases since inception of the scheme. In YTD FY18, it has
done 3000 cases. Since it does own due diligence before sending the
application to NHB, the rejection rate by NHB is less than 1%.
b.
Facing competitive pressures, especially from PSU banks, which are poaching
their existing customers. Hence, prepayment rate increased in the previous
quarter.
c. Incremental spreads are 2.5% v/s on book spreads of more than 3% due to
yield pressure.
GRUH
HDFC Bank
L&T Finance
Piramal Enterprises
Punjab National Bank
PNBHF
a. Farmers are in wait-and-watch mode in spite of being capable of
repayment.
b. BS-IV impacted CV manufacturing post April. CV manufacturing picking
up now.
c. Expects digitization initiatives to yield 50-60bp of CI ratio reduction
every year.
a. The company may achieve 18% RoE ahead of the 2020 schedule.
b. Rural and housing finance segments will be key growth and RoE drivers.
c. The tax benefit on account of goodwill amortization will last till FY21.
a. The company has received the NHB license to start an HFC. All retail
home loans will be booked under the HFC.
b. Management believes the white space in its segments is huge. Plus, the
company is focusing on entering into new segments in the financing
business. While management did not allude to a number, it believes
that it will grow faster than the market.
c. Expect margins in the OCT business to improve to 20% by FY20.
a. As the resolution timeline of 180 days gets over, FY18 GNPA levels will
be lower than FY17 levels. Approx. 18K cr will be settled through IBC
route.
b. Anticipating 12 to 15% growth in small loans (ticket size < INR5cr).
c. 55% of the book is MCLR-based, and every quarter 5-10% of the book
gets re-priced.
d. Bank already has started providing 10% to 15% for wage hike, which is
due to start in November.
e. Bank will start unlocking value in subsidiaries before FY18. Planning to
sell approx. 7% stake in PNB Housing.
a. 60-65% of its underwriters are qualified chartered accountants. The
strong team gives it an edge in underwriting self-employed home loans
and LAP.
b. The company has exposure of INR1.8b to home buyer of Jaypee
Infratech projects.
c. The company will continue to grow at 1.5-1.8x of the market. With
operating leverage kicking in, the expense ratio should decline.
6 September 2017
11

RBL Bank
Shriram City Union
Finance
a. Have piloted cross-selling of home improvement and two-wheeler
loans in financial inclusion book.
b. Wholesale book growth will slow down gradually; bank intends to grow
wholesale through non-funded exposures.
c. Branch-level targets are given for deposits, and cross-sell of third-party
products mostly.
a. The month of July has been good in terms of growth. Management
expects to achieve mid-to-high teens AUM growth in 1HFY17, and
closer to 20% AUM growth in FY18.
b. While write-offs have increased, management mentioned that it
prefers to write-off loans as there is an associated tax benefit.
c. There has been some pick-up in 2W disbursements after a sluggish
1HCY17.
Takeaways
a. Demand is recovering post GST hiccups, but management expects sales
recovery to take some time. It guided for robust 2QFY18 and 10-12%
growth in FY18.
b. On the recent Draft Pharmaceutical Policy 2017 (which has proposed to
ban ‘Loan Licensing’), the company mentioned that it may have to incur
capex, if implemented, as 50% of its manufacturing is outsourced. It also
cited that the policy will have a major impact on small companies and
not on big companies.
c. The company expects to launch ~30 products every year in the next
three years (8-10 launches every year), which have a market size of
USD15b. 40% of the basket is shared FTF and para IV.
d. Filing for onco orals and derma will start from 1QFY19. Of the 50
pending approvals, 15-18 are para IV. US business is expected to grow at
a three-year CAGR of 20-25%.
e. Management guided for INR700cr capex in FY18 and INR500cr in FY19.
a. For FY18, the company has guided for a higher tax rate (v/s the previous
year’s 20%), as the tax benefit from Baddi will end. FY19 tax will again
come down to 12-15%, led by tax benefits from its new facility in
Sikkim.
b. Comments on the New Pharmaceutical Policy 2017: (1) Cost will
increase due to higher compliance. (2) Small players will be most
impacted. (3) Most of Alkem's facilities are WHO-compliant.
c. The company lost sales of the entire month of June due to GST;
recovery of lost sales to take 4-5 months. Inventory level after coming
down to 15-18 days has increased to 28-32 days. New normal for
inventory level will be lower than before (42-45 days).
d. With the ongoing regulatory issues, the US has become a tougher
market. The company expects to file 12-15 ANDA every year with 10-12
approvals.
Impact
Company
Healthcare
Alembic
Alkem
6 September 2017
12

Aurobindo
Jubilant Life Science
a. The company does not have a high dependency on loan licensing.
b. Management has guided for high-single-digit to low-double-digit
growth in the US business. Tax guidance of 27% for FY18.
c. In biosimilars, phase-I will start in FY18 (USD 5m cost), Phase-II in FY19
(cost USD 35m), and filings will start from FY20.
d. The company launched 15 products in 1Q and expects to launch 40-45
products in FY18.
e. ARV will be launched in 3QFY18, but meaningful contribution will start
from FY19.
a. With acquisition of Triads, the company has forward integrated for
radiopharmaceuticals, and is now present across the value chain.
b. Company is well poised to grow at 16-18% CAGR over FY17-20 in the
limited-competition radiopharmaceuticals space in the US.
c. Low impact of pricing pressure in US generics due to higher share of
specialty pharmaceuticals.
d. Outlook in Life Science Ingredients business to improve further, with
reduced competition from Chinese companies.
a. EBITDA margin to gradually improve once formulation revenue kicks in.
b. Reasonably confident to get good market share in Metformin, post
ANDA approval, due to cost efficiency and inherent growth in molecule.
c. Company has done 4 ANDA filings till now; guided for 30 filings by FY20.
a. Formulation business continues to grow, with increasing market share
from approved products.
b. Company has 25 ANDA filings till date; guided for 7-8 ANDA filings in
FY18.
c. Company guided for 15-18% three-year CAGR in CRAMS business due to
better capacity utilization and increased business from its customer.
Takeaway
a. India long product prices have increased by INR2,000/t and flat
product prices by INR3,000/t in 2Q. Further price hikes are likely.
b. Oman margins will benefit as the new bar mill ramps-up, improving
product mix. Margins are also supportive on rising steel prices, while
costs are largely fixed due to favorable gas price contracts.
c. The new blast furnace at Angul was commissioned in early August, and
has reached ~60% of the rated capacity. The Blast Oxygen Furnace is
likely to be commissioned by December.
d. The company is open to monetize its coal mines and drive leveraging.
e. The recent increase in merchant power prices should drive profitability
of its power assets.
+ ve
+ ve
+ ve
+ ve
+ ve
+ ve
+ ve
+ ve
+ ve
+ ve
Impact
Laurus Lab
Shilpa Medicare
Company
Metals
Jindal Steel and Power
+ ve
6 September 2017
13

Vedanta
a.
Aluminum:
Exit run-rate of 2mt. The 4
th
line of 0.3mt is under
evaluation. Alumina sourcing is 50:50 captive and imported. Lanjigarh
will be expanded to 1.5mt by FY18 and 2mt by FY19. Coal availability
has been an issue in the last six months. Looking at converting the
remaining 600MW plant to CPP.
b.
Power:
TSPL should generate EBITDA of INR13-14b annually. Total coal
requirement across its power plants is ~25mt, of which ~10mt is
through linkages.
c.
Iron ore:
Targeting ~8mt from Goa (5.5mt) and Karnataka. Margins are
USD10/t after the compression in spreads for lower-grade iron ore.
d.
Zinc India:
Shaft at SK and RAM mines will commence by 2Q/3QFY19.
Target is to reach mine production of 1.2mt and silver production of
700kt by FY20E. CoP would be ~USD800/t @ 1.2mt production level.
e.
Zinc International:
Gamsberg production of 250kt at full production
level of phase-1 and CoP of USD1,150/t. Skorpion and BMM together
should produce ~160kt.
Takeaways
a. Doesn't expect problem in CY18 for offtake of US volumes; trying to
place volumes for CY19.
b. Older petchem plant is running at 110% utilization, while new plant is
running at 80-90%.
c. Tariff revision for six pipelines came some time back, while that for
eight others is now awaited; doesn't expect much increase in tariff.
Unified tariff is under discussion.
a. Vizag expansion to add USD3/bbl incremental GRM.
b. Expect 3-4% increase in marketing margins.
c. Does not expect much competition from private players.
d. Would need INR300b additional debt to fund projects in next 4-5 years.
a. Taxi segment to drive growth; witnessing conversion of 4,500 private
cars per month.
b. Since gas is not under GST purview, UP state govt. has allowed tax
credit separately for industrial consumers.
c. Gurugram has a peak potential of 1.5mmscmd.
d. Expects to maintain current EBITDA/scm
a. No increase in marketing margin due to daily pricing. Reduction in
logistics cost has resulted in net marketing margins.
b. Total investment of INR1.8t in six years.
c. More of heavy crude processing has resulted in higher refining
margins.
a. Expects 5-7% growth in overall volumes.
b. Raigad could give a peak of 0.6mmscmd in 3-5 years.
c. FY18 EBITDA/scm would be higher than that in FY17.
d. Doesn't expect any regulatory intervention as sourcing is free market.
+ ve
Company
Oil and Gas
GAIL
HPCL
IGL
IOCL
MGL
6 September 2017
14

Company
Technology
Takeaways
a. In IMS, the rebid market is strong, and new offerings like DryICE are
helping win deals. Automation is a clear differentiator for HCLT.
b. Although there are no large deals in the pipeline in ER&D, the recent
acquisitions are helping expand markets and presence.
c. Applications business has been seeing strength on the back of digital,
automation and customization of standardized platforms.
a. The company sees no threat at the moment from increased aggression
by competitors in the recruitment space. INFOE has its war-chest ready,
but will wait-and-watch on competition for a while.
b. RERA-related uncertainty is expected to lead to softness in 99acres in
the short term. However, it is a positive move in the long term.
c. The cost structure of INFOE is largely stable, with spend in functions like
marketing, facilities and technology in control. Recent margin accretion
has been because of this optimization.
a. MCX will be launching Options on 1kg gold to start with; nine contracts
are currently eligible for launch, as per the SEBI guidelines.
b. Now that AIFs have been allowed to trade in commodities, the next step
would be to allow mutual funds, on which the SEBI is already working.
c. A unified license should result in increased competitive intensity and
pressure on pricing.
a.
Positive on overall performance as equity markets will continue doing
well, led by [1] GDP growth expectations, [2] Higher public
shareholding, and [3] Increasing turnover velocity.
b.
There are additional revenue opportunities in the form of data and
indexing, global alliances, increased product launches and penetration
in other asset classes.
c.
Profitability maintenance is expected going forward as the cost
structure is largely stable and the outlook on volume growth is positive.
a. Margins should stay expanding from 14.3% levels of 1Q, and targeted
exit EBITDA margin is 16%.
+ ve
+ ve
+ ve
- ve
- ve
+ ve
+ ve
+ ve
- ve
+ ve
+ ve
+ ve
+ ve
+ ve
+ ve
- ve
HCLT
INFOE
MCX
NSE
Persistent
TCS
b. The IBM partnership is also on track to break even by the end of the
year with revenues growing and costs getting rationalized.
c. Growth in digital should revive in 2Q after some slippages impacted 1Q
growth.
a. Situation at Retail and BFSI vertical has not changed much in the last
couple of months. That said, the challenges persist in few accounts and
not spread across large clients secularly. More clients are growing than
shrinking (in number and value) in both the verticals.
b. While appreciate margin band of 26-28% EBIT remains, current year's
growth may not be supportive of that band. Absorption of wage hikes
will be difficult.
c. The reorganization of services is to drive adequate focus and bandwidth
in the big bets. Leadership across these segments are people that have
scaled their units to a billion dollar plus.
- ve
+ ve
6 September 2017
15

TECHM
a. Expect 2-5% growth in Telecom this year, and 8-10% in Enterprise.
Margins are expected to improve on a sequential basis through the
year.
b. Margin expansion will be led by improved profitability in acquisitions
and higher operational efficiency.
c. Integration of recently acquired entities has been smooth, reflected in
joint deal wins over the past few months.
a. The P&S business has EBITDA margins of ~4%, which is on the higher
side compared to global peers. A change in business mix and scale-led
operational efficiencies can further increase margins.
b. In the recently acquired Security business, the company intends to foray
into e-security, and expand beyond Bangalore, which currently forms
80% of its revenue.
c. The Industrials business has been seeing a turnaround because of
expansion of capabilities and entry into newer segments.
a. Maintaining the outlook of catching up with industry average sequential
growth by 4QFY18. WPRO’s relatively better revenue trajectory v/s
previous quarters is on the back of bottoming-out of some troubled
areas in segments such as Energy compounded by success of selling
new technologies in verticals such as BFSI (+).
b. Margin decline has been majorly a function of acquisitions integrated
(~300bp impact). Excluding that and currency, the company has
managed to keep margins within a band thanks to revenue productivity
uptick from Automation, despite pricing and volume concerns in
traditional segments, and wage hikes every year. Portfolio differences
to peers such as India / ME exposure drives lower relatively (-).
c. Will continue to remain acquisitive, as it attributes better capabilities in
Digital to a mix of organic and inorganic investments.
Takeaways
Traditional segment:
Revenue is expected to continue growing at 6-7%.
Traditional segment’s EBITDA margin, which had contracted from 31% to
27% due to the sale of the data center business, should come back to
31%.
b.
Growth segment:
Should maintain accelerated pace of growth at 25%.
UCC and media segment is expected to breakeven in four quarters, but
due to the new services, the overall growth segment portfolio should
breakeven in 6-7 quarters.
c.
Transformation segment:
The transformation segment is likely to grow
at a steady pace with 18-19% EBITDA margin, while ATM business will
take time to stabilize. Management continues to explore strategic sale
possibility of the ATM business.
d.
Leverage:
Debt stands at USD1.2b, about 3x net debt to EBITDA with 3%
interest cost. 30% of overall debt is rupee denominated, and the rest is
in foreign currency. Of the foreign denominated debt, 40-45% is dollar
debt. Management will not be aggressive in prepayment of debt as it
incurs settlement charges. It will deleverage naturally as debt reaches
retirement period.
e.
Capex:
Annual capex would be USD225-250m. Of this, 50-55% is data
sustenance capex and 25-30% growth capex.
a.
+ ve
+ ve
+ ve
+ ve
+ ve
+ ve
QUESS
+ ve
WIPRO
- ve
Company
Telecom
Tata Communication
6 September 2017
16

Company
Utilities
Takeaways
a.
Strong growth in demand
during August was driven by a decline in
power generation from hydro and nuclear plants. Coal inventories are
at an extremely low level of 12mt at power plants, which is likely to
trigger restocking cycle in the second half of FY18.
b.
Additional revenue:
COAL is expected to generate additional revenue of
INR5.27b from revision of rates for services provided in loading and
transporting coal from its mines. Further, it is likely to charge for
transporting coal for distance of less than 3km for the first time.
c.
Coal prices are inching up
in spot E-auction on improvement in
demand.
d.
Non-power linkages – premium rising in auction:
Old FSAs totaling 60-
65mt will all expire by the end of FY18. Consumers are replacing them
with linkages in auction. In tranche 1 and 2, nearly 37mt of linkages
(26.25mt to CPP, 6.3mt to DRI, 1.5mt to cement, 0.25mt coking coal to
steel) have been auctioned at an average premium of 9% w.r.t. floor
price. Premium in the second tranche auction was higher at 11% w.r.t.
the floor price. COAL has announced a third tranche of 28.5mt, and
expects to receive a higher premium. Cement sector has now started
substituting pet coke imports with domestic coal.
e.
Wage hike:
Management has provided INR30b toward wage hike, and
expects to conclude negotiations with labor within this budget.
f.
Focus on cost reduction:
There is a strong focus on reducing cost of
production. Nearly 56% of manpower is employed in producing coal
from underground mines accounting for just 6% of total volumes. The
losses from 177 underground mines were more than the profit in FY17.
Therefore, there are huge opportunities in reducing cost of production.
Unviable mines are being closed in steps. 19 mines were closed in FY17.
Approximately 37 mines will be closed in FY18E, while 12 have been
closed till August. Another 38 mines are likely to be closed in FY19
Takeaway
a. Recent volume decline was primarily driven by decline in CVO volumes.
CVO market volumes have declined more than 10% YoY, CSTRL has
retained its market share despite decline in volumes. Volume decline
was major in the month of June due to pre-GST destocking.
b. Management expects gradual recovery in volumes and guides ~5%
volume CAGR over the next few years.
c. Margin contraction in 2QCY17 can be attribute about 50% of that to GST
implementation and rest because of increase base oil prices. Base oil
prices increased 25-30% during the quarter as a result of an imbalance
in the demand and supply due to some refiner shutdown,
d. Large part of base oil price increase was one-time, but it hasn’t gone
back to pre-disruption levels.
e. Company has passed on the price increases over a period of time in B2B
segment. It has taken a 2-3% price hike in the month of May.
f. Management has passed on the full benefit of GST to the customers and
also supported distributors and channel partners to transition smoothly
to GST regime.
Impact
Coal India
Company
Midcap
Castrol
6 September 2017
17

Delta Corp
Escorts Ltd.
GHCL
Manpasand Beverages
a. The new airport in Sikkim is expected to commence from November
2017, which would significantly boost the number of visitations there.
b. The company plans to ramp-up its rummy business. The offices have
already been set up in Bangalore, and the focus as of now is on
strengthening back-end and setting up a call center, post which the
focus would increase on marketing and advertisement.
c. The company has launched rummy on android and expects to release it
on iPhone by December 2017. To offer a complete basket, the company
also plans to venture into its own fantasy league. The overall online
gaming business is expected to grow more than 30% for the coming
years.
d. The company plans to build the entire ecosystem for gaming and
entertainment on asset light model post the shift of casinos on land.
The set-up is expected to boost tourism and garner more investments,
providing increased scale of business for the company
a. The company expects to introduce a light-weight, rice-specialist tractor
in southern market and also launch 41-50HP in anti-lift category.
b. The company also is venturing into a niche segment of 28HP tractor for
orchards under Farmtrac. The total market size of such tractors
presently stands at 15,000 nos. dominated by Japanese players along
with Sonalika.
c. The company expects to witness significant traction in spare parts
business, the contribution of which will rise significantly in overall
revenue from INR2500m presently.
d. The company expects to cover 1000 acres of area in rental centers.
Starting with 25 centers, the company expects to reach utilization level
of ~70% in FY18 and a margin of ~20%.
a. The company has not witnesses any major challenge post GST
implementation, with margins hovering around 20-25% on an average.
b. The company expects strong traction in soda ash business going
forward, with overall demand of soda ash in India witnessing increase
from the present demand level of 2 lac ton.
c. The home textiles business is set to benefit going forward from multiple
factors viz. currency headwinds, favorable movement in raw material
prices, and discount stores in US flourishing. However, the company
also faces uncertainty over export incentive and rise in credit period by
US retailers.
a. The company has witnessed subdued offtake in the month of July on
account of GST; however, growth is back on track August onward.
b. The distribution to Parle-G network is scheduled to commence next
week in Kolkata first, and will be followed by distribution in Gujarat,
Maharashtra and UP.
c. The company launched Siznal and Jeera Sip, the responses of which
have been extremely strong.
d. The company expects to post revenue CAGR of 45% over FY17-19, while
the margins should remain stable at 19-20%
+ ve
+ ve
+ ve
+ ve
+ ve
+ ve
+ ve
+ ve
+ ve
+ ve
+ ve
+ ve
+ ve
+ ve
+ ve
6 September 2017
18

Merino Industries
PVR
TTK Prestige
a. The company, being India’s leading manufacturer and exporter of
laminates, functions with three distribution networks – retail, OEM and
direct customer.
b. The company exports to ~70 countries and has widest size variety in
laminates (6 sizes). The business enjoys high barriers to entry, as no
other player industry-wide is present in all size categories, with 95% of
the competition being present in only 1 size category.
c. The company posted revenue of ~INR11b, primarily led by laminates
and its derivatives. Going forward, the focus would be on continuously
introducing value-added products, which enjoy higher margins.
d. The company usually introduces 10 designs every year, and on the same
lines, it expects average increase of 4% in production till FY20.
e. The industry is expected to witness consolidation, as post GST, the price
differential between unorganized and organized sector reduces. At
present, ~50% of the market is unorganized, which is shifting to
organized at a faster pace.
a. 2QFY18 witnessed relatively poor content, which is expected to result in
footfall de-growth.
b. However, the content pipeline for 3Q and 4Q remains strong, which
would lead to 15-20% growth in F&B and advertisement revenues.
c. The impact of GST (@28%) is expected to remain neutral, and with
continued tax exemption from states, margins are expected to expand
by 100bp gradually over the next three years.
a. The company has witnessed growth of 22% and 37% in sales in July and
August, respectively, on account of strong performance in south. The
strong growth is expected to continue in 3QFY18 as well.
b. The company has launched nine variants of water purifier and 30 SKUs
of cleaning solutions. The products launched in the last five years
contribute 80% to overall revenue.
c. The company expects to significantly reduce its cost by reducing the
number of warehouses from 27 presently to 13.
d. The share of exports is expected to go up to INR1500m in next five years
from ~INR500m presently. Coupled with strong growth in cleaning
solutions, the company expects to touch revenue of INR50b in the next
five years.
+ ve
+ ve
+ ve
+ ve
+ ve
- ve
+ ve
+ ve
+ ve
+ ve
+ ve
+ ve
6 September 2017
19

Capital Goods: Sector Update | 6 September 2017
India Electricals
Please refer our detailed
report dated June 2016
Energy Efficiency Services Limited (EESL) order tracker
Portfolio expansion in Lighting segment a key highlight
Product portfolio expansion in lighting segment:
EESL has placed orders worth
INR17.2b during April-July 2017, up 228% YoY. A key highlight of YTD FY17
ordering is expansion of product portfolio in the lighting segment (street lights,
industrial lamps, solar study lamps and luminaire). During the period, EESL
ordering was focused on street lights, industrial lamps, and air conditioners,
which formed 75% of the ordering as compared to 4% in the year ago period.
Industrial lamps (21% of the total ordering) is the new segment that EESL has
entered into. EESL has also ventured into solar study lamps and luminaire
segments, which formed 6% and 1%, respectively of the overall ordering.
Lighting portfolio forms 66% of the ordering:
Lighting portfolio (lamps, street
lights, industrial lamps, solar study lamps and luminaire) formed 66% of the
overall EESL ordering during April-July 2017 compared to 55% in the year ago
period. Within the lighting segment, street lights formed 43% of the ordering,
whereas new segments like industrial lamps formed 32%, study lamps formed
9% and luminaire formed 2% of the ordering. Street lighting dominated by
Gautam Solar, with a share of 28%; Phillips grabbed 23% share and Crompton
has a share of 8%. In the industrial lamps segment, HQ Lamps was market
leader, with 59% share; Crompton had 16% share and Phillips had 13% share.
Floats tender for procurement of 5m smart meters:
EESL has put out a mega
tender for procurement of 5m smart meters in July 2017; 100 companies have
participated. The meters procured will be utilized for implementation of smart
grid projects in Haryana and Uttar Pradesh.
Floats tenders for procurement of 10,000 electric cars and 4,000 chargers:
EESL
has floated a tender for procurement of 10,000 electric cars including complete
system warranty under the faster adoption and manufacturing of electric
vehicles in India (FAME) scheme of the Ministry of New & Renewable energy.
According to the tender, 3,000 AC (alternate current) chargers and 1,000 DC
(direct current) chargers compatible with Bharat AC-001 and DC-001 charger
specifications would be procured. The tender is part of the government’s plan to
promote electric vehicles in the country.
Valuation and view:
We like Crompton Greaves Consumer’s strong product
portfolio, established brand, market leadership position, wide distribution
network and robust RoCE profile (30%/31% in FY18/19). We maintain our
Buy
rating on the stock, with a target price of INR240 (35x June FY19E EPS of INR6.8).
For Havells, we maintain our
Neutral
rating, with a target price of INR455, given
its premium valuations.
6 September 2017
20

In conversation
1. Seeing pent-up demand for commercial vehicles : Shriram
Transport; Umesh Revankar, MD
In an interview to CNBC-TV18, Umesh Revankar, MD of Shriram Transport
Finance spoke about the latest happenings in the company.
Revankar sees pent-up demand in commercial vehicles. He said that depending
on economic recovery, commercial vehicle (CV) demand may be good in the
second half of FY18. On the IDFC deal front, he said the due diligence should be
over by end of September. Talking about GST, he said goods and services tax
(GST) is still a challenge. According to him, not everyone is onboard as of yet.
2. Reliance Home Finance to list in second half of September,
expects net worth at rs1,500cr : Reliance Home Finance;
Ravindra Sudhalkar, CEO
Home finance business of Reliance Capital demerged on Tuesday and the same
will be listed with the name of Reliance Home Finance on exchanges soon. It
meant Reliance Capital goes ex-demerger today.
"We will list home finance business in 15-20 days after September 6," Ravindra
Sudhalkar, CEO of Reliance Home Finance said in an interview with CNBC-TV18.
He believes net worth of the company will go up to Rs 1,500 crore after infusion
and he expects net interest margin to be in the upper range of 3.5 percent.
According to him, return on assets can be upwards of 1.6 percent by FY20.
Sudhalkar expects gross non-performing assets in the region of 0.65-0.8 percent
till FY20.
3. Positive on next five years for company and industry : Kajaria
Ceramics; Mr. Ashok Kajaria, Chairman & MD
Things have moved in the positive direction in the last five years. Things have
moved in the positive direction and we see a very positive scenario ahead
because of GST which has been implemented on 1st of July. Cumulatively,
Kajaria has a volume and revenue growth of almost 18-20% if you take five years
data, says Mr. Kajaria.
6 September 2017
21

From the think tank
1. Demonetisation was a self-goal? These numbers speak the
truth by: M Govinda Rao
The two reports released in the last week—RBI’s Annual Report and the
Quarterly Estimate of the GDP—have once again drawn focus to the issue of
economic slowdown and the impact of demonetisation in decelerating growth.
While the opposition parties have called it a disaster, a monumental blunder
and a measure that inflicted enormous pain without gain, the ruling party
mandarins have termed it as the most innovative move to curb the black money,
advancing the process of formalisation of the economy and ending anonymity.
In this din and buzzle, where positions are taken on party lines, the common
man is left confused.
2. Forex reserves can be managed better; by: Himadri
Bhattacharya
India’s foreign exchange reserves are now a touch below $400 billion. If one
adds the RBI’s forward buying commitments of US dollars, the reserves are
about $410 billion. In more senses than one, this is a landmark attainment that
encapsulates the validity and success of the economic reform process that
began in the wake of the BoP crisis in 1990-91 when the reserves had fallen to
less than $1 billion. It also portrays the good quality of overall macroeconomic
management, especially of the external sector, in the post-reform years. India
has now overtaken Brazil as the top holder of foreign exchange reserves among
countries with current account deficit.
3. COMPETITION COMMISSION VS TELECOM REGULATORY
AUTHORITY - Fierce Contest Over Competition; M M Sharma
The ongoing turf war between the Competition Commission of India (CCI) and
the Telecom Regulatory Authority of India (Trai), triggered by CCI chairman
Devender Sikri writing a letter to Trai chairman R S Sharma on July 21, shows no
sign of abating. Trai is now claiming to possess more experience in handling
competition issues -e.g., abuse of dominance and predatory pricing -within the
telecom sector. The tussle between new entrant Reliance Jio and entrenched
players like Bharti Airtel, Vodafone and Idea to grab the maximum share of the
huge telecom market is to be seen in the light of this turf war.
6 September 2017
22

Click excel icon
for detailed
valuation guide
Rs
Valuation snapshot
P/E (x)
P/B (x)
ROE (%)
FY17 FY18E FY17 FY18E FY17 FY18E FY19E
28.3
21.9
21.5
31.1
40.7
18.4
37.4
34.9
17.5
22.2
21.0
19.3
24.0
27.7
17.3
42.5
24.7
23.0
22.3
99.7
20.8
25.7
20.0
20.7
27.2
20.6
30.4
29.9
10.2
19.3
24.1
14.5
NM
11.2
8.6
8.3
7.5
24.6
19.0
15.2
17.9
37.5
29.0
22.3
20.5
14.6
53.1
33.4
14.4
28.0
16.3
5.3
5.4
5.0
6.4
7.7
2.9
16.2
8.3
3.3
3.5
7.8
3.1
2.7
6.5
2.3
12.1
4.9
2.2
2.7
2.6
2.2
5.2
2.2
1.3
5.1
0.7
4.8
4.7
1.1
3.8
3.4
0.9
0.6
0.7
0.5
0.9
0.3
0.8
1.3
0.4
0.9
10.2
5.2
3.2
4.2
2.2
19.4
7.0
4.3
4.6
3.2
4.6
4.8
4.6
5.6
6.9
2.6
12.1
6.9
2.8
3.1
6.8
2.8
2.5
5.7
2.0
10.0
4.3
2.1
2.2
2.6
1.8
4.5
2.0
1.3
4.4
0.7
4.2
3.4
1.1
3.3
3.0
0.9
0.7
0.7
0.5
0.9
0.3
0.8
1.2
0.5
0.8
8.3
4.2
2.8
3.5
2.0
15.9
6.3
3.8
4.0
2.8
20.3
23.1
25.3
16.2
15.8
16.9
37.1
20.8
10.6
13.9
35.7
14.2
6.4
20.3
9.8
25.6
17.1
6.9
10.8
9.5
9.9
18.3
10.2
5.6
15.4
-27.0
13.8
12.3
9.5
18.9
11.5
4.0
-6.7
4.2
1.4
10.1
-8.4
3.6
-0.2
2.7
0.9
21.7
15.1
12.0
18.0
14.4
32.5
18.9
25.5
12.4
19.4
17.3
23.2
22.2
19.2
18.0
14.8
37.0
21.6
17.3
14.1
34.6
13.9
10.8
20.1
12.3
25.7
17.4
9.3
11.4
2.6
10.0
18.8
8.9
6.3
17.3
3.5
15.0
13.6
10.8
18.3
12.5
6.1
-5.2
6.2
5.8
10.9
4.6
3.2
7.0
3.0
4.6
24.3
16.1
13.3
18.6
14.1
33.0
19.3
28.2
15.6
18.2
19.9
27.0
24.0
22.8
20.7
17.3
35.4
23.3
18.3
15.0
31.5
14.9
11.5
22.8
26.6
33.6
22.3
14.7
11.8
8.7
10.5
19.6
9.5
6.9
18.5
7.2
16.3
13.9
12.7
19.5
14.2
12.4
3.0
9.1
7.3
11.2
5.4
5.9
11.4
6.1
8.3
25.9
28.0
15.6
19.0
15.6
32.8
18.4
31.3
19.1
18.5
Company
Automobiles
Amara Raja
Ashok Ley.
Bajaj Auto
Bharat Forge
Bosch
CEAT
Eicher Mot.
Endurance Tech.
Escorts
Exide Ind
Hero Moto
M&M
Mahindra CIE
Maruti Suzuki
Tata Motors
TVS Motor
Aggregate
Banks - Private
Axis Bank
DCB Bank
Equitas Hold.
Federal Bank
HDFC Bank
ICICI Bank
IDFC Bank
IndusInd
J&K Bank
Kotak Mah. Bk
RBL Bank
South Indian
Yes Bank
Aggregate
Banks - PSU
BOB
BOI
Canara
IDBI Bk
Indian Bk
OBC
PNB
SBI
Union Bk
Aggregate
NBFCs
Bajaj Fin.
Bharat Fin.
Capital First
Cholaman.Inv.&Fn
Dewan Hsg.
GRUH Fin.
HDFC
Indiabulls Hsg
L&T Fin Holdings
LIC Hsg Fin
Reco
Buy
Buy
Buy
Buy
Neutral
Buy
Buy
Buy
Neutral
Buy
Neutral
Buy
Not Rated
Buy
Buy
Buy
CMP
(INR)
TP
% Upside
EPS (INR)
(INR) Downside FY17 FY18E FY19E
24
4
11
19
-1
17
12
4
13
32
-4
23
13
40
0
28.0
4.6
132.3
26.2
473.1
93.3
612.7
23.5
20.0
8.1
169.1
54.3
5.4
248.6
19.8
11.7
798
986
113
118
2,950 3,281
1,134 1,353
22,276 21,994
1,735 2,029
31,884 35,854
1,023 1,059
650
732
204
269
3,971 3,818
1,325 1,625
236
-
7,816 8,819
387
542
613
612
28.2
37.9
28.5
5.2
7.0
24.9
137.2 163.6 22.3
36.5
50.5
43.3
547.2 705.7 47.1
94.2 126.8 18.6
852.9 1,092.8 52.0
29.3
37.9
43.5
37.1
45.8
32.6
9.2
11.0
25.2
189.3 199.1 23.5
68.5
82.4
24.4
9.9
11.8
44.1
281.7 374.5 31.4
22.4
59.8
19.6
14.4
23.7
52.2
28.6
21.8
8.4
1.7
5.4
68.2
14.9
2.8
61.9
3.8
32.4
18.0
2.9
92.3
38.1
10.4
6.1
6.8
82.1
17.0
3.2
76.8
8.2
41.0
23.7
3.7
114.5
32.7
26.6
34.2
23.2
30.9
19.5
24.6
35.1
NM
36.8
45.2
13.4
24.4
29.9
23.1
NM
18.0
36.2
9.8
NM
23.1
932.2
17.0
100.9
53.2
43.9
30.1
24.9
18.6
64.9
37.7
18.0
39.1
17.7
Neutral
Neutral
Buy
Buy
Buy
Buy
Neutral
Buy
Neutral
Buy
Under Review
Buy
Buy
503
186
173
112
1,757
298
57
1,684
79
987
538
29
1,777
545
192
201
139
2,000
366
62
1,800
91
1,153
-
34
2,133
8
3
16
24
14
23
8
7
15
17
17
20
15.4
7.0
5.0
4.8
56.8
15.3
2.3
47.9
-31.3
26.8
11.9
2.2
73.0
Buy
Neutral
Neutral
Neutral
Buy
Neutral
Buy
Buy
Neutral
138
144
338
55
286
128
144
277
137
198
149
360
49
382
150
184
341
140
43
3
7
-11
34
18
28
23
2
6.0
-14.8
18.8
1.5
29.3
-31.6
6.2
0.3
8.1
9.5
-11.2
30.1
6.4
34.4
17.1
5.8
14.6
9.0
20.8
6.6
47.0
8.6
38.3
21.4
11.0
26.8
19.1
Buy
Neutral
Buy
Buy
Buy
Neutral
Buy
Buy
Buy
Neutral
1,788
922
741
1,146
550
528
1,767
1,240
205
678
1,800
820
925
1,400
630
450
1,900
1,350
200
708
1
-11
25
22
15
-15
8
9
-2
4
33.6
21.0
24.6
46.0
29.6
8.1
46.8
69.0
5.2
38.2
47.6
31.8
33.3
56.0
37.7
9.9
52.9
86.3
7.3
41.6
62.9
68.7
44.3
67.3
47.1
12.1
59.0
108.4
10.6
48.9
6 September 2017
23

Company
Manappuram
M&M Fin.
Muthoot Fin
PFC
Repco Home
REC
Shriram City Union
STF
Aggregate
Capital Goods
ABB
Bharat Elec.
BHEL
Blue Star
CG Cons. Elec.
CG Power & Indu.
Cummins
GE T&D
Havells
K E C Intl
L&T
Pennar Eng.
Siemens
Solar Ind
Suzlon Energy
Thermax
Va Tech Wab.
Voltas
Aggregate
Cement
Ambuja Cem.
ACC
Birla Corp.
Dalmia Bharat
Grasim Inds.
India Cem
J K Cements
JK Lakshmi Ce
Ramco Cem
Orient Cem
Prism Cem
Shree Cem
Ultratech
Aggregate
Consumer
Asian Paints
Britannia
Colgate
Dabur
Emami
Godrej Cons.
GSK Cons.
HUL
ITC
Jyothy Lab
Reco
Not Rated
Buy
Buy
Neutral
Buy
Neutral
Buy
Buy
CMP
(INR)
103
439
466
123
649
164
2,073
1,070
TP
% Upside
EPS (INR)
(INR) Downside FY17 FY18E FY19E
-
8.6
10.8
12.5
459
5
7.1
13.9
17.8
550
18
29.5 38.2
44.2
117
-5
25.7 27.2
30.2
800
23
29.1 34.5
39.3
134
-18
31.4 35.0
40.4
2,800
35
84.3 121.7 164.1
1,330
24
55.6 80.0 102.4
P/E (x)
P/B (x)
ROE (%)
FY17 FY18E FY17 FY18E FY17 FY18E FY19E
11.9
9.6
2.6
2.3
24.0 25.9 26.9
62.0 31.6
3.9
3.7
6.5
12.0 14.2
15.8 12.2
2.9
2.4
19.4 21.5 21.2
4.8
4.5
0.8
0.7
17.9 17.0 16.8
22.3 18.8
3.6
3.0
17.4 17.5 17.0
5.2
4.7
1.0
0.8
19.9 19.1 19.1
24.6 17.0
2.7
2.4
11.7 15.0 17.6
19.2 13.4
2.2
1.9
11.7 15.0 16.9
21.0 17.7 3.5
3.1
16.8 17.6 18.1
68.1
27.7
61.0
58.9
46.3
20.8
33.9
72.1
51.6
25.6
26.7
16.4
72.3
42.6
25.8
28.7
20.8
33.8
34.9
57.7
49.9
32.9
71.1
17.4
33.1
30.3
62.0
26.5
NM
401.1
47.0
42.7
37.3
57.3
57.8
52.3
43.2
41.7
49.0
34.0
61.3
33.6
34.7
59.9
25.8
28.7
43.3
43.1
42.0
32.5
44.5
45.1
23.2
24.1
12.8
56.7
36.3
18.5
29.5
17.9
31.1
30.3
40.5
36.2
23.6
40.1
16.5
23.2
25.7
44.4
26.4
36.2
31.4
39.2
44.8
31.9
54.3
49.9
45.4
40.5
41.1
43.0
33.5
52.4
30.5
39.7
8.7
5.7
1.0
9.6
25.2
1.3
6.7
10.2
9.4
4.9
3.1
1.7
6.7
7.8
-1.5
3.9
3.4
5.2
3.9
2.9
3.9
2.3
4.9
1.9
1.1
4.1
3.6
4.6
3.3
5.8
8.2
4.7
3.6
15.2
19.0
23.7
11.4
14.3
11.9
7.1
39.0
7.6
6.5
7.6
4.4
1.0
9.0
18.6
1.2
6.2
9.0
8.4
4.2
3.5
1.5
5.8
6.7
-1.6
3.6
2.9
4.6
3.8
2.8
3.8
2.1
4.4
1.7
1.1
3.6
3.4
4.0
3.1
5.0
6.9
4.3
3.3
13.8
15.6
22.5
9.8
12.2
9.3
7.0
37.7
7.5
6.6
12.7
20.6
1.6
18.0
76.4
6.2
21.2
12.4
18.2
21.2
12.5
10.2
9.3
19.8
NM
14.3
16.8
18.0
11.2
5.1
7.9
7.3
7.2
11.5
3.4
14.4
6.0
19.0
-3.2
1.4
18.4
11.6
9.6
28.5
36.9
50.4
28.4
35.8
24.6
22.2
65.6
23.5
21.1
12.6
17.0
3.4
21.4
49.7
3.0
19.7
21.5
18.6
19.5
13.7
11.6
10.3
19.8
-8.8
12.7
17.6
15.8
12.7
7.0
10.6
9.2
11.6
10.9
4.7
14.8
7.9
16.1
8.8
17.0
19.1
10.1
10.3
26.7
34.3
50.8
26.0
32.0
24.2
21.1
73.1
24.8
16.5
15.8
16.9
3.5
29.6
49.7
3.7
22.8
22.7
20.7
20.9
15.6
12.6
13.7
20.9
-11.0
12.8
17.4
16.0
13.6
7.9
13.1
12.2
13.4
13.9
6.6
17.5
12.1
17.5
12.8
22.9
19.1
14.0
12.7
28.1
34.5
58.2
26.3
33.9
22.8
22.6
82.8
26.3
18.4
Sell
Buy
Sell
Neutral
Buy
Neutral
Buy
Neutral
Neutral
Neutral
Buy
Not Rated
Neutral
Neutral
Not Rated
Neutral
Buy
Sell
1,342
192
131
759
217
85
898
413
493
304
1,129
116
1,288
879
16
885
621
522
1,200
210
100
650
250
80
1,170
395
455
295
1,340
-
1,355
900
-
830
800
430
-11
9
-24
-14
15
-6
30
-4
-8
-3
19
5
2
-6
29
-18
19.7
6.9
2.1
12.9
4.7
4.1
26.5
5.7
9.6
11.9
42.3
7.1
17.8
20.6
0.6
30.8
29.8
15.5
22.4
7.4
4.6
17.5
5.0
2.0
27.7
9.3
10.9
13.1
46.8
9.1
22.7
24.2
0.9
30.0
34.6
16.8
31.6
8.3
4.9
26.1
6.4
2.5
35.0
11.3
13.8
16.4
53.2
11.2
33.0
30.0
1.0
33.2
39.8
19.1
Buy
Neutral
Buy
Buy
Neutral
Neutral
Buy
Buy
Buy
Buy
Buy
Buy
Buy
282
308
1,803 1,622
967
1,150
2,756 3,282
1,178 1,079
186
201
1,021 1,277
431
519
722
806
160
185
110
140
18,066 22,360
4,100 4,936
9
-10
19
19
-8
8
25
20
12
16
28
24
20
4.9
7.0
36.1 49.8
29.4 40.9
38.8 68.7
67.9 71.3
5.6
8.0
33.7 39.7
7.0
9.7
27.3 27.4
-1.6
4.4
0.3
3.5
384.4 460.4
96.1 91.5
8.2
65.0
58.9
89.9
102.7
11.8
54.4
16.4
34.4
7.1
5.6
547.8
138.8
Neutral
Buy
Buy
Neutral
Buy
Neutral
Sell
Buy
Neutral
Neutral
1,205
4,261
1,110
313
1,106
927
5,301
1,203
282
390
1,200
4,660
1,285
315
1,310
995
4,500
1,360
280
395
0
9
16
1
18
7
-15
13
-1
1
21.0 22.2
73.7 85.3
21.2 24.4
7.2
7.7
26.5 26.9
18.9 21.5
156.1 158.1
19.6 22.9
8.4
9.3
11.2
9.8
26.5
104.6
29.8
9.1
33.1
24.7
182.1
27.3
10.3
11.1
6 September 2017
24

Company
Reco
Marico
Neutral
Nestle
Neutral
Page Inds
Buy
Parag Milk
Neutral
Pidilite Ind.
Neutral
P&G Hygiene
Neutral
Prabhat Dairy
Not Rated
United Brew
Neutral
United Spirits
Neutral
Aggregate
Healthcare
Alembic Phar
Neutral
Alkem Lab
Neutral
Ajanta Pharma
Buy
Aurobindo
Buy
Biocon
Sell
Cadila
Buy
Cipla
Neutral
Divis Lab
Neutral
Dr Reddy’s
Neutral
Fortis Health
Buy
Glenmark
Neutral
Granules
Buy
GSK Pharma
Neutral
IPCA Labs
Neutral
Jubilant Life
Buy
Lupin
Buy
Sanofi India
Buy
Shilpa Medicare
Buy
Strides Shasun
Buy
Sun Pharma
Buy
Syngene Intl
Not Rated
Torrent Pharma
Neutral
Aggregate
Logistics
Allcargo Logistics Buy
Blue Dart
Not Rated
Concor
Neutral
Gateway Distriparks Buy
Gati
Not Rated
Transport Corp.
Not Rated
Aggregate
Media
Dish TV
Buy
D B Corp
Buy
Den Net.
Neutral
Ent.Network
Neutral
Hind. Media
Buy
HT Media
Neutral
Jagran Prak.
Buy
Music Broadcast
Buy
PVR
Buy
Siti Net.
Neutral
Sun TV
Neutral
Zee Ent.
Buy
CMP
TP
% Upside
(INR)
(INR) Downside
314
355
13
7,023 6,160
-12
18,356 19,600
7
250
245
-2
841
810
-4
8,358 8,800
5
134
-
804
875
9
2,563 2,525
-1
FY17
6.3
118.0
238.7
3.6
16.7
132.9
3.5
8.7
26.7
EPS (INR)
FY18E FY19E
6.8
8.2
115.1 133.6
294.7 398.4
9.1
12.5
18.1
20.6
151.6 176.0
3.5
6.4
10.1
15.0
34.5
51.5
P/E (x)
FY17 FY18E
49.9 46.0
59.5 61.0
76.9 62.3
69.3 27.4
50.3 46.6
62.9 55.1
37.9 38.5
92.5 79.9
95.9 74.3
47.4 42.8
23.4
23.9
20.5
18.9
32.7
35.9
35.2
18.2
30.4
14.7
15.4
17.8
71.1
26.2
19.1
17.8
31.0
43.5
28.8
18.9
35.7
22.2
23.2
17.0
42.5
35.5
32.4
14.0
16.6
30.8
81.8
18.6
NM
76.6
10.4
13.2
16.4
57.1
63.6
NM
33.2
22.5
24.7
24.6
22.7
16.6
34.4
28.5
26.5
21.6
25.9
69.6
14.1
15.7
52.2
25.4
15.0
24.0
29.9
28.9
19.6
32.7
28.8
22.9
25.3
14.9
33.5
32.0
24.5
7.4
13.4
25.8
61.8
16.0
NM
65.5
9.5
12.3
14.3
39.4
42.3
NM
29.0
35.3
P/B (x)
ROE (%)
FY17 FY18E FY17 FY18E FY19E
17.4 14.9 36.7 34.9 37.7
22.5 20.9 39.0 35.5 38.1
30.8 24.7 40.0 39.6 43.1
3.2
2.9
6.0
11.0 13.3
13.0 10.6 28.2 25.2 23.5
39.4 32.7 39.3 64.9 62.8
1.9
1.8
5.2
4.9
8.5
9.2
8.4
10.4 11.0 14.7
19.2 13.4 21.3 18.0 20.3
13.0 12.1 27.5 28.2 29.3
5.0
5.1
6.8
4.7
4.1
7.5
3.6
4.1
3.0
1.6
3.8
3.3
10.3
2.2
3.2
3.3
5.3
5.3
3.1
3.2
7.2
4.8
3.9
2.5
18.8
3.7
2.4
1.9
2.6
3.8
17.5
4.4
1.6
4.9
1.8
0.9
2.4
3.8
6.3
3.5
7.8
8.6
4.4
4.4
5.4
3.7
3.8
6.3
3.2
3.7
2.8
1.4
3.0
2.3
12.0
2.0
2.7
3.0
5.0
4.5
2.7
3.3
5.9
4.2
3.6
2.3
14.3
3.5
2.3
1.7
2.2
3.6
13.7
3.9
1.8
4.6
1.5
0.8
2.4
3.5
5.5
3.7
7.2
7.4
23.0
23.4
37.7
27.6
12.3
23.0
10.2
23.5
9.7
11.3
24.7
21.1
14.5
8.6
18.1
20.6
17.1
14.4
10.7
18.5
22.2
23.8
16.9
12.6
50.5
10.8
7.3
12.4
16.7
12.4
24.1
25.5
-12.0
6.7
19.0
7.1
17.6
11.2
10.4
-23.5
23.6
24.7
19.0
19.2
26.5
24.8
11.1
23.9
12.1
18.1
11.3
2.1
21.6
17.7
23.0
8.2
19.5
13.2
16.6
17.0
14.7
10.0
22.5
19.5
14.1
16.0
48.6
11.3
9.4
19.4
17.8
13.8
24.9
25.8
-5.3
7.2
17.3
6.9
16.5
9.3
14.0
-4.1
25.0
22.6
20.4
20.5
25.9
22.1
14.5
26.3
13.2
19.4
14.8
4.9
20.9
18.8
30.9
12.2
19.6
16.0
18.1
20.4
20.2
14.7
20.7
21.5
16.3
16.8
46.8
12.4
12.4
25.4
18.6
15.4
99.2
26.6
0.7
10.7
17.3
6.4
17.4
12.4
18.2
6.2
28.8
24.5
505
1,805
1,198
744
334
510
560
724
2,209
152
603
129
2,443
422
704
992
3,999
609
928
493
465
1,223
510
1,830
1,606
850
330
555
520
680
2,500
220
775
200
2,500
430
905
1,125
4,820
805
1,300
515
-
1,350
1
1
34
14
-1
9
-7
-6
13
45
28
56
2
2
28
13
21
32
40
4
10
21.6 20.5
75.7 73.5
58.4 52.8
39.3 44.9
10.2
9.7
14.2 17.9
15.9 21.1
39.7 33.6
72.6 85.1
10.3
2.2
39.3 42.9
7.2
8.2
34.4 46.8
16.1 16.6
37.0 47.1
55.8 41.4
129.1 133.6
14.0 21.1
32.3 47.4
26.1 15.1
13.0 16.1
55.2 53.4
25.5
91.6
64.2
50.0
14.2
24.1
26.0
40.0
125.2
5.6
51.7
11.5
54.9
26.8
56.7
56.3
160.6
30.4
74.8
23.3
18.0
67.3
167
4,354
1,349
221
117
282
212
-
1,214
272
-
-
27
-10
23
9.8
11.2
102.5 129.9
38.0 42.1
6.8
9.0
8.4
15.9
16.9 21.0
13.3
163.2
48.6
12.4
23.9
25.9
81
379
88
875
270
98
177
367
1,306
26
826
520
106
450
90
928
350
90
225
469
1,628
32
860
630
31
19
2
6
30
-8
27
28
25
25
4
21
1.0
20.4
-8.6
11.4
25.9
7.4
10.8
6.4
20.5
-1.8
24.9
23.1
1.3
23.7
-2.7
13.4
28.3
7.9
12.4
9.3
30.9
-0.3
28.5
14.7
4.3
27.6
0.3
21.7
33.6
8.1
14.1
14.0
46.9
0.4
35.9
18.9
6 September 2017
25

Company
Aggregate
Metals
Hindalco
Hind. Zinc
JSPL
JSW Steel
Nalco
NMDC
SAIL
Vedanta
Tata Steel
Aggregate
Oil & Gas
BPCL
GAIL
Gujarat Gas
Gujarat St. Pet.
HPCL
IOC
IGL
MRPL
Oil India
ONGC
PLNG
Reliance Ind.
Aggregate
Retail
Jubilant Food
Titan Co.
Aggregate
Technology
Cyient
HCL Tech.
Hexaware
Infosys
KPIT Tech
L&T Infotech
Mindtree
Mphasis
NIIT Tech
Persistent Sys
Tata Elxsi
TCS
Tech Mah
Wipro
Zensar Tech
Aggregate
Telecom
Bharti Airtel
Bharti Infratel
Idea Cellular
Tata Comm
Aggregate
Utiltites
Coal India
Reco
CMP
(INR)
TP
% Upside
EPS (INR)
(INR) Downside FY17 FY18E FY19E
P/E (x)
P/B (x)
ROE (%)
FY17 FY18E FY17 FY18E FY17 FY18E FY19E
39.9 30.6 5.6
5.1
14.0 16.7 21.3
15.0
15.5
NM
17.3
20.1
13.5
NM
21.0
17.2
21.4
11.1
16.8
40.4
21.3
11.8
10.0
30.0
9.4
16.0
9.9
19.8
16.9
13.0
137.8
70.8
73.4
17.3
14.4
20.1
14.3
9.8
13.7
18.3
15.6
13.6
16.2
31.0
18.6
13.8
17.6
15.3
16.7
36.6
25.0
NM
24.2
38.6
17.0
11.0
13.7
NM
11.7
21.3
10.8
NM
13.3
10.0
15.0
15.7
14.3
22.1
16.8
14.1
11.8
26.4
14.7
11.1
9.9
16.1
14.1
13.1
93.1
60.2
61.2
15.0
13.9
17.5
14.5
11.0
12.7
15.9
15.1
12.2
14.1
25.9
18.5
12.6
16.4
15.3
16.5
1.9
4.2
0.4
2.7
1.4
1.9
0.7
1.9
2.0
1.8
3.4
1.7
6.9
2.4
3.6
2.0
6.3
2.4
0.8
0.9
4.2
1.7
1.7
11.3
13.4
12.6
2.8
3.6
4.9
3.0
1.5
4.8
3.0
2.1
1.8
2.5
9.7
5.5
2.3
2.8
2.4
3.8
1.5
4.5
0.4
2.3
1.4
1.8
0.8
1.8
1.8
1.7
3.0
1.6
5.5
2.1
3.1
1.8
5.3
2.1
0.8
0.9
3.5
1.5
1.6
10.4
12.2
11.5
2.5
3.2
4.2
2.7
1.4
3.7
2.9
2.2
1.7
2.4
7.8
5.9
2.1
2.7
2.2
3.8
2.4
3.8
1.5
10.2
2.7
6.1
14.0
24.4
-7.9
17.3
7.2
12.8
-6.7
9.7
15.7
8.2
32.4
9.6
17.8
11.6
32.4
21.2
21.0
31.4
5.7
10.1
23.2
11.6
13.3
8.2
20.6
17.2
16.2
27.5
26.5
22.0
14.3
40.4
16.8
13.2
13.7
17.0
37.1
32.6
18.4
16.9
17.2
22.9
15.3
31.5
-4.9
21.3
6.5
15.2
-9.1
14.2
18.6
11.2
20.4
11.3
27.6
13.2
23.6
16.0
21.9
15.5
7.5
9.4
23.7
12.3
12.2
11.1
21.3
18.9
16.6
24.9
25.7
19.6
13.0
33.0
17.3
14.5
14.4
17.9
33.5
31.1
17.4
16.1
15.0
22.8
15.4
38.0
0.6
20.8
7.7
15.6
-5.3
20.4
16.2
14.0
21.4
12.4
27.4
14.2
21.7
15.8
20.9
17.0
8.0
10.9
25.5
12.3
12.7
14.0
22.2
19.6
17.3
23.8
23.1
19.3
14.2
29.4
20.1
16.2
15.4
20.7
32.2
33.5
16.9
16.1
17.9
22.0
3.8
19.4
-21.7
33.6
2.8
44.2
Buy
Neutral
Buy
Buy
Neutral
Buy
Sell
Buy
Neutral
242
304
140
256
74
135
62
317
651
309
301
194
297
63
180
30
361
591
28
-1
38
16
-15
33
-52
14
-9
16.2
19.7
-20.9
14.8
3.7
10.0
-6.2
15.1
37.9
22.0
22.2
-15.8
21.9
3.5
12.4
-7.7
23.9
65.1
26.3
29.3
2.0
25.7
4.2
12.1
-4.2
37.4
64.3
Neutral
Sell
Sell
Neutral
Buy
Buy
Neutral
Sell
Buy
Buy
Buy
Neutral
539
379
823
188
482
432
1,318
138
308
163
226
1,633
515
346
691
171
510
458
1,152
113
316
195
274
1,499
-4
-9
-16
-9
6
6
-13
-18
2
20
21
-8
48.3
22.6
20.4
8.8
40.7
43.0
44.0
14.8
19.3
16.4
11.4
96.7
34.3
26.5
37.2
11.1
34.1
36.7
49.9
9.4
27.9
16.5
14.0
115.5
41.3
31.3
46.1
13.3
36.3
40.4
56.3
11.7
31.1
19.7
17.9
128.1
Sell
Neutral
1,379
640
850
565
-38
-12
10.0
9.0
14.8
10.6
20.7
12.6
Buy
Neutral
Neutral
Buy
Neutral
Buy
Neutral
Neutral
Neutral
Buy
Buy
Neutral
Buy
Neutral
Buy
530
859
274
901
117
762
455
609
515
609
1,745
2,478
427
297
795
600
950
250
1,050
140
880
450
610
540
750
1,992
2,350
490
270
950
13
11
-9
17
20
16
-1
0
5
23
14
-5
15
-9
20
30.6 35.4
59.8 61.8
13.7 15.7
62.9 62.2
11.9 10.6
55.5 60.2
24.9 28.7
38.9 40.3
38.0 42.3
37.7 43.3
56.3 67.4
133.4 133.6
30.9 34.0
16.9 18.1
52.1 51.9
41.9
65.9
16.5
67.2
13.1
68.0
32.9
43.0
48.7
52.0
79.7
147.7
36.8
19.1
70.0
Buy
Buy
Buy
Buy
407
372
85
660
490
480
110
775
21
29
30
17
11.1
14.9
-1.1
27.2
4.3
17.9
-10.9
8.7
6.6
20.4
-11.3
26.1
93.7
2.4
20.8
4.4
NM
1.2
75.8 11.8
213.8 2.7
13.9
6.4
6.7
2.5
16.2 19.8
-1.6 -17.3
132.2 14.5
6.9
1.2
37.8
44.2
Buy
254
275
8
14.9
18.3
19.1
6 September 2017
26

Company
Reco
CESC
Buy
JSW Energy
Sell
NTPC
Buy
Power Grid
Buy
Tata Power
Sell
Aggregate
Others
Arvind
Neutral
Avenue Supermarts Neutral
Bata India
Under Review
BSE
Neutral
Castrol India
Buy
Century Ply.
Neutral
Coromandel Intl
Buy
Delta Corp
Buy
Dynamatic Tech
Buy
Eveready Inds.
Buy
Interglobe
Neutral
Indo Count
Neutral
Info Edge
Buy
Inox Leisure
Sell
Jain Irrigation
Under Review
Just Dial
Neutral
Kaveri Seed
Buy
Kitex Garm.
Buy
Manpasand
Buy
MCX
Buy
Monsanto
Buy
Navneet Education Buy
PI Inds.
Buy
Piramal Enterp.
Buy
SRF
Buy
S H Kelkar
Buy
Symphony
Sell
Trident
Buy
TTK Prestige
Neutral
V-Guard
Neutral
Wonderla
Buy
CMP
(INR)
1,051
67
169
216
78
TP
% Upside
EPS (INR)
(INR) Downside FY17 FY18E FY19E
1,360
29
51.9 88.9
99.3
49
-27
3.8
3.4
2.7
204
20
13.0 13.3
16.3
262
21
14.2 17.4
20.6
68
-13
5.2
6.4
6.7
P/E (x)
P/B (x)
ROE (%)
FY17 FY18E FY17 FY18E FY17 FY18E FY19E
20.3 11.8
1.3
1.2
6.5
10.6 10.8
17.5 19.9
1.1
1.0
6.3
5.3
4.2
13.0 12.7
1.4
1.3
11.5 10.8 12.4
15.2 12.4
2.3
2.0
16.2 17.3 17.8
15.2 12.3
1.8
1.6
11.2 13.9 12.1
14.8 12.8 2.2
2.0
14.9 15.9 16.6
31.5
140.8
50.8
23.8
28.6
27.8
26.5
62.0
37.9
23.4
27.3
8.9
61.1
73.9
18.8
22.0
28.7
13.2
63.9
43.3
30.4
21.4
21.0
37.3
17.8
35.7
54.1
14.7
47.7
53.4
50.4
30.2
85.0
43.7
23.1
28.2
24.5
18.3
32.2
22.7
22.1
19.7
13.0
44.0
30.7
13.7
20.8
16.1
11.1
40.2
36.6
25.0
19.0
23.1
26.0
19.1
34.0
36.5
11.8
45.7
42.6
29.5
2.8
17.6
6.7
2.0
32.4
7.5
4.4
4.8
5.2
7.6
22.5
2.7
5.9
4.3
1.6
3.0
3.7
3.6
4.0
4.0
8.5
5.3
5.9
3.5
2.8
4.6
20.1
1.8
8.6
12.7
4.6
2.6
15.3
6.0
2.0
29.2
6.2
3.8
3.2
4.2
6.2
20.0
2.2
5.3
3.8
1.6
2.6
3.9
2.9
3.7
3.8
7.7
4.6
4.9
3.2
2.5
4.2
17.7
1.6
7.8
10.4
4.1
10.3
9.1
12.0
17.9 19.3 23.0
13.9 14.4 15.8
8.3
8.5
7.7
115.2 108.9 99.2
31.1 27.7 29.6
17.5 22.5 23.4
8.1
12.5 12.9
15.1 20.7 24.3
37.7 30.8 30.1
86.2 107.5 137.7
34.8 18.6 18.3
10.2 12.7 13.1
5.9
12.5 16.2
8.6
11.7 14.8
14.8 13.4 13.7
13.6 23.3 27.4
29.8 28.6 27.6
7.3
8.5
13.5
9.9
10.7 13.9
31.6 32.5 34.5
26.8 26.0 27.4
32.8 23.4 22.9
9.8
13.0 16.4
16.6 13.7 16.0
13.7 12.9 15.2
43.3 51.6 54.5
13.0 14.5 16.1
19.5 18.0 20.7
27.4 26.9 28.8
9.5
14.8 17.5
390
1,080
686
975
391
241
441
189
2,561
302
1,258
116
958
247
104
385
547
246
811
1,076
2,623
166
702
2,705
1,532
259
1,280
97
6,298
191
352
375
882
-
1,100
489
323
523
243
3,334
358
1,312
129
1,130
240
-
465
738
394
926
1,230
3,295
215
894
3,044
1,648
298
1,288
114
5,281
167
393
-4
-18
13
25
34
19
28
30
19
4
12
18
-3
21
35
60
14
14
26
30
27
13
8
15
1
17
-16
-12
12
12.4
7.7
13.5
41.0
13.6
8.7
16.6
3.1
67.6
12.9
46.0
13.0
15.7
3.3
5.5
17.5
19.1
18.6
12.7
24.8
86.2
7.8
33.4
72.6
85.9
7.2
23.7
6.6
132.1
3.6
7.0
12.9
12.7
15.7
42.2
13.9
9.8
24.1
5.9
112.9
13.6
63.9
8.9
21.8
8.0
7.6
18.5
34.0
22.1
20.2
29.4
105.1
8.7
30.4
104.1
80.2
7.6
35.1
8.3
137.8
4.5
11.9
18.6
17.6
19.4
44.6
14.0
12.9
29.0
8.1
166.7
16.3
93.7
10.8
24.7
12.0
10.0
21.1
41.0
26.2
30.9
40.7
126.7
10.8
35.8
144.6
103.0
9.9
42.9
10.4
176.1
6.0
16.0
6 September 2017
27

MOSL Universe stock performance
Company
Automobiles
Amara Raja
Ashok Ley.
Bajaj Auto
Bharat Forge
Bosch
CEAT
Eicher Mot.
Endurance Tech.
Escorts
Exide Ind
Hero Moto
M&M
Mahindra CIE
Maruti Suzuki
Tata Motors
TVS Motor
Banks - Private
Axis Bank
DCB Bank
Equitas Hold.
Federal Bank
HDFC Bank
ICICI Bank
IDFC Bank
IndusInd
J&K Bank
Kotak Mah. Bk
RBL Bank
South Indian
Yes Bank
Banks - PSU
BOB
BOI
Canara
IDBI Bk
Indian Bk
OBC
PNB
SBI
Union Bk
NBFCs
Bajaj Fin.
Bharat Fin.
Capital First
Cholaman.Inv.&Fn
Dewan Hsg.
GRUH Fin.
HDFC
Indiabulls Hsg
L&T Fin.Holdings
LIC Hsg Fin
Manappuram
M&M Fin.
Muthoot Fin
PFC
Repco Home
REC
STF
Shriram City Union
1 Day (%)
1.5
0.0
1.3
0.9
-0.7
1.6
0.6
3.8
0.7
0.7
-0.1
-0.2
-0.4
0.2
0.8
-0.2
0.0
0.5
1.8
0.3
0.2
0.2
0.2
0.9
-0.1
0.8
0.7
1.2
0.9
1.2
1.1
0.6
0.8
0.4
2.1
0.6
-0.2
1.0
-0.6
1.9
2.2
1.2
5.6
2.5
0.7
0.3
4.8
0.2
1.9
2.8
0.6
0.5
0.2
-0.4
-0.3
-0.3
1M (%)
-1.0
3.8
2.6
-1.9
-9.6
-0.4
0.9
13.3
-3.4
-5.3
0.3
-6.6
-3.4
0.5
-11.0
2.3
-1.2
-4.5
2.8
-1.8
-1.9
0.6
0.1
1.1
-2.7
-1.1
4.3
-0.5
-1.8
-12.9
-9.0
-3.9
-2.8
-6.2
-8.2
-4.9
-9.2
-5.3
3.7
9.8
-4.8
-2.7
20.5
4.9
2.0
2.5
17.7
-0.9
0.2
3.7
1.0
-4.4
-15.2
-5.9
7.8
-4.7
12M (%)
-20.0
35.9
-1.7
29.7
-7.2
81.9
39.8
95.9
9.2
11.0
-9.8
30.7
51.5
-29.5
84.6
-16.1
59.9
-4.0
59.8
36.8
25.3
-3.8
41.5
13.6
21.4
78.6
44.1
28.1
-16.8
23.1
23.3
-23.8
29.9
3.1
13.8
9.0
-1.9
60.5
14.0
4.8
4.4
91.5
59.0
22.9
49.7
110.9
18.0
17.9
24.7
29.7
-0.1
-23.9
36.4
-12.1
-2.5
Company
Capital Goods
ABB
Bharat Elec.
BHEL
Blue Star
CG Cons. Elec.
CG Power & Inds Sol.
Cummins
GE T&D
Havells
K E C Intl
L&T
Pennar Eng.
Siemens
Solar Ind
Suzlon Energy
Thermax
Va Tech Wab.
Voltas
Cement
Ambuja Cem.
ACC
Birla Corp.
Dalmia Bharat
Grasim Inds.
India Cem
J K Cements
JK Lakshmi Ce
Ramco Cem
Orient Cem
Prism Cem
Shree Cem
Ultratech
Consumer
Asian Paints
Britannia
Colgate
Dabur
Emami
Godrej Cons.
GSK Cons.
HUL
ITC
Jyothy Lab
Marico
Nestle
Page Inds
Parag Milk
Pidilite Ind.
P&G Hygiene
Prabhat Dairy
United Brew
United Spirits
Healthcare
Alembic Phar
Alkem Lab
Ajanta Pharma
Aurobindo
Biocon
Cadila
Cipla
1 Day (%)
2.0
0.5
0.2
0.6
-0.3
5.4
-1.1
3.2
0.1
-0.8
-0.1
11.0
0.6
-0.4
1.2
0.4
1.4
0.5
2.0
1.6
-0.2
2.0
0.8
5.1
1.8
0.1
3.7
2.4
0.9
1.4
2.8
0.7
1.1
0.0
0.9
1.1
0.8
-0.4
0.5
-0.1
0.1
-0.4
2.4
1.6
0.2
0.6
-0.7
0.1
0.3
-0.3
-1.5
0.3
0.4
-0.7
0.6
0.8
-0.4
1M (%)
-5.8
7.4
-4.7
12.4
1.4
5.3
-3.9
10.9
0.3
1.8
-4.1
-2.2
-5.5
-0.8
-7.6
-1.9
-0.3
-3.6
1.5
-0.5
1.4
7.2
4.6
-6.1
1.2
-3.9
5.3
3.7
-7.6
0.0
0.5
4.2
8.9
3.4
1.7
-4.0
-3.5
-2.7
0.9
0.6
1.9
-3.5
4.9
12.2
-1.4
4.1
2.8
1.3
-1.2
-1.1
-4.8
-1.1
-10.3
2.6
-6.5
-4.0
-1.3
12M (%)
16.6
57.6
-4.0
52.2
24.8
4.5
-2.5
29.8
15.3
124.2
12.7
-32.8
2.3
36.8
3.5
7.8
10.1
33.8
2.0
8.1
48.3
59.5
53.0
22.4
30.4
-6.3
29.7
-21.7
-2.4
5.0
0.3
3.3
26.9
16.6
5.4
-4.8
18.5
-15.3
30.7
7.6
23.1
7.9
8.9
20.8
-26.3
20.8
27.2
40.5
-1.2
9.5
-18.7
10.3
-37.9
-4.5
9.9
32.7
-3.1
6 September 2017
28

MOSL Universe stock performance
Company
Divis Lab
Dr Reddy’s
Fortis Health
Glenmark
Granules
GSK Pharma
IPCA Labs
Jubilant Life
Lupin
Sanofi India
Shilpa Medicare
Strides Shasun
Sun Pharma
Syngene Intl
Torrent Pharma
Logistics
Allcargo Logistics
Blue Dart
Concor
Gateway Distriparks
Gati
Transport Corp.
Media
Dish TV
D B Corp
Den Net.
Ent.Network
Hind. Media
HT Media
Jagran Prak.
Music Broadcast
PVR
Siti Net.
Sun TV
Zee Ent.
Metals
Hindalco
Hind. Zinc
JSPL
JSW Steel
Nalco
NMDC
SAIL
Vedanta
Tata Steel
Oil & Gas
BPCL
GAIL
Gujarat Gas
Gujarat St. Pet.
HPCL
IOC
IGL
MRPL
Oil India
ONGC
PLNG
Reliance Ind.
Retail
Jubilant Food
Titan Co.
1 Day (%)
2.0
0.9
3.2
-0.1
1.3
0.8
1.2
1.6
-0.4
-0.8
2.1
1.3
-1.4
3.9
0.6
-0.6
0.1
2.4
-0.6
0.6
-0.2
0.7
0.9
-0.2
3.0
-0.4
1.5
-1.3
-0.5
-0.7
2.0
2.3
0.2
-0.4
1.8
0.4
0.5
0.3
0.3
0.2
0.5
0.8
1.5
-0.1
2.9
0.1
1.2
0.5
4.5
2.3
0.0
0.8
1.3
1.3
0.0
4.3
1M (%)
6.2
-1.6
-8.4
-12.4
-2.3
1.8
-8.6
0.9
-0.1
-5.8
-5.6
-8.2
-2.6
0.3
-3.9
-2.3
3.8
14.4
-18.3
-2.4
-5.6
1.6
-0.1
6.0
0.0
0.3
13.2
-0.1
4.0
-6.6
0.0
5.0
-4.0
7.5
6.5
1.2
12.2
7.1
7.9
1.1
9.9
13.1
4.3
0.1
9.4
1.9
11.6
3.4
11.5
6.6
8.6
-2.2
8.6
0.6
7.8
4.8
12M (%)
-45.0
-29.3
-13.8
-28.1
2.0
-18.0
-22.1
30.1
-34.6
-10.6
13.4
-1.7
-36.9
-1.7
-23.9
-9.1
-21.6
22.8
-19.1
-15.1
48.0
-14.8
-6.7
18.0
18.4
-4.3
15.8
-9.4
2.6
-24.8
75.6
-2.3
53.8
33.8
72.0
44.3
57.4
25.3
29.3
84.3
74.2
37.7
28.3
28.7
23.1
76.1
50.8
66.8
74.5
6.6
2.3
27.7
61.2
16.8
53.2
Company
Technology
Cyient
HCL Tech.
Hexaware
Infosys
KPIT Tech
L&T Infotech
Mindtree
Mphasis
NIIT Tech
Persistent Sys
Tata Elxsi
TCS
Tech Mah
Wipro
Zensar Tech
Telecom
Bharti Airtel
Bharti Infratel
Idea Cellular
Tata Comm
Utiltites
Coal India
CESC
JSW Energy
NTPC
Power Grid
Tata Power
Others
Arvind
Avenue Super.
Bata India
BSE
Castrol India
Century Ply.
Coromandel Intl
Delta Corp
Dynamatic Tech
Eveready Inds.
Interglobe
Indo Count
Info Edge
Inox Leisure
Jain Irrigation
Just Dial
Kaveri Seed
Kitex Garm.
Manpasand
MCX
Monsanto
Navneet Educat.
PI Inds.
Piramal Enterp.
SRF
S H Kelkar
Symphony
Trident
TTK Prestige
V-Guard
Wonderla
1 Day (%)
-0.2
0.1
2.0
0.0
-0.6
0.8
0.1
0.6
1.2
-0.2
1.1
0.8
2.7
-0.1
0.5
-2.2
-1.4
-2.7
1.0
3.0
1.3
0.9
0.8
-0.5
-0.4
0.6
5.9
0.8
0.1
-1.8
-3.0
2.9
0.0
0.5
0.5
-0.5
1.2
0.8
-0.2
7.3
1.1
0.7
-0.9
1.8
0.9
0.4
1.1
-1.0
0.6
1.9
0.4
0.2
1.1
0.0
3.7
-0.6
1M (%)
0.8
-3.5
9.0
-8.6
-5.8
-1.5
-3.4
1.6
2.4
-4.3
2.8
-1.8
4.6
2.7
0.8
-3.4
-8.4
-8.6
2.9
1.8
8.7
-1.2
-4.5
-4.0
-2.4
7.0
18.8
8.9
-9.0
-1.2
-7.8
-1.4
14.3
7.4
-0.5
-1.4
-18.2
-5.8
-1.2
1.9
9.4
-21.6
-0.8
4.0
-3.5
-2.8
4.3
-4.6
-7.9
0.9
-2.0
-7.6
13.5
-0.8
4.9
1.6
12M (%)
10.0
9.5
39.1
-12.6
-9.5
18.0
-17.2
8.7
28.8
-1.4
11.3
-1.4
-9.4
23.0
-23.7
27.4
8.2
0.8
27.7
-23.7
55.8
-12.0
6.0
17.7
-0.4
22.8
27.4
-15.1
6.5
65.7
27.7
-13.9
8.5
44.4
-27.9
15.4
-13.6
18.0
-19.6
67.2
-28.1
9.8
8.1
14.1
59.6
-14.8
49.2
-10.0
-24.3
11.9
90.2
29.7
44.3
-13.8
6 September 2017
29

NOTES
6 September 2017
30

THEMATIC/STRATEGY RESEARCH GALLERY

REPORT GALLERY
RECENT INITIATING COVERAGE REPORTS
Rs

DIFFERENTIATED PRODUCT GALLERY

Disclosures:
The following Disclosures are being made in compliance with the SEBI Research Analyst Regulations 2014 (herein after referred to as the Regulations).
Motilal Oswal Securities Ltd. (MOSL) is a SEBI Registered Research Analyst having registration no. INH000000412. MOSL, the Research Entity (RE) as defined in the Regulations, is engaged in the business of providing Stock
broking services, Investment Advisory Services, Depository participant services & distribution of various financial products. MOSL is a subsidiary company of Motilal Oswal Financial Service Ltd. (MOFSL). MOFSL is a listed
public company, the details in respect of which are available on
www.motilaloswal.com.
MOSL is registered with the Securities & Exchange Board of India (SEBI) and is a registered Trading Member with National Stock
Exchange of India Ltd. (NSE) and Bombay Stock Exchange Limited (BSE), Metropolitan Stock Exchange Of India Ltd. (MSE) for its stock broking activities & is Depository participant with Central Depository Services Limited
(CDSL) & National Securities Depository Limited (NSDL) and is member of Association of Mutual Funds of India (AMFI) for distribution of financial products. Details of associate entities of Motilal Oswal Securities Limited are
available on the website at
http://onlinereports.motilaloswal.com/Dormant/documents/Associate%20Details.pdf
Pending Regulatory Enquiries against Motilal Oswal Securities Limited by SEBI:
SEBI pursuant to a complaint from client Shri C.R. Mohanraj alleging unauthorized trading, issued a letter dated 29th April 2014 to MOSL notifying appointment of an Adjudicating Officer as per SEBI regulations to hold
inquiry and adjudge violation of SEBI Regulations; MOSL requested SEBI to provide all documents, records, investigation report relied upon by SEBI which were referred in Show Cause Notice and also sought personal
hearing. The matter is currently pending.
MOSL, it’s associates, Research Analyst or their relative may have any financial interest in the subject company. MOSL and/or its associates and/or Research Analyst may have beneficial ownership of 1% or more securities in
the subject company at the end of the month immediately preceding the date of publication of the Research Report.
MOSL and its associate company(ies), their directors and Research Analyst and their relatives may; (a) from
time to time, have a long or short position in, act as principal in, and buy or sell the securities or derivatives thereof of companies mentioned herein. (b) be engaged in any other transaction involving such securities and earn
brokerage or other compensation or act as a market maker in the financial instruments of the company(ies) discussed herein or act as an advisor or lender/borrower to such company(ies) or may have any other potential
conflict of interests with respect to any recommendation and other related information and opinions.; however the same shall have no bearing whatsoever on the specific recommendations made by the analyst(s), as the
recommendations made by the analyst(s) are completely independent of the views of the associates of MOSL even though there might exist an inherent conflict of interest in some of the stocks mentioned in the research
report.
Research Analyst may have served as director/officer, etc. in the subject company in the last 12 month period. MOSL and/or its associates may have received any compensation from the subject company in the past
12 months.
In the last 12 months period ending on the last day of the month immediately preceding the date of publication of this research report, MOSL or any of its associates may have:
a)
managed or co-managed public offering of securities from subject company of this research report,
b)
received compensation for investment banking or merchant banking or brokerage services from subject company of this research report,
c)
received compensation for products or services other than investment banking or merchant banking or brokerage services from the subject company of this research report.
d)
Subject Company may have been a client of MOSL or its associates during twelve months preceding the date of distribution of the research report.
MOSL and it’s associates have not received any compensation or other benefits from the subject company or third party in connection with the research report. To enhance transparency, MOSL has incorporated a Disclosure
of Interest Statement in this document. This should, however, not be treated as endorsement of the views expressed in the report. MOSL and / or its affiliates do and seek to do business including investment banking with
companies covered in its research reports. As a result, the recipients of this report should be aware that MOSL may have a potential conflict of interest that may affect the objectivity of this report. Compensation of Research
Analysts is not based on any specific merchant banking, investment banking or brokerage service transactions.
Terms & Conditions:
This report has been prepared by MOSL and is meant for sole use by the recipient and not for circulation. The report and information contained herein is strictly confidential and may not be altered in any way, transmitted to,
copied or distributed, in part or in whole, to any other person or to the media or reproduced in any form, without prior written consent of MOSL. The report is based on the facts, figures and information that are considered
true, correct, reliable and accurate. The intent of this report is not recommendatory in nature. The information is obtained from publicly available media or other sources believed to be reliable. Such information has not
been independently verified and no guaranty, representation of warranty, express or implied, is made as to its accuracy, completeness or correctness. All such information and opinions are subject to change without notice.
The report is prepared solely for informational purpose and does not constitute an offer document or solicitation of offer to buy or sell or subscribe for securities or other financial instruments for the clients. Though
disseminated to all the customers simultaneously, not all customers may receive this report at the same time. MOSL will not treat recipients as customers by virtue of their receiving this report.
Analyst Certification
The views expressed in this research report accurately reflect the personal views of the analyst(s) about the subject securities or issues, and no part of the compensation of the research analyst(s) was, is, or will be directly or
indirectly related to the specific recommendations and views expressed by research analyst(s) in this report.
Disclosure of Interest Statement
§
Analyst ownership of the stock
Companies where there is interest
No
A graph of daily closing prices of securities is available at
www.nseindia.com, www.bseindia.com.
Research Analyst views on Subject Company may vary based on Fundamental research and Technical Research. Proprietary
trading desk of MOSL or its associates maintains arm’s length distance with Research Team as all the activities are segregated from MOSL research activity and therefore it can have an independent view with regards to
subject company for which Research Team have expressed their views.
Regional Disclosures (outside India)
This report is not directed or intended for distribution to or use by any person or entity resident in a state, country or any jurisdiction, where such distribution, publication, availability or use would be contrary to law,
regulation or which would subject MOSL & its group companies to registration or licensing requirements within such jurisdictions.
For Hong Kong:
This report is distributed in Hong Kong by Motilal Oswal capital Markets (Hong Kong) Private Limited, a licensed corporation (CE AYY-301) licensed and regulated by the Hong Kong Securities and Futures Commission (SFC)
pursuant to the Securities and Futures Ordinance (Chapter 571 of the Laws of Hong Kong) “SFO”. As per SEBI (Research Analyst Regulations) 2014 Motilal Oswal Securities (SEBI Reg No. INH000000412) has an agreement with
Motilal Oswal capital Markets (Hong Kong) Private Limited for distribution of research report in Hong Kong. This report is intended for distribution only to “Professional Investors” as defined in Part I of Schedule 1 to SFO. Any
investment or investment activity to which this document relates is only available to professional investor and will be engaged only with professional investors.” Nothing here is an offer or solicitation of these securities,
products and services in any jurisdiction where their offer or sale is not qualified or exempt from registration. The Indian Analyst(s) who compile this report is/are not located in Hong Kong & are not conducting Research
Analysis in Hong Kong.
For U.S.
Motilal Oswal Securities Limited (MOSL) is not a registered broker - dealer under the U.S. Securities Exchange Act of 1934, as amended (the"1934 act") and under applicable state laws in the United States. In addition MOSL is
not a registered investment adviser under the U.S. Investment Advisers Act of 1940, as amended (the "Advisers Act" and together with the 1934 Act, the "Acts), and under applicable state laws in the United States.
Accordingly, in the absence of specific exemption under the Acts, any brokerage and investment services provided by MOSL, including the products and services described herein are not available to or intended for U.S.
persons. This report is intended for distribution only to "Major Institutional Investors" as defined by Rule 15a-6(b)(4) of the Exchange Act and interpretations thereof by SEC (henceforth referred to as "major institutional
investors"). This document must not be acted on or relied on by persons who are not major institutional investors. Any investment or investment activity to which this document relates is only available to major institutional
investors and will be engaged in only with major institutional investors. In reliance on the exemption from registration provided by Rule 15a-6 of the U.S. Securities Exchange Act of 1934, as amended (the "Exchange Act") and
interpretations thereof by the U.S. Securities and Exchange Commission ("SEC") in order to conduct business with Institutional Investors based in the U.S., MOSL has entered into a chaperoning agreement with a U.S.
registered broker-dealer, Motilal Oswal Securities International Private Limited. ("MOSIPL"). Any business interaction pursuant to this report will have to be executed within the provisions of this chaperoning agreement.
The Research Analysts contributing to the report may not be registered /qualified as research analyst with FINRA. Such research analyst may not be associated persons of the U.S. registered broker-dealer, MOSIPL, and
therefore, may not be subject to NASD rule 2711 and NYSE Rule 472 restrictions on communication with a subject company, public appearances and trading securities held by a research analyst account.
For Singapore
Motilal Oswal Capital Markets Singapore Pte Limited is acting as an exempt financial advisor under section 23(1)(f) of the Financial Advisers Act(FAA) read with regulation 17(1)(d) of the Financial Advisors Regulations and is a
subsidiary of Motilal Oswal Securities Limited in India. This research is distributed in Singapore by Motilal Oswal Capital Markets Singapore Pte Limited and it is only directed in Singapore to accredited investors, as defined in
the Financial Advisers Regulations and the Securities and Futures Act (Chapter 289), as amended from time to time. In respect of any matter arising from or in connection with the research you could contact the following
representatives of Motilal Oswal Capital Markets Singapore Pte Limited:
Disclaimer:
The report and information contained herein is strictly confidential and meant solely for the selected recipient and may not be altered in any way, transmitted to, copied or distributed, in part or in whole, to any other person
or to the media or reproduced in any form, without prior written consent. This report and information herein is solely for informational purpose and may not be used or considered as an offer document or solicitation of
offer to buy or sell or subscribe for securities or other financial instruments. Nothing in this report constitutes investment, legal, accounting and tax advice or a representation that any investment or strategy is suitable or
appropriate to your specific circumstances. The securities discussed and opinions expressed in this report may not be suitable for all investors, who must make their own investment decisions, based on their own investment
objectives, financial positions and needs of specific recipient. This may not be taken in substitution for the exercise of independent judgment by any recipient. Each recipient of this document should make such investigations
as it deems necessary to arrive at an independent evaluation of an investment in the securities of companies referred to in this document (including the merits and risks involved), and should consult its own advisors to
determine the merits and risks of such an investment. The investment discussed or views expressed may not be suitable for all investors. Certain transactions -including those involving futures, options, another derivative
products as well as non-investment grade securities - involve substantial risk and are not suitable for all investors. No representation or warranty, express or implied, is made as to the accuracy, completeness or fairness of
the information and opinions contained in this document. The Disclosures of Interest Statement incorporated in this document is provided solely to enhance the transparency and should not be treated as endorsement of the
views expressed in the report. This information is subject to change without any prior notice. The Company reserves the right to make modifications and alternations to this statement as may be required from time to time
without any prior approval. MOSL, its associates, their directors and the employees may from time to time, effect or have effected an own account transaction in, or deal as principal or agent in or for the securities
mentioned in this document. They may perform or seek to perform investment banking or other services for, or solicit investment banking or other business from, any company referred to in this report. Each of these entities
functions as a separate, distinct and independent of each other. The recipient should take this into account before interpreting the document. This report has been prepared on the basis of information that is already
available in publicly accessible media or developed through analysis of MOSL. The views expressed are those of the analyst, and the Company may or may not subscribe to all the views expressed therein. This document is
being supplied to you solely for your information and may not be reproduced, redistributed or passed on, directly or indirectly, to any other person or published, copied, in whole or in part, for any purpose. This report is not
directed or intended for distribution to, or use by, any person or entity who is a citizen or resident of or located in any locality, state, country or other jurisdiction, where such distribution, publication, availability or use would
be contrary to law, regulation or which would subject MOSL to any registration or licensing requirement within such jurisdiction. The securities described herein may or may not be eligible for sale in all jurisdictions or to
certain category of investors. Persons in whose possession this document may come are required to inform themselves of and to observe such restriction. Neither the Firm, not its directors, employees, agents or
representatives shall be liable for any damages whether direct or indirect, incidental, special or consequential including lost revenue or lost profits that may arise from or in connection with the use of the information.
The
person accessing this information specifically agrees to exempt MOSL or any of its affiliates or employees from, any and all responsibility/liability arising from such misuse and agrees not to hold MOSL or any of its affiliates or
employees responsible for any such misuse and further agrees to hold MOSL or any of its affiliates or employees free and harmless from all losses, costs, damages, expenses that may be suffered by the person accessing this
information due to any errors and delays.
Registered Office Address: Motilal Oswal Tower, Rahimtullah Sayani Road, Opposite Parel ST Depot, Prabhadevi, Mumbai-400025; Tel No.: 022-3980 4263; www.motilaloswal.com. Correspondence Address: Palm Spring
Centre, 2nd Floor, Palm Court Complex, New Link Road, Malad (West), Mumbai- 400 064. Tel No: 022 3080 1000. Compliance Officer: Neeraj Agarwal, Email Id:
na@motilaloswal.com,
Contact No.:022-30801085.
Registration details of group entities.: MOSL: NSE (Cash): INB231041238; NSE (F&O): INF231041238; NSE (CD): INE231041238; BSE (Cash): INB011041257; BSE(F&O): INF011041257; BSE(CD); MSE(Cash): INB261041231;
MSE(F&O): INF261041231; MSE(CD): INE261041231; CDSL: IN-DP-16-2015; NSDL: IN-DP-NSDL-152-2000; Research Analyst: INH000000412. AMFI: ARN 17397. Investment Adviser: INA000007100. Motilal Oswal Asset
Management Company Ltd. (MOAMC): PMS (Registration No.: INP000000670) offers PMS and Mutual Funds products. Motilal Oswal Wealth Management Ltd. (MOWML): PMS (Registration No.: INP000004409) offers wealth
management solutions. *Motilal Oswal Securities Ltd. is a distributor of Mutual Funds, PMS, Fixed Deposit, Bond, NCDs, Insurance and IPO products. * Motilal Oswal Commodities Broker Pvt. Ltd. offers Commodities
Products. * Motilal Oswal Real Estate Investment Advisors II Pvt. Ltd. offers Real Estate products. * Motilal Oswal Private Equity Investment Advisors Pvt. Ltd. offers Private Equity products
13 December 2016
24