21 September 2017
India Strategy
BSE Sensex: 32,401
S&P CNX: 10,141
Sectoral weights in Nifty: A journey down the memory lane
Financials lord over the indices; set to gain further strength
Over the years, the sectoral representation in Nifty-50 has undergone a sea change, in
consonance with the changes in the underlying economy – new sectors have evolved,
while some of the erstwhile dominant sectors of the economy have lost relative
importance in the new India.
In this report, we take a deep dive to understand how the weights of various
sectors/companies in Nifty-50 have changed in the last 15 years.
Index moving to free float basis
have boosted weight of Pvt.
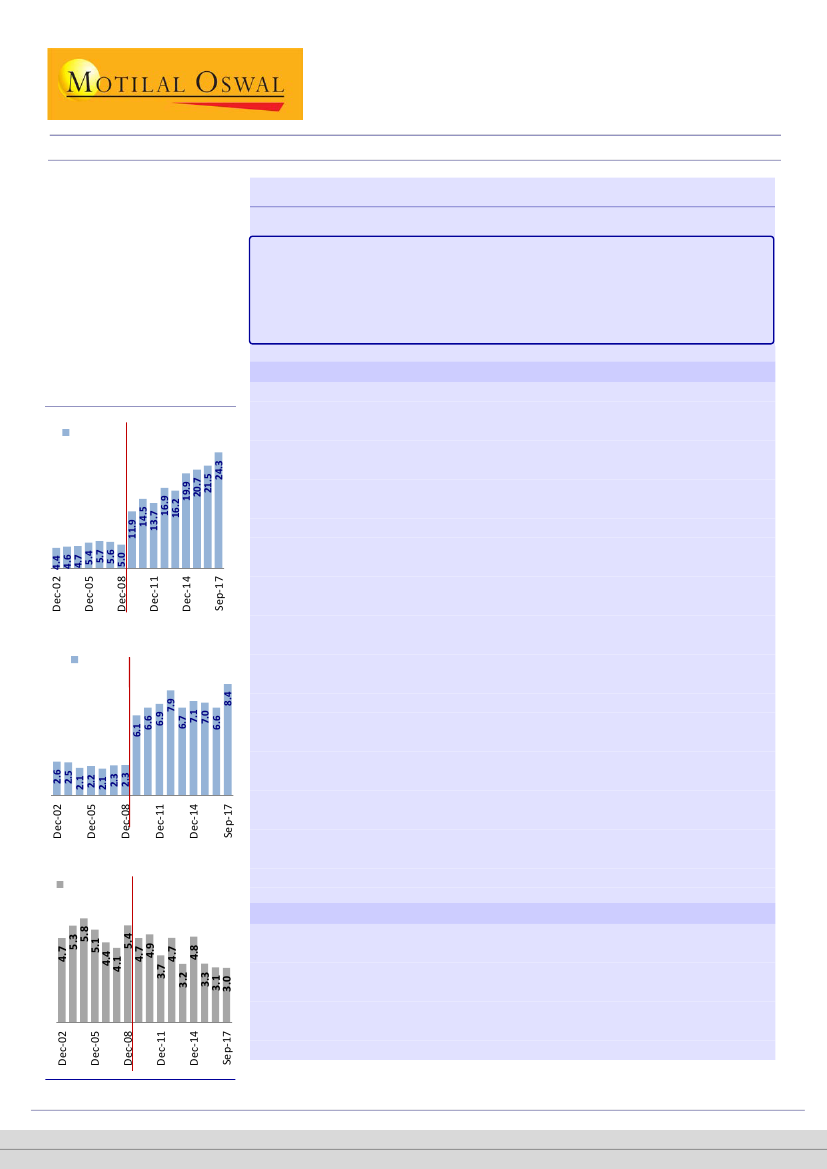
Financials
Banks-PVT
Free float weight
from 2009
BFSI and Oil account for almost half of the index
NBFC
Free float weight
from 2009
Banks-PSU
Free float weight
from 2009
The weight of Financials has seen a secular rise in the benchmark indices. BFSI
now contributes 35.6% (+3.1x in 15 years) of Nifty-50. The share of Private
Banks/NBFC in the index has gone up, led by
a) better earnings performance,
coupled with capital raising from the markets (this boosted the free float of
Financials), b) sub-par earnings growth witnessed in other sections of the
market over the last eight years and c) index moving to a free float basis from
June 2009.
As more Insurance companies are listed and the relevance of NBFCs goes up
(given the wider financialization of savings and broad-basing of financial
disintermediation), we expect the weight of BFSI to inch up further.
We note that 15 years back, PSU Banks’ weight (4.7%) was higher than Private
Banks (4.4%) in the index, with SBI alone contributing 4.4% of Nifty-50. Today,
at 24.3%, Private Banks have the highest weight in Nifty-50, while PSU Banks
have just 3% weight. HDFC Bank, at 9.8%, is the highest weighted stock today,
much higher than 1.8% 15 years back.
Six out of the nine BFSI companies in Nifty-50 today are private banks. In India,
there are 22 listed PSU banks and only 17 listed private banks. This is
significantly different from how things were 15 years back in Nifty-50 – five BFSI
companies, of which only two were private banks. Notably, of the 19 listed
private banks in December 2002, eight have merged till-date.
Weight of Oil & Gas in the index has fluctuated significantly over the last 15
years, in line with the underlying volatile earnings stream of the sector. The
sector weight was at 17.6% around 15 years back. However, with the inclusion
of ONGC, it gradually climbed to the 1
st
position a decade ago to 25.4%. The
sector’s weight has been stable at ~11-12% over the last five years with
moderation in earnings growth.
Out of the 50 stocks in Nifty, 22 have been part of the index since 15 years. Of
these 22, three each are from Technology and Auto (they have been in the
index for 15 years now). Private Banks, Consumer, Oil & Gas, Metals,
Healthcare and Cement have two stocks each, while NBFC, Capital Goods, PSU
Banks and Utilities have one stock in the index.
Combined weight of these 22 stocks declined to 62.7% v/s 75.3% 15 years back,
but is up from 44.3% as of December 2007.
44% of Nifty-50 constituents unchanged over 15 years
Gautam Duggad – Research Analyst
(Gautam.Duggad@MotilalOswal.com); +91 22 3982 5404
Deven
2017
– Research Analyst
(Deven@MotilalOswal.com); +91 22 3982 5440
June
Mistry
Motilal Oswal research is available on www.motilaloswal.com/Institutional-Equities, Bloomberg, Thomson Reuters, Factset and S&P Capital.
Investors are advised to refer through important disclosures made at the last page of the Research Report.
1