10 October 2017
Market snapshot
Equities - India
Close
Chg .%
Sensex
31,847
0.1
Nifty-50
9,989
0.1
Nifty-M 100
18,524
0.0
Equities-Global
Close
Chg .%
S&P 500
2,545
-0.2
Nasdaq
6,580
-0.2
FTSE 100
7,508
-0.2
DAX
12,976
0.2
Hang Seng
11,385
-0.6
Nikkei 225
20,691
0.0
Commodities
Close
Chg .%
Brent (US$/Bbl)
56
0.1
Gold ($/OZ)
1,283
1.1
Cu (US$/MT)
6,615
0.0
Almn (US$/MT)
2,150
0.9
Currency
Close
Chg .%
USD/INR
65.4
0.1
USD/EUR
1.2
0.3
USD/JPY
113.0
113.0
YIELD (%)
Close
1MChg
10 Yrs G-Sec
6.8
0.0
10 Yrs AAA Corp
7.7
0.0
Flows (USD b)
9-Oct
MTD
FIIs
-0.1
-0.5
DIIs
0.0
0.6
Volumes (INRb)
9-Oct
MTD*
Cash
282
287
F&O
3,719
4,992
Note: YTD is calendar year, *Avg
YTD.%
19.6
22.0
29.1
YTD.%
13.7
22.2
5.1
13.0
21.2
8.2
YTD.%
0.5
10.6
19.8
26.2
YTD.%
-3.6
11.4
-3.5
YTDchg
0.3
0.1
YTD
4.7
10.4
YTD*
293
5,412
Today’s top research idea
Tata Steel: Site visit to Jamshedpur and Kalinganagar
A benchmark in operational excellence, sustainability and CSR
We visited Tata Steel’s (TATA) highly profitable 10mtpa plant at Jamshedpur
(JSR), recently commissioned new greenfield 3mtpa plant at Kalinganagar (KPO)
and also met top management.
JSR is a benchmark in operational excellence, sustainability and corporate social
responsibility. It has a rich product mix and has continuously worked toward
branding of its products and retailing, which has helped in de-commoditizing
nearly 50% of revenue. JSR will increase production by 1mtpa over three years
through asset sweating and debottlenecking.
KPO is likely to announce 3-5mtpa expansion in CY17. TATA is also evaluating
inorganic growth to double its capacity in India to 26mtpa in five years. KPO will
be a key growth driver as new projects are attractive. Maintain Neutral.
Research covered
Cos/Sector
Tata Steel
InterGlobe Aviation (ART)
Financials - MCLR
Zee Entertainment
Oil & Gas | Preview 2QFY18
Auto | Preview 2QFY18
Metals Weekly
Key Highlights
Site visit to Jamshedpur and Kalinganagar
High dividend payout; Equity dilution continues
RBI reviews working of MCLR
Acquires 9X Media, expands music portfolio
GRMs up YoY/QoQ; crude prices up YoY/QoQ
Regulatory impact waning – retail improving gradually
India steel exports rise 71% YoY to 1.1mt in September
Piping hot news
September commercial vehicles' sales rise fastest in 6 years, hint at economy
rebound
India’s commercial vehicles sales in September rose at the fastest pace in
nearly six years, suggesting a recovery in the economy…
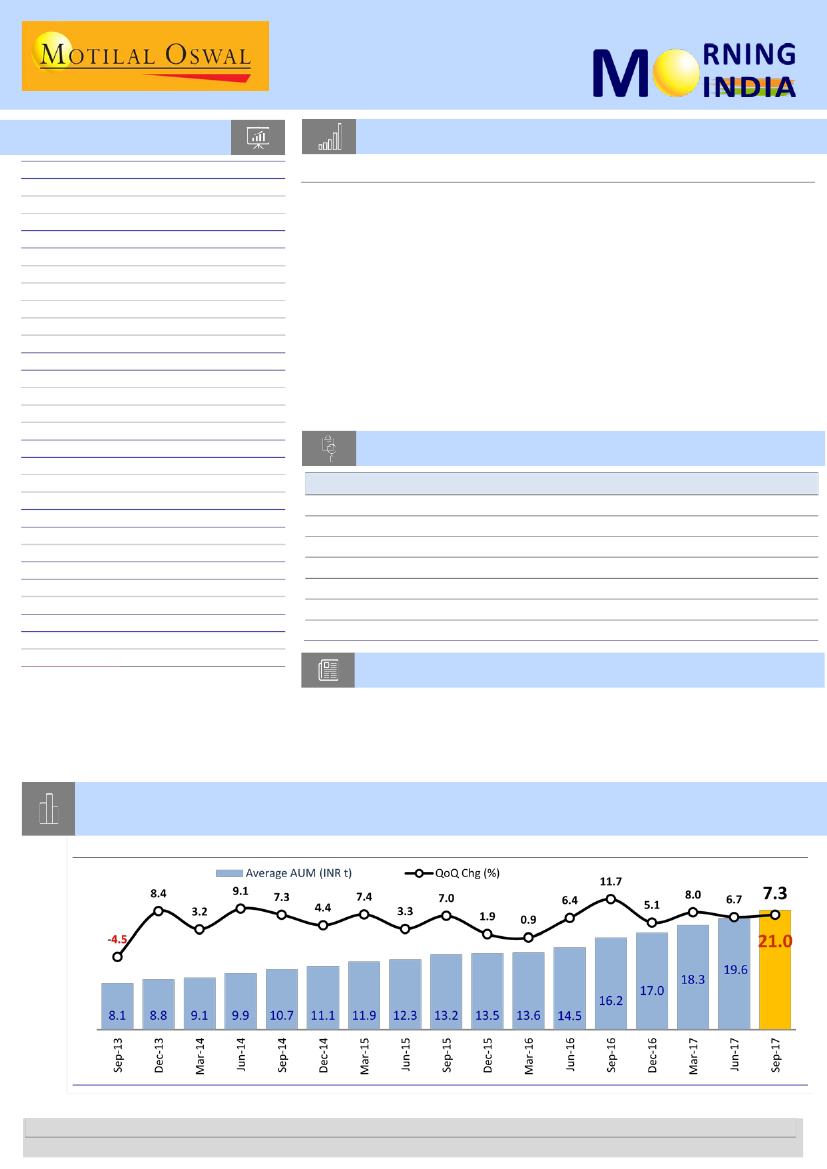
Chart of the Day: MF industry grows for 16th consecutive quarter in 3QCY17; AUM
up 7.3% QoQ to new high of INR21t
Trend in quarterly average AUM
Research Team (Gautam.Duggad@MotilalOswal.com)
Motilal Oswal research is available on www.motilaloswal.com/Institutional-Equities, Bloomberg, Thomson Reuters, Factset and S&P Capital.
Investors are advised to refer through important disclosures made at the last page of the Research Report.

In the news today
Kindly click on textbox for the detailed news link
1
Saudi Aramco sets sight on
India's downstream sector,
plans mega investment
The world’s biggest oil producer,
Saudi Aramco, on Monday said it
would invest in the downstream
oil and gas sector of India through
a joint venture…
2
World Bank reduces India GDP growth forecast to 7% for 2017-18
After remaining the world’s fastest-growing region for eight consecutive
quarters, South Asia has slipped to the third position behind East Asia and
the Pacific regions, as India’s economy slowed to its lowest level in 13
quarters, the World Bank said on Monday. This is at a time when other
South Asian nations like Bangladesh and Nepal have registered strong
economic growth…
3
Disqualification of directors
hits 500 listed companies
Stock exchanges have sent notices
to listed companies that share
directors who have been
disqualified for associating with
other firms which haven’t filed
their financial statements or
annual returns for three years…
4
27% jump in launch of
affordable houses this year
There has been a 27 per cent jump
in the launch of new affordable
housing units in the first nine
months of the year compared to
the corresponding period last
year, says a new study. The study
was done in the top eight cities of
the country…
5
Govt set to bar homeopathy
doctors from selling drugs
Homeopathy doctors will soon be
barred from selling medicines
from the premises they are
practising in, according to new
rules proposed by the government
that are to be notified soon. “No
registered homeopathic medical
practitioner who is practicing
homeopathy in the premises
where homeopathy medicines are
sold, shall deal in homeopathic
medicines,” according to the new
draft rules…
6
Over 4,250 manufacturing units
located in the north-eastern and
Himalayan States are to get a
Diwali gift from the Centre. The
Government will, according to a
scheme framed by the
Department of Industrial Policy
and Promotion…
7
Coal stocks run low at 23
power plants: CEA data
Coal stocks at power plants
continue to be low at a fifth of the
monitored power plants, giving an
opportunity to gas-based projects
to operate. Data available with the
Central Electricity Authority
showed that 23 of the 114 plants
had low coal stocks…
Centre to compensate units
that lost excise-exempt status,
post GST
10 October 2017
2

9 October 2017
Company Update | Sector: Metals
Tata Steel
Neutral
BSE SENSEX
31,847
S&P CNX
9,989
CMP: INR697
TP: INR665(-5%)
Site visit to Jamshedpur and Kalinganagar
A benchmark in operational excellence, sustainability and CSR
Stock Info
Bloomberg
Equity Shares (m)
52-Week Range (INR)
1, 6, 12 Rel. Per (%)
M.Cap. (INR b)
M.Cap. (USD b)
Avg Val ( INRm)/Vol m
Free float (%)
TATA IN
971
704 / 366
6/36/58
677.1
10.4
3059
68.7
Financials Snapshot (INR b)
Y/E Mar
2017 2018E 2019E
Net Sales
1,123 1,255 1,254
EBITDA
170
211
202
PAT
37
65
62
EPS (INR)
37.9
66.9
63.4
Gr. (%)
394.2
76.5
-5.3
BV/Sh (INR)
330
373
426
RoE (%)
15.7
19.1
15.9
RoCE (%)
9.4
11.6
10.3
P/E (x)
18.4
10.4
11.0
P/BV (x)
2.1
1.9
1.6
Shareholding pattern (%)
As On
Promoter
DII
FII
Others
Jun-17 Mar-17 Jun-16
31.4
30.3
13.7
24.6
31.4
30.6
14.1
23.9
31.4
27.2
13.3
28.2
FII Includes depository receipts
Stock Performance (1-year)
Tata Steel
Sensex - Rebased
690
580
470
360
250
We visited Tata Steel’s (TATA) flagship, highly profitable 10mtpa steel plant at
Jamshedpur, Jharkhand (JSR), recently commissioned new greenfield 3mtpa steel
plant at Kalinganagar, Odisha (KPO) and also met top management during 3-6
October 2017. Key takeaways:
After plugging the cash leakage at Tata Steel Europe (TSE), TATA is now looking
to double its capacity to 26mtpa in India through both organic and inorganic
routes.
TATA has a lion’s share in the most lucrative auto segment at 44%. Autos
comprised 19% of its product mix in FY17. The new hot strip mill (HSM) at KPO
can produce all sizes, grade in tight tolerances, which are required by the highly
demanding auto customers.
TATA has continuously worked to create various brands and retail supply chain.
Branded products now comprise of 50% of JSR’s revenue.
JSR has 10mtpa capacity in a compact area of 1,700 acres. The blast furnaces
operate at high operating efficiencies and at the lowest coke rate of 320kg. It
has state-of-the-art downstream facilities to produce 2.3mtpa products. JSR is
expected to increase steel production by 1mt over three years through
debottlenecking.
KPO’s phase-I with 3mtpa capacity was commissioned in FY17. KPO’s area is
twice that of JSR, and it has created infrastructure for 6mtpa. There will be
material savings in infrastructure and HSM during phase-II expansion.
However, additional capex would be needed in the downstream cold rolling
mills. Management is likely to announce 3-5mtpa expansion in CY17.
TATA has been investing heavily on sustainability, driven by the vision of its
founder. JSR has invested INR25b in the past 10 years on improving the
environment. Some of the achievements in this area are:
Specific dust emission has reduced by 50% in the last four years.
Specific water consumption has reduced by 31% in the last four years.
Specific CO2 emission intensity has reduced by 27%.
TATA has been responsibly discharging its duties toward the society. Some of
its initiatives have helped in reducing infant mortality by 39%, making 1,052
villages child-labor-free, building 30 schools in rural Odisha, etc.
TATA’s expansion projects will increase its Indian capacities by 4-6mtpa to 17-
19mtpa over the next 3-4 years. It is also evaluating value-accretive inorganic
opportunities, which are arising under the Indian bankruptcy code.
We believe that TATA has finally achieved a major milestone by plugging the
cash flow leakages at TSE. The operating environment too is improving on
consolidation and anti-dumping actions against cheaper imports. The Indian
business is benefitting from the strong international market and retail reach.
TATA will pursue growth instead of de-leveraging, as the new projects in India
are attractive. Both Odisha and Jharkhand may raise additional demand toward
past iron ore mining. We value the stock at INR665/share based on SOTP.
Maintain
Neutral.
10 October 2017
3

9 October 2017
A
nnual
R
eport
T
hreadbare
INTERGLOBE AVIATION FY17
INDIGO’s FY17 annual report highlights PBT declining 24% to INR21.4b
due to weak operating performance. PBT was, however, supported by
higher other income at INR7.9b, 37%of PBT). Further, deferred incentive
recognized increased to INR5.3b (FY16:INR3.6b).Operating cash flow
improved to INR37.7b (FY16: INR30.0b) due to rise in supplementary rent
payables by INR8.3b and incentives on aircraft acquisition by INR7.1b.
Sale (at INR6.1b) and lease back of aircraft acquired from IPO proceeds
helped FCF to remain high at INR41.4b (FY16: INR28.5b). Dividend payout
ratio remained high at 89.2% (FY16: 99.7%). In FY18, INDIGO raised
INR25.3b by diluting 6% of the equity to pursue change in its business
strategy to owning more aircraft. This could impact dividend payouts and
return ratios. Net unhedged forex exposure was high at INR57.0b (1.5x of
NW). Non-core assets at INR93.4b (2.4x of NW) led to RoCE of 21.4%
despite high RoIC of 70.0%.
The
ART
of annual report analysis
Other income stood high
at INR7.9b (37% of PBT)
Deferred incentives
recognized increased to
INR5.3b (25% of PBT)
Rising supplementary rents and incentives
boost cash flows by INR15.4b
Aircraft acquired via IPO proceeds, sold and
lease back at INR6.1b
Auditor’s name
B S R & Co LLP
Statutory
Declining yield, rising fuel costs impact EBITDA:
INDIGO’s yield
declined 10% to INR3.5 leading to fall in revenue per available seat
kilometer (RASK); while, the load factor increased 100bps to 85%.
Rising crude oil prices led to increase in aircraft fuel expenses to
INR63.4b,34% of revenue (FY16:INR47.8b,30% of revenue). EBITDA
declined 31% to INR21.4b. Profitability was, however, supported
by recognition higher other income at INR7.9b (FY16:INR5.2b).
Further, deferred incentives recognized increased to INR5.3b
(FY16:INR3.6b).
Rising supplementary rents and incentives boost cash flows:
Contribution of working capital changes to OCF increased to
INR21.1b (FY16: INR3.1b), boosting OCF to INR37.7b. Increased
deferred incentives, supplementary rent payables and forward
sales added INR18.6b to OCF. In the last five years, incentives and
net supplementary rent payables contributed INR12.7b and
INR29.3b, respectively to operating cash flows.
High dividend payout; equity dilution to acquire aircrafts:
INDIGO
has consistently maintained its dividend payout (at 80-100%). The
company has declared dividend of INR14.8b (FY16:INR19.8b)
including dividend tax. Also, it has raised INR12.1b through an IPO
in FY16 (5% dilution) and INR25.3b through a QIP in FY18 (6%
dilution) for the acquisition of aircrafts.
Low R&M and S&D cost a differentiator; may increase:
Short-term
lease of six years and single kind of aircraft in its fleet helped
INDIGO to gain an edge over peers in terms of repair and
maintenance (R&M) expenses. Though 200bp higher for FY17,
INDIGO’s R&M was INR6.9b – 4% of revenue, still the lowest
among peers. Also, its S&D cost at INR1.2b (1% of revenue) are
lowest amongst peers, due to low cost of global distribution
system. Owning of aircraft, introduction of ATR fleet, and foray
into long-haul international operations could increase these costs.
10 October 2017
Stock Info
Bloomberg
CMP (INR)
Equity Shares (m)
52-Week Range (INR)
M.Cap. (INR b)/(USD b)
1,6,12 Rel. Perf. (%)
INDIGO IN
1,107
383.9
1346/807
422.3/6.3
-12/0/5
Jun-17
85.9
1.6
6.4
6.1
Sep-16
85.9
1.6
5.9
6.6
Shareholding pattern (%)
As on
Promoter
DII
FII
Others
Sep-17
85.9
2.8
5.8
5.5
Stock Performance (1-year)
4

Sector Update | 10 October 2017
Financials - Banks
RBI reviews working of MCLR
The unsatiated desire for perfect lending rate regime
RBI reviews working of MCLR – earnings/margin volatility to increase
The RBI working group has found monetary policy transmission to be inadequate
under the current MCLR/base rate regime. This is more so in the case of outstanding
loans, wherein the longer reset period and the discretionary spreads being charged
by banks have prevented proper pass-through of reduction in lending rates. Besides,
the computation of base rate and MCLR has also been found to be inconsistent
among banks thus putting borrowers at a disadvantage. The group also highlighted
that monetary transmission remains asymmetric over the monetary policy cycles –
higher during the tightening phase and lower during the easing phase, irrespective
of the interest rate methodology being followed. The working group has thus
suggested that banks need to move to one of the following external benchmarks –
(i) T-Bill rate, (ii) CD rate and (iii) repo rate to price their loans, after due
consultation with the RBI and other stakeholders. Also, the group suggested that
the external benchmark should be adopted from 1 April 2018, and thereafter, all
existing loans (BPLR/base rate/MCLR) should be moved to the new benchmark
within one year (i.e. by March 2019).
Our view:
We believe that the migration to the suggested methodology will bring in
more volatility to spreads/profitability of banks across cycles as they transparently
pass on the revised lending rates to the borrowers. Thus, banks’ margins will likely
expand during monetary tightening cycle and vice versa. We believe that in order to
protect profitability across cycles, banks – particularly private banks –will work
toward faster repricing of deposits, which the retail depositors will need to adjust
to. This may result in higher volatility in margins, particularly for retail banks, as they
have higher share of fixed rate assets and CASA deposits. We further note that such
a migration will also have an impact on the strategy of a bank, as by benchmarking
the lending rate to an external variable, the regulator will essentially delineate the
asset and liability profile of a bank. We note that there have been several banks that
have planned for an adequate liability franchise before rolling out the retail asset
products. The suggested migration may take away the interest rate stickiness of
even SA deposits, and thus, may require further strategy deliberations on building
retail franchise by these banks.
Weighted-average lending rate
for private banks has declined
the most
Public Private
Period
Jan 15 to Jun 17
Pre-Demon
(Jan 15 to Oct 16)
Post-Demon
(Nov 16 to Jun 17)
Sector
Banks
-1.09
-0.7
Sector
Banks
-1.52
-1
-0.39
-0.52
Source:
RBI,
MOSL
Over Apr-16 to Jun-17, the
spread on outstanding loans
has increased the most for
PSBs
Period
Apr-Dec 16
Jan 17
Feb - Jun 17
Apr16 - Jun 17
Public Private
Sector Sector
Banks Banks
11
-1
58
16
-23
-32
46
-17
Source:
RBI,
MOSL
10 October 2017
5

Exhibit 1: Credit pricing methodologies introduced by the RBI and their shortcomings
Credit pricing
methodology
PLR
Announced /
Intent
Introduced in
RBI deregulated lending rates in 1994 for credit limits
over Rs0.2mn and asked banks to declare their prime
lending rates (PLR) - interest rate charged for
Oct-94
the most creditworthy borrowers. PLR was expected to
act as a floor for lending above Rs0.2m.
Shortcomings
(i) Both the PLR and the spread
charged over the PLR varied widely across banks,
and, (ii) PLRs of banks were rigid and did not reflect
the movement in policy rates.
BPLR
Apr-03
Base rate
Jul-10
MCLR
Apr-16
Sub-BPLR lending became dominant (77% of loan
book was sub-BPLR in 2008) and impeded monetary
To improve transparency and ensure appropriate pricing
transmission, especially in a declining rate
of loans RBI introduced BPLR, which was supposed to be
environment. Besides, housing loans and the
used as a reference rate.
consumer durable loans were outside the purview
of the BPLR.
Flexibility in determination of funding cost (average,
The base rate was linked to the banks cost of funds and
marginal or blended cost) caused opacity in the
was supposed to act as the floor rate for all loans except
computation of base rate and made the assessment
for some specific categories. This was thus expected to
of monetary transmission difficult. Also, the
facilitate better pricing of loans and enhance
discretion in charging of spreads impacted
transparency in lending rates.
monetary transmission
The lending rate was linked to the marginal cost of
High reset period and discretionary spreads being
funds for banks. MCLR review was supposed to be done charged by banks prevented the desired monetary
every month (quarterly in case of base rate) while reset transmission. Monetary transmission on existing
period can be maximum of one year for floating rate
loans has been found to be inadequate even as
loans (no such limit in base rate methodology)
MCLR has been significantly revised lower by banks
Source: MOSL, RBI
10 October 2017
6

Zee Entertainment
BSE SENSEX
31,814
S&P CNX
9,980
9 October 2017
Company Update | Sector: Media
CMP: INR523
TP: INR630 (+20%)
Buy
Acquires 9X Media, expands music portfolio
Additional channels to contribute 5% of domestic ad revenue
Bloomberg
Equity Shares (m)
M.Cap.(INR b)/(USD b)
52-Week Range (INR)
1, 6, 12 Rel. Per (%)
Avg Val, INRm
Free float (%)
Zee announced the acquisition of 9X Media’s six music channels for INR1.6b, which
will be paid in cash. These six channels across four languages – 9XM (Latest
Financials & Valuations (INR b)
Bollywood), 9X Jalwa (Evergreen Hindi), 9X Jhakaas (Marathi), 9X Tashan (Punjabi),
Y/E MARCH
2017 2018E 2019E
9XO (English), and 9X Bajao (Hindi Classics) – will allow Zee to expand its portfolio
Net Sales
64.3
64.6
75.9
from the current 33 channels to 39 channels.
EBITDA
Adj. NP
Adj. EPS (INR)
EPS Gr. (%)
BV/Share (INR)
RoE (%)
RoCE (%)
Div. Payout (%)
Valuations
P/E (x)
P/BV (x)
EV/EBITDA (x)
Div. Yield (%)
19.3
14.5
13.9
80.7
89.2
19.3
20.7
13.0
37.4
5.8
24.5
0.5
20.3
13.1
12.2
-12.4
95.4
14.7
15.7
22.7
42.6
5.4
22.8
0.5
26.9
18.2
17.8
46.4
106.8
18.7
19.5
19.0
29.1
4.9
16.9
0.6
Z IN
960.5
497.9 / 7.8
575/429
0/-12/-19
1087.0
56.9
Zee has acquired 9X Media’s six music channels for INR1.6b (1x FY17 sales).
9X Media holds ~26% share in the music ad market.
The acquisition allows Zee to widen its TV portfolio and also provides channels to
market its own music/movie production.
We maintain our Buy recommendation for Zee, with a TP of INR630.
Has acquired 9X Media’s six music channels for INR1.6b in cash
Acquired portfolio to contribute 5% of domestic ad revenue
9X Media’s FY17 revenue at INR1.6b is equivalent to 5% of Zee’s domestic ad
revenue and 2% of its consolidated revenue. At the EBITDA level, 9X Media had a
loss of INR51m in FY17. EBITDA margin was 7% in FY16, which turned negative to -
3% in FY17. Over the next 2-3 years, revenue growth coupled with cost synergies
should drive margin accretion.
Benefits for Zee
Shareholding pattern (%)
As On
Jun-17 Mar-17 Jun-16
Promoter
43.1
43.1
43.1
DII
5.7
4.5
3.8
FII
44.7
46.4
48.1
Others
6.6
6.1
5.0
FII Includes depository receipts
Stock Performance (1-year)
Zee Entertainmen
Sensex - Rebased
700
625
550
475
400
1. Deeper inroads to music genre:
Music is 3% of the total TV market, with about
INR6b industry size. 9X Media holds a sizeable ~26% revenue market share. Zee
already has presence in the music genre through Zetc channel, but 9X Media
should allow it to expand reach significantly with a dual brand strategy. It
should also allow it to widen its target market through regional music, with
foray into the Punjabi market.
2. Wider marketing channel for own music/movie production:
These channels
will complement Zee’s music label and movie production business. Currently,
the music production business may be a miniscule 2-3% of total revenue. 9X
Media’s strong distribution will support Zee’s own music and movie production
reach, supporting management guidance of healthy revenue contribution from
movie/music business over the next 3-5 years.
Expect healthy growth; remain positive with TP of INR630
The low revenue/EBITDA contribution does not change our earnings estimates. We
maintain our adjusted EPS estimates of INR12/18 for FY18/19, with CAGR of 13%
over FY17-19. We believe Zee’s efforts to (a) widen TV genre/language presence,
and (b) increased focus on movie/music production and events business should
allow it to sustain healthy earnings growth over the next 3-5 years. RoE of ~20% by
FY19-20 should support healthy valuations.
Buy
with a TP of INR630.
10 October 2017
7

September 2017 Results Preview | Sector: Oil & Gas
Oil & Gas
Company name
BPCL
GAIL
Gujarat Gas
Gujarat State Petronet
HPCL
Indraprastha Gas
IOC
MRPL
Oil India
ONGC
Petronet LNG
Reliance Industries
GRMs up YoY/QoQ; crude prices up YoY/QoQ
Inventory gains to boost refiners’ earnings
Singapore complex GRM was USD8.3/bbl in 2QFY18 v/s USD6.4/bbl in 1QFY18 and
USD5.1/bbl in 2QFY17. Inventory gains are likely to boost earnings further.
Average Brent crude price was up 13% YoY and 3% QoQ to USD51.5/bbl. While the
YoY/QoQ increase would benefit upstream companies, we expect lower operating
costs to further help them. ONGC and Oil India should see YoY EBITDA increase.
RIL is expected to clock a GRM of USD12.6/bbl, led by strong benchmark (premium of
USD4.3/bbl). Petchem segment would do better despite decline in HDPE and LDPE
delta, with RIL being an integrated player and strong volume growth in the segment.
Brent up 13% YoY and 3% QoQ; upstream subsidy nil in 2QFY18
Brent crude increased, primarily due to Hurricane Harvey. The average for the
quarter was up 13% YoY (3% QoQ) at USD51.5/bbl. OMCs are likely to post
inventory gains for the quarter.
We do not build any net under-recovery either for the OMCs or for the
upstream companies.
GRM at USD8.3/bbl, up from USD5.1/bbl in 2QFY17
Reuters Singapore Complex GRM was up 62% YoY (29% QoQ), led by ~25%
refinery outages on US Gulf Coast due to Hurricane Harvey.
PE, PP and PVC delta declined sequentially. While POY spread declined, PSF
spread was flattish sequentially. RIL being an integrated player is less likely to
be affected by lower petchem deltas sequentially.
Exhibit 1:
Expected quarterly performance summary
Sector
CMP
(INR)
Oil & Gas
BPCL
GAIL
Gujarat Gas
Gujarat State Petronet
HPCL
IOC
Indraprastha Gas
MRPL
Oil India
ONGC
Petronet LNG
Reliance Inds.
Oil & Gas Sector Aggregate
Oil & Gas Excl. OMCs
480
431
907
195
436
406
1,438
127
349
171
239
824
RECO
Buy
Sell
Sell
Neutral
Buy
Buy
Neutral
Sell
Buy
Buy
Buy
Neutral
Sales (INR M)
Var % Var %
Sep-17
YoY QoQ
606,020
131,905
14,836
3,569
543,603
1,060,179
11,360
113,907
23,102
199,763
65,436
737,250
3,510,930
1,301,129
35.6
11.2
19.9
39.2
29.3
32.5
18.0
14.3
3.0
9.2
-1.1
23.7
26.4
17.2
6.1
15.6
0.4
20.5
1.8
0.6
8.3
11.0
-0.9
4.7
1.7
14.8
5.6
11.6
EBDITA (INR M)
Var % Var %
Sep-17
YoY
QoQ
35,783
20,585
2,281
3,129
33,364
116,073
2,849
13,578
7,588
104,151
7,793
126,447
473,621
288,400
106.8
35.8
7.2
39.4
79.4
87.1
10.6
72.9
1.5
9.2
7.3
19.8
37.8
17.4
82.9
8.4
-15.4
13.4
3.7
27.3
2.7
133.0
-13.2
5.4
4.7
9.1
16.4
9.3
Net Profit (INR M)
Var % Var %
Sep-17
YoY
QoQ
39,135
12,207
904
1,793
31,860
92,189
1,735
7,338
5,386
43,488
4,932
88,212
329,177
165,993
199.8 425.6
32.0
19.0
25.8
-13.4
38.1
17.5
354.3 244.5
195.3 244.4
11.8
7.6
76.5 213.6
-7.2
19.6
-12.6
11.9
7.3
12.7
14.5
7.6
60.2
73.3
7.7
13.3
Source: MOSL
10 October 2017
8

Higher marketing margins
A rise in crude oil price, noise over increased retail fuel prices and Finance
Ministry stating no cut in excise duties raised concerns about the ability of the
OMCs to raise fuel prices, affecting stock performance. In a move positive for
the OMCs nonetheless, the excise was cut by INR2/liter on petrol and diesel
from October 04, 2017.
OMCs’ gross margins for auto fuels have increased YoY/QoQ. Gross margins
were INR3.2/liter in 2QFY18 v/s INR2.7/liter in 2QFY17 for petrol and
INR3.1/liter in 2QFY18 v/s INR2.5/liter in 2QFY17 for diesel.
After almost a decade of negative-to-flat growth, domestic gas production has
increased by ~5.4% YoY in April-August 2017 v/s 3% YoY decline in FY17. We
expect domestic gas production to grow at 10-15% annually for the next five
years.
Domestic crude oil production declined by 0.27% YoY in April-August 2017.
Production for ONGC grew by 2.52% YoY to 9.6mmt during April-August 2017;
OIL’s production grew by 5.5% YoY to 1.6mmt during April-August 2017.
We expect oil production for ONGC to further increase from WO16, Vasai East,
and Ratna & R-series.
While LNG imports grew by 16% in FY17, they declined by 4% YoY during April-
August 2017 due to lower volumes at Dabhol LNG terminal. We expect LNG
imports to revive and grow in double-digits for the rest of the year.
Strong benchmark GRMs and inventory gains led by rise in crude oil price will
boost OMCs (IOCL/HPCL/BPCL). We expect OMCs’ core earnings to increase
YoY/QoQ in 2QFY18.
RIL is expected to clock a GRM of USD12.6/bbl, led by strong benchmark
(premium of USD4.3/bbl). Petchem segment would do better despite decline in
HDPE and LDPE delta, with RIL being an integrated player and strong volume
growth in the segment.
We expect volume growth to continue for CGD players. We might see margin
compression (YoY/QoQ) in the industrial segment due to competition from
alternate fuels.
Rise in crude oil price and revived production volume growth for oil and gas
would benefit ONGC/OINL.
Bullish on OMCs: We continue to like OMCs on account of (a) improving core
performance which reflects strong GRMs, (b) strong consumption growth of
auto fuels, (c) potential marketing margin expansion, and (c) low competitive
intensity. We prefer IOC among the three due to its high free cash flow
generation.
ONGC looks attractive: We prefer ONGC, as (a) cost efficiency would result in
decline in opex, (b) gas production is likely to grow 10-15% annually for the next
five years, (c) oil production is set to increase, (d) it has no subsidy burden, and
(e) valuations are attractive.
Domestic oil production revived
LNG imports to continue growing
Valuation and view
10 October 2017
9

PLNG – a long-term buy: Visibility on PLNG’s medium/long-term earnings is high,
given (a) the huge gas demand-supply gap in India, (b) volume growth, driven by
gradual capacity addition, and (c) earnings growth boosted by annual re-gas
charge escalation. Poor competition from existing and upcoming terminals and
lower LNG prices add to the Buy case for PLNG.
Exhibit 3:
Relative performance - 1Yr (%)
138
126
114
102
90
Sensex Index
MOSL Oil & Gas Index
Exhibit 2:
Relative performance - 3m (%)
Sensex Index
118
113
108
103
98
MOSL Oil & Gas Index
Source: Bloomberg, MOSL
Exhibit 4:
Comparative valuations
Sector / Companies
Oil & Gas
BPCL
GAIL
Gujarat Gas
Gujarat State Petronet
HPCL
Indraprastha Gas
IOC
MRPL
Oil India
ONGC
Petronet LNG
Reliance Inds.
Sector Aggregate
Ex OMCs
CMP
(INR)
480
431
907
195
436
1,438
406
127
349
171
239
824
RECO
EPS (INR)
PE (x)
EV/EBIDTA (x)
ROE (%)
FY18E FY19E FY20E FY18E FY19E FY20E FY18E FY19E FY20E FY18E FY19E FY20E
49.2
26.5
31.6
12.1
45.9
49.6
51.1
10.7
29.1
17.8
14.1
54.7
52.0
30.0
44.0
13.3
42.9
54.8
46.5
11.6
34.1
19.2
18.0
62.6
55.5
32.0
50.9
15.2
45.7
62.7
49.4
12.3
34.8
18.2
18.3
68.1
9.8
16.3
28.7
16.2
9.5
29.0
7.9
11.9
12.0
9.6
16.9
15.1
11.7
13.5
9.2
14.4
20.6
14.7
10.2
26.3
8.7
10.9
10.2
8.9
13.3
13.2
11.0
12.0
8.7
13.5
17.8
12.8
9.5
22.9
8.2
10.3
10.0
9.4
13.1
12.1
10.5
11.5
7.7
10.2
14.0
9.0
6.1
17.2
4.7
5.8
9.0
4.0
11.4
7.1
6.0
6.1
7.3
9.3
11.2
7.9
6.3
15.3
4.7
5.5
7.7
3.7
8.5
5.4
5.3
5.1
6.9
8.7
9.8
6.8
6.1
13.2
4.3
4.5
7.4
4.2
7.8
4.5
5.0
4.9
28.5
11.3
23.9
14.3
31.0
21.7
21.9
17.3
7.9
10.2
23.9
11.7
13.5
10.9
25.2
22.9
11.9
11.8
27.0
25.3
14.1
14.5
24.2
22.2
20.4
20.0
17.4
16.6
16.5
15.6
8.8
8.6
10.5
9.6
25.5
21.8
12.1
11.9
13.0
12.5
11.4
10.9
Source: MOSL
Buy
Sell
Sell
Neutral
Buy
Neutral
Buy
Sell
Buy
Buy
Buy
Neutral
10 October 2017
10

September 2017 Results Preview | October 2017
Automobiles
Company name
Amara Raja Batteries
Ashok Leyland
Bajaj Auto
Bharat Forge
BOSCH
CEAT
Eicher Motors
Endurance technologies
Escort
Exide Industries
Hero MotoCorp
Mahindra & Mahindra
Maruti Suzuki
Tata Motors
TVS Motor Company
Regulatory impact waning – retail improving gradually
Strengthening commodity prices could exert pressure on margins in 2HFY18
Regulatory actions had materially influenced auto volumes since 3QFY17. However,
given the waning regulatory impact, the automobile sector has witnessed gradual
volume growth August onward, supported by pre-festive inventory build-up and
improving rural sentiment.
Our channel checks indicate healthy retail growth in key segments like PV and 2W.
However, its sustainability can be threatened by below-average monsoon in the key
markets of UP (-29%), Bihar (-9%) and MP (-20%).
EBITDA margin for our auto OEM (ex-JLR) universe is likely to contract (-100bp YoY;
+160bp QoQ) for the fourth consecutive quarter to 13.4%. This is without any impact
of an increase in commodity prices (which is expected to be realized in 2HFY18).
We have lowered our FY19 EPS estimates for AMRJ (-13%), and increased for BJAUT
(+7%) and ENDU (+4%).
Our top picks are TTMT and MSIL among large caps, and AL and AMRJ among mid-
caps. We also believe that MM is the best play on a rural market recovery.
Volume recovery across segments; first quarter post regulatory hiccups
Regulatory actions (demonetization, emission norm changes and pre-GST de-
stocking) had materially influenced auto volumes since 3QFY17. However, given the
waning regulatory impact, the automobile sector has witnessed gradual volume
growth August onward. This was partly led by pre-festive inventory filling and
positive rural sentiment in key markets. Our channel checks suggest above-average
volume growth in key rural markets during this festive season.
Fourth straight quarter of YoY contraction in EBITDA margin; healthy QoQ
recovery
EBITDA margin of our auto OEM (ex-JLR) universe is likely to contract (-100bp YoY;
+160bp QoQ) for the fourth consecutive quarter to 13.4%, impacted by commodity
price inflation. However, operating leverage to some extent limits the contraction in
margins. We expect BJAUT’s margin to shrink the most by 240bp YoY, followed by
MSIL (-190bp), HMCL (-130bp) and AL (-100bp). However, margins are expected to
expand for TVSL (+50bp), EIM S/A (+40bp) and TTMT S/A (+80bp).
Below-normal monsoon may result in slower rural recovery; higher
commodity prices may hurt margins
Our channel checks suggest above-average festive demand growth in key rural
markets. However, its sustainability can be impacted by below-average monsoon in
the key markets of UP (-29%), Bihar (-9%) and MP (-20%). We estimate 2W and PV
volumes CAGR of ~11% over FY17-19E. We estimate M&HCVs to grow at ~8% CAGR
and LCVs to grow ~12.5% CAGR (on low base). Sharp increase in commodity prices
(refer Exhibit 4) may impact EBITDA margin from 2HFY18.
Valuation and view
We have lowered our FY19 EPS estimates for AMRJ (-13%), and increased for BJAUT
(+7%) and ENDU (+4%). Demand environment and changing competitive landscape
would be the key determinants of the stock performance. Our top picks are Tata
Motors, Maruti Suzuki, Ashok Leyland and Amara Raja. We also believe MM is the
best play on a rural market recovery.
10 October 2017
11

September 2017 Results Preview | Sector: Automobiles
Exhibit 1: Summary of expected quarterly performance (INR m)
Sector
CMP
(INR)
Automobiles
Amara Raja Batt.
Ashok Leyland
Bajaj Auto
Bharat Forge
Bosch
CEAT
Eicher Motors
Endurance Tech.
Escorts
Exide Inds.
Hero Motocorp
Mahindra & Mahindra
Maruti Suzuki
Tata Motors
Sector Aggregate
705
123
3,131
632
20,781
1,718
30,788
1,055
665
204
3,757
1,301
7,838
423
Reco
Buy
Buy
Buy
Buy
Neutral
Buy
Buy
Buy
Neutral
Buy
Neutral
Buy
Buy
Buy
Sales (INR m)
Var
Var %
Sep-17
% YoY
QoQ
15,474
61,281
65,803
12,430
34,211
17,515
22,080
16,250
11,944
21,680
86,146
122,241
219,928
690,313
1,437,601
15.0
32.6
8.7
39.5
31.0
9.7
25.8
12.2
20.0
12.7
10.5
20.2
23.3
4.8
12.0
3.3
44.6
20.9
3.5
29.2
7.5
10.4
4.8
2.7
3.1
8.1
10.2
25.3
18.0
17.9
EBDITA (INR m)
Var
Var %
Sep-17
% YoY
QoQ
2,006
6,477
12,537
3,560
6,329
1,839
7,000
2,256
1,069
3,278
15,201
17,543
33,188
72,832
188,589
-12.7
20.7
-3.3
43.8
34.8
-0.8
29.1
12.4
71.1
12.0
2.5
19.5
9.3
15.9
13.5
4.0
111.6
33.6
6.8
44.2
236.5
12.8
5.6
9.6
1.1
8.6
20.7
42.4
46.7
35.9
Net Profit (INR m)
Var
Var %
Sep-17
% YoY
QoQ
1,108
3,787
11,189
1,913
4,384
921
5,509
1,082
657
2,016
10,017
13,591
23,323
12,322
94,029
-18.7
28.6
-0.3
50.8
0.9
-13.9
33.3
21.2
91.3
11.2
-0.3
8.5
-2.7
50.4
9.4
10.9
215.7
18.2
9.2
44.9
8614.6
19.9
12.1
4.8
6.7
9.6
76.9
49.9
304.7
53.5
Exhibit 2: Volume snapshot for 2QFY18 ('000 units)
Two wheelers
Three wheelers
Passenger cars
UVs & MPVs
Total PVs
M&HCV
LCV
Total CVs
Total
2QFY18
6,240
257
759
341
1,100
90
135
225
7,822
2QFY17
5,599
232
711
293
1,004
77
118
195
7,031
YoY (%)
11.4
10.8
6.7
16.4
9.5
16.4
14.3
15.2
11.3
1QFY18
5,544
187
634
273
907
57
110
167
6,806
QoQ (%)
12.5
37.6
19.8
24.9
21.3
56.5
22.8
34.3
14.9
1HFY18
11,784
444
1,393
614
2,007
147
245
392
14,628
1HFY17
10,717
438
1,312
548
1,860
158
231
388
13,403
YoY (%)
10.0
1.5
6.2
11.9
7.9
-6.6
6.4
1.1
9.1
Exhibit 3: Trend in segment-wise EBITDA margins (%)
2QFY17
3QFY17
4QFY17
1QFY18
2QFY18
Exhibit 4: Commodity prices remain at higher levels
2QFY17
3QFY17
4QFY17
1QFY18
2QFY18
2W
Cars
CVs
Source: Company, MOSL
Steel
Lead
Alu
Rubber
Source: Company, MOSL
10 October 2017
12

September 2017 Results Preview | Sector: Automobiles
Exhibit 5: Trend in key currencies v/s INR
120
USD
GBP
JPY
Exhibit 6: QoQ Margin expansion (ex-JLR) post three quarters
Aggregate (excld JLR)
17
14
11
Aggregate (incl JLR)
100
80
8
Source: Bloomberg, MOSL
Source: Company, MOSL
Exhibit 7: Revised estimates
Bajaj Auto
Hero MotoCorp
TVS Motor
Maruti *
M&M *
Tata Motors *
Ashok Leyland
Eicher Motors *
Amara Raja
Bharat Forge *
BOSCH
Exide Industries
Endurance Tech*
* Consolidated
Rev
144.4
185.0
15.1
285.5
69.5
20.0
5.3
826.7
25.6
18.3
540.8
8.9
29.6
FY18E
Old
137.2
189.3
14.4
281.7
68.5
22.4
5.2
852.9
28.2
18.2
547.2
9.2
29.3
Chg (%)
5.2
-2.3
4.8
1.4
1.4
-10.7
3.1
-3.1
-9.4
0.3
-1.2
-2.8
1.2
Rev
174.3
197.1
24.5
381.7
81.7
61.3
7.0
1119.2
32.9
25.5
698.6
10.8
39.3
FY19E
Old
163.6
199.1
23.7
374.5
82.4
59.8
7.0
1092.8
37.9
25.3
705.7
11.0
37.9
Chg (%)
6.6
-1.0
3.4
1.9
-0.8
2.5
0.8
2.4
-13.2
0.7
-1.0
-2.1
3.6
Volumes ('000 units)
YoY
QoQ
2QFY18
(%)
(%)
Bajaj Auto
1072
3.8
20.6
Hero MotoCorp
2004
9.9
8.3
TVS Motor
949
16.3
18.3
Maruti Suzuki
492
17.6
24.7
M&M
218
16.3
8.4
Tata Motors (S/A)
153
13.9
39.5
Tata Motors (Cons) 154
10.5
11.1
Ashok Leyland
Eicher(Consol)
41
22.6
43.9
JLR
203
21.5
10.3
Eicher - RE
15
12.0
29.6
Eicher - VECV
Agg. (ex JLR)
5146
11.3
15.1
EBITDA margins (%)
YoY
QoQ
2QFY18
(bp)
(bp)
19.1
-240
180
16.3
-130
0
8.6
50
240
15.1
-190
180
14.4
-10
120
4.5
80
440
10.8
-10
290
10.6
100
210
10.6
-100
330
31.7
40
30
8.5
130
20
31.7
40
30
13.4
-100
160
Adj PAT (INR m)
YoY
QoQ
2QFY18
(%)
(%)
11,189
-0.3
18.2
10,017
-0.3
9.6
2,209
24.5
70.6
23,323
-2.7
49.9
13,591
8.5
76.9
-4,736
NM
-1.4
172
29.6
38.5
12,322
50.4
305
3,787
28.6
215.7
5,043
27.3
2.0
1,095
56.8
68.4
5,509
33.3
19.9
64,890
8.1
46.6
10 October 2017
13

September 2017 Results Preview | Sector: Automobiles
Exhibit 8: Relative performance – Three months (%)
107
104
101
98
Sensex Index
MOSL Automobiles Index
Exhibit 9: Relative performance – One year (%)
120
110
100
90
Sensex Index
MOSL Automobiles Index
Source: Bloomberg, MOSL
Exhibit 10: Comparative valuation
Sector / Companies
Automobiles
Amara Raja Batt.
Ashok Leyland
Bajaj Auto
Bharat Forge
Bosch
CEAT
Endurance Tech.
Eicher Motors
Escorts
Exide Inds.
Hero Motocorp
Mahindra & Mahindra
Maruti Suzuki
Tata Motors
TVS Motor
Auto Sector Aggregate
CMP
(INR)
705
123
3,131
632
20,781
1,718
1,055
30,788
665
204
3,757
1,301
7,838
423
655
Reco.
EPS (INR)
PE (x)
EV/EBIDTA (x)
RoE (%)
FY18E FY19E FY20E FY18E FY19E FY20E FY18E FY19E FY20E FY18E FY19E FY20E
25.6
32.9
43.0
5.3
7.0
9.2
144.4 174.3 202.9
18.3
25.5
32.6
540.8 698.6 820.2
94.2 126.8 145.4
29.6
39.3
49.2
826.7 1119.2 1395.8
37.1
45.8
52.5
8.9
10.8
13.0
185.0 197.1 215.6
69.5
81.7
91.9
285.5 381.7 440.3
20.0
61.3
63.1
15.1
24.5
33.8
27.6
23.0
21.7
34.6
38.4
18.2
35.6
37.2
17.9
22.8
20.3
18.7
27.5
21.1
43.4
25.3
21.4
17.4
18.0
24.8
29.7
13.5
26.9
27.5
14.5
19.0
19.1
15.9
20.5
6.9
26.7
15.9
16.4
13.3
15.4
19.4
25.3
11.8
21.5
22.1
12.7
15.7
17.4
14.2
17.8
6.7
19.4
14.1
14.6
11.9
16.0
18.4
24.1
10.2
16.8
28.2
15.8
11.6
13.0
4.9
16.8
5.0
28.0
10.3
11.3
9.1
12.9
14.5
18.8
8.0
13.9
21.3
12.7
9.5
12.4
4.2
12.4
2.9
18.0
7.2
8.7
6.8
10.9
11.6
15.8
6.8
11.4
16.9
10.4
7.6
11.1
4.0
10.2
2.6
13.1
6.3
15.8
23.8
23.2
19.3
17.8
14.8
21.8
36.1
17.3
13.8
34.0
13.5
20.4
11.0
26.7
17.3
17.7
27.0
25.3
22.9
20.5
17.3
24.0
36.4
18.3
14.8
31.4
14.3
23.0
27.4
34.2
22.8
19.8
29.5
27.1
24.5
21.2
17.1
25.0
33.9
17.9
15.8
29.8
14.8
22.6
22.0
35.5
21.5
Buy
Buy
Buy
Buy
Neutral
Buy
Buy
Buy
Neutral
Buy
Neutral
Buy
Buy
Buy
Buy
10 October 2017
14

Metals Weekly
India steel exports rise 71% YoY to 1.1mt in September
9 October 2017
Update
Indian steel: Long product (TMT Mumbai) prices were down ~2% WoW. Sponge iron prices were down ~2%
WoW, while domestic scrap prices were unchanged. NMDC cut iron ore fines/lump prices by INR100/t. Pellet
prices were unchanged. Domestic HRC prices were unchanged.
Raw materials: Iron ore prices (China cfr) were unchanged as the market is quiet due to Chinese holidays.
Chinese iron ore port inventories were marginally higher. Thermal coal prices were up ~2% WoW. Coking coal
prices were down ~3% WoW. China's pellet import prices were unchanged.
Europe: HRC prices were unchanged. HRC product spreads were marginally higher. CIS HRC export prices were
up ~1% WoW. Rotterdam scrap prices remain weak, down ~1% WoW.
China: Local HRC and rebar prices were unchanged. Exports HRC were also unchanged amid holidays in China.
Base metals: Aluminum (cash LME) prices were up ~1% WoW. Alumina prices were marginally higher. Zinc
(cash LME) was up 4% WoW. Lead was up ~1% WoW. Copper was up ~2% WoW. Crude oil (Brent) prices were
down ~3% WoW.
10 October 2017
15

In conversation
1. Tata Group: Trying to bring consolidation, synergy, and scale;
Natarajan Chandrasekaran, Chairman
Sprawling Tata Group has to be streamlined - with several businesses needing to
be consolidated, and others scaled up further.
Busy collecting data, formulating strategy, building a team and laying out a
capital allocation plan for the group.
Three big companies Tata Steel, Tata Motors and TCS which have scale.
Remaining number of companies in different sectors, but have not scaled up. So
need to figure out a way of scaling up.
Besides these three, Group will look to focus on five segments: retail and
consumer, financial services, infrastructure, tourism and defence.
All present significant opportunity of growth. Need to see how to consolidate,
synergise where company cannot consolidate and how to scale.
Refrained from saying whether or when the group would decide to take a
serious call on consolidation or shutdown for scores of small firms, many of
which have either similar businesses to other group firms or are under-
performing.
2. BATA: Revenue of USD 1 billion target achievable in next 5-6
years; Rajeev Gopalakrishnan, President - South Asia
Goods and services tax (GST) will help company save some costs in the long-
term.
GST has been neutral for the company so far.
Same-store-sales growth maintained at 6 percent so far. However, saw lower
same-store-sales growth in July and August.
Revenue of USD 1 billion achievable in next five-six years.
Premium products contribute close to 30 percent to sales and it should increase
to 50 percent by end FY18.
3. Satin Credit care: Board approves QIP; HP Singh, Founder and
MD
Have closed Rs 150 crore QIP right now.
QIP is fourth fund raising by the company. First QIP was before demonetisation
in October then Asian Development Bank came in April.
Did a small preferential raise with Capital First and that was a business and a
strategic tie-up.
This raise technically in terms of growth.
4. Sobha Developers: Expect EBITDA margins to be better than
last 3-years; JC Sharma, Vice Chairman & MD
Company posted sales value which was highest in last three years.
Tells us that even while the macro environment was sluggish, if one were to
focus on marketing and believe that underlying demand will be there, one will
do succeed. Has taken place in all their markets in the last 9 months.
10 October 2017
16

From the think tank
1. In Defence of mainstream economics
After the 2008 global financial crisis, nearly every month or so an essay goes viral
that discusses, often at length, how the profession of economics needs an
overhaul. Not that there is no truth in the statement but the offered reasons are
often seriously deficient in their understanding of what economists do and the
strengths and limitations of their tools and methods. The usual criticisms are the
following: 1. Economists ignore the importance of psychology, sociology, history
and culture. 2. Economists think of human beings as some abstract mathematical
machines. 3. Economists write very simplistic models of the economy forgetting
that they don’t exactly depict the real world and that these models rely on very
strong, and perhaps untenable, assumptions. 4. However much the economists
wish it to be, economics is not a natural science. Let us take these in order. A
criticism like “Economists ignore the importance of culture” sounds profound until
we realize that it is banal. For example, for most goods the quantity demanded
decreases if the price increases. This statement is valid both in downtown
Manhattan and in a tiny Indian village. Obviously, in making this statement I did
ignore the cultural aspect but I leave it to you to judge the importance of culture
and history here. Arguably my example was too simplistic, and indeed it was. It is
only when economists are seeking such general principles that they ignore
culture, which is rather rare.
2. Why the government needs to loosen its purse strings
Economists would almost universally agree that fiscal discipline is a good thing.
No government should aspire to live beyond its means. If it does, the
consequences can be severe: higher inflation, higher interest rates, low private
investment and lower growth. India’s current government has justly been
praised for its fiscal restraint. It’s reduced the overall fiscal deficit and
reoriented spending away from wasteful programs such as fuel subsidies and
toward more productive investments in infrastructure. What it hasn’t done,
however, is deliver the sustained high growth of over 8% that India needs. To do
so may require loosening the purse strings. It’s important to remember why the
Indian economy is struggling. Some analysts argue that the slowdown is a recent
phenomenon, sparked by the government’s decision last fall to withdraw 86% of
banknotes from circulation and the introduction this past summer of a
nationwide goods and services tax.
3. The need for doing digital
The need for digital can hardly be overstated. India is particularly poised to take
advantage of digital technologies as they have the potential to add economic
value of $550 billion to $1 trillion per year by 2025, and create millions of well-
paying, productive jobs. The critical need of the hour is to stop thinking and start
doing digital. It is, however, important to recognize that digital leadership is
effective for companies only when it creates value—for their customers,
partners and employees. The traditional view of ‘going digital’ was to first
impact operations and then evolving up the technology pyramid to arrive at a
17
10 October 2017

design change of processes. The primary aim was efficiency and reduction in
costs. The business process improvement strategy was often overlooked as the
technology teams typically jumped into operations deploying a set of digital
tools. This mindset is precisely what led to failed implementation and reduced
business value in the past. Organisations, in their attempt to jump onto the
digital bandwagon, have rushed to adopt various siloed technology components
before defining the problem they were trying to solve.
International
4. EU is pulling punches against tech giants
Margrethe Vestager, the European commissioner for competition, is ordering
Amazon to pay €250 million plus interest to Luxembourg, deemed to have
rendered illegal state aid to the US company. But the European Commission (EC)
should be aiming higher if they want to send a serious message to US tech giants
about doing business there.
The scheme Vestager attacked in Amazon’s case turned on the tax ruling
Luxembourg granted the retailer in 2003 and maintained until 2014. The ruling,
according to the EC, allowed the company to transfer 90% of its European
operating profit as royalties for the use of intellectual property held by a
Luxembourg partnership that was exempt from corporate tax. The US owners of
the partnership then simply deferred their tax liability. The EC said the amount
Amazon paid to the partnership was 50% higher than necessary under the
partnership’s cost-sharing arrangement with the US parent company, under
which Amazon financed its research and development.
10 October 2017
18

Click excel icon
for detailed
valuation guide
Rs
Valuation snapshot
P/E (x)
P/B (x)
ROE (%)
FY17 FY18E FY17 FY18E FY17 FY18E FY19E
24.5
27.3
23.6
49.1
44.9
18.7
51.9
46.1
34.8
25.1
21.8
24.0
43.7
31.7
21.5
57.5
28.9
32.9
26.6
30.6
24.3
31.6
17.8
19.8
35.4
NM
39.1
43.6
14.7
25.4
29.7
23.6
NM
16.8
34.6
9.2
NM
22.0
862.3
16.3
92.8
60.4
46.3
30.7
24.3
18.4
65.0
37.3
18.4
37.6
17.4
26.8
23.3
21.7
35.1
39.3
18.5
38.5
36.6
18.7
22.8
19.9
18.8
23.7
27.6
21.3
44.8
25.3
23.1
22.3
90.8
21.7
26.3
18.8
21.4
27.5
18.9
32.4
30.1
11.2
20.1
24.2
14.8
NM
10.5
8.2
7.9
7.0
23.5
17.6
14.5
16.4
42.7
32.5
23.0
20.0
14.5
53.2
33.5
15.1
28.8
16.0
4.5
5.9
5.3
7.3
7.4
2.9
16.2
8.8
3.5
3.5
7.3
3.0
2.7
6.6
2.5
13.3
4.9
2.2
2.7
2.3
2.3
5.3
2.0
1.4
5.1
0.7
5.1
4.6
1.3
4.0
3.4
0.9
0.6
0.7
0.5
0.9
0.3
0.8
1.2
0.4
0.8
11.6
5.5
3.2
4.0
2.2
19.5
6.9
4.4
4.4
3.1
4.0
5.2
4.8
6.3
6.6
2.6
12.2
7.3
3.0
3.1
6.3
2.8
2.4
5.7
2.2
10.9
4.4
2.1
2.2
2.3
1.9
4.6
1.9
1.3
4.4
0.7
4.5
3.2
1.2
3.4
3.0
0.9
0.6
0.6
0.5
0.8
0.3
0.7
1.1
0.4
0.8
6.8
4.4
2.9
3.4
1.9
15.9
6.3
3.9
3.9
2.7
20.3
23.1
25.3
16.2
15.8
16.9
37.1
20.8
10.6
13.9
35.7
14.2
6.4
20.3
9.8
25.6
17.1
6.9
10.8
9.5
9.9
18.3
10.2
7.2
15.4
-27.0
13.8
12.3
9.5
18.9
11.5
4.0
-6.7
4.2
1.4
10.1
-8.4
3.6
-0.2
2.7
0.9
21.6
15.1
12.0
18.0
14.4
32.5
18.9
25.5
12.4
19.4
15.8
23.8
23.2
19.3
17.8
14.8
36.1
21.8
17.3
13.8
34.0
13.5
10.8
20.4
11.0
26.7
17.2
9.3
11.4
2.5
10.0
18.8
8.6
6.3
17.3
3.5
15.0
13.0
10.8
18.3
12.5
6.1
-5.2
6.2
5.8
10.9
4.6
3.2
7.0
3.0
4.6
20.1
15.1
13.2
18.6
14.1
33.0
18.6
27.6
14.7
18.2
17.7
27.0
25.3
22.9
20.5
17.3
36.4
24.0
18.3
14.8
31.4
14.3
11.5
23.0
27.4
34.2
22.6
14.7
11.8
8.6
10.5
19.7
9.3
6.9
18.5
7.2
16.3
13.3
12.7
19.5
14.2
12.4
3.0
9.1
7.3
11.2
5.4
5.9
11.4
6.1
8.3
20.2
22.4
15.0
19.2
15.6
31.8
17.8
30.6
18.5
18.5
Company
Automobiles
Amara Raja
Ashok Ley.
Bajaj Auto
Bharat Forge
Bosch
CEAT
Eicher Mot.
Endurance Tech.
Escorts
Exide Ind
Hero Moto
M&M
Mahindra CIE
Maruti Suzuki
Tata Motors
TVS Motor
Aggregate
Banks - Private
Axis Bank
DCB Bank
Equitas Hold.
Federal Bank
HDFC Bank
ICICI Bank
IDFC Bank
IndusInd
J&K Bank
Kotak Mah. Bk
RBL Bank
South Indian
Yes Bank
Aggregate
Banks - PSU
BOB
BOI
Canara
IDBI Bk
Indian Bk
OBC
PNB
SBI
Union Bk
Aggregate
NBFCs
Bajaj Fin.
Bharat Fin.
Capital First
Cholaman.Inv.&Fn
Dewan Hsg.
GRUH Fin.
HDFC
Indiabulls Hsg
L&T Fin Holdings
LIC Hsg Fin
Reco
Buy
Buy
Buy
Buy
Neutral
Buy
Buy
Buy
Neutral
Buy
Neutral
Buy
Not Rated
Buy
Buy
Buy
CMP
(INR)
TP
% Upside
EPS (INR)
(INR) Downside FY17 FY18E FY19E
25
17
15
13
7
16
15
13
5
37
5
21
19
32
6
28.0
4.6
132.3
13.1
473.1
93.3
612.7
23.5
20.0
8.1
169.1
54.3
5.4
248.6
19.8
11.7
25.6
32.9
5.3
7.0
144.4 174.3
18.3
25.5
540.8 698.6
94.2 126.8
826.7 1,119.2
29.6
39.3
37.1
45.8
8.9
10.8
185.0 197.1
69.5
81.7
9.9
11.8
285.5 381.7
20.0
61.3
15.1
24.5
685
854
124
145
3,128 3,589
643
726
21,249 22,781
1,743 2,029
31,795 36,487
1,084 1,229
694
732
204
279
3,688 3,868
1,305 1,585
234
-
7,893 9,417
426
562
676
719
Neutral
Neutral
Buy
Buy
Buy
Buy
Neutral
Buy
Neutral
Buy
Buy
Buy
Buy
505
186
154
117
1,795
272
59
1,700
73
1,050
518
32
371
524
188
212
139
2,066
366
56
1,948
91
1,197
651
34
446
4
1
37
19
15
35
-6
15
25
14
26
6
20
15.4
7.0
5.0
4.8
56.8
15.3
3.0
47.9
-31.3
26.8
11.9
2.2
14.6
21.8
8.4
1.7
5.4
68.2
14.5
2.8
61.9
3.9
32.4
17.2
2.9
18.5
38.1
10.4
6.1
6.8
82.6
16.6
3.2
76.8
8.3
41.0
22.5
3.7
22.9
Buy
Neutral
Neutral
Neutral
Buy
Neutral
Buy
Buy
Neutral
142
139
315
53
271
120
137
257
131
217
141
323
49
333
150
184
341
135
53
1
3
-7
23
25
34
33
3
6.0
-14.8
18.8
1.5
29.3
-31.6
6.2
0.3
8.1
9.5
-11.2
30.1
6.4
34.4
17.1
5.8
14.6
9.0
20.8
6.6
47.0
8.6
38.3
21.4
11.0
26.8
19.1
Buy
Neutral
Buy
Buy
Buy
Neutral
Buy
Buy
Buy
Neutral
1,935
972
756
1,117
545
529
1,750
1,272
197
666
2,300
900
925
1,400
690
490
2,020
1,450
230
730
19
-7
22
25
27
-7
15
14
17
10
32.0
21.0
24.6
46.0
29.6
8.1
46.8
69.0
5.2
38.2
45.4
29.9
32.8
56.0
37.7
9.9
52.2
84.2
6.8
41.6
62.9
54.9
42.4
68.1
47.1
11.7
58.2
105.6
10.1
48.9
10 October 2017
19

Company
Manappuram
M&M Fin.
Muthoot Fin
PNB Housing
Repco Home
Shriram City Union
STF
Aggregate
Capital Goods
ABB
Bharat Elec.
BHEL
Blue Star
CG Cons. Elec.
CG Power & Indu.
Cummins
GE T&D
Havells
K E C Intl
L&T
Pennar Eng.
Siemens
Solar Ind
Suzlon Energy
Thermax
Va Tech Wab.
Voltas
Aggregate
Cement
Ambuja Cem.
ACC
Birla Corp.
Dalmia Bharat
Grasim Inds.
India Cem
J K Cements
JK Lakshmi Ce
Ramco Cem
Orient Cem
Prism Cem
Shree Cem
Ultratech
Aggregate
Consumer
Asian Paints
Britannia
Colgate
Dabur
Emami
Godrej Cons.
GSK Cons.
HUL
ITC
Jyothy Lab
Marico
Reco
Not Rated
Buy
Buy
Buy
Buy
Buy
Buy
CMP
(INR)
104
423
487
1,505
644
2,068
1,067
TP
% Upside
EPS (INR)
(INR) Downside FY17 FY18E FY19E
-
8.6
9.2
9.7
481
14
7.1
13.9
17.8
550
13
29.5 38.7
44.4
1,750
16
31.6 48.1
65.1
800
24
29.1 33.7
38.4
2,700
31
84.3 118.3 155.3
1,320
24
55.6 80.0 102.4
P/E (x)
P/B (x)
ROE (%)
FY17 FY18E FY17 FY18E FY17 FY18E FY19E
12.1 11.3
2.6
2.4
24.0 22.3 21.4
59.7 30.5
3.8
3.5
6.5
12.0 14.2
16.5 12.6
3.0
2.5
19.4 21.8 21.2
47.6 31.3
4.6
4.1
13.8 13.8 16.6
22.1 19.1
3.5
3.0
17.4 17.1 16.7
24.5 17.5
2.7
2.4
11.7 14.6 16.8
19.2 13.3
2.2
1.9
11.7 15.0 16.9
31.2 25.2
5.0
4.3
16.1 17.1 18.0
69.4
26.3
64.6
59.9
46.4
19.5
34.3
66.9
53.0
25.5
27.0
14.4
68.4
48.3
24.1
29.9
19.9
33.7
34.5
57.2
47.9
32.9
70.6
17.0
32.4
28.9
56.9
25.7
NM
398.4
48.3
41.3
36.9
55.2
58.9
51.4
43.7
41.8
51.7
32.0
62.1
31.9
35.8
49.9
61.0
24.7
31.8
45.2
43.1
39.4
32.9
41.3
47.2
23.1
24.5
11.3
56.3
41.1
17.3
30.6
17.1
31.0
30.3
40.2
33.9
22.9
43.5
16.4
24.2
24.5
40.7
25.6
35.4
31.2
36.6
43.1
31.3
52.2
50.9
44.6
40.9
41.2
45.4
31.6
53.2
28.9
40.9
46.0
8.8
5.4
1.0
9.7
25.2
1.2
6.7
9.5
9.7
4.9
3.2
1.5
6.4
8.9
-1.4
4.1
3.3
5.2
3.9
2.9
3.7
2.2
4.9
1.7
1.1
3.9
3.4
4.5
3.2
5.7
8.4
4.5
3.5
14.6
19.3
23.3
11.5
14.4
12.6
6.7
40.7
7.2
6.7
17.4
7.7
4.2
1.0
9.1
18.6
1.2
6.2
8.3
8.6
4.2
2.9
1.3
5.5
7.6
-1.5
3.7
2.8
4.6
3.5
2.7
3.6
2.0
4.4
1.6
1.1
3.4
3.1
3.9
3.0
5.0
7.0
4.2
3.2
13.3
15.9
22.1
9.9
12.2
9.8
6.6
40.3
7.1
6.8
14.9
12.7
20.6
1.5
18.0
76.4
6.2
21.2
12.4
18.2
21.2
12.5
10.2
9.3
19.8
NM
14.3
16.8
18.0
11.2
5.1
7.9
7.1
7.2
10.8
3.4
14.4
6.1
19.0
-3.2
1.4
18.4
11.6
9.4
28.5
36.9
50.4
28.4
35.8
24.6
22.2
66.5
23.5
21.1
36.7
12.6
17.1
3.1
20.9
49.7
3.0
19.7
21.5
18.3
19.5
12.4
11.6
9.8
19.8
-8.8
12.7
17.6
15.8
11.6
7.0
10.8
9.2
10.7
10.0
4.4
14.8
8.0
16.1
8.8
17.0
20.8
10.1
10.2
26.7
34.3
50.8
26.0
32.0
24.2
21.1
76.2
24.8
16.5
34.9
15.8
17.0
4.1
28.9
48.8
3.7
22.8
22.7
20.9
20.9
13.8
12.6
13.8
20.9
-11.0
12.8
17.4
16.0
13.1
7.9
13.5
12.2
13.3
12.9
6.1
17.5
12.3
17.5
12.8
22.9
18.8
14.0
12.4
28.1
34.5
58.2
26.3
33.9
22.8
22.6
87.2
26.3
18.4
37.7
Sell
Buy
Sell
Neutral
Buy
Neutral
Buy
Neutral
Neutral
Neutral
Buy
Not Rated
Neutral
Neutral
Not Rated
Neutral
Buy
Sell
1,367
166
86
772
217
80
910
383
507
302
1,141
102
1,220
995
15
922
592
520
1,235
215
75
690
240
80
1,170
395
460
295
1,400
-
1,355
900
-
840
800
470
-10
30
-13
-11
11
0
29
3
-9
-2
23
11
-10
-9
35
-10
19.7
6.3
1.3
12.9
4.7
4.1
26.5
5.7
9.6
11.9
42.3
7.1
17.8
20.6
0.6
30.8
29.8
15.5
22.4
6.7
2.7
17.1
5.0
2.0
27.7
9.3
10.7
13.1
46.5
9.1
21.7
24.2
0.9
30.1
34.6
16.8
31.6
7.4
3.8
25.5
6.3
2.5
35.0
11.3
13.9
16.4
56.6
11.2
33.4
30.0
1.0
33.4
39.8
19.1
Buy
Neutral
Buy
Buy
Neutral
Neutral
Buy
Buy
Buy
Buy
Buy
Buy
Buy
279
317
1,728 1,706
938
1,150
2,736 3,272
1,155 1,276
182
198
973
1,196
396
485
701
832
156
182
109
140
18,569 22,084
3,965 4,937
13
-1
23
20
10
9
23
22
19
16
29
19
25
4.9
7.0
36.1 51.0
28.5 40.9
38.8 62.9
67.8 70.6
5.6
7.5
33.7 39.7
7.0
9.7
27.3 27.4
-1.6
4.4
0.3
3.5
384.4 507.1
96.1 92.1
8.2
66.9
58.9
88.3
101.2
10.8
54.4
16.4
34.4
7.1
5.6
547.8
138.8
Neutral
Buy
Buy
Neutral
Buy
Neutral
Neutral
Buy
Neutral
Neutral
Neutral
1,159
4,343
1,091
317
1,110
978
4,998
1,220
268
402
314
1,315
5,165
1,385
330
1,400
1,005
4,630
1,400
290
410
350
13
19
27
4
26
3
-7
15
8
2
12
21.0 22.2
73.7 85.3
21.2 24.5
7.2
7.7
26.5 26.9
18.9 21.5
156.1 158.1
19.6 22.9
8.4
9.3
11.2
9.8
6.3
6.8
26.5
104.6
29.8
9.1
33.1
24.7
182.1
27.4
10.3
11.1
8.2
10 October 2017
20

Company
Nestle
Page Inds
Parag Milk
Pidilite Ind.
P&G Hygiene
Prabhat Dairy
United Brew
United Spirits
Aggregate
Healthcare
Alembic Phar
Alkem Lab
Ajanta Pharma
Aurobindo
Biocon
Cadila
Cipla
Divis Lab
Dr Reddy’s
Fortis Health
Glenmark
Granules
GSK Pharma
IPCA Labs
Jubilant Life
Lupin
Sanofi India
Shilpa Medicare
Strides Shasun
Sun Pharma
Syngene Intl
Torrent Pharma
Aggregate
Logistics
Allcargo Logistics
Blue Dart
Concor
Gateway
Distriparks
Gati
Transport Corp.
Aggregate
Media
Dish TV
D B Corp
Den Net.
Ent.Network
Hind. Media
HT Media
Jagran Prak.
Music Broadcast
PVR
Siti Net.
Sun TV
Zee Ent.
Reco
Neutral
Buy
Neutral
Neutral
Neutral
Not Rated
Buy
Neutral
CMP
TP
% Upside
(INR) (INR) Downside
7,291 6,160
-16
18,819 21,310
13
256
280
9
804
865
8
8,625 9,200
7
134
-
842
980
16
2,349 2,600
11
FY17
118.0
238.7
3.6
16.7
132.9
3.5
8.7
26.7
EPS (INR)
FY18E FY19E
115.0 133.6
294.7 398.4
9.1
12.5
18.1
20.6
151.6 176.0
3.5
6.4
9.9
14.0
34.5
51.5
P/E (x)
FY17 FY18E
61.8 63.4
78.8 63.9
71.0 28.1
48.0 44.5
64.9 56.9
37.9 38.5
97.0 85.2
87.8 68.1
46.1 41.7
23.3
24.7
20.0
18.6
33.7
34.9
36.8
22.0
33.2
14.7
15.5
17.4
69.9
32.7
18.2
18.4
31.4
46.3
26.3
20.3
37.4
22.8
23.8
17.1
40.0
34.9
35.3
13.8
15.5
30.6
69.5
18.6
NM
71.8
9.6
13.1
16.9
61.2
67.5
NM
32.0
37.9
25.4
25.8
22.1
16.3
35.4
28.3
27.7
25.9
33.2
69.7
15.4
15.8
51.4
31.7
14.3
25.1
30.3
30.7
17.9
35.2
30.2
23.5
26.5
16.3
31.6
31.3
27.3
7.3
12.5
25.9
70.2
16.0
NM
67.3
8.7
13.2
14.8
42.2
52.3
NM
27.6
43.2
P/B (x)
ROE (%)
FY17 FY18E FY17 FY18E FY19E
23.3 21.7 39.0 35.5 38.1
31.5 25.3 40.0 39.6 43.1
3.3
2.9
6.0
11.0 13.3
12.5 10.2 28.2 25.2 23.5
40.6 33.7 39.3 64.9 62.8
1.9
1.8
5.2
4.9
8.5
9.5
8.7
10.2 10.7 13.6
17.6 12.3 21.3 18.0 20.3
12.7 11.8 27.5 28.3 29.3
5.0
5.3
6.6
4.6
4.3
7.3
3.8
4.4
3.3
1.6
3.8
3.2
10.1
2.7
3.1
3.5
5.4
5.7
2.8
3.5
7.6
4.9
4.0
2.3
17.8
3.7
2.6
1.9
2.4
3.8
15.5
4.4
1.8
4.6
1.6
1.0
2.7
4.1
6.7
4.1
7.8
5.9
4.4
4.6
5.3
3.6
3.9
6.1
3.4
4.5
3.1
1.4
3.1
2.2
11.8
2.5
2.6
3.2
5.0
4.8
2.5
3.3
6.2
4.3
3.6
2.1
13.5
3.5
2.5
1.7
2.1
3.5
12.7
3.6
2.0
4.3
1.3
0.9
2.8
3.7
6.0
4.4
7.1
5.5
23.0
23.4
37.7
27.6
12.3
23.0
10.2
22.0
9.7
11.3
24.7
21.1
14.5
8.6
18.1
20.9
17.1
14.4
10.7
18.1
22.2
23.8
16.9
13.7
50.5
10.8
7.3
12.4
16.7
12.3
25.1
25.1
-19.1
6.7
18.2
7.9
18.5
11.2
10.4
-28.7
26.0
19.3
18.4
19.0
26.5
24.8
11.1
23.5
12.1
17.0
9.7
2.1
20.3
17.7
23.0
8.2
19.5
13.2
16.6
17.0
14.7
9.6
22.5
19.5
13.6
13.4
48.6
11.4
9.2
19.4
17.8
13.5
19.9
24.7
-6.4
6.6
16.5
7.3
18.6
9.3
12.1
-7.5
27.0
14.7
20.5
20.9
25.9
22.1
14.5
26.0
13.2
19.5
14.4
4.9
20.4
18.8
30.9
12.2
19.6
16.0
18.1
20.4
20.2
13.8
20.7
21.5
16.0
15.1
46.8
12.4
12.1
25.4
18.6
15.1
35.2
23.9
0.2
10.3
16.6
7.3
19.0
12.4
17.3
6.4
31.6
18.7
Neutral
Neutral
Buy
Buy
Sell
Buy
Neutral
Neutral
Neutral
Buy
Neutral
Buy
Neutral
Neutral
Buy
Buy
Buy
Buy
Buy
Buy
Not Rated
Neutral
502
1,872
1,167
730
344
496
585
879
2,410
152
610
126
2,403
526
675
1,040
4,051
649
849
530
487
1,257
510
1,830
1,605
850
330
555
520
720
2,400
220
775
200
2,500
430
905
1,125
4,850
805
1,300
515
-
1,350
2
-2
37
16
-4
12
-11
-18
0
45
27
59
4
-18
34
8
20
24
53
-3
7
21.6 19.8
75.7 72.5
58.4 52.8
39.3 44.9
10.2
9.7
14.2 17.5
15.9 21.1
39.9 33.9
72.6 72.6
10.3
2.2
39.3 39.7
7.2
8.0
34.4 46.8
16.1 16.6
37.0 47.1
56.6 41.4
129.1 133.6
14.0 21.1
32.3 47.4
26.1 15.1
13.0 16.1
55.2 53.4
25.5
93.3
64.2
50.0
14.2
23.6
26.0
40.4
119.9
5.6
49.1
11.0
54.9
26.8
56.7
56.3
160.6
30.4
74.8
23.3
18.0
67.3
Buy
Not Rated
Neutral
Buy
Not Rated
Not Rated
168
4,107
1,327
240
115
263
206
-
1,214
280
-
-
23
-9
17
9.8
10.3
102.5 129.9
38.0 42.4
6.8
8.4
16.9
8.8
15.9
21.0
12.9
163.2
48.6
12.2
23.9
25.9
Buy
Buy
Neutral
Neutral
Buy
Neutral
Buy
Buy
Buy
Neutral
Neutral
Buy
71
380
87
820
248
97
180
393
1,386
25
794
526
106
450
90
928
350
90
225
469
1,597
32
860
630
49
19
4
13
41
-7
25
19
15
27
8
20
1.0
20.4
-9.3
11.4
25.8
7.4
10.7
6.4
20.5
-1.8
24.9
13.9
1.0
23.7
-2.9
12.2
28.5
7.3
12.2
9.3
26.5
-0.4
28.8
12.2
2.4
28.0
0.1
20.6
33.6
7.8
13.4
14.0
43.6
0.4
36.9
17.8
10 October 2017
21

Company
Aggregate
Metals
Hindalco
Hind. Zinc
JSPL
JSW Steel
Nalco
NMDC
SAIL
Vedanta
Tata Steel
Aggregate
Oil & Gas
BPCL
GAIL
Gujarat Gas
Gujarat St. Pet.
HPCL
IOC
IGL
MRPL
Oil India
ONGC
PLNG
Reliance Ind.
Aggregate
Retail
Jubilant Food
Titan Co.
Aggregate
Technology
Cyient
HCL Tech.
Hexaware
Infosys
KPIT Tech
L&T Infotech
Mindtree
Mphasis
NIIT Tech
Persistent Sys
Tata Elxsi
TCS
Tech Mah
Wipro
Zensar Tech
Aggregate
Telecom
Bharti Airtel
Bharti Infratel
Idea Cellular
Tata Comm
Aggregate
Utiltites
Coal India
Reco
CMP
(INR)
TP
% Upside
EPS (INR)
(INR) Downside FY17 FY18E FY19E
P/E (x)
P/B (x)
ROE (%)
FY17 FY18E FY17 FY18E FY17 FY18E FY19E
37.0 31.8
5.0
4.6
13.4 14.5 17.8
29.1
16.1
NM
17.4
21.6
12.2
NM
21.4
18.4
23.0
10.0
19.7
54.4
22.2
10.8
9.6
32.8
8.5
17.8
10.4
21.2
17.2
13.2
12.6
14.1
NM
11.6
17.9
9.3
NM
12.8
10.4
14.6
9.8
16.8
28.0
16.2
9.6
8.1
29.1
11.8
11.8
9.6
17.1
15.2
11.7
1.9
4.3
0.5
2.7
1.5
1.7
0.6
2.0
2.1
1.8
3.1
2.0
7.4
2.4
3.3
1.9
6.9
2.2
1.0
1.0
4.5
1.8
1.7
12.3
13.0
12.4
2.8
3.8
4.7
3.1
1.7
5.0
3.1
2.1
2.0
2.7
9.6
5.5
2.5
2.7
2.3
3.8
1.7
4.7
0.5
2.3
1.5
1.6
0.7
1.8
1.9
1.7
2.6
1.8
6.1
2.2
2.7
1.6
5.8
1.9
0.9
1.0
3.8
1.6
1.6
11.3
11.9
11.4
2.4
3.3
4.1
2.8
1.5
3.9
3.1
2.2
1.9
2.6
7.7
5.9
2.2
2.6
2.0
3.7
2.2
4.8
1.4
10.8
2.6
6.8
7.4
24.4
-7.9
17.3
7.2
12.8
-6.7
9.7
15.7
7.6
32.4
9.6
14.2
11.6
32.4
21.2
21.0
31.4
5.7
10.1
23.2
11.6
13.2
8.2
20.6
17.2
16.2
27.5
26.5
22.0
14.3
40.4
16.8
13.2
13.7
17.0
37.1
32.6
18.4
16.9
17.2
22.9
14.3
31.8
-5.5
21.6
8.3
15.5
-9.1
15.0
19.1
11.5
28.5
11.3
23.9
14.3
31.0
21.9
21.7
17.3
7.9
10.2
23.9
11.7
13.5
11.1
21.0
18.6
16.7
25.5
25.6
19.6
13.3
33.3
17.2
14.4
14.7
17.7
33.6
30.7
17.9
16.2
14.9
22.8
15.4
37.9
0.6
20.8
10.1
16.2
-5.3
20.3
15.9
14.1
25.2
11.9
27.0
14.1
24.2
17.4
20.4
16.5
8.8
10.5
25.5
12.1
13.0
14.0
22.2
19.6
17.4
24.6
23.1
19.1
14.7
28.3
20.1
16.2
16.0
20.6
32.4
33.3
17.1
16.4
17.9
22.0
1.9
23.2
-32.6
33.1
0.3
50.5
Buy
Neutral
Buy
Buy
Neutral
Buy
Sell
Buy
Neutral
250
317
158
258
80
121
57
324
697
308
322
192
298
87
188
30
360
666
23
2
22
16
8
55
-47
11
-4
8.6
19.7
-20.9
14.8
3.7
10.0
-6.2
15.1
37.9
19.8
22.4
-17.4
22.3
4.5
13.1
-7.7
25.4
66.9
24.5
29.3
2.0
25.7
5.8
12.9
-4.2
37.5
63.4
Buy
Sell
Sell
Neutral
Buy
Buy
Neutral
Sell
Buy
Buy
Buy
Neutral
483
446
882
195
440
414
1,442
126
345
171
242
831
644
634
712
180
585
559
1,295
112
340
190
275
938
33
42
-19
-8
33
35
-10
-11
-1
11
14
13
48.3
22.6
16.2
8.8
40.7
43.0
44.0
14.8
19.3
16.4
11.4
48.3
49.2
26.5
31.6
12.1
45.9
51.1
49.6
10.7
29.1
17.8
14.1
54.7
52.0
30.0
44.0
13.3
42.9
46.5
54.8
11.6
34.1
19.2
18.0
62.6
Sell
Neutral
1,499
618
960
590
-36
-4
10.0
9.0
14.8
10.5
20.7
12.6
149.8 101.2
68.4 59.1
72.2 61.0
17.0
15.1
19.4
14.7
11.1
14.4
19.2
15.7
14.9
17.2
30.7
18.4
15.0
16.9
14.2
16.5
14.5
14.2
17.0
14.8
12.2
13.1
16.9
15.2
13.1
15.1
25.5
18.6
13.3
15.7
14.4
16.4
Buy
Neutral
Neutral
Buy
Neutral
Buy
Neutral
Neutral
Neutral
Buy
Buy
Neutral
Buy
Neutral
Buy
520
902
266
924
132
798
479
611
567
649
864
2,453
464
287
740
600
950
250
1,050
140
880
450
610
540
750
996
2,350
490
270
950
15
5
-6
14
6
10
-6
0
-5
16
15
-4
6
-6
28
30.6 35.7
59.8 63.5
13.7 15.6
62.9 62.3
11.9 10.8
55.5 60.9
24.9 28.4
38.9 40.2
38.0 43.3
37.7 42.9
28.1 33.8
133.4 132.0
30.9 34.8
16.9 18.2
52.1 51.5
42.3
68.9
16.5
66.3
13.6
65.3
32.9
43.0
50.8
51.9
40.2
146.3
37.3
19.5
70.0
Buy
Buy
Buy
Buy
379
399
74
690
470
440
105
775
24
10
41
12
11.1
14.9
-1.1
27.2
2.4
17.3
-15.5
8.3
3.2
19.7
-14.9
25.4
34.1 158.3 2.2
26.9 23.1
4.8
NM
NM
1.1
25.3 83.4 12.4
36.2 -226.1 2.5
18.9
14.2
7.1
6.7
1.4
16.2 20.7
-1.6 -25.6
132.2 13.8
6.9
-1.2
37.8
47.6
Buy
281
305
8
14.9
19.8
22.0
10 October 2017
22

Company
Reco
CESC
Buy
JSW Energy
Sell
NTPC
Buy
Power Grid
Buy
Tata Power
Sell
Aggregate
Others
Arvind
Neutral
Avenue Supermarts Sell
Bata India
Under Review
BSE
Neutral
Castrol India
Buy
Century Ply.
Neutral
Coromandel Intl Buy
Delta Corp
Buy
Dynamatic Tech
Buy
Eveready Inds.
Buy
Interglobe
Neutral
Indo Count
Neutral
Info Edge
Buy
Inox Leisure
Sell
Jain Irrigation
Under Review
Just Dial
Neutral
Kaveri Seed
Buy
Kitex Garm.
Buy
Manpasand
Buy
MCX
Buy
Monsanto
Buy
Navneet Education Buy
Quess Corp
Buy
PI Inds.
Buy
Piramal Enterp.
Buy
SRF
Buy
S H Kelkar
Buy
Symphony
Sell
Team Lease Serv. Buy
Trident
Buy
TTK Prestige
Neutral
V-Guard
Neutral
Wonderla
Buy
CMP
(INR)
1,051
76
174
201
81
TP
% Upside
EPS (INR)
(INR) Downside FY17 FY18E FY19E
1,360
29
51.9 88.9
99.3
49
-36
3.8
3.3
2.7
211
21
12.0 13.5
15.7
262
30
14.2 17.4
20.6
71
-13
7.4
7.3
7.3
P/E (x)
P/B (x)
ROE (%)
FY17 FY18E FY17 FY18E FY17 FY18E FY19E
20.3 11.8
1.3
1.2
6.5
10.6 10.8
19.8 22.7
1.2
1.2
6.3
5.3
4.2
14.6 12.9
1.5
1.4
10.5 11.0 11.9
14.1 11.6
2.1
1.9
16.2 17.3 17.8
11.0 11.2
1.9
1.7
17.1 15.8 14.2
15.9 13.0
2.3
2.1
14.5 16.4 17.2
30.9
145.7
56.2
24.0
26.4
29.0
27.4
71.8
31.3
26.5
25.5
8.3
66.9
67.5
18.0
23.7
27.7
11.9
73.7
43.3
28.0
22.7
82.8
22.3
38.2
20.3
37.0
55.8
41.7
15.5
45.4
53.0
52.9
29.6
87.9
48.4
23.3
28.6
25.6
18.9
39.3
18.7
25.0
19.9
12.2
48.2
28.0
13.1
22.4
15.5
10.0
48.0
36.6
23.0
19.6
43.4
24.5
26.5
21.7
35.2
37.6
44.0
12.4
43.5
42.3
31.0
2.8
18.2
7.4
2.0
30.0
7.8
4.6
5.5
4.3
8.6
11.2
2.5
6.4
3.9
1.5
3.2
3.6
3.2
4.6
4.0
7.9
5.6
11.2
6.3
3.2
3.2
4.8
20.7
7.3
1.9
8.2
12.6
4.8
2.6
15.9
6.6
2.0
27.2
6.5
4.0
3.7
3.5
7.0
6.5
2.1
5.8
3.5
1.5
2.8
3.8
2.6
4.3
3.8
7.1
4.8
4.8
5.2
3.0
2.9
4.4
18.2
6.2
1.7
7.5
10.3
4.3
10.3
17.9
13.9
8.3
115.2
31.1
17.5
8.1
15.1
37.7
51.0
34.8
10.2
5.9
8.6
14.8
13.6
29.8
7.3
9.9
31.5
26.7
19.0
32.8
9.0
16.6
13.7
43.3
19.2
13.0
19.5
27.4
9.5
9.1
19.3
14.4
8.5
99.8
27.7
22.5
11.9
20.7
30.8
41.1
18.6
12.7
12.5
11.7
13.4
23.3
28.6
8.2
10.7
32.5
26.3
15.6
23.4
11.7
13.7
12.9
51.6
15.3
14.5
18.0
26.9
14.8
12.0
23.0
15.8
7.7
95.8
29.6
23.4
12.4
24.3
30.1
46.6
18.3
13.1
16.2
14.8
13.7
27.4
27.6
13.4
13.9
34.5
27.9
15.0
22.9
15.3
16.0
15.2
54.5
19.5
16.1
20.7
28.8
17.5
383
1,118
760
984
361
252
456
219
2,116
341
1,100
108
1,049
225
100
413
529
220
468
1,074
2,412
166
828
745
2,771
1,744
268
1,319
1,620
103
5,996
190
370
376
882
-
1,100
467
323
523
232
3,334
358
1,142
118
1,130
240
-
465
738
394
534
1,230
3,295
209
990
894
3,266
1,751
298
1,288
1,990
114
5,281
167
393
-2
-21
12
29
28
15
6
58
5
4
9
8
7
13
40
79
14
15
37
26
20
20
18
0
11
-2
23
11
-12
-12
6
12.4
7.7
13.5
41.0
13.6
8.7
16.6
3.1
67.6
12.9
43.2
13.0
15.7
3.3
5.5
17.5
19.1
18.6
6.3
24.8
86.2
7.3
10.0
33.4
72.6
85.9
7.2
23.7
38.8
6.6
132.1
3.6
7.0
12.9
12.7
15.7
42.2
12.6
9.8
24.1
5.6
112.9
13.6
55.2
8.9
21.8
8.0
7.6
18.5
34.0
22.1
9.7
29.4
105.0
8.4
19.1
30.4
104.6
80.2
7.6
35.1
36.8
8.3
137.8
4.5
11.9
18.6
17.6
19.4
44.6
13.3
12.9
29.0
7.7
166.7
16.3
81.6
10.8
24.7
12.0
10.0
21.1
41.0
26.2
15.3
40.7
126.6
10.4
27.8
35.8
149.7
103.0
9.9
42.9
56.0
10.4
176.1
6.0
16.0
10 October 2017
23

MOSL Universe stock performance
Company
Automobiles
Amara Raja
Ashok Ley.
Bajaj Auto
Bharat Forge
Bosch
CEAT
Eicher Mot.
Endurance Tech.
Escorts
Exide Ind
Hero Moto
M&M
Mahindra CIE
Maruti Suzuki
Tata Motors
TVS Motor
Banks - Private
Axis Bank
DCB Bank
Equitas Hold.
Federal Bank
HDFC Bank
ICICI Bank
IDFC Bank
IndusInd
J&K Bank
Kotak Mah. Bk
RBL Bank
South Indian
Yes Bank
Banks - PSU
BOB
BOI
Canara
IDBI Bk
Indian Bk
OBC
PNB
SBI
Union Bk
NBFCs
Bajaj Fin.
Bharat Fin.
Capital First
Cholaman.Inv.&Fn
Dewan Hsg.
GRUH Fin.
HDFC
Indiabulls Hsg
L&T Fin.Holdings
LIC Hsg Fin
Manappuram
M&M Fin.
Muthoot Fin
PNB Housing
PFC
Repco Home
REC
STF
Shriram City Union
1 Day (%)
-2.6
-0.6
-0.6
-0.8
1.1
-0.2
0.8
-1.5
-0.5
-0.9
-0.4
0.2
-2.7
-0.2
0.4
2.5
0.1
0.3
0.1
-0.6
-0.2
-0.1
3.8
1.1
-1.2
1.2
0.4
1.6
1.6
-0.2
-1.5
-0.1
-0.7
-0.1
-2.8
0.1
-0.1
1.4
0.7
0.2
-0.2
-0.2
-0.2
0.9
0.6
0.3
-0.2
0.6
2.8
0.6
-1.3
-0.7
-1.6
1.1
-2.1
1.4
-1.1
1M (%)
-13.9
7.9
7.4
10.6
-3.3
1.1
-2.6
8.5
6.3
-7.2
-6.9
0.8
-0.5
-1.0
13.6
6.4
2.4
-0.8
-10.3
5.1
0.4
-6.9
5.7
0.2
-6.8
4.2
-3.3
11.7
3.7
3.5
-1.5
-5.1
-5.7
-0.6
-3.6
-0.7
-5.7
0.0
2.2
3.9
-1.8
-3.4
0.2
0.0
-1.6
-3.1
-2.6
1.0
-3.8
-5.2
-0.3
-7.8
-0.3
-3.5
-6.6
1.2
-0.7
12M (%)
-34.6
52.7
8.5
34.3
-8.1
27.1
23.2
73.9
5.2
6.2
-5.0
19.3
38.9
-24.7
75.0
-5.3
49.3
-14.2
59.8
40.1
19.3
-19.3
39.1
-16.2
34.6
68.0
47.8
45.5
-13.6
18.9
-1.4
-26.4
23.0
-7.4
-4.4
-0.7
-11.9
78.6
10.2
1.9
-7.0
86.3
47.9
24.5
48.7
109.7
10.7
12.6
11.0
43.2
0.2
-21.9
16.1
-10.4
-7.9
Company
Capital Goods
ABB
Bharat Elec.
BHEL
Blue Star
CG Cons. Elec.
CG Power & Inds Sol.
Cummins
GE T&D
Havells
K E C Intl
L&T
Pennar Eng.
Siemens
Solar Ind
Suzlon Energy
Thermax
Va Tech Wab.
Voltas
Cement
Ambuja Cem.
ACC
Birla Corp.
Dalmia Bharat
Grasim Inds.
India Cem
J K Cements
JK Lakshmi Ce
Ramco Cem
Orient Cem
Prism Cem
Shree Cem
Ultratech
Consumer
Asian Paints
Britannia
Colgate
Dabur
Emami
Godrej Cons.
GSK Cons.
HUL
ITC
Jyothy Lab
Marico
Nestle
Page Inds
Parag Milk
Pidilite Ind.
P&G Hygiene
Prabhat Dairy
United Brew
United Spirits
Healthcare
Alembic Phar
Alkem Lab
Ajanta Pharma
Aurobindo
Biocon
Cadila
Cipla
1 Day (%)
-0.1
-0.2
1.8
-3.3
-2.6
-0.9
-0.2
-0.5
-0.5
-1.7
-0.1
0.5
-0.4
5.7
-1.0
-0.7
0.5
-1.5
0.4
-0.6
0.9
-0.6
0.3
-0.8
0.2
0.5
-0.6
1.2
1.5
-1.0
1.0
0.0
-0.3
0.1
0.2
0.2
3.2
-0.1
1.2
0.7
0.3
-0.1
-0.7
-0.9
-2.3
0.6
-0.5
0.7
-1.6
-0.5
0.1
1.5
-1.1
-1.9
-1.7
-0.9
0.1
1M (%)
2.0
-3.1
1.5
-2.6
0.7
-7.9
-0.4
-7.5
3.8
-3.4
-2.7
-7.9
-4.8
14.0
-5.6
4.9
-4.2
-2.9
-0.8
-3.6
-3.5
0.8
-4.2
-0.5
-4.9
-6.4
-3.4
-1.6
-2.1
-0.8
-3.9
-3.6
1.2
-5.7
3.1
-1.2
6.0
-3.4
1.1
-1.6
1.4
-3.6
1.3
1.4
4.4
-4.7
3.2
-0.7
7.6
-7.5
0.7
5.2
-2.1
-1.0
0.4
-1.2
6.3
12M (%)
19.0
43.8
-4.3
35.0
26.8
4.4
0.2
8.8
13.4
142.6
17.6
-46.9
-2.0
48.9
5.5
3.8
6.8
34.1
10.2
6.3
26.5
44.9
35.2
13.3
1.6
-21.5
13.5
-24.5
-1.2
5.2
0.6
-2.2
28.0
12.6
11.5
-3.6
19.7
-19.1
38.9
12.1
8.7
12.4
8.5
22.2
-16.3
11.8
23.4
7.7
-10.8
-5.1
-25.4
13.1
-40.5
-14.7
9.3
27.5
2.8
10 October 2017
24

MOSL Universe stock performance
Company
Divis Lab
Dr Reddy’s
Fortis Health
Glenmark
Granules
GSK Pharma
IPCA Labs
Jubilant Life
Lupin
Sanofi India
Shilpa Medicare
Strides Shasun
Sun Pharma
Syngene Intl
Torrent Pharma
Logistics
Allcargo Logistics
Blue Dart
Concor
Gateway Distriparks
Gati
Transport Corp.
Media
Dish TV
D B Corp
Den Net.
Ent.Network
Hind. Media
HT Media
Jagran Prak.
Music Broadcast
PVR
Siti Net.
Sun TV
Zee Ent.
Metals
Hindalco
Hind. Zinc
JSPL
JSW Steel
Nalco
NMDC
SAIL
Vedanta
Tata Steel
Oil & Gas
BPCL
GAIL
Gujarat Gas
Gujarat St. Pet.
HPCL
IOC
IGL
MRPL
Oil India
ONGC
PLNG
Reliance Ind.
Retail
Jubilant Food
Titan Co.
1 Day (%)
1.8
1.3
-2.8
-0.6
3.5
-0.5
1.1
1.8
-0.2
-0.4
3.7
1.2
-0.1
-0.5
-0.6
-1.4
0.2
-0.2
2.4
4.1
-2.2
-0.3
-0.1
0.8
0.0
-0.9
-1.0
0.7
1.2
5.4
-0.6
1.4
0.5
-0.5
-0.7
3.6
0.1
-1.7
-0.9
0.8
-0.7
0.8
-1.3
-1.5
-2.6
-0.2
-1.1
-0.3
-0.2
-0.5
-1.5
-1.6
-1.1
-0.7
-2.9
3.5
1M (%)
24.3
11.6
-1.4
5.1
2.1
-2.2
25.0
-3.0
7.4
2.5
5.4
-7.8
12.5
0.9
3.9
-0.1
-4.0
-2.4
12.8
-1.5
-7.0
-5.9
1.5
0.9
-6.1
-7.0
-5.3
1.8
5.1
1.4
-2.9
-1.6
1.1
0.1
4.1
11.2
-2.0
-0.9
-9.9
-10.0
-1.6
6.4
-6.0
17.4
6.6
1.1
-4.8
-3.3
4.9
-5.6
9.9
5.6
7.8
1.7
8.5
-2.3
12M (%)
-30.9
-21.1
-11.8
-34.2
5.9
-17.5
-13.3
6.1
-30.6
-2.3
12.8
-14.9
-29.5
-1.4
-23.0
-5.8
-25.0
18.9
-6.8
-13.5
41.3
-26.0
-1.1
20.7
-1.4
-16.6
14.1
-10.6
18.4
-27.7
41.3
-8.0
57.9
25.8
97.3
45.1
63.7
3.2
13.6
66.3
71.5
9.2
43.4
49.4
29.2
48.6
29.2
69.2
35.8
10.7
-4.2
29.4
49.7
41.2
56.4
Company
Technology
Cyient
HCL Tech.
Hexaware
Infosys
KPIT Tech
L&T Infotech
Mindtree
Mphasis
NIIT Tech
Persistent Sys
Tata Elxsi
TCS
Tech Mah
Wipro
Zensar Tech
Telecom
Bharti Airtel
Bharti Infratel
Idea Cellular
Tata Comm
Utiltites
Coal India
CESC
JSW Energy
NTPC
Power Grid
Tata Power
Others
Arvind
Avenue Super.
Bata India
BSE
Castrol India
Century Ply.
Coromandel Intl
Delta Corp
Dynamatic Tech
Eveready Inds.
Interglobe
Indo Count
Info Edge
Inox Leisure
Jain Irrigation
Just Dial
Kaveri Seed
Kitex Garm.
Manpasand
MCX
Monsanto
Navneet Educat.
PI Inds.
Piramal Enterp.
Quess Corp
SRF
S H Kelkar
Symphony
Team Lease Serv.
Trident
TTK Prestige
V-Guard
Wonderla
1 Day (%)
2.1
-0.3
0.2
0.5
3.2
0.3
-0.1
-0.3
0.4
0.6
4.1
0.3
1.8
0.1
-1.4
-0.8
-0.2
0.6
-2.5
1.8
0.8
-1.6
-0.7
-1.7
1.2
-1.0
1.0
2.5
0.6
-0.2
-2.2
-0.7
2.9
0.7
6.5
-0.6
-1.8
-1.0
-1.7
1.3
2.3
-1.1
-0.7
0.2
1.0
-0.1
1.0
-0.7
2.4
-0.6
10.6
1.5
0.8
1.2
-1.1
-2.0
-0.4
0.3
1M (%)
-2.5
4.8
-2.2
4.4
17.0
2.8
8.0
1.6
14.4
5.7
-2.4
-0.7
7.8
-4.6
-7.5
-5.9
7.7
-6.9
4.0
10.6
0.9
5.4
4.0
-5.5
5.8
-5.8
4.6
9.7
-1.1
-8.0
-0.5
8.3
16.4
-13.0
10.1
-10.1
-8.1
7.4
-7.1
-3.1
9.2
-8.7
-6.5
12.1
-2.8
-5.9
2.5
2.0
2.9
-0.3
12.6
2.1
-1.1
-0.9
5.3
-6.3
-5.2
5.9
12M (%)
8.2
11.9
44.5
-8.8
2.6
30.6
-2.6
11.6
39.0
-3.6
28.4
3.6
10.6
20.2
-25.6
18.5
7.9
-7.1
12.9
-11.8
66.9
3.4
17.5
13.8
1.2
8.9
53.7
-25.0
1.1
68.8
24.7
-32.9
33.7
16.2
-23.5
12.4
-17.3
4.1
-5.3
27.2
-29.5
27.3
-17.3
1.1
64.3
-9.3
49.4
31.4
-8.0
-10.0
13.8
52.5
90.3
9.0
45.9
-6.9
10 October 2017
25

NOTES
10 October 2017
26

THEMATIC/STRATEGY RESEARCH GALLERY

REPORT GALLERY
RECENT INITIATING COVERAGE REPORTS
Rs

DIFFERENTIATED PRODUCT GALLERY

Disclosures:
The following Disclosures are being made in compliance with the SEBI Research Analyst Regulations 2014 (herein after referred to as the Regulations).
Motilal Oswal Securities Ltd. (MOSL) is a SEBI Registered Research Analyst having registration no. INH000000412. MOSL, the Research Entity (RE) as defined in the Regulations, is engaged in the business of providing Stock
broking services, Investment Advisory Services, Depository participant services & distribution of various financial products. MOSL is a subsidiary company of Motilal Oswal Financial Service Ltd. (MOFSL). MOFSL is a listed
public company, the details in respect of which are available on
www.motilaloswal.com.
MOSL is registered with the Securities & Exchange Board of India (SEBI) and is a registered Trading Member with National Stock
Exchange of India Ltd. (NSE) and Bombay Stock Exchange Limited (BSE), Metropolitan Stock Exchange Of India Ltd. (MSE) for its stock broking activities & is Depository participant with Central Depository Services Limited
(CDSL) & National Securities Depository Limited (NSDL) and is member of Association of Mutual Funds of India (AMFI) for distribution of financial products. Details of associate entities of Motilal Oswal Securities Limited are
available on the website at
http://onlinereports.motilaloswal.com/Dormant/documents/Associate%20Details.pdf
Pending Regulatory Enquiries against Motilal Oswal Securities Limited by SEBI:
SEBI pursuant to a complaint from client Shri C.R. Mohanraj alleging unauthorized trading, issued a letter dated 29th April 2014 to MOSL notifying appointment of an Adjudicating Officer as per SEBI regulations to hold
inquiry and adjudge violation of SEBI Regulations; MOSL requested SEBI to provide all documents, records, investigation report relied upon by SEBI which were referred in Show Cause Notice and also sought personal
hearing. The matter is currently pending.
MOSL, it’s associates, Research Analyst or their relative may have any financial interest in the subject company. MOSL and/or its associates and/or Research Analyst may have beneficial ownership of 1% or more securities in
the subject company at the end of the month immediately preceding the date of publication of the Research Report.
MOSL and its associate company(ies), their directors and Research Analyst and their relatives may; (a) from
time to time, have a long or short position in, act as principal in, and buy or sell the securities or derivatives thereof of companies mentioned herein. (b) be engaged in any other transaction involving such securities and earn
brokerage or other compensation or act as a market maker in the financial instruments of the company(ies) discussed herein or act as an advisor or lender/borrower to such company(ies) or may have any other potential
conflict of interests with respect to any recommendation and other related information and opinions.; however the same shall have no bearing whatsoever on the specific recommendations made by the analyst(s), as the
recommendations made by the analyst(s) are completely independent of the views of the associates of MOSL even though there might exist an inherent conflict of interest in some of the stocks mentioned in the research
report.
Research Analyst may have served as director/officer, etc. in the subject company in the last 12 month period. MOSL and/or its associates may have received any compensation from the subject company in the past
12 months.
In the last 12 months period ending on the last day of the month immediately preceding the date of publication of this research report, MOSL or any of its associates may have:
a)
managed or co-managed public offering of securities from subject company of this research report,
b)
received compensation for investment banking or merchant banking or brokerage services from subject company of this research report,
c)
received compensation for products or services other than investment banking or merchant banking or brokerage services from the subject company of this research report.
d)
Subject Company may have been a client of MOSL or its associates during twelve months preceding the date of distribution of the research report.
MOSL and it’s associates have not received any compensation or other benefits from the subject company or third party in connection with the research report. To enhance transparency, MOSL has incorporated a Disclosure
of Interest Statement in this document. This should, however, not be treated as endorsement of the views expressed in the report. MOSL and / or its affiliates do and seek to do business including investment banking with
companies covered in its research reports. As a result, the recipients of this report should be aware that MOSL may have a potential conflict of interest that may affect the objectivity of this report. Compensation of Research
Analysts is not based on any specific merchant banking, investment banking or brokerage service transactions.
Terms & Conditions:
This report has been prepared by MOSL and is meant for sole use by the recipient and not for circulation. The report and information contained herein is strictly confidential and may not be altered in any way, transmitted to,
copied or distributed, in part or in whole, to any other person or to the media or reproduced in any form, without prior written consent of MOSL. The report is based on the facts, figures and information that are considered
true, correct, reliable and accurate. The intent of this report is not recommendatory in nature. The information is obtained from publicly available media or other sources believed to be reliable. Such information has not
been independently verified and no guaranty, representation of warranty, express or implied, is made as to its accuracy, completeness or correctness. All such information and opinions are subject to change without notice.
The report is prepared solely for informational purpose and does not constitute an offer document or solicitation of offer to buy or sell or subscribe for securities or other financial instruments for the clients. Though
disseminated to all the customers simultaneously, not all customers may receive this report at the same time. MOSL will not treat recipients as customers by virtue of their receiving this report.
Analyst Certification
The views expressed in this research report accurately reflect the personal views of the analyst(s) about the subject securities or issues, and no part of the compensation of the research analyst(s) was, is, or will be directly or
indirectly related to the specific recommendations and views expressed by research analyst(s) in this report.
Disclosure of Interest Statement
Analyst ownership of the stock
Companies where there is interest
No
A graph of daily closing prices of securities is available at
www.nseindia.com, www.bseindia.com.
Research Analyst views on Subject Company may vary based on Fundamental research and Technical Research. Proprietary
trading desk of MOSL or its associates maintains arm’s length distance with Research Team as all the activities are segregated from MOSL research activity and therefore it can have an independent view with regards to
subject company for which Research Team have expressed their views.
Regional Disclosures (outside India)
This report is not directed or intended for distribution to or use by any person or entity resident in a state, country or any jurisdiction, where such distribution, publication, availability or use would be contrary to law,
regulation or which would subject MOSL & its group companies to registration or licensing requirements within such jurisdictions.
For Hong Kong:
This report is distributed in Hong Kong by Motilal Oswal capital Markets (Hong Kong) Private Limited, a licensed corporation (CE AYY-301) licensed and regulated by the Hong Kong Securities and Futures Commission (SFC)
pursuant to the Securities and Futures Ordinance (Chapter 571 of the Laws of Hong Kong) “SFO”. As per SEBI (Research Analyst Regulations) 2014 Motilal Oswal Securities (SEBI Reg No. INH000000412) has an agreement with
Motilal Oswal capital Markets (Hong Kong) Private Limited for distribution of research report in Hong Kong. This report is intended for distribution only to “Professional Investors” as defined in Part I of Schedule 1 to SFO. Any
investment or investment activity to which this document relates is only available to professional investor and will be engaged only with professional investors.” Nothing here is an offer or solicitation of these securities,
products and services in any jurisdiction where their offer or sale is not qualified or exempt from registration. The Indian Analyst(s) who compile this report is/are not located in Hong Kong & are not conducting Research
Analysis in Hong Kong.
For U.S.
Motilal Oswal Securities Limited (MOSL) is not a registered broker - dealer under the U.S. Securities Exchange Act of 1934, as amended (the"1934 act") and under applicable state laws in the United States. In addition MOSL is
not a registered investment adviser under the U.S. Investment Advisers Act of 1940, as amended (the "Advisers Act" and together with the 1934 Act, the "Acts), and under applicable state laws in the United States.
Accordingly, in the absence of specific exemption under the Acts, any brokerage and investment services provided by MOSL, including the products and services described herein are not available to or intended for U.S.
persons. This report is intended for distribution only to "Major Institutional Investors" as defined by Rule 15a-6(b)(4) of the Exchange Act and interpretations thereof by SEC (henceforth referred to as "major institutional
investors"). This document must not be acted on or relied on by persons who are not major institutional investors. Any investment or investment activity to which this document relates is only available to major institutional
investors and will be engaged in only with major institutional investors. In reliance on the exemption from registration provided by Rule 15a-6 of the U.S. Securities Exchange Act of 1934, as amended (the "Exchange Act") and
interpretations thereof by the U.S. Securities and Exchange Commission ("SEC") in order to conduct business with Institutional Investors based in the U.S., MOSL has entered into a chaperoning agreement with a U.S.
registered broker-dealer, Motilal Oswal Securities International Private Limited. ("MOSIPL"). Any business interaction pursuant to this report will have to be executed within the provisions of this chaperoning agreement.
The Research Analysts contributing to the report may not be registered /qualified as research analyst with FINRA. Such research analyst may not be associated persons of the U.S. registered broker-dealer, MOSIPL, and
therefore, may not be subject to NASD rule 2711 and NYSE Rule 472 restrictions on communication with a subject company, public appearances and trading securities held by a research analyst account.
For Singapore
Motilal Oswal Capital Markets Singapore Pte Limited is acting as an exempt financial advisor under section 23(1)(f) of the Financial Advisers Act(FAA) read with regulation 17(1)(d) of the Financial Advisors Regulations and is a
subsidiary of Motilal Oswal Securities Limited in India. This research is distributed in Singapore by Motilal Oswal Capital Markets Singapore Pte Limited and it is only directed in Singapore to accredited investors, as defined in
the Financial Advisers Regulations and the Securities and Futures Act (Chapter 289), as amended from time to time. In respect of any matter arising from or in connection with the research you could contact the following
representatives of Motilal Oswal Capital Markets Singapore Pte Limited:
Disclaimer:
The report and information contained herein is strictly confidential and meant solely for the selected recipient and may not be altered in any way, transmitted to, copied or distributed, in part or in whole, to any other person
or to the media or reproduced in any form, without prior written consent. This report and information herein is solely for informational purpose and may not be used or considered as an offer document or solicitation of
offer to buy or sell or subscribe for securities or other financial instruments. Nothing in this report constitutes investment, legal, accounting and tax advice or a representation that any investment or strategy is suitable or
appropriate to your specific circumstances. The securities discussed and opinions expressed in this report may not be suitable for all investors, who must make their own investment decisions, based on their own investment
objectives, financial positions and needs of specific recipient. This may not be taken in substitution for the exercise of independent judgment by any recipient. Each recipient of this document should make such investigations
as it deems necessary to arrive at an independent evaluation of an investment in the securities of companies referred to in this document (including the merits and risks involved), and should consult its own advisors to
determine the merits and risks of such an investment. The investment discussed or views expressed may not be suitable for all investors. Certain transactions -including those involving futures, options, another derivative
products as well as non-investment grade securities - involve substantial risk and are not suitable for all investors. No representation or warranty, express or implied, is made as to the accuracy, completeness or fairness of
the information and opinions contained in this document. The Disclosures of Interest Statement incorporated in this document is provided solely to enhance the transparency and should not be treated as endorsement of the
views expressed in the report. This information is subject to change without any prior notice. The Company reserves the right to make modifications and alternations to this statement as may be required from time to time
without any prior approval. MOSL, its associates, their directors and the employees may from time to time, effect or have effected an own account transaction in, or deal as principal or agent in or for the securities
mentioned in this document. They may perform or seek to perform investment banking or other services for, or solicit investment banking or other business from, any company referred to in this report. Each of these entities
functions as a separate, distinct and independent of each other. The recipient should take this into account before interpreting the document. This report has been prepared on the basis of information that is already
available in publicly accessible media or developed through analysis of MOSL. The views expressed are those of the analyst, and the Company may or may not subscribe to all the views expressed therein. This document is
being supplied to you solely for your information and may not be reproduced, redistributed or passed on, directly or indirectly, to any other person or published, copied, in whole or in part, for any purpose. This report is not
directed or intended for distribution to, or use by, any person or entity who is a citizen or resident of or located in any locality, state, country or other jurisdiction, where such distribution, publication, availability or use would
be contrary to law, regulation or which would subject MOSL to any registration or licensing requirement within such jurisdiction. The securities described herein may or may not be eligible for sale in all jurisdictions or to
certain category of investors. Persons in whose possession this document may come are required to inform themselves of and to observe such restriction. Neither the Firm, not its directors, employees, agents or
representatives shall be liable for any damages whether direct or indirect, incidental, special or consequential including lost revenue or lost profits that may arise from or in connection with the use of the information.
The
person accessing this information specifically agrees to exempt MOSL or any of its affiliates or employees from, any and all responsibility/liability arising from such misuse and agrees not to hold MOSL or any of its affiliates or
employees responsible for any such misuse and further agrees to hold MOSL or any of its affiliates or employees free and harmless from all losses, costs, damages, expenses that may be suffered by the person accessing this
information due to any errors and delays.
Registered Office Address: Motilal Oswal Tower, Rahimtullah Sayani Road, Opposite Parel ST Depot, Prabhadevi, Mumbai-400025; Tel No.: 022-3980 4263; www.motilaloswal.com. Correspondence Address: Palm Spring
Centre, 2nd Floor, Palm Court Complex, New Link Road, Malad (West), Mumbai- 400 064. Tel No: 022 3080 1000. Compliance Officer: Neeraj Agarwal, Email Id:
na@motilaloswal.com,
Contact No.:022-30801085.
Registration details of group entities.: MOSL: NSE (Cash): INB231041238; NSE (F&O): INF231041238; NSE (CD): INE231041238; BSE (Cash): INB011041257; BSE(F&O): INF011041257; BSE(CD); MSE(Cash): INB261041231;
MSE(F&O): INF261041231; MSE(CD): INE261041231; CDSL: IN-DP-16-2015; NSDL: IN-DP-NSDL-152-2000; Research Analyst: INH000000412. AMFI: ARN 17397. Investment Adviser: INA000007100. Motilal Oswal Asset
Management Company Ltd. (MOAMC): PMS (Registration No.: INP000000670) offers PMS and Mutual Funds products. Motilal Oswal Wealth Management Ltd. (MOWML): PMS (Registration No.: INP000004409) offers wealth
management solutions. *Motilal Oswal Securities Ltd. is a distributor of Mutual Funds, PMS, Fixed Deposit, Bond, NCDs, Insurance and IPO products. * Motilal Oswal Commodities Broker Pvt. Ltd. offers Commodities
Products. * Motilal Oswal Real Estate Investment Advisors II Pvt. Ltd. offers Real Estate products. * Motilal Oswal Private Equity Investment Advisors Pvt. Ltd. offers Private Equity products
13 December 2016
27