IndusInd Bank
BSE SENSEX
32,433
S&P CNX
10,167
15 October 2017
Update
| Sector:
Financials
CMP: INR1,750
TP: INR2,000 (+14%)
BUY
IIB announces merger with BHAFIN
Gains strong edge in rural distribution; synergies to further boost earnings
Stock Info
Bloomberg
Equity Shares (m)
52-Week Range (INR)
1, 6, 12 Rel. Per (%)
M.Cap. (INR b)
M.Cap. (USD b)
Avg Val, INRm
Free float (%)
Financials Snapshot (INR b)
2017 2018E
Y/E Mar
NII
OP
NP
NIM (%)
EPS (INR)
EPS Gr. (%)
BV/Sh. (INR)
RoE (%)
RoA (%)
P/E (X)
P/BV (X)
74.6
66.7
36.4
4.2
60.9
26.7
387
16.9
1.8
28.6
4.5
94.6
84.8
47.0
4.2
78.6
29.0
453.4
19.0
1.9
22.2
3.8
IIB IN
598
1818 / 1038
0/12/26
1053
16.5
1589
85.0
2019E
120.8
108.7
60.3
4.2
100.8
28.3
539.5
20.6
1.9
17.3
3.2
IndusInd Bank (IIB) finally announced the long awaited merger with Bharat Financial
Inclusion (BHAFIN). As per terms of the agreement IIB will issue 639 shares for every 1000
shares of BHAFIN to the latter's shareholders. We believe that while the merger is clearly a
sweet deal for BHAFIN shareholders (swap ratio implies 11% gain for BHAFIN stock based
th
on closing price of 13 Oct, 2017), IIB is also set to benefit as merger will be accretive on
margins (~30bp), RoA (~15bp), RoE (80bp for FY20E), EPS (+3%) & Book Value (1%
dilution). In the medium term we believe that synergy benefits will arise from - (i)
Reduction in funding cost, (ii) Fee income opportunity arising from sale of PSL certificates,
(iii) Reduced risk-weights, and, (iv) Increased cross selling opportunities, and this will
further boost return ratios for the bank. Besides merger approval, board has also
approved preferential allotment of warrants to the promoters to restore their
shareholding back to 15%. We continue to like IIB for its strong earnings/business growth
and ability to deliver industry leading margins & RoA. We reiterate our BUY rating and
maintain our TP of Rs2,000 based on 4x Sept 19 BV.
Microfinance (MFI) exposure will increase to ~8% of merged loan book
IIB currently has MFI portfolio of Rs29bn (2.4% of loan book) which post the merger
will increase to ~Rs107bn and correspond to ~8% of total loans. While IIB has shown
very controlled growth in its MFI portfolio (~INR29b for the last few quarters) the
growth rate for BHAFIN has been higher at ~24% y-y. IIB indicated that over the
medium term MFI loans will form ~5% of total loans as it sees strong growth
opportunities in rest of the banking business.
Merger is largely book neutral however accretive on NIMs, EPS (from next fiscal)
and RoA (~15bps);
As per the swap ratio the merger is larger book neutral while it is EPS accretive from
FY19E particularly as the return profile of BHAFIN improves after undergoing
challenging times over recent period. We further estimate IIB to benefit on NIMs
(30bp change) and RoA (15bp change) without building in any synergies from the
merger. IIB also aims to refinance its MFI borrowings and which will enable it to
avail complete relaxation from CRR/SLR requirements.
Mix of consumer loan increases to
46%
IIB has always aimed to diversify its loan mix with a retail:corporate mix of 50:50
(from 40:60 now). The merger with BHAFIN, will add ~6.3% (to IIB’s existing loans
and ~5% to its balance sheet. Accordingly, the share of consumer finance segment
will increase to ~46% and thus takes IIB one step closer to achieve the desired
business mix.
Synergy benefits to further boost earnings; estimate RoA to cross 2% mark
In the medium term we believe that synergy benefits arising from - (i) Reduction in
funding cost as BHAFIN currently borrows at >10%, (ii) Fee income opportunity
arising from sale of PSL certificates - the entire MFI portfolio is eligible for PSL , (iii)
Shareholding pattern (%)
As On
Sep-17 Jun-17 Sep-16
Promoter
DII
FII
Others
15.0
12.6
53.8
18.6
15.0
12.7
53.9
18.4
14.9
11.6
54.7
18.9
FII Includes depository receipts
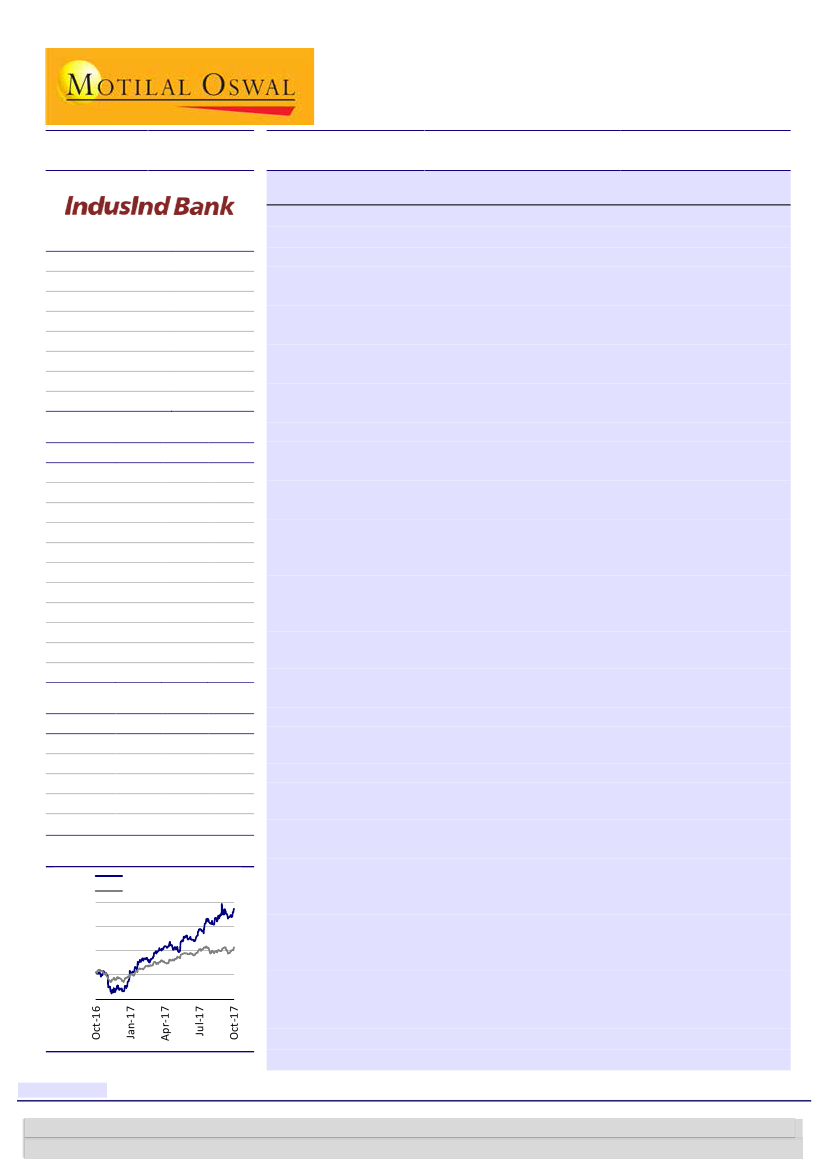
Stock Performance (1-year)
IndusInd Bank
Sensex - Rebased
1,800
1,600
1,400
1,200
1,000
Research Analyst: Nitin Aggarwal
(Nitin.Aggarwal@MotilalOswal.com); +91 22 3982 5540
| Piran Engineer
(Piran.Engineer@MotilalOswal.com); +91 22 3980 4393
Alpesh Mehta
(Alpesh.Mehta@MotilalOswal.com); +91 22 3982 5415
| Anirvan Sarkar
(Anirvan.Sarkar@MotilalOswal.com); +91 22 3982 5505
Investors are advised to refer through important disclosures made at the last page of the Research Report.
Motilal Oswal research is available on www.motilaloswal.com/Institutional-Equities, Bloomberg, Thomson Reuters, Factset and S&P Capital.

IndusInd Bank
Reduced risk-weights on MFI loans - 75% for a bank vs 100% for NBFC, and, (iv)
Increased cross selling opportunities, will further boost return ratios for the bank.
The merger will also significantly expand IIB's rural reach (Bhafin has presence in
1,00,000 villages) and help expand IIB’s customer base by 6.8mn to 16.3mn
customers.
MFI business via bank can earn better returns; Also addresses political risks and
other uncertainties
The MFI business can generate higher sustainable RoEs under a banking set-up due
to a) elimination of the need to carry excess liquidity (negative carry), which is
required in day-to-day operations and first loss margins for off-balance sheet, b)
lower cost of funds (difference of ~400bp between IIB and BHAFIN); c) no cap on
spreads, d) higher leverage (10x v/s 5x currently), and, e) also addresses political and
regulatory overhang. We note that PPoP to average assets is ~6.3% for BHAFIN and
~3.4% for IIB. Furthermore, capitalization of BHAFIN is very high, with a CAR of ~32%
(leverage of just ~4.6x).
Preferential warrant to promoters will further increase book value by 7%;
Maintain BUY with TP of Rs2,000
IIB board has approved preferential allotment of warrants to promoters so as to
restore their shareholding back to 15%. Taking issuance price to be closer to current
market price this will potentially improve IIB's book value by 7% on conversion. We
continue to like IIB for its strong earnings/business growth and ability to deliver
industry leading margins & RoA. We reiterate our BUY rating and maintain our TP of
Rs2,000 based on Sept 19E BV.
Exhibit 1: IIB share count increases by 14.7% post-merger
Swap Ratio
Existing no. of shares of BHAFIN, m
New IIB shares to be issued, m
Existing number of shares of IIB, m
Revised number of shares - IIB, m
% increase in outstanding shares of IIB
0.639
138.0
88.2
598.2
686.3
14.7%
Source: MOSL, Company
Exhibit 2: BV dilution to be minimal, while the merger is EPS accretive from FY19E
IIB networth (INRb)
Merged entity networth (INRb)
Book value for IIB, standalone, per share (INR)
Merged entity book value, per share (INR)
Dilution in book value (%)
PAT for IIB (INRm)
PAT for merged entity (INRm)
EPS for IIB standalone (INR)
EPS for merged entity (INR)
Dilution in EPS (%)
Warrants issued to promoter (m)
Revised number of shares - IIB, m
% increase in outstanding shares
Revised EPS with warrant issue
Revised BV on warrant conversion @ price of Rs1,700
% increase in book value from above
FY18E
231.2
261.4
386.6
380.9
-1%
36,441.6
40,565.1
60.9
59.1
-3%
13.2
699.6
1.9
58.0
405.8
7%
FY19E
271.2
308.7
453.4
449.7
-1%
46,996.8
55,661.6
78.6
81.1
3%
FY20E
322.7
367.8
539.5
536.0
-1%
60,306.1
72,364.4
100.8
105.4
5%
79.6
473.4
5%
103.4
558.0
4%
Source: MOSL, Company
15 October 2017
2

IndusInd Bank
Exhibit 3: Pro-forma merged entity
FY17
NII
60,626
Growth
34.2
Other Income
41,715
Growth
26.5
Net Income
1,02,341
Growth
31.0
Opex
47,831
Growth
30.3
PPP
54,510
Growth
31.6
Provisions
10,913
Growth
62.4
PBT
43,597
Growth
25.7
Tax
14,918
Tax Rate
34.2
PAT
28,679
Growth
25.4
Equity
5,982
Reserves and
2,00,328
surplus
Networth
2,06,309
Growth
16.7
Loans
11,30,805
Growth
27.9
Total Assets 17,54,798
Growth
25.3
EPS
48.1
BV
344.9
RoA
1.8
RoE
15.3
IndusInd bank
FY18
FY19
FY20
74,614
94,590 1,20,845
23.1
26.8
27.8
51,727
64,658
80,176
24.0
25.0
24.0
1,26,341 1,59,248 2,01,022
23.5
26.0
26.2
59,664
74,481
92,293
24.7
24.8
23.9
66,677
84,767 1,08,728
22.3
27.1
28.3
11,041
13,560
17,356
1.2
22.8
28.0
55,636
71,207
91,373
27.6
28.0
28.3
19,194
24,210
31,067
34.5
34.0
34.0
36,442
46,997
60,306
27.1
29.0
28.3
5,982
5,982
5,982
2,25,255 2,65,215 3,16,724
Bharat Financial Inclusion
Merged Entity
FY17
FY18
FY19
FY20
FY17
FY18
FY19
7,774
9,130 15,465 24,006
68,400
83,744 1,10,055
34.1
17.4
69.4
55.2
34.2
22.4
31.4
3,280
4,070
5,934
7,900
44,995
55,797
70,593
27.9
24.1
45.8
33.1
26.6
24.0
26.5
11,054 13,200 21,400 31,906 1,13,395 1,39,541 1,80,648
32.2
19.4
62.1
49.1
31.1
23.1
29.5
5,533
6,634
8,655 11,134
53,363
66,298
83,136
37.1
19.9
30.5
28.6
30.9
24.2
25.4
5,522
6,566 12,745 20,773
60,032
73,243
97,512
27.7
18.9
94.1
63.0
31.2
22.0
33.1
3,594
2,443
1,914
2,221
14,507
13,483
15,473
830.0
-32.0
-21.6
16.1
104.1
-7.1
14.8
1,928
4,124 10,831 18,551
45,525
59,760
82,038
-51.0
113.8
162.7
71.3
17.8
31.3
37.3
-969
0
2,166
6,493
13,949
19,194
26,377
-50.2
0.0
20.0
35.0
30.6
32.1
32.2
2,897
4,124
8,665 12,058
31,576
40,565
55,662
-4.4
42.3
110.1
39.2
21.9
28.5
37.2
1,380
1,380
1,380
1,380
5,982
6,863
6,863
23,088
28,786
36,096
FY20
1,44,852
31.6
88,076
24.8
2,32,928
28.9
1,03,427
24.4
1,29,501
32.8
19,577
26.5
1,09,924
34.0
37,560
34.2
72,364
30.0
6,863
43,760 2,23,415 2,54,539 3,01,808 3,60,983
2,31,236 2,71,196 3,22,706 24,467 30,166 37,475 45,140 2,30,777 2,61,402 3,08,672 3,67,846
12.1
17.3
19.0
76.9
23.3
24.2
20.5
21.0
13.3
18.1
19.2
14,19,160 17,90,980 22,65,590 74,271 1,08,049 1,72,878 2,25,529 12,05,076 15,27,209 19,63,858 24,91,119
25.5
26.2
26.5
47.9
45.5
60.0
30.5
29.0
26.7
28.6
26.8
22,07,829 27,74,389 35,02,025 1,04,176 1,50,301 2,26,393 2,91,528 18,58,973 23,58,130 30,00,782 37,93,553
25.8
25.7
26.2
45.6
44.3
50.6
28.8
26.3
26.9
27.3
26.4
60.9
78.6
100.8
21.0
29.9
54.9
87.4
59.1
81.1
105.4
386.6
453.4
539.5
177.3
218.6
271.6
327.1
381
450
536
1.8
1.9
1.9
3.3
3.2
4.0
4.7
1.9
2.1
2.1
16.9
19.0
20.6
15.1
15.1
22.4
29.2
16.5
19.5
21.4
Source: Company, MOSL
Exhibit 4: Shareholding pattern - IIB (%)
Others,
18.6%
Promoter,
15%
DII, 12.6%
Exhibit 5: Shareholding pattern - BHAFIN (%)
Others, 12.7
Promoter, 1.7
DII, 16.8
FII, 53.8%
FII, 68.8
Source: Company, MOSL
15 October 2017
3

IndusInd Bank
Exhibit 6: Merger synergies
For IIB
Creates “Scale with Profitability” – enables
faster growth and higher profitability.
Provides access to best-in-class microfinance
capabilities
Huge increase in outreach with ~1,400 well-
spread MFI outlets with 6.8 MM borrowers
Ability to leverage network, clients and
capital
Transaction is key driver of “Bharat” Play
(currently serving ~100,000 villages)
Portfolio eligible for Priority Sector Loans
For BIFL
Becomes a “Bank” overnight and provides
ready platform to drive operating synergy
Universal product suite for customers
reduces risks and improves competitiveness
vis-à-vis recently licensed SFBs
Continuation of the business without merger
interruption through a “lift and drop”
approach
Diversification for all stakeholders and
access to stable and low-cost funds
Source: Company, MOSL
Exhibit 7: Key synergy estimates from the merger
Lower Cost of Funds
Priority Sector Loans
Capital Release
Effective Cash Management
Liabilities
Ancillary Products
~3%
100% eligible; Fee income of 1%-1.5% on
excess PSL Loans
75% risk-weight for a bank vs 100% for NBFC
50% Lower Cash Requirement in Branches
Potential to penetrate >50% Customer Base
2-Wheeler Financing
Home Improvement Loans
Fixed Usage Loans
Micro Insurance
Source: MOSL, Company
Exhibit 8: Key Financial and Operational Details
Parameter
Customers
Employees
Loans (INRb)
Networth (INRb)
Total Assets (INRb)
CRAR
IIB
9.5m
25,071
1,164
215
1,907
16.18%
BHAFIN
6.8m
15,284
96
24
102
31.80%
Merged entity
16.3m
40,355
1,260
239
2,008
Source: MOSL, Company
15 October 2017
4

IndusInd Bank
Exhibit 9: State presence to increase for IIB; primary increase would be in asset branches
(% share in private banks)
MAHARASHTRA
UTTAR PRADESH
KARNATAKA
ODISHA
BIHAR
WEST BENGAL
RAJASTHAN
MADHYA PRADESH
HARYANA
PUNJAB
CHANDIGARH
KERALA
Overall
BFIN
135
147
176
164
164
131
72
73
29
18
38
58
1399
IIB
144
102
37
34
23
51
96
84
95
106
33
36
1200
Merged entity Pre-merger (%) Post-merger (%)
277
12.0
10.7
249
8.5
9.6
213
3.1
8.2
198
2.8
7.6
187
1.9
7.2
182
4.3
7.7
168
8.0
6.5
157
7.0
6.0
124
7.9
4.8
124
8.8
4.8
71
2.8
2.7
94
3.0
3.6
2599
Source: Company, MOSL
Exhibit 10: 58:42 corporate (ex MF): retail loan mix (%)
Vehicle, 30
Corporate
ex MF, 57.5
LAP/CC/PL,
11
MF, 2.4
Source: Company, MOSL
Exhibit 11: Proportion of MFI would go up to ~8% of loans
Vehicle, 28
Corporate
ex MF, 54.1
LAP/CC/PL,
10
MF, 8.1
Source: Company, MOSL
Exhibit 12: The transaction is expected to take up to 6-9 months for closure
Source: MOSL, Company
15 October 2017
5

IndusInd Bank
IIB BHAFIN merger conference call highlights
n
n
n
n
n
n
n
n
n
n
n
n
The merger underscores IIB management’s vision of capturing the potential in
livelihood loans
The merger will increase network coverage, while reducing the cost of delivery
to the rural areas
The merger is accretive from day 1 for both balance sheet and P&L
BHAFIN will continue to act as a BC for IIB. There will be no change in the board
of IIB
All employees of BHAFIN will be absorbed into IIB. BHAFIN board has been
advised to sit on MFI advisory board of IIB.
The first synergy would be to leverage BHAFIN’s 6.9m customer base to cross-
sell liability products. The management also envisages potential for payment
products with this customer base, related to pay in and pay out at kirana stores.
70% of Kirana stores have relationships with BHAFIN
100% risk weight on Microfinance loans reduces to 75% on books of the bank
100% of BHAFIN portfolio is refinanceable. All refinancing does not attract
CRR/SLR
Benefit on cost of funds will be transmitted in the form of reduction in interest
rates
All outstanding bank borrowings of BHAFIN will be repaid on day 1 (as one bank
cannot lend to another)
Merger will be operational in 9 months (expect 2-3 months for regulatory
approvals)
98% of disbursements and 60% of underwriting is digital. All Sangam managers
are equipped with tabs
Exhibit 13: IndusInd Bank DuPont Analysis (% of average assets)
Y/E March
Interest Income
Interest Expended
Net Interest Income
Core Fee Income
Trading and others
Non Interest income
Total Income
Operating Expenses
Employee cost
Others
Operating Profit
Core operating Profits
Provisions
PBT
Tax
RoA
Leverage (x)
RoE
FY13
10.7
7.3
3.41
2.0
0.10
2.08
5.49
2.68
1.01
1.67
2.81
2.71
0.40
2.41
0.79
1.62
11.0
17.8
FY14
10.3
6.7
3.61
2.2
0.16
2.36
5.96
2.73
1.01
1.72
3.24
3.08
0.58
2.65
0.90
1.76
10.0
17.5
FY15
9.7
6.3
3.44
2.4
0.12
2.56
6.00
2.89
0.99
1.90
3.12
3.00
0.39
2.73
0.92
1.80
10.5
19.0
FY16
9.2
5.6
3.59
2.5
0.12
2.62
6.21
2.92
0.98
1.93
3.29
3.17
0.53
2.76
0.94
1.82
9.1
16.6
FY17
9.1
5.3
3.84
2.5
0.18
2.64
6.49
3.03
0.96
2.07
3.46
3.28
0.69
2.76
0.95
1.82
8.4
15.3
FY18E
9.0
5.2
3.77
2.4
0.17
2.61
6.38
3.01
0.93
2.08
3.37
3.19
0.56
2.81
0.97
1.84
9.2
16.9
FY19E
8.8
5.0
3.80
2.43
0.17
2.60
6.39
2.99
0.91
2.08
3.40
3.24
0.54
2.86
0.97
1.89
10.1
19.0
FY20E
8.8
4.9
3.85
2.40
0.2
2.6
6.41
2.94
0.9
2.1
3.46
3.3
0.55
2.91
1.0
1.92
10.7
20.6
Source: Company, MOSL
15 October 2017
6

IndusInd Bank
Exhibit 14: Bharat Financial inclusion: DuPont Analysis (% of average assets)
Net Interest Income
Income from assignment of loans
Net Interest Income (incl assignment Income)
Non interest Income
Loan processing fees
Recoveries from written off accounts
Interest on margin money deposits
Other Income
Net Income
Operating Expenses
Cost to income (%)
Employees
Others
Operating Profits
Provisions/write offs
PBT
Tax
Tax Rate (%)
PAT
Leverage (x)
RoE
FY13
3.7
2.8
6.5
3.6
1.1
0.8
0.7
1.0
10.0
12.5
125.1
8.2
4.3
(2.5)
11.7
(14.2)
-
-
(14.2)
5.1
(72.0)
FY14
7.1
2.2
9.4
3.8
1.3
0.7
0.7
1.0
13.2
9.8
74.5
6.6
3.2
3.4
0.6
2.8
-
-
2.8
5.9
16.4
FY15
8.0
1.9
9.8
4.7
1.3
0.7
0.5
2.2
14.6
8.9
61.1
6.4
2.5
5.7
0.3
5.4
0.2
3.0
5.2
4.8
24.9
FY16
7.9
1.9
9.8
4.3
1.2
0.2
0.3
2.6
14.1
6.8
48.3
4.9
1.9
7.3
0.7
6.6
1.5
23.1
5.1
4.9
24.9
FY17E
6.9
2.0
8.8
3.7
1.4
0.0
0.3
2.0
12.6
6.3
50.1
4.6
1.7
6.3
4.09
2.2
(1.1)
(50.2)
3.3
4.6
15.1
FY18E
5.8
1.3
7.2
3.2
1.1
0.1
0.2
1.8
10.4
5.2
50.3
3.9
1.4
5.2
1.9
3.2
-
-
3.2
4.7
15.1
FY19E
6.8
1.4
8.2
3.2
1.2
0.1
0.2
1.6
11.4
4.6
40.4
3.4
1.2
6.8
1.0
5.8
1.7
30.0
4.0
5.6
22.4
Source: Company, MOSL
Exhibit 15: DuPont Analysis of merged entity (% of average assets)
Y/E March
Net Interest Income
Non Interest income
Total Income
Operating Expenses
Operating Profit
Provisions
PBT
Tax
RoA
Leverage (x)
RoE
FY18E
3.97
2.65
6.62
3.14
3.47
0.64
2.83
0.91
1.92
8.57
16.5
FY19E
4.11
2.63
6.74
3.10
3.64
0.58
3.06
0.98
2.08
9.40
19.5
FY20E
4.26
2.59
6.86
3.04
3.81
0.58
3.24
1.11
2.13
10.04
21.4
Source: Company, MOSL
15 October 2017
7

IndusInd Bank
Financials and valuations (IndusInd Bank)
Income Statement
Y/E March
Interest Income
Interest Expense
Net Interest Income
Change (%)
Non Interest Income
Net Income
Change (%)
Operating Expenses
Pre Provision Profits
Change (%)
Provisions (excl tax)
PBT
Tax
Tax Rate (%)
PAT
Change (%)
Pref. Dividend (Incl tax)
Profits for Equity SH
Change (%)
Equity Dividend (Incl tax)
Core PPP*
Change (%)
*Core PPP is (NII+Fee income-Opex)
Balance Sheet
Y/E March
Share Capital
Equity Share Capital
Preference Share Capital
Reserves & Surplus
Net Worth
Deposits
Change (%)
of which CASA Dep
Change (%)
Borrowings
Other Liabilities & Prov.
Total Liabilities
Current Assets
Investments
Change (%)
Loans
Change (%)
Fixed Assets
Other Assets
Total Assets
Asset Quality
GNPA (INR m)
NNPA (INR m)
GNPA Ratio
NNPA Ratio
Slippage Ratio
Credit Cost
PCR (Excl Tech. write off)
E: MOSL Estimates
2013
69,832
47,504
22,329
31.0
13,630
35,958
32.4
17,564
18,395
34.0
2,631
15,764
5,152
32.7
10,612
32.2
0.0
10,612
32.2
1,838
17,750
35.0
2014
82,535
53,628
28,907
29.5
18,905
47,812
33.0
21,853
25,960
41.1
4,676
21,283
7,203
33.8
14,080
32.7
0.0
14,080
32.7
2,154
24,676
39.0
2015
96,920
62,717
34,203
18.3
25,480
59,683
24.8
28,701
30,982
19.3
3,891
27,092
9,155
33.8
17,937
27.4
0.0
17,937
27.4
2,552
29,824
20.9
2016
1,15,807
70,641
45,166
32.1
32,969
78,135
30.9
36,721
41,414
33.7
6,722
34,693
11,828
34.1
22,864
27.5
0.0
22,864
27.5
3,522
39,892
33.8
2017
1,44,057
83,431
60,626
34.2
41,715
1,02,341
31.0
47,831
54,510
31.6
10,913
43,597
14,918
34.2
28,679
25.4
0.0
28,679
25.4
4,320
51,741
29.7
2018E
1,78,481
1,03,867
74,614
23.1
51,727
1,26,341
23.5
59,664
66,677
22.3
11,041
55,636
19,194
34.5
36,442
27.1
0.0
36,442
27.1
4,926
63,215
22.2
2019E
2,20,045
1,25,456
94,590
26.8
64,658
1,59,248
26.0
74,481
84,767
27.1
13,560
71,207
24,210
34.0
46,997
29.0
0.0
46,997
29.0
7,037
80,613
27.5
(INR m)
2020E
2,76,130
1,55,285
1,20,845
27.8
80,176
2,01,022
26.2
92,293
1,08,728
28.3
17,356
91,373
31,067
34.0
60,306
28.3
0.0
60,306
28.3
8,796
1,03,744
28.7
2013
5,229
5,229
0
70,967
76,195
5,41,167
27.7
1,58,674
37.2
94,596
21,000
7,33,065
68,487
1,96,542
34.9
4,43,206
26.4
7,561
17,269
7,33,065
4,578
1,368
1.0
0.3
1.33
0.55
70.1
2014
5,256
5,256
0
85,063
90,319
6,05,023
11.8
1,96,909
24.1
1,47,620
27,187
8,70,259
67,694
2,15,630
9.7
5,51,018
24.3
10,164
25,753
8,70,259
6,208
1,841
1.1
0.3
1.26
0.63
70.4
2015
5,295
5,295
0
1,01,010
1,06,305
7,41,344
22.5
2,52,996
28.5
2,06,181
63,900
11,17,869
1,07,791
2,28,780
6.1
6,87,882
24.8
11,576
81,840
11,17,869
5,629
2,104
0.8
0.3
1.43
0.55
62.6
2016
5,950
5,950
0
1,70,872
1,76,822
9,30,001
25.4
3,27,240
29.3
2,21,559
72,050
14,00,570
1,01,119
3,12,143
36.4
8,84,193
28.5
12,553
90,561
14,00,570
7,768
3,216
0.9
0.4
1.08
0.64
58.6
2017
5,982
5,982
0
2,00,328
2,06,309
12,65,722
36.1
4,66,460
42.5
2,24,537
89,764
17,54,798
1,54,596
3,67,021
17.6
11,30,805
27.9
13,352
89,023
17,54,798
10,549
4,388
0.9
0.4
1.42
0.70
58.4
2018E
5,982
5,982
0
2,25,255
2,31,236
16,04,936
26.8
6,51,604
39.7
2,54,964
1,16,693
22,07,829
1,84,130
4,78,573
30.4
14,19,160
25.5
14,688
1,11,279
22,07,829
15,960
5,446
1.1
0.4
1.50
0.75
62.0
2019E
5,982
5,982
0
2,65,215
2,71,196
20,28,639
26.4
8,54,057
31.1
3,20,520
1,54,035
27,74,389
2,32,567
6,01,152
25.6
17,90,980
26.2
16,156
1,33,534
27,74,389
19,265
6,421
1.1
0.4
1.25
0.75
68.3
2020E
5,982
5,982
0
3,16,724
3,22,706
25,72,314
26.8
11,16,384
30.7
4,03,679
2,03,326
35,02,025
2,94,623
7,63,798
27.1
22,65,590
26.5
17,772
1,60,241
35,02,025
23,224
7,295
1.0
0.3
1.05
0.75
73.9
15 October 2017
8

IndusInd Bank
Financials and valuations (IndusInd Bank)
Ratios
Y/E March
Spreads Analysis (%)
Avg. Yield-Earning Assets
Avg. Yield on loans
Avg. Yield on Investments
Avg. Cost-Int. Bear. Liab.
Avg. Cost of Deposits
Interest Spread
Net Interest Margin
Profitability Ratios (%)
RoE
RoA
Int. Expense/Int.Income
Fee Income/Net Income
Non Int. Inc./Net Income
Efficiency Ratios (%)
Cost/Income*
Empl. Cost/Op. Exps.
* ex treasury and RWO
Asset-Liability Profile (%)
Loans/Deposit Ratio
CASA Ratio
Investment/Deposit Ratio
G-Sec/Investment Ratio
CAR
Tier 1
Valuations
Book Value (INR)
Change (%)
Price-BV (x)
Adjusted BV (INR)
Price-ABV (x)
EPS (INR)
Change (%)
Price-Earnings (x)
Dividend Per Share (INR)
Dividend Yield (%)
E: MOSL Estimates
2013
11.1
14.1
6.1
6.8
8.3
2.7
3.7
2014
10.7
13.3
7.7
6.3
7.6
3.1
3.9
2015
10.4
12.5
7.5
6.0
7.7
2.7
3.9
2016
10.0
11.8
7.2
1.0
6.8
3.1
4.0
2017
9.8
11.4
7.2
1.3
6.3
3.5
4.3
2018E
9.6
11.2
6.6
1.9
6.1
3.4
4.2
2019E
9.4
10.9
7.3
2.8
5.9
3.5
4.2
2020E
9.3
10.8
7.1
4.6
5.7
3.6
4.2
17.8
1.6
68.0
25.8
37.9
17.5
1.8
65.0
29.7
39.5
19.0
1.8
64.7
30.7
42.7
16.6
1.8
61.0
29.5
42.2
15.3
1.8
57.9
30.3
40.8
16.9
1.8
58.2
29.9
40.9
19.0
1.9
57.0
29.7
40.6
20.6
1.9
56.2
29.2
39.9
49.7
37.7
47.0
37.0
49.0
34.2
47.9
33.7
48.0
31.8
48.6
31.0
48.0
30.3
47.1
30.1
81.9
29.3
36.3
71.8
15.4
13.8
91.1
32.5
35.6
71.3
13.8
12.7
92.8
34.1
30.9
78.3
12.1
11.2
95.1
35.2
33.6
81.0
15.5
14.9
89.3
36.9
29.0
85.7
15.3
14.7
88.4
40.6
29.8
85.7
15.4
14.5
88.3
42.1
29.6
85.7
14.4
13.6
88.1
43.4
29.7
85.7
13.6
12.9
145.7
171.8
17.9
160.8
26.9
25.4
4.1
200.8
16.9
189.4
34.0
26.6
4.8
297.2
48.0
285.4
40.7
19.6
5.9
139.0
21.4
3.5
344.9
16.1
5.1
331.3
5.3
48.1
18.2
36.2
7.2
0.4
386.6
12.1
4.5
371.2
4.7
60.9
26.7
28.6
8.2
0.5
453.4
17.3
3.8
436.4
4.0
78.6
29.0
22.2
11.8
0.7
539.5
19.0
3.2
521.0
3.3
100.8
28.3
17.3
14.7
0.8
15 October 2017
9

IndusInd Bank
Financials and valuations (Bharat Financial Inclusion)
Y/E MARCH
Interest Income on books Port.
Interest Expense
Net Financing income
Change (%)
Income from assignment of loans
Net Income (Incl Secur)
Change (%)
Other operating income
Other Income
Net Income
Change (%)
Operating Expenses
Change (%)
Operating Profits
Change (%)
Total Provisions
% to operating income
PBT
Tax
Tax Rate (%)
PAT
Change (%)
Proposed Dividend
BALANCE SHEET
Y/E MARCH
Equity Share Capital
Reserves & Surplus
Networth
Borrowings
Change (%)
Other liabilities
Change (%)
Total Liabilities
Loans
Change (%)
Investments
Net Fixed Assets
Other assets
Total Assets
Assumptions
AUM (INR b)
AUM Growth
Borrowings Growth
Dividend per share
E: MOSL Estimates
2013
2,200
1,427
773
-51.3
580
1,353
-30.0
542
204
2,098
-22.9
2,626
-37.8
-527
-64.9
2,444
-463.7
-2,971
0
0.0
-2,971
-78.2
0
2014
3,930
2,142
1,788
131.4
557
2,345
73.4
702
258
3,306
57.6
2,462
-6.2
844
-260.1
146
17.3
699
0
0.0
699
-123.5
0
2015
5,665
2,790
2,874
60.7
668
3,542
51.0
907
791
5,240
58.5
3,204
30.1
2,036
141.2
100
4.9
1,936
59
3.0
1,877
168.7
0
2016
9,539
4,846
4,693
63.3
1,103
5,796
63.7
1,049
1,515
8,361
59.6
4,036
26.0
4,325
112.4
386
8.9
3,939
909
23.1
3,030
61.4
0
2017
12,280
6,225
6,055
29.0
1,719
7,774
34.1
1,532
1,748
11,054
32.2
5,533
37.1
5,522
27.7
3,594
65.1
1,928
-969
-50.2
2,897
-4.4
0
2018E
15,248
7,821
7,427
22.7
1,703
9,130
17.4
1,745
2,325
13,200
19.4
6,634
19.9
6,566
18.9
2,443
37.2
4,124
0
0.0
4,124
42.3
0
2019E
23,452
10,621
12,831
72.8
2,634
15,465
69.4
2,842
3,093
21,400
62.1
8,655
30.5
12,745
94.1
1,914
15.0
10,831
3,249
30.0
7,582
83.9
0
2020E
33,438
12,981
20,457
59.4
3,549
24,006
55.2
3,787
4,113
31,906
49.1
11,134
28.6
20,773
63.0
2,221
10.7
18,551
6,493
35.0
12,058
59.0
0
2013
1,082
2,822
3,904
16,186
58.5
5,024
123.8
25,115
15,654
64.8
2
113
9,346
25,115
2013
23,590
41.4
58.5
0.0
2014
1,082
3,510
4,592
15,313
-5.4
5,067
0.9
24,972
17,528
12.0
2
112
7,330
24,972
2014
31,128
32.0
-5.4
0.0
2015
1,263
9,202
10,465
32,800
114.2
3,722
-26.5
46,987
29,584
68.8
2
102
17,299
46,987
2015
41,710
34.0
114.2
0.0
2016
1,273
12,557
13,830
50,297
53.3
7,410
99.1
71,537
50,216
69.7
2
165
21,155
71,537
2016
76,770
84.1
53.3
0.0
2017
1,380
23,088
24,467
71,251
41.7
8,457
14.1
1,04,176
74,271
47.9
2
221
29,682
1,04,176
2017
91,500
19.2
41.7
0.0
2018E
1,380
28,786
30,166
1,09,140
53.2
10,995
30.0
1,50,301
1,08,049
45.5
0
265
41,987
1,50,301
2018E
1,34,100
46.6
53.2
6.0
2019E
1,380
36,096
37,475
1,74,624
60.0
14,293
30.0
2,26,393
1,72,878
60.0
0
318
53,197
2,26,393
2019E
1,98,906
48.3
60.0
11.0
2020E
1,380
43,760
45,140
2,27,807
30.5
18,581
30.0
2,91,528
2,25,529
30.5
1
382
65,617
2,91,528
2020E
2,56,436
28.9
30.5
18.4
15 October 2017
10

IndusInd Bank
Financials and valuations (Bharat Financial Inclusion)
RATIOS
Y/E MARCH
Spreads Analysis (%)
Avg. Yield - on Financing portfolio
Avg. Cost of funds
Interest Spread on Financing portfolio
Net Interest Margin (incl Securitization)
Net Interest Margin (Excl Securitization)
Profitability Ratios (%)
RoE
RoA
Op. Exps./Net Income
Empl. Cost/Op. Exps.
Asset-Liability Profile (%)
Net NPAs to Adv.
Debt/Equity (x)
Average leverage
CAR
Valuations
Book Value (INR)
Price-BV (x)
EPS (INR)
EPS Growth (%)
Price-Earnings (x)
E: MOSL Estimates
2013
22.0
10.8
11.2
6.7
7.7
2014
29.2
13.6
15.6
8.6
13.3
2015
25.9
11.6
14.3
9.7
13.2
2016
24.2
11.7
12.6
9.8
11.9
2017
20.2
10.2
10.0
9.2
10.0
2018E
17.2
8.7
8.5
8.1
8.4
2019E
17.0
8.5
8.5
9.8
10.6
2020E
17.0
8.3
8.7
12.0
13.4
-72.0
-14.2
125.1
65.8
16.4
2.8
74.5
67.2
24.9
5.2
61.1
72.4
24.9
5.1
48.3
72.4
15.1
3.3
50.0
73.4
15.1
3.2
50.3
74.1
22.4
4.0
40.4
73.8
29.2
4.7
34.9
74.6
0.4
4.1
3.2
33.9
2013
36.1
26.8
-27.5
-85.4
-35.2
0.1
3.3
3.7
27.2
2014
42.4
22.8
6.5
-123.5
149.8
0.1
3.1
3.2
31.7
2015
82.9
11.7
14.9
130.2
65.1
0.0
3.6
3.4
23.1
2016
108.6
8.9
23.8
60.2
40.6
2.7
2.9
3.2
29.9
2017
177.3
5.5
21.0
-11.8
46.1
0.0
3.6
3.3
25.4
2018E
218.6
4.4
29.9
42.3
32.4
0.0
4.7
4.2
20.6
2019E
271.6
3.6
54.9
83.9
17.6
0.0
5.0
4.9
19.1
2020E
327.1
3.0
87.4
59.1
11.1
15 October 2017
11

Disclosures:
The following Disclosures are being made in compliance with the SEBI Research Analyst Regulations 2014 (herein after referred to as the Regulations).
Motilal Oswal Securities Ltd. (MOSL) is a SEBI Registered Research Analyst having registration no. INH000000412. MOSL, the Research Entity (RE) as defined in the Regulations, is engaged in the business of providing Stock
broking services, Investment Advisory Services, Depository participant services & distribution of various financial products. MOSL is a subsidiary company of Motilal Oswal Financial Service Ltd. (MOFSL). MOFSL is a listed
public company, the details in respect of which are available on
www.motilaloswal.com.
MOSL is registered with the Securities & Exchange Board of India (SEBI) and is a registered Trading Member with National Stock
Exchange of India Ltd. (NSE) and Bombay Stock Exchange Limited (BSE), Metropolitan Stock Exchange Of India Ltd. (MSE) for its stock broking activities & is Depository participant with Central Depository Services Limited
(CDSL) & National Securities Depository Limited (NSDL) and is member of Association of Mutual Funds of India (AMFI) for distribution of financial products. Details of associate entities of Motilal Oswal Securities Limited are
available on the website at
http://onlinereports.motilaloswal.com/Dormant/documents/Associate%20Details.pdf
Pending Regulatory Enquiries against Motilal Oswal Securities Limited by SEBI:
SEBI pursuant to a complaint from client Shri C.R. Mohanraj alleging unauthorized trading, issued a letter dated 29th April 2014 to MOSL notifying appointment of an Adjudicating Officer as per SEBI regulations to hold
inquiry and adjudge violation of SEBI Regulations; MOSL requested SEBI to provide all documents, records, investigation report relied upon by SEBI which were referred in Show Cause Notice and also sought personal
hearing. The matter is currently pending.
MOSL, it’s associates, Research Analyst or their relative may have any financial interest in the subject company. MOSL and/or its associates and/or Research Analyst may have beneficial ownership of 1% or more securities
in the subject company at the end of the month immediately preceding the date of publication of the Research Report.
MOSL and its associate company(ies), their directors and Research Analyst and their relatives may; (a)
from time to time, have a long or short position in, act as principal in, and buy or sell the securities or derivatives thereof of companies mentioned herein. (b) be engaged in any other transaction involving such securities
and earn brokerage or other compensation or act as a market maker in the financial instruments of the company(ies) discussed herein or act as an advisor or lender/borrower to such company(ies) or may have any other
potential conflict of interests with respect to any recommendation and other related information and opinions.; however the same shall have no bearing whatsoever on the specific recommendations made by the
analyst(s), as the recommendations made by the analyst(s) are completely independent of the views of the associates of MOSL even though there might exist an inherent conflict of interest in some of the stocks mentioned
in the research report.
Research Analyst may have served as director/officer, etc. in the subject company in the last 12 month period. MOSL and/or its associates may have received any compensation from the subject
company in the past 12 months.
In the last 12 months period ending on the last day of the month immediately preceding the date of publication of this research report, MOSL or any of its associates may have:
a)
managed or co-managed public offering of securities from subject company of this research report,
b)
received compensation for investment banking or merchant banking or brokerage services from subject company of this research report,
c)
received compensation for products or services other than investment banking or merchant banking or brokerage services from the subject company of this research report.
d)
Subject Company may have been a client of MOSL or its associates during twelve months preceding the date of distribution of the research report.
MOSL and it’s associates have not received any compensation or other benefits from the subject company or third party in connection with the research report. To enhance transparency, MOSL has incorporated a
Disclosure of Interest Statement in this document. This should, however, not be treated as endorsement of the views expressed in the report. MOSL and / or its affiliates do and seek to do business including investment
banking with companies covered in its research reports. As a result, the recipients of this report should be aware that MOSL may have a potential conflict of interest that may affect the objectivity of this report.
Compensation of Research Analysts is not based on any specific merchant banking, investment banking or brokerage service transactions.
Terms & Conditions:
This report has been prepared by MOSL and is meant for sole use by the recipient and not for circulation. The report and information contained herein is strictly confidential and may not be altered in any way, transmitted
to, copied or distributed, in part or in whole, to any other person or to the media or reproduced in any form, without prior written consent of MOSL. The report is based on the facts, figures and information that are
considered true, correct, reliable and accurate. The intent of this report is not recommendatory in nature. The information is obtained from publicly available media or other sources believed to be reliable. Such
information has not been independently verified and no guaranty, representation of warranty, express or implied, is made as to its accuracy, completeness or correctness. All such information and opinions are subject to
change without notice. The report is prepared solely for informational purpose and does not constitute an offer document or solicitation of offer to buy or sell or subscribe for securities or other financial instruments for
the clients. Though disseminated to all the customers simultaneously, not all customers may receive this report at the same time. MOSL will not treat recipients as customers by virtue of their receiving this report.
Analyst Certification
The views expressed in this research report accurately reflect the personal views of the analyst(s) about the subject securities or issues, and no part of the compensation of the research analyst(s) was, is, or will be directly
or indirectly related to the specific recommendations and views expressed by research analyst(s) in this report.
IndusInd Bank
NOTES
Disclosure of Interest Statement
§
Analyst ownership of the stock
IndusInd Bank
No
A graph of daily closing prices of securities is available at
www.nseindia.com, www.bseindia.com.
Research Analyst views on Subject Company may vary based on Fundamental research and Technical Research. Proprietary
trading desk of MOSL or its associates maintains arm’s length distance with Research Team as all the activities are segregated from MOSL research activity and therefore it can have an independent view with regards to
subject company for which Research Team have expressed their views.
Regional Disclosures (outside India)
This report is not directed or intended for distribution to or use by any person or entity resident in a state, country or any jurisdiction, where such distribution, publication, availability or use would be contrary to law,
regulation or which would subject MOSL & its group companies to registration or licensing requirements within such jurisdictions.
For Hong Kong:
This report is distributed in Hong Kong by Motilal Oswal capital Markets (Hong Kong) Private Limited, a licensed corporation (CE AYY-301) licensed and regulated by the Hong Kong Securities and Futures Commission (SFC)
pursuant to the Securities and Futures Ordinance (Chapter 571 of the Laws of Hong Kong) “SFO”. As per SEBI (Research Analyst Regulations) 2014 Motilal Oswal Securities (SEBI Reg No. INH000000412) has an agreement
with Motilal Oswal capital Markets (Hong Kong) Private Limited for distribution of research report in Hong Kong. This report is intended for distribution only to “Professional Investors” as defined in Part I of Schedule 1 to
SFO. Any investment or investment activity to which this document relates is only available to professional investor and will be engaged only with professional investors.” Nothing here is an offer or solicitation of these
securities, products and services in any jurisdiction where their offer or sale is not qualified or exempt from registration. The Indian Analyst(s) who compile this report is/are not located in Hong Kong & are not conducting
Research Analysis in Hong Kong.
For U.S.
Motilal Oswal Securities Limited (MOSL) is not a registered broker - dealer under the U.S. Securities Exchange Act of 1934, as amended (the"1934 act") and under applicable state laws in the United States. In addition MOSL
is not a registered investment adviser under the U.S. Investment Advisers Act of 1940, as amended (the "Advisers Act" and together with the 1934 Act, the "Acts), and under applicable state laws in the United States.
Accordingly, in the absence of specific exemption under the Acts, any brokerage and investment services provided by MOSL, including the products and services described herein are not available to or intended for U.S.
persons. This report is intended for distribution only to "Major Institutional Investors" as defined by Rule 15a-6(b)(4) of the Exchange Act and interpretations thereof by SEC (henceforth referred to as "major institutional
investors"). This document must not be acted on or relied on by persons who are not major institutional investors. Any investment or investment activity to which this document relates is only available to major
institutional investors and will be engaged in only with major institutional investors. In reliance on the exemption from registration provided by Rule 15a-6 of the U.S. Securities Exchange Act of 1934, as amended (the
"Exchange Act") and interpretations thereof by the U.S. Securities and Exchange Commission ("SEC") in order to conduct business with Institutional Investors based in the U.S., MOSL has entered into a chaperoning
agreement with a U.S. registered broker-dealer, Motilal Oswal Securities International Private Limited. ("MOSIPL"). Any business interaction pursuant to this report will have to be executed within the provisions of this
chaperoning agreement.
The Research Analysts contributing to the report may not be registered /qualified as research analyst with FINRA. Such research analyst may not be associated persons of the U.S. registered broker-dealer, MOSIPL, and
therefore, may not be subject to NASD rule 2711 and NYSE Rule 472 restrictions on communication with a subject company, public appearances and trading securities held by a research analyst account.
For Singapore
Motilal Oswal Capital Markets Singapore Pte Limited is acting as an exempt financial advisor under section 23(1)(f) of the Financial Advisers Act(FAA) read with regulation 17(1)(d) of the Financial Advisors Regulations and is
a subsidiary of Motilal Oswal Securities Limited in India. This research is distributed in Singapore by Motilal Oswal Capital Markets Singapore Pte Limited and it is only directed in Singapore to accredited investors, as defined
in the Financial Advisers Regulations and the Securities and Futures Act (Chapter 289), as amended from time to time. In respect of any matter arising from or in connection with the research you could contact the
following representatives of Motilal Oswal Capital Markets Singapore Pte Limited:
Disclaimer:
The report and information contained herein is strictly confidential and meant solely for the selected recipient and may not be altered in any way, transmitted to, copied or distributed, in part or in whole, to any other
person or to the media or reproduced in any form, without prior written consent. This report and information herein is solely for informational purpose and may not be used or considered as an offer document or
solicitation of offer to buy or sell or subscribe for securities or other financial instruments. Nothing in this report constitutes investment, legal, accounting and tax advice or a representation that any investment or strategy
is suitable or appropriate to your specific circumstances. The securities discussed and opinions expressed in this report may not be suitable for all investors, who must make their own investment decisions, based on their
own investment objectives, financial positions and needs of specific recipient. This may not be taken in substitution for the exercise of independent judgment by any recipient. Each recipient of this document should make
such investigations as it deems necessary to arrive at an independent evaluation of an investment in the securities of companies referred to in this document (including the merits and risks involved), and should consult its
own advisors to determine the merits and risks of such an investment. The investment discussed or views expressed may not be suitable for all investors. Certain transactions -including those involving futures, options,
another derivative products as well as non-investment grade securities - involve substantial risk and are not suitable for all investors. No representation or warranty, express or implied, is made as to the accuracy,
completeness or fairness of the information and opinions contained in this document. The Disclosures of Interest Statement incorporated in this document is provided solely to enhance the transparency and should not be
treated as endorsement of the views expressed in the report. This information is subject to change without any prior notice. The Company reserves the right to make modifications and alternations to this statement as may
be required from time to time without any prior approval. MOSL, its associates, their directors and the employees may from time to time, effect or have effected an own account transaction in, or deal as principal or agent
in or for the securities mentioned in this document. They may perform or seek to perform investment banking or other services for, or solicit investment banking or other business from, any company referred to in this
report. Each of these entities functions as a separate, distinct and independent of each other. The recipient should take this into account before interpreting the document. This report has been prepared on the basis of
information that is already available in publicly accessible media or developed through analysis of MOSL. The views expressed are those of the analyst, and the Company may or may not subscribe to all the views expressed
therein. This document is being supplied to you solely for your information and may not be reproduced, redistributed or passed on, directly or indirectly, to any other person or published, copied, in whole or in part, for any
purpose. This report is not directed or intended for distribution to, or use by, any person or entity who is a citizen or resident of or located in any locality, state, country or other jurisdiction, where such distribution,
publication, availability or use would be contrary to law, regulation or which would subject MOSL to any registration or licensing requirement within such jurisdiction. The securities described herein may or may not be
eligible for sale in all jurisdictions or to certain category of investors. Persons in whose possession this document may come are required to inform themselves of and to observe such restriction. Neither the Firm, not its
directors, employees, agents or representatives shall be liable for any damages whether direct or indirect, incidental, special or consequential including lost revenue or lost profits that may arise from or in connection with
the use of the information.
The person accessing this information specifically agrees to exempt MOSL or any of its affiliates or employees from, any and all responsibility/liability arising from such misuse and agrees not to
hold MOSL or any of its affiliates or employees responsible for any such misuse and further agrees to hold MOSL or any of its affiliates or employees free and harmless from all losses, costs, damages, expenses that may be
suffered by the person accessing this information due to any errors and delays.
Registered Office Address: Motilal Oswal Tower, Rahimtullah Sayani Road, Opposite Parel ST Depot, Prabhadevi, Mumbai-400025; Tel No.: 022-3980 4263; www.motilaloswal.com. Correspondence Address: Palm Spring
Centre, 2nd Floor, Palm Court Complex, New Link Road, Malad (West), Mumbai- 400 064. Tel No: 022 3080 1000. Compliance Officer: Neeraj Agarwal, Email Id:
na@motilaloswal.com,
Contact No.:022-30801085.
Registration details of group entities.: MOSL: NSE (Cash): INB231041238; NSE (F&O): INF231041238; NSE (CD): INE231041238; BSE (Cash): INB011041257; BSE(F&O): INF011041257; BSE(CD); MSE(Cash): INB261041231;
MSE(F&O): INF261041231; MSE(CD): INE261041231; CDSL: IN-DP-16-2015; NSDL: IN-DP-NSDL-152-2000; Research Analyst: INH000000412. AMFI: ARN 17397. Investment Adviser: INA000007100. Motilal Oswal Asset
Management Company Ltd. (MOAMC): PMS (Registration No.: INP000000670) offers PMS and Mutual Funds products. Motilal Oswal Wealth Management Ltd. (MOWML): PMS (Registration No.: INP000004409) offers
wealth management solutions. *Motilal Oswal Securities Ltd. is a distributor of Mutual Funds, PMS, Fixed Deposit, Bond, NCDs, Insurance and IPO products. * Motilal Oswal Commodities Broker Pvt. Ltd. offers Commodities
Products. * Motilal Oswal Real Estate Investment Advisors II Pvt. Ltd. offers Real Estate products. * Motilal Oswal Private Equity Investment Advisors Pvt. Ltd. offers Private Equity products
15 October 2017
12