17 October 2017
Market snapshot
Equities - India
Close
Chg .%
Sensex
32,634
0.6
Nifty-50
10,231
0.6
Nifty-M 100
18,779
0.3
Equities-Global
Close
Chg .%
S&P 500
2,558
0.2
Nasdaq
6,624
0.3
FTSE 100
7,527
-0.1
DAX
13,004
0.1
Hang Seng
11,603
0.7
Nikkei 225
21,256
0.5
Commodities
Close
Chg .%
Brent (US$/Bbl)
58
1.5
Gold ($/OZ)
1,295
-0.7
Cu (US$/MT)
7,122
3.8
Almn (US$/MT)
2,110
0.0
Currency
Close
Chg .%
USD/INR
64.7
-0.3
USD/EUR
1.2
-0.1
USD/JPY
111.8
-0.1
YIELD (%)
Close
1MChg
10 Yrs G-Sec
6.7
0.0
10 Yrs AAA Corp
7.6
-0.1
Flows (USD b)
13-Oct
MTD
FIIs
0.0
-0.7
DIIs
0.0
1.2
Volumes (INRb)
13-Oct
MTD*
Cash
334
308
F&O
6,836
6,096
Note: YTD is calendar year, *Avg
YTD.%
22.6
25.0
30.9
YTD.%
14.2
23.1
5.4
13.3
23.5
11.2
YTD.%
4.5
12.4
29.0
23.8
YTD.%
-4.7
12.3
-4.4
YTDchg
0.2
0.0
YTD
4.5
11.0
YTD*
294
5,458
Today’s top research idea
Prime Focus (Initiating Coverage): Set to run the show
Forte in global media services to drive profitable growth
v
PFL has turned into a strong media service player globally, offering visual
effects, 3D animation and media-focused ERP solutions in India and abroad.
v
The company turned profitable in FY17 post completion of M&A integration in
FY15-16. In our view, the four M&A transactions in the last five years have
allowed PFL to become a strong media service player globally. The company’s
position as one of the top-4 Hollywood VFX service providers and a steady order
book should drive 15%/18% revenue/EBITDA CAGR over FY17-20E.
v
We note that the demons of ~2.8x jump in net debt to INR13.9b and 50% equity
dilution over the last five years are now behind. Improving EBITDA and lower
capex requirement are expected to help generate healthy FCF, improve RoIC to
19%, and reduce net debt by ~68% to INR4.5b by FY20.
v
We initiate coverage with a
Buy
rating and TP of INR130 (+46%), based on SOTP
valuation (10x FY19E EBITDA).
Research covered
Cos/Sector
Prime Focus (IC)
India Strategy
Expert Speak
Fund Folio
Bajaj Finance
Colgate-Palmolive
Federal Bank
Dewan Hsg. Fin.
Delta Corp
DCB Bank
Persistent System
Hindustan Media
Metals Weekly
Results Expectation
Key Highlights
Set to run the show
Contrarian Investing – Quarterly update
GST: A change for the better
AUM rises for the 16th consecutive quarter
Strong growth continues
Volumes miss, but high rural salience to drive performance
Strong operating performance
Growth surprises positively; re-rating to continue
Results in-line (GST adjusted)
Strong Operating Profit, Lower Provisions Aid YoY PAT Growth
Marching upward on profitability
GST and RERA prune ad growth
Alumina continues to rise due to bauxite supply disruption
ACC | Axis Bank | Bajaj Auto | H T Media | Wipro
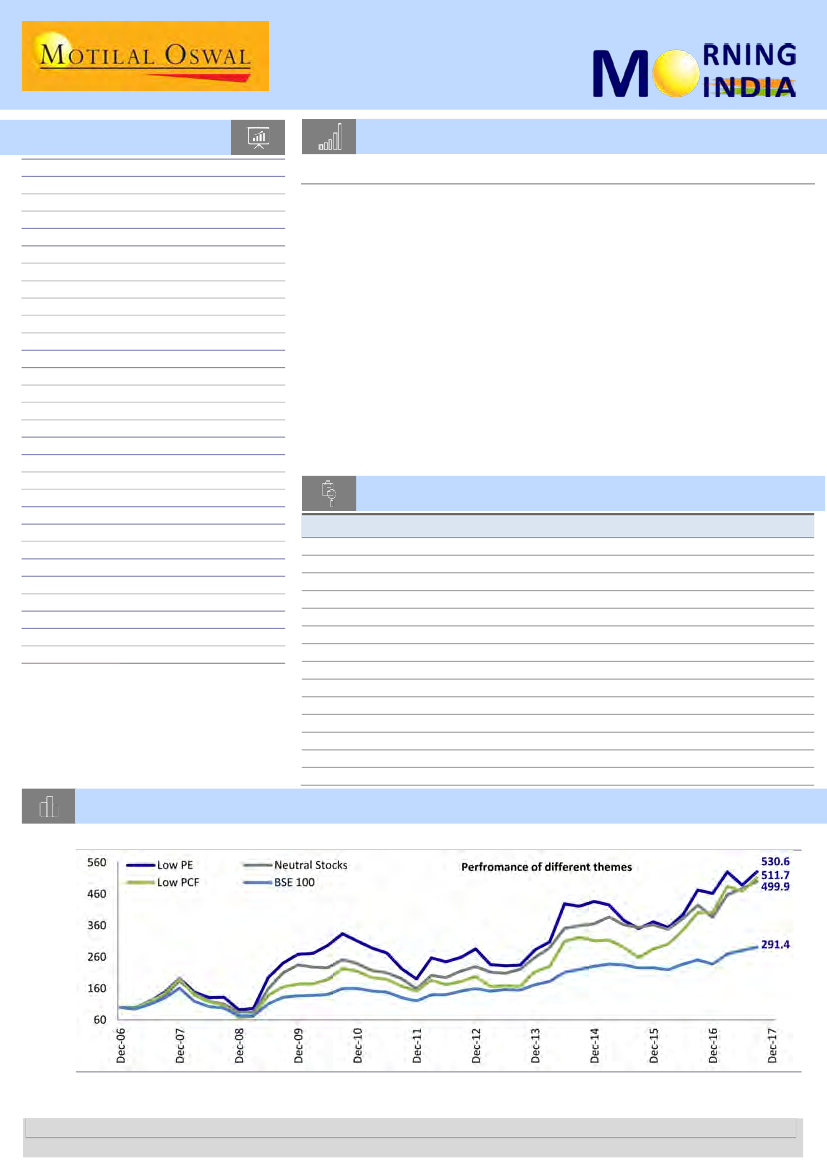
Chart of the Day: India Strategy – A review of our contrarian investment strategies
Out-of-favor stocks have beaten the benchmark convincingly (Indexed Returns)
Source: Bloomberg
Research Team (Gautam.Duggad@MotilalOswal.com)
Motilal Oswal research is available on www.motilaloswal.com/Institutional-Equities, Bloomberg, Thomson Reuters, Factset and S&P Capital.
Investors are advised to refer through important disclosures made at the last page of the Research Report.

In the news today
Kindly click on textbox for the detailed news link
1
Jio sets stage for another fight
over IUC, this time over
international calls
Reliance Jio Infocomm has called
upon the telecom regulator to
slash international call termination
rates to 6 paise a minute, and
then to zero, changing its stance
and breaking ranks with larger
rivals who want the fee to be
increased to Re 1 from 53 paise…
2
Indian e-commerce businesses may not be breaking even just yet but big-
ticket transactions by private equity (PE) and venture capital (VC) players
drove up investments in these ventures to $2.1 billion in the three months
to September. That’s an increase of 17% sequentially, data put together by
research firm Jefferies show. Indeed, 2017 has seen a resurgence in
inflows into e-retailing as investors believe consolidation and a focus on
costs will make ventures more viable…
Ecommerce still lures big bucks in India, investors push in $2 bn in
just 3 months
3
Maruti Suzuki vehicles
dominate top 10 selling list
Maruti Suzuki, the pioneer in
India’s personal transport
industry, strengthened its
leadership credentials this
financial year, with five of its top-
selling models monopolizing the
domestic leader-board for the first
time in a decade…
4
J&K set to bring petrol,
electricity, liquor under GST
Jammu and Kashmir (J&K) is
poised to be the first state to bring
petrol, electricity, liquor and real
estate under the state goods and
services tax (GST). A formal
decision is likely to be part of the
state’s budget for 2017-18,
scheduled for presentation in the
first week of January…
5
The Centre is considering an
incentive package of over ₹16,000
crore to boost exports in view of
“sluggish domestic demand and
competition in export markets’’.
Commerce Minister Suresh
Prabhu, in a letter to Finance
Minister Arun Jaitley, has made a
case for early decisions on key
issues affecting exports — such as
inadequate incentives and lack of
credit — to formulate a
meaningful mid-term review of
the foreign trade policy (FTP). A
number of critical export
promotion measures,…
Centre looking at ₹16,000-cr
export package
6
Five suitors put in bids for
stake in JP Power
Five investors have put in their
bids to buy at least a 30 per cent
stake in debt-ridden Jaiprakash
Power Ventures (JPVL), according
to sources close to the
development. While 11 players
had initially evinced interest in
picking up a stake in JPVL, that
number has now shrunk to five…
7
RIL, BP submit revised
investment plan for KG-D6 gas
finds
Reliance Industries and its partner
BP Plc. of UK on Monday
submitted a revised investment
plan for bringing to production the
satellite gas discoveries in the
flagging KG-D6 block. RIL and BP
plan to develop four deep sea
satellite gas finds,…
17 October 2017
2

Prime Focus
BSE Sensex
32,634
S&P CNX
10,231
Initiating Coverage | Sector: Media
CMP: INR89
TP: INR130 (+46%)
Buy
Set to run the show
Stock Info
Bloomberg
Equity Shares (m)
52-Week Range (INR)
1, 6, 12 Rel. Per (%)
M.Cap. (INR b)
M.Cap. (USD b)
Avg Val, INRm
Free float (%)
Forte in global media services to drive profitable growth
PRIF IN
298.9
124 / 63
-13/-25/5
27.4
0.42
11
65.0
n
n
n
Financial Snapshot (INR b)
Y/E MARCH
FY17 FY18E FY19E
n
Net Sales
21.5
24.7
28.4
EBITDA
4.8
5.5
6.5
Adj. NP
0.4
0.9
1.8
Adj.EPS (INR)
1.2
3.0
5.9
n
EPS Gr.%
LP 147.7
94.3
BV/Share
18.6
21.6
27.5
Adj. P/E (x)
73.0
29.5
15.2
P/BV (x)
4.8
4.1
3.2
Full-service media player set to run the show
EV/EBITDA (x)
8.5
7.0
5.4
RoE (x)
7.6
15.0
23.9
PFL, a full-service media player, has grown its revenue by 10x and EBITDA by 5x
RoCE (x)
8.3
9.7
14.1
over the past ten years. Post five years of strategic M&As (integration completed in
Shareholding pattern (%)
As On
Jun-17 Mar-17 Jun-16
Promoter
35.0
35.0
35.0
DII
0.0
0.0
0.0
FII
9.9
10.1
10.7
Others
55.1
54.9
54.3
FII Includes depository receipts
Prime Focus Ltd (PFL) is a full-service media player offering creative solutions,
including visual effects (VFX), animation, 3D conversion and media-focused ERP
solutions, in India and abroad.
The company turned profitable in FY17 post completion of the M&A integration in
FY15-16. In our view, the four M&A transactions in the last five years have allowed
PFL to become a strong media service player globally, which should drive 15%/18%
revenue/EBITDA CAGR over FY17-20E.
One of the top-4 Hollywood VFX service providers, PFL is well placed to benefit from
the steady rise in VFX budgets of the top Hollywood movie grossers.
We note that the demons of ~2.8x jump in net debt to INR13.9b and 50% equity
dilution over the last five years are now behind. Furthermore, improving EBITDA and
lower capex requirement are expected to help generate healthy FCF, improve RoIC to
19% and reduce net debt by ~68% to INR4.5b by FY20.
We thus initiate coverage on PFL with a Buy rating and a target price of INR130 (46%
upside), based on SOTP-based valuation, ascribing 10x (industry average) on FY19E
EBITDA.
FY15-16), the company turned profitable in FY17. We believe M&A has allowed PFL
to become a strong player in the media service industry globally, which should
drive steady 15% revenue CAGR over FY17-20E to reach INR32.8b. Besides this, the
scale benefits and cost synergies, particularly in the Creative segment, should drive
18% EBITDA CAGR to reach INR 7.8b over the same period.
Creative segment – Animating growth
Creative segment, which operates through its 80%-held subsidiary, Prime Focus
World (PFW), has significantly enhanced its competitive position post the merger
with Double Negative (DNeg), one of the top-4 Hollywood VFX service providers.
Enjoying a healthy USD250m order pipeline (v/s USD100m in FY14), Creative
segment (77% of revenues in FY17) is expected to exhibit revenue CAGR of 16%
over FY17-20E to reach INR26.2b. We note that 90% of the top 25 movie grossers
are VFX-heavy (in the last three years), and the budgets for the same continue
expanding (from 10% to 25-30% of top 25 movie grossers in last ten years). Thus,
Creative segment’s target market – Hollywood VFX industry – continues to grow in
high-single-digits. The segment’s cost synergies (as incremental projects relocate to
low-cost centers) should also drive steady margin improvement. We expect EBITDA
CAGR of 22% over FY17-20E to reach INR6.4b.
Prime Focus
Set to run the show
Aliasgar Shakir
+
91 22 3982 5423
aliasgar.shakir@motilaloswal.com
Please click here for Video Link
17 October 2017
3

Tech and India FMS to remain steady
Tech business (16% revenue in FY17), which operates through its 74%-held
subsidiary, Prime Focus Technology (PFT), offers cloud-based media ERP solutions to
global media houses. Notably, the company does not face direct competition from
peers in this business. PFT’s content digitization endeavor has allowed it to become
a dominant player in India, and it has partnered with anchor broadcasters like Star
TV. Operating with an order book of ~USD200m, the company is expected to exhibit
revenue/EBITDA CAGR of 15%/16% over FY17-20 to reach INR5.3b/INR1.5b. PFT’s
recent investments in developed markets, breakthrough in Latin America and
inherent lumpy revenue growth profile have the potential to drive significantly
better-than-expected performance. Its other business, the India Film Management
Services (FMS) (7% revenue contribution in FY17), is a dominant pre- and post-
production equipment/service provider to the film industry. This business is
expected to grow its revenue and EBITDA at 8% and 3%, respectively, over FY17-20E
as large production houses turn to captive resources.
M&A phase behind; expect steady RoCE, FCF improvement
The company underwent 50% equity dilution, and grew gross debt from INR5.4b to
INR15.2b over FY12-17. This can be ascribed to the FCCB repayment woes, the four
M&A transactions over FY14-16 and also reclassification of INR2.4b preference
capital as debt (based on Ind-AS). However, with no further need for M&A,
incremental cash flow should be utilized toward debt repayment. Additionally,
provisioning of the long-pending INR2b debtors has lowered debtor days (from 130
in FY14 to ~40 in FY17). We expect moderate capex of INR1.75b (7% capex to sales),
and improving profitability on a leaner balance sheet should drive RoIC to 19% by
FY20. FCF generation (after deducting net interest cost) should increase to INR4.6b
in FY20 from INR0.7b in FY17. With cumulative FCF generation of INR12.0b over
FY17-20E, the current INR15.2b gross debt is expected to reduce significantly.
Valuation and view
The stock is trading at adj. P/E of 15.2x and EV/EBITDA of 5.4x on FY19E basis. Using
SOTP, we value Creative segment at 10x EV/EBITDA, Tech/Tech-enabled services at
10x EV/EBITDA
(industry average)
and Indian FMS at 6x EV/EBITDA, arriving at a TP of
INR130. The higher valuation multiple for Creative and Tech/Tech-enabled business
is attributed to its healthy profit growth and sturdy competitive position in both the
businesses. India FMS business also offers steady profitability, but limited growth
opportunities – and thus low valuations. We believe its improving return ratios and
FCF generation offer strong re-rating potential. We initiate coverage with a
Buy
rating and a target price of INR130, offering 46% upside.
17 October 2017
4

Contrarian investing
Please refer our report dated
23 June 2017
17 October 2017
Thematic: Contrarian investing
Contrarian Investing – Quarterly update
A review of our contrarian investment strategies
Our thematic strategy note on
Contrarian investing,
published in June’17 gives a
detailed account of the subject matter. In this note we have reviewed the
performance of our strategies. Also, since we have used quarterly rebalancing to
test our hypothesis, we run the updated quintiles as on 30
th
September and present
key findings along with our top contrarian bets.
The key takeaways from 2QFY18 quintiles
n
n
Please refer our report dated
23 August 2017
n
n
Our analysis suggested that neutral to moderately popular stocks deliver
significant outperformance, even bettering the performance of the most
popular stocks.
In this quarter, neutral to moderately popular stocks
outperformed the benchmark BSE-100 as well as the most popular stocks. The
most popular stocks delivered the worst return in this quarter.
Our findings proved that out-of-favor low P/E stocks deliver disproportionate
returns, significantly beating the benchmark. In contrast, the performance of
high P/E stocks is dismal.
In this quarter, low P/E stocks delivered the best
returns, whereas the high P/E quintile delivered the worst returns, validating our
thesis.
Similarly, out-of-favor low P/CF stocks deliver disproportionate returns,
significantly beating the benchmark. In contrast, the performance of high P/CF
stocks is dismal.
We also note that in some sub-themes, the returns from a quintile deviate from
the long term pattern highlighted in our initial detailed note. However, this is in
line with the trends observed even in the long term study – where returns can
deviate for a quarter here and there but over a long period, the hypothesis is
proven right. For example, in the Popularity theme, instead of Quintile -4,
Quintile-3 has delivered best returns in 2QFY18.
Our findings suggested that a simple strategy of investing in stocks for which
analyst consensus has changed from “net sell to net buy” with a holding period
of one year has delivered 24.0% annual returns over the last 10 years.
Net Sell to Net Buy stocks for 2QFY18: Stocks which satisfies this criterion for
2QFY18 are – ACC, Havells, BEML, CG Power, Divis, Nestle, NMDC
Best delta: Consensus change from net sell to net buy
n
n
As a part of our analysis, we
have divided BSE100 in 5
groups of 20 – Quintile-1
(Q1), Quintile-2 (Q2),
Quintile-3 (Q3), Quintile-4
(Q4) and Quintile-5 (Q5),
respectively, with Q1 being
composed of the most
popular stocks and so on
Top Contrarian Picks
We highlight our top contrarian Buy and Sell picks based on the various themes we
have covered in this note as well as in the past –
Popularity, Relative Valuations,
Net Sell to Net Buy, Consensus SELLs.
Contrarian BUYs:
Axis Bank, Sun Pharma, HPCL, Dabur, RECL.
Contrarian SELLs:
Eicher Motors, Wipro, LIC Housing Finance, Bajaj Finance, GAIL.
17 October 2017
5

Reliance Industries
Expert Speak
GST: A change for the better
Economy to benefit as the new tax mechanism stabilizes
We hosted a conference call with Mr Pratik Jain (partner and leader indirect tax at PWC
India) to understand his views on how Goods & Services Tax (GST) transition has been
absorbed by the economy post its implementation in July this year. He believes that GST –
one of the most important structural reforms of India – should contribute significantly
toward the economy by way of promoting more investment and manufacturing in India over
the long term. However, Mr Jain agreed that the first 100 days of implementation have not
been as s
14 October 2017
GST
Q2FY18 Results Update | Sector: Oil & Gas
16 October 2017
Mr. Pratik Jain
Partner, National leader –
Indirect tax, PwC India
Mr. Pratik Jain is a national
leader – Indirect tax in PwC
India. He is a member of the
Institute of Chartered
Accountants of India and a
law graduate. Pratik has been
involved with several India
and MNCs & advises them on
tax planning, management,
dispute resolution and policy
related issues. He also plays
an active role in formulation
of the GST policy and is
actively involved/ consulted
by industry and industry
associations. Pratik regularly
contributes in public
debates/discussions on tax
policy related issues and is
member of tax committees of
leading trade bodies. He
chairs the GST committee of
CII (Northern region). Pratik
has been a member of Tax
Advisory Group of
Organization of Economic Co-
operation & Development
(OCED).
First 100 days of GST implementation – some hits and misses
n
n
n
n
n
GST transition in the initial months of rollout has been smoother than expected
from the government’s perspective, with no significant protests in the industry,
barring textiles, which was completely outside the tax purview in the pre-GST era.
The real issues surfaced during the August filing, largely with respect to the
infrastructure and technology of the GST-filing portal GSTN. With last-minute law
modifications and finalization continuing until 30 June, GSTN was never seamlessly
tested and will take time to stabilize. Against this backdrop, the government had to
extend the deadline for filing of August returns to October.
Of ~6.5m businesses that were expected to file returns for July, only ~4.5m have
actually done the filing, indicating a low level of compliance.
Corporates are realizing that GST is structurally good for the economy, but not so
simple in terms of compliance.
The GST Council has approved a white paper on the GST rates with a view to review
and reduce the rates, especially the 28% slab, under which 14% of the commodity
and services are covered.
Some relief granted on initial provisions to facilitate smooth
transitioning
n
n
To facilitate smooth transitioning to GST, the government has (a) extended
deadline for the implementation of e-way bills and the reverse charge mechanism
for unregistered dealers until April 2018 and (b) provided relief to exporters to
address their concerns related to rising working capital requirements by reducing duties for certain categories
of exporters and introducing E-wallets by April 2018.
Mr Jain believes that the system of e-way bill is much ahead of time and the reverse charge mechanism is not
required.
17 October 2017
6

Backward/hilly area exemptions unlikely to be restored in full under GST
n
n
n
n
In the erstwhile regime, companies establishing manufacturing units in backward areas were granted certain
tax incentives in the form of excise/ VAT exemptions. Under the GST regime, these exemptions have been
restricted to 58% of CGST (net of input tax benefits). These benefits are likely to be lower than what were
availed in the earlier regime.
Certain units in the backward areas were operating as contract manufacturers for large brand owners. For
some of the products (which were earlier subject to excise levy on a MRP-based mechanism with abatements)
manufactured in these entities, the excise duty exemption was availed based on the MRP of the goods sold.
However, under GST, the exemptions will be restricted only to the extent of value-add (job work charges).
State-based VAT refunds granted previously are not continued in the GST regime. Hence, there is a need for
state-specific schemes for such businesses.
Several industry bodies have made representations to the government for the disadvantaged situation with
these changes. Unresolved issues may invite various litigations in future.
Other issues
n
n
Input tax credit of ~650b claimed:
Input tax credit (ITC) of INR650b has been claimed from the erstwhile
regime, which far exceeds the government expectations. This includes (i) tax credit carried forward, (ii) traders
claiming excise credit under one-time opportunity, who were subjected only to VAT in the earlier regime and
(iii) deemed credit of 40-60% excise duty depending on the slab of GST. Mr Jain believes that businesses have
claimed certain duties which were not eligible and large amount of this ITC will be disputed.
Anti-profiteering:
Government is rigorously implementing these rules to ensure passage of benefit to
consumers in the form of lower prices. This may be possible by addressing consumer complaints and audit of
books by investigating officers.
17 October 2017
7

Fund Folio
Reliance Industries
Indian Mutual Fund Tracker
AUM rises for the 16th consecutive quarter
n
Database Periodical |14 October 2017
16 October 2017
Q2FY18 Results Update | Sector: Oil & Gas
n
n
Domestic MFs maintained their positive momentum in September – industry average AUM increased for the
16th consecutive quarter in 3QCY17 (+7.3% QoQ) to touch a new high of INR21t. On a YoY basis, average AUM
increased 29.9% (INR4.8t) in September 2017, primarily on account of inflows in growth (equity), income and
liquid funds, backed by increased participation of domestic investors in equity schemes.
Equity AUM rose for the 10th consecutive month in September to scale a new high of INR6.6t (+2.4% MoM
and +40.8% YoY), led by an increase in equity scheme sales (INR343b, +5.7% MoM). Redemptions rose 27%
MoM to INR154b and market indices were down (Nifty -1.3% MoM), leading to a fall in net inflows (INR189b, -
7% MoM).
Equity AUM, as % of total AUM, rose 100bp MoM to 32.3% in September. Equity AUM now accounts for 5% of
India’s market capitalization.
The month saw a notable change in sector and stock allocation of funds. On an MoM basis, the weights of
NBFCs, Healthcare and Technology increased, while those of Banks (PSU and Private), Cements, Metals,
Capital Goods, Consumer and Telecom showed signs of moderation.
NBFC sector’s weight reached a new high of 8.4% (+30bp MoM and +190bp YoY). As a result, the sector
overtook Capital Goods to take the third position in sector allocation of mutual funds – it was at the sixth
position 12 months ago.
After increasing for 15 consecutive months, the weight of Metals declined in September to 3.7% (-10bp MoM).
Healthcare’s weight increased (+20bp MoM) to 6.5% in September after two consecutive months of decline.
Of the top 10 stocks in terms of value increase MoM, three were from Healthcare.
Bajaj Finance, which entered the Nifty-50, was one of the preferred stocks among MFs in September, with net
buying by 12 funds. Value increased by INR12.1b, with the stock up 2.9% for the month.
Interglobe Aviation was also one of the preferred stocks among MFs in September, with net buying by 11
funds. Value increased by INR12.3b, despite the stock delivering negative return of 10.5% during the month.
Vedanta, one of the least preferred stocks among MFs in September, saw net selling by 12 funds. Value
decreased by INR2.8b, despite the stock gaining 1.9% in the month.
Some interesting facts
n
n
n
n
n
n
n
Exhibit 1:
Equity AUM, as % of India’s market cap, is at all-
time high of 5% (80bp YoY)
Exhibit 2:
AUM touched a new high of INR21t
AUM rises by 2.8x
against Nifty rise of
1.7x in last 5 years
7,965
5,703
5,735
Average AUM (INR t)
Nifty Index
7,949
8,611
Equity incl. ELSS AUM % to Mktcap
Indian Mkt Cap (INR t)
112
111 114 108
106
117
126 126
122 125
133 132
132
9,789
4.2 4.3
4.4
4.4 4.4 4.4 4.5
4.6
4.6
4.7 4.7
4.9
Flows: Net inflows in September down 7% MoM to INR189b
n
Mutual funds’ gross inflows remained higher (INR343b, +5.7% MoM) in September. However, there was a
massive rise in redemptions (INR154b, +27% YoY). Consequently, net inflows fell to INR189b (-7% MoM) in the
month
17 October 2017
8

Exhibit 3: Monthly trend of sales, redemptions and net amount raised by mutual funds (toward equity)
375
250
125
0
-125
-250
Inflows in Equity Incl. ELSS (INR b)
Net Inflow/Outflow in Equity Incl. ELSS (INR b)
Redemptions in Equity Incl. ELSS (INR b)
343
189
-154
Exhibit 4:
Yearly trend of net inflows by mutual funds
(toward equity)
Exhibit 5:
Yearly trend of sales and redemptions by mutual
funds (toward equity)
999
Net Inflow/Outflow in Equity Incl. ELSS (INR b)
906
266 311
14
-158
495
77
-156 -104
549
Sale in Equity Incl. ELSS (INR b)
Redemptions in Equity Incl. ELSS (INR b)
1,082
720
1,206
494
690 574
414 447
1,728 1,866
2,337
-816
-409 -481
-848
-1,317
-498 -571 -551
-712 -822
CY07 CY08 CY09 CY10 CY11 CY12 CY13 CY14 CY15 CY16 CY17
YTD
CY07 CY08 CY09 CY10 CY11 CY12 CY13 CY14 CY15 CY16 CY17
YTD
-1,338
Sector-wise weight: MoM increase seen in NBFCs, Healthcare and Technology
n
n
n
In September, MFs showed interest in NBFCs, Healthcare and Technology—these sectors saw an MoM increase
in weight. Banks (PSU and Private), Cements, Metals, Capital Goods, Consumer and Telecom saw an MoM
decrease in weight.
Private Banks (17.4%) had the top sector holding in September, followed by Auto (9.7%), NBFCs (8.4%) and
Capital Goods (8.0%).
PSU Banks, Cement and Telecom were the sectors witnessing a highest decline in value on an MoM basis.
Exhibit 6: MFs weight in Nifty (%)
OW/UW to Nifty(pp)
4.6
1.8
3.0
1.4
1.3
1.1
0.3
29.0
10.0
9.7
9.3
6.0
5.8
5.5
5.2
5.1
5.0
4.6
1.6
MFs Weight in Nifty (%)
1.1
1.0
0.6
0.6
17 October 2017
9

16 October 2017
Q2FY18 Results Update | Sector: Financials - NBFC
Bajaj Finance
Buy
BSE SENSEX
32,634
Bloomberg
Equity Shares (m)
M.Cap.(INR b)/(USD b)
52-Week Range (INR)
1, 6, 12 Rel. Per (%)
Avg Val, (INR m)
Free float (%)
S&P CNX
10,231
BAF IN
546.9
843.8/13.1
1578 / 762
7/50/63
1518
42.1
CMP: INR1,889
n
n
TP: INR2,300(+22%)
Strong growth continues; RoE of 20%+ despite large capital raise
n
Financials & Valuations (INR b)
Y/E March
2017 2018E 2019E
NII
54.7 77.4 104.8
PPP
36.4 51.7 73.1
PAT
18.4 26.2 36.5
EPS (INR)
32.0 45.7 63.7
EPS Gr. (%)
43.6 42.8 39.3
BV/Sh. (INR)
167
285
339
RoA on AUM (%)
3.3
3.5
3.6
RoE (%)
21.6 20.2 20.4
Payout (%)
14.0 12.5 12.5
Valuations
P/E (x)
59.0 41.3 29.7
P/BV (x)
11.3
6.6
5.6
Div. Yield (%)
0.2
0.3
0.4
n
n
Bajaj Finance’s (BAF) 2QFY18 PAT increased 37% YoY to INR5.57b (2% miss).
Performance across parameters was largely in line with the trend.
AUM continued its robust growth trajectory (+38% YoY, +5% QoQ) to reach
INR721b, led by impressive growth in consumer finance (+42% YoY) and
commercial business (+57% YoY).
Cross-sell personal loans grew 54% YoY to INR76b (11
th
consecutive quarter of
50%+ AUM growth).
The size of this book is now within sniffing distance of
the CD financing book (INR80b).
This validates the cross-sell expertise of
BAF’s business model – on-board the customer through CD loans, and then
cross-sell personal and other loans.
Our estimate is that BAF has tapped just
~15% of its CD financing customer base for personal loans, implying huge
opportunity ahead.
Asset quality and margins were stable QoQ. Management remains cautious on
LAP and SME growth ahead, due to hyper competition and the lagged impact
of demon and GST.
Valuation and view:
BAF, a dominant player in the consumer durables
financing segment, continues to reap the benefits of healthy consumer
demand, increasing its market share in consumer and also other businesses.
Within the consumer financing business, it has demonstrated its ability to
cross-sell, as evident from strong growth in the personal loans portfolio over
the past three years. Its focus on the SME and commercial lending segments
may depress margins and RoE, but will keep growth strong. At the same time,
it is proactive in detecting early warning signals with regard to asset quality.
We maintain our estimates for FY18/20 and reiterate
Buy
with a target price
of INR2,300 (30x September 2019 EPS, implied 6x PBV).
17 October 2017
10

16 October 2017
Q2FY18 Results Update | Sector: Consumer
Colgate
Buy
BSE SENSEX
32,634
Bloomberg
Equity Shares (m)
M.Cap.(INRb)/(USDb)
52-Week Range (INR)
1, 6, 12 Rel. Per (%)
12M Avg Val (INR M)
Free float (%)
S&P CNX
10,231
CLGT IN
272.0
297.0 / 4.6
1176/862
-7/-4/-2
372.0
49.0
CMP: INR1,064
TP: INR1,325(+25%)
Volumes miss, but high rural salience to drive performance
n
Financials & Valuations (INR b)
Y/E Mar
2017 2018E 2019E
39.8
42.0
48.5
Net Sales
9.4
10.6
12.5
EBITDA
5.8
6.4
7.8
PAT
21.2
23.4
28.6
EPS (INR)
-5.7
10.2
22.1
Gr. (%)
46.8
49.2
52.5
BV/Sh (INR)
50.4
48.7
56.2
RoE (%)
49.3
47.7
55.1
RoCE (%)
P/E (x)
P/BV (x)
50.1
22.7
45.5
21.6
37.2
20.3
n
n
n
n
Estimate change
TP change
Rating change
Colgate’s (CLGT) volumes declined 0.9% YoY (est. of +7%) in 2QFY18.
Realization was slightly lower than expected, and thus, sales grew only 2.7%
YoY to INR10.8b. EBITDA was up 9.4% YoY (est. of +17.1%) to INR3b. Adj. PAT
declined 2.1% YoY to INR1.8b (est. of +10.7%). Market share in toothpaste
shrunk 170bp YoY (-30bp QoQ) to 54%, while that in toothbrush contracted
110bp YoY (+50bp QoQ) to 45.5%.
Gross margin continued its upward trajectory,
expanding 50bp YoY to 63.2%.
The sharp decrease in ad spends (-370bp YoY to 11% of sales) and other
expenses (-90bp YoY to 17.1%) was slightly offset by a 60bp increase in staff
cost to 7.6%. Thus, EBITDA margin expanded 170bp YoY to 27.7%.
Management commentary highlights:
1) Demand has been picking up post
GST implementation. 2) Wholesale channel saw a gradual recovery in 2QFY18.
Balance sheet comments:
1) Negative net working capital improved further by
INR620m YoY and by INR671m over March 2017, led by a reduction in absolute
inventory and an increase in other payables, more than offsetting higher
debtors. 2) Other assets increased, particularly in current loans and advances
and other current assets, which meant that there was only marginal accretion
in cash YoY at the end of September 2017.
Valuation and view:
We cut our estimates by 4% to factor in the earnings miss.
CLGT has strong moats in the form of distribution, category development
efforts, brand strength, R&D and its concentrated focus on oral care. New
campaigns focusing on the twice-a-day brushing habit and the likely enhanced
herbal focus are expected to boost prospects. CLGT will also be a significant
beneficiary of a rural market recovery, as its rural market share is
disproportionately higher than its urban market share. We maintain
Buy,
with
a revised target price of INR1,325 (INR1,385 earlier), based on 42x Sep’18 EPS,
in line with average multiple for the past three years.
FY18
2Q
-0.9
10,849
2.7
3,970
6,879
63.4
3,873
35.7
3,006
27.7
9.4
392
89
2,703
927
34.3
1,776
-2.1
3QE
10.0
9,839
12.5
3,524
6,315
64.2
3,779
38.4
2,536
25.8
18.5
403
120
2,253
755
33.5
1,498
17.2
4QE
8.0
11,567
11.5
4,302
7,265
62.8
4,419
38.2
2,846
24.6
16.5
414
137
2,569
845
32.9
1,724
20.9
FY17
-1.5
39,818
2.9
14,768
25,050
62.9
15,606
9,444
FY18E
3.0
42,036
5.6
15,379
26,656
63.4
16,050
10,607
FY18
2QE
7.0
10,903
4.0
FY17
1Q
2Q
3Q
4Q
1Q
Toothpaste Volume Gr %
5.0
4.0
-12.0
-3.0
-5.0
Net Sales
10,131 10,566
8,746 10,375
9,781
YoY Change (%)
8.8
9.5
-8.6
2.2
-3.5
COGS
3,822
3,910
3,159
3,877
3,584
Gross Profit
6,309
6,656
5,587
6,498
6,197
Gross Margin (%)
62.3
63.0
63.9
62.6
63.4
Other opera ti ng Expens es
4,197
3,909
3,446
4,055
3,979
% to sales
41.4
37.0
39.4
39.1
40.7
EBITDA
2,113
2,748
2,141
2,443
2,218
Margins (%)
20.9
26.0
24.5
23.5
22.7
YoY Growth (%)
3.7
8.1
-10.3
1.2
5.0
Depreci a ti on
316
333
342
341
373
Fi na nci a l other Income
101
113
109
80
125
PBT
1,897
2,527
1,908
2,182
1,970
Ta x
640
714
630
756
606
Rate (%)
33.7
28.3
33.0
34.6
30.8
Adj PAT
1,257
1,813
1,278
1,426
1,364
YoY Change (%)
1.3
15.6
-12.8
-0.5
8.5
Note: We had factored in 7.5% GST related accounting impact in our numbers.
Quarterly Performance
Y/E March
(INR Million)
Var.
(%)
-0.5%
39.2
38.2
1,332
403
8,514
2,740
32.2
5,774
23.7
0.7
1.2
1,581
470
9,495
3,133
33.0
6,362
25.2
12.3
10.2
3,217
-6.6%
29.2
17.1
333
135
3,019
-10.5%
1,011
33.5
2,008
-11.6%
10.7
E: MOSL Estimates
17 October 2017
11

16 October 2017
2QFY18 Results Update | Sector: Financials
Federal Bank
Buy
BSE SENSEX
32,634
Bloomberg
Equity Shares (m)
M.Cap.(INRb)/(USDb)
52-Week Range (INR)
1, 6, 12 Rel. Per (%)
Avg Val, INRm
Free float (%)
Federal Bank (FB) recorded robust PPoP growth of 5%/23% QoQ/YoY (INR5.8b,
8% beat), led by 12%/24% QoQ/YoY NII growth, and controlled opex growth
(+5%/+18% QoQ/YoY; 7% beat) on curbed employee expenses (+7% YoY).
n
NII growth came in at 12%/24% QoQ/YoY (3% beat), aided by 25% YoY loan
growth and an increase in the CD ratio to 83% (75%/80% in 2QFY18/1QFY18).
NIM expanded 18bp QoQ to 3.31%, as 1QFY18 was impacted by interest
Financials & Valuations (INR b)
reversal of INR160m. Other income fell 13% QoQ as the base quarter had a
Y/E Mar
2018E 2019E 2020E
lumpy INR2b treasury income component. CI ratio rose 20bp QoQ to 50.8%.
NII
36.5
43.6
51.8
n
Loan growth of 6%/25% QoQ/YoY was broad-based, with strong growth across
OP
23.6
28.6
34.2
segments. Corporate growth was the strongest at 7%/43% QoQ/YoY, with
NP
10.2
12.9
16.0
retail/agri loans also showing strong traction (+17%/+24% YoY).
NIM (%)
3.2
3.2
3.2
n
Asset quality was stable, as total slippages declined ~11% QoQ to INR2.8b
EPS (INR)
5.5
6.6
8.2
(adjusted for lumpy slippage of INR1.05b in 1Q); GNPA/NNPA declined to
EPS Gr. (%)
15.1
19.9
23.9
2.39%/1.32% (-3bp/-7bp QoQ), with the slippage ratio down to 1.8% v/s 2.9%
BV/Sh. (INR)
63.4
69.2
76.6
in 1QFY18. Recoveries and upgrades increased 66% QoQ to INR1.6b, while
ABV/Sh. (INR) 57.3
62.6
68.6
write-offs came in at INR502m.
ROE (%)
9.6
10.0
11.3
n
Other highlights: a) FB witnessed 45% growth in new account opening, b)
ROA (%)
0.8
0.9
0.9
business growth is picking up outside Kerala, with 31% YoY growth in each of
Payout (%)
20.3
19.7
19.7
Valuations
retail/SME loans and 26% SA growth, c) Fed-fina contributing INR1.5b of loans
P/E(X)
22.5
18.8
15.2
each month.
P/BV (X)
2.0
1.8
1.6
Valuation and view:
We believe FB’s asset quality concerns, which are largely
legacy issues, are now largely behind. The bank is ahead of its corporate lending
peer banks on the asset quality curve, especially with its opportunistic entry into
the mid-commercial segment. Considering asset quality distractions in the PSU
space, we believe FB is well positioned to gain market share in highly rated
corporates. Post QIP, the bank is comfortably positioned with respect to capital
(Tier 1 ratio of 14.1%). We largely maintain estimates for FY18/19 and reiterate
Buy
with a target price of INR146 (2x Sept 2019 BV) based on the RI model.
n
S&P CNX
10,231
FB IN
1,719.0
139.2/2.1
125 / 62
7/25/58
1002
100.0
CMP: INR125
TP:INR146 (+17%)
Strong operating performance; Growth continues with asset quality stable
17 October 2017
12

RESULTS
FLASH
Dewan Housing
TP: INR690 (+24%)
Buy
16 October 2017
Results Flash | Sector: Financials-Banks
BSE SENSEX
32,634
S&P CNX
10,231
CMP: INR559
n
We will revisit our estimates
post earnings call/management
interaction.
Growth surprises positively; re-rating to continue
Conference Call Details
Date:
October 17, 2017
Time:
3PM IST
Dial-in details: 022 3938
1079
Financials & Valuations (INR b)
Y/E March
2018E 2019E
NII
18.3
22.8
PPP
21.0
25.8
Adj. PAT
11.8
14.4
EPS (INR)
37.6
46.0
EPS Gr. (%)
27.1
22.1
BV (INR)
282
320
RoAA (%)
1.2
1.3
RoE (%)
14.1
15.3
Payout (%)
17.4
17.4
Valuations
P/E (x)
14.4
11.8
P/BV (x)
1.9
1.7
P/ABV (x)
1.9
1.7
Div. Yield (%)
1.0
1.3
n
n
2020E
27.9
31.4
17.5
56.0
21.8
366
1.3
16.3
17.4
9.7
1.5
1.5
1.5
n
n
n
n
Dewan Housing Finance’s (DEWH) 2QFY18 PAT grew 26% YoY to INR2.9b. The
quarter was characterized by sturdy AUM growth, a healthy decline in the C/I
ratio, continued decline in cost funds, and mild expansion in the return ratios.
AUM grew 25% YoY to INR940b, largely driven by disbursement growth of 50%
YoY. DEWH reported disbursements of INR100b, the highest in the last 14
quarters. Even Sanctions grew 68% YoY to INR142b. We believe strong growth
during the quarter is driven by lumpy disbursements towards non retail loans.
We await clarification.
Loan mix is now more skewed toward LAP (+120bp QoQ) and builder finance
(+40bp QoQ). The contribution of home loans reduced by 180bp QoQ to 63.7%
of the loan mix. On a YoY and QoQ basis, non retail loans contributed 60%+ of
the incremental growth.
NIM remained largely unchanged at 3.04%, although we note of a secular
decline in cost of funds (-10bp QoQ to 8.63%). Funding mix remained largely
stable, with banks and NCDs contributing 43% and 40%, respectively.
Opex grew 21% YoY to INR1.7b, manifesting PPoP of INR5.4b (+36% YoY) and a cost-
to-income ratio of 23.9% (-140bp QoQ). The continued focus on cost rationalization
is likely to translate into higher PAT in the medium term, in our view.
Asset quality was stable, with a GNPA ratio at 0.96%.
Valuation and view:
DEWH is a focused play on low-ticket housing. This, along
with the new-found opportunities in LAP and builder finance, is likely to keep
its AUM on a high-growth trajectory. We believe the continued focus on cost
rationalization and a secular decline in CoF are likely to result in higher return
ratios and further re-rating in the medium term.
Buy
with a TP of INR690 (2x
September 2019E BVPS; Implied 14x EPS).
FY17
2Q
3Q
21,227
23,151
16,307
18,001
4,920
5,150
21.0
20.8
451
514
5,371
5,664
18.3
21.6
1,398
1,497
6.1
9.1
3,972
4,167
23.2
26.9
450
450
3,522
3,717
1,196
1,269
2,326
2,448
29.0
31.7
16.0
16.9
38.5
28.0
26.0
26.4
34.0
34.2
4Q
22,835
17,475
5,360
22.6
943
6,303
29.1
1,717
10.8
4,586
37.7
830
3,756
1,273
2,483
30.9
16.7
33.1
27.2
33.9
1Q
23,529
17,869
5,660
24.0
549
6,209
28.3
1,570
15.4
4,640
33.4
830
3,810
1,205
2,605
29.3
19.8
34.4
25.3
31.6
FY18
2Q
3Q
25,034
25,785
19,034
19,320
6,000
6,466
22.0
25.5
1,108
700
7,108
7,166
32.4
26.5
1,698
1,748
21.4
16.7
5,411
5,418
36.2
30.0
1,070
900
4,341
4,518
1,408
1,446
2,933
3,072
26.1
25.5
24.6
23.0
10.8
16.0
23.9
24.4
32.4
32.0
(INR Million)
FY17
FY18
4Q
27,220
20,498
6,723
25.4
620
7,343
16.5
1,777
3.5
5,566
21.4
906
4,660
1,487
3,173
27.8
23.0
14.5
24.2
31.9
86,531
66,536
19,995
19.8
2,182
22,177
21.4
5,973
8.7
16,204
26.9
2,180
14,024
4,754
9,270
27.1
18.5
45.7
26.9
33.9
101,569
76,720
24,848
24.3
2,978
27,826
25.5
6,792
13.7
21,034
29.8
3,706
17,328
5,545
11,783
27.1
20.1
23.9
24.4
32.0
DEWH: Quarterly performance
Y/E March
Interes t Income
Interes t Expens es
Net Interest Income
YoY Growth (%)
Fees a nd other i ncome
Net Income
YoY Growth (%)
Opera ti ng Expens es
YoY Growth (%)
Operating Profits
YoY Growth (%)
Provi s i ons
Profit before Tax
Ta x Provi s i ons
Profit after tax
YoY Growth (%)
Loa n growth (%)
Borrowi ngs growth (%)
Cos t to Income Ra ti o (%)
Ta x Ra te (%)
E: MOSL Es ti ma tes
1Q
19,319
14,754
4,565
14.5
275
4,840
15.5
1,361
8.4
3,479
18.6
450
3,029
1,015
2,014
16.2
18.3
20.4
28.1
33.5
17 October 2017
13

RESULTS
FLASH
16 October 2017
Results Flash | Sector: Others
Delta Corp
Buy
BSE SENSEX
32,634
S&P CNX
10,231
CMP: INR227
n
TP: INR232 (+2%)
We will revisit our estimates
post earnings call/management
interaction.
Results in-line (GST adjusted)
DELTA reported overall revenue of INR1,453m (est. of INR1,800m), as against
INR1,343m in 2QFY17, marking growth of 8.2%.
n
EBITDA margin expanded 290bp to 45.1% (est. of 38%) in 2QFY18. EBITDA grew
15.6% YoY to INR655m (est. of INR684m).
n
Consequently, adjusted PAT stood at INR433m (est. of INR413m) in 2QFY18, as
against INR323m in 2QFY17, implying growth of 34%.
n
Casino gaming revenues grew 17% to INR1,450m, while hospitality revenue
rose 19% to INR188m. Online gaming revenues stood at INR241m.
n
GST of INR351m was netted off from gross revenue in the reported result. As a
result, top-line growth seems subdued and EBITDA margin expansion appears
significant. Removing its impact, EBITDA margin contracted 590bp YoY on
account of amalgamation of online gaming.
Key questions for management
n
Whether any merger is on radar for online gaming business
n
Expected commencement of Sikkim airport
n
Plans to ramp-up Rummy, and introduction of new online games/fantasy
leagues
Valuation and view:
We will revisit our estimates post interaction with
management. We have a
Buy
rating, valuing the stock at 30x FY19E EPS with a TP
of INR232. Based on current estimates, the stock trades at 41x/29x FY18E/19E EPS
Conference Call Details
Date:
October 17, 2017
Time:
5PM IST
Dial-in details: 022 3960
0734
Financials & Valuations (INR b)
2017 2018E
Y/E Mar
Net Sales
4.5
6.8
EBITDA
1.6
2.5
NP
0.7
1.5
EPS (INR)
3.1
5.6
EPS Gr. (%)
125.5
82.8
BV/Sh. (INR)
39.7
59.2
RoE (%)
8.1
11.9
RoCE (%)
8.7
11.4
P/E (x)
74.3
40.7
P/BV (x)
5.7
3.8
2019E
8.7
3.3
2.1
7.7
38.8
65.4
12.4
12.5
29.3
3.5
Consol. - Quarterly Earning Model
Y/E March
Net Sales
YoY Change (%)
Total Expenditure
EBITDA
Margins (%)
Depreciation
Interest
Other Income
PBT before EO expense
Extra-Ord expense
PBT
Tax
Rate (%)
MI & P/L of Asso. Cos.
Reported PAT
Adj PAT
YoY Change (%)
Margins (%)
E: MOSL Estimates
1Q
1,087
34.6
671
415
38.2
91
87
9
246
-46
292
85
29.2
4
202
170
2,539.9
15.6
FY17
2Q
3Q
1,343 1,036
43.8
3.4
776
723
567
313
42.2
30.2
93
89
87
82
11
11
399
152
2
5
397
91
22.9
-16
322
323
494.1
24.1
147
40
27.2
6
101
105
-9.4
10.1
4Q
1,081
5.3
737
344
31.8
87
94
19
182
0
181
64
35.4
3
114
114
-29.3
10.5
1Q
1,286
18.4
833
453
35.2
89
70
37
332
-18
350
127
36.1
1
223
211
24.4
16.4
FY18
2Q
3QE
1,453 1,864
8.2
80.0
798 1,230
655
634
45.1
34.0
94
112
22
0
86
70
624
592
0
0
624
194
31.1
-2
433
433
33.8
29.8
592
178
30.0
0
414
414
296.2
22.2
FY17
4QE
1,892
75.0
1,230
662
35.0
112
0
70
620
0
620
186
30.0
0
434
434
281.3
23.0
4,547
21.2
2,907
1,640
36.1
361
350
49
978
42
936
280
29.9
2
654
683
118.8
15.0
FY18E
6,827
50.1
4,369
2,458
36.0
423
80
210
2,165
0
2,165
671
31.0
3
1,491
1,491
118.2
21.8
FY18
2QE
1,800
34.0
1,116
684
38.0
105
33
70
616
0
616
203
33.0
0
413
413
27.6
22.9
(INR M)
Var
%
-19
-4
1
1
5
5
17 October 2017
14

RESULTS
FLASH
16 October 2017
Results Flash | Sector: Financials - Banks
DCB Bank
Neutral
BSE SENSEX
32,634
S&P CNX
10,231
CMP: INR189
n
TP: INR198 (+4%)
We will revisit our estimates
post earnings call/management
interaction.
Strong Operating Profit, Lower Provisions Aid YoY PAT Growth
DCB Bank reported PPoP growth of -9%/+23% QoQ/YoY (1% above estimate),
driven by NII beat of 5% (NII included INR72m of interest on IT refund). Other
income grew 6% YoY but declined 24% QoQ to INR3.1b (10% miss) as 1QFY18
Conference Call Details
had a lumpy treasury income component of INR214m, leading to total income
Date:
October 17, 2017
growth of 24% YoY (1.7% QoQ decline).
Time:
4PM IST
n
Opex growth of 25% YoY was higher than total income growth, leading to CI
Dial-in details: 022 3938
ratio of 60.3% (+300bp QoQ), reversing the declining trend of the past few
1003
quarters. Provisions at INR302m (+14% YoY) were 4% above estimates, leading
to PAT growth of 21% YoY (-10%/21% QoQ/YoY growth, 7% miss)
n
Loan book grew 7%/21% QoQ/YoY to INR173b, led by strong growth in AIB
(+21%), MSME (+31%) and corporate book (+28%) while other smaller
Financials & Valuations (INR b)
categories such as CV/CE (+51%), gold (+21%) and construction finance (+81%)
Y/E MARCH 2018E 2019E 2020E
NII
9.6
11.7
13.9
also showed strong growth. Corporate book inched up to 17% of the book.
OP
5.1
6.6
8.2
n
Absolute GNPA/NNPA grew 5%/11% QoQ to INR 3.2b/1.6b driven by 16%/10%
NP
2.5
3.3
4.1
sequential growth in mortgage/AIB GNPA (INR1.16b/INR561m). Overall
EPS (INR)
8.1
10.6
13.3
slippages moderated to 2.2% as compared to 2.7% in 1Q. In percentage terms,
EPS Gr. (%)
15.6
31.2
25.1
GNPA/NNPA came in at (1.8%/0.9%, +6bp/-2bp QoQ).
BV/Sh. (INR)
91.7 101.9 114.7
RoE (%)
11.0
12.0
13.3
n
Other highlights:
a) CASA ratio declined by 100bp to 26% v/s 27% in 1Q, b) CAR
RoA (%)
0.9
1.0
1.0
stood at 14.65%, with Tier 1 ratio of 12.9% c) Number of branches reached 306
P/E (x)
23.5
17.9
14.3
(vs 290 in 1QFY18).
P/BV (x)
2.1
1.9
1.7
Valuation and view:
While we expect loan growth to stay ahead of system loan
growth, operating leverage is likely to take time to play out, weighing down on
return ratios in the near term. We will revisit our estimates post earnings call.
17 October 2017
15

Persistent Systems
BSE SENSEX
32,634
Bloomberg
Equity Shares (m)
M.Cap.(INRb)/(USDb)
52-Week Range (INR)
1, 6, 12 Rel. Per (%)
Avg Val, INRm
Free float (%)
S&P CNX
10,231
PSYS IN
80
53.0 / 0.8
703 / 558
4/6/-21
90
69.3
16 October 2017
Q2FY18 Results Update | Sector: Technology
CMP: INR663
n
TP: INR780(+18%)
Buy
Marching upward on profitability
Top client weakness offset by Parx:
PSYS’ 2QFY18 revenue of USD118m (+4.5%
QoQ, in-line) was a function of weakness in the top client (-3% QoQ) being
offset by incremental revenue from the integration of Parx (USD1.9m; 1.7pp)
and strength in Europe (22% QoQ organic growth). While weakness in the top
customer was attributed to seasonality in IP (taking away any worries beyond
this quarter), a return to double-digit organic growth in Digital (12% QoQ) was
an encouraging sign.
In-line profitability despite onsite centricity:
Incremental growth contribution
from onsite (11.5% QoQ) and lower-margin Parx was detrimental to
profitability during the quarter. However, 140bp improvement in utilization
and 120bp optimization of G&A expenses drove EBITDA margin expansion of
90bp to 15.2%, ultimately meeting expectations of 15.4%. Higher-than-
expected PAT growth of 12.4%, despite in-line operational performance, was
led by higher other income.
Addition of new opportunities:
Barring the impact of seasonality, PSYS’ growth
drivers of Digital and IP associated with IBM continue to be significant
contributors. Additionally, new avenues of growth like (i) geographies of
Europe and Australia, (ii) products in the areas of IoT, Cloud, Analytics and
Security and (iii) partnerships with the likes of USAA and Partners HealthCare
provide new opportunities to capitalize on, driving expectations of 10.4% USD
revenue growth over FY17-20.
Valuation and view:
Our underlying thesis of margins bottoming out at the
beginning of FY18 post three consecutive years of decline seems to be on track,
as the dent created in 1Q has started seeing a sequential path upward. Despite
wage hikes spread across 2H, seasonal strength is likely to mitigate any
pressures as the company pulls on its operational levers, apart from being
supported by seasonal strength in flow-through IP revenue. We expect FY17-20
USD revenue/earnings CAGR of 10/16%. Our price target of INR780 discounts
forward earnings by 14x. Maintain
Buy.
Financials & Valuations (INR b)
2017 2018E 2019E
Y/E Mar
28.8
31.0
35.2
Net Sales
4.7
4.9
6.0
EBITDA
3.1
3.5
4.2
PAT
37.7
43.3
52.4
EPS (INR)
1.4
14.8
21.2
Gr. (%)
244.5 254.1 264.8
BV/Sh (INR)
17.0
17.9
20.8
RoE (%)
16.7
16.0
17.0
RoCE (%)
17.6
15.3
12.6
P/E (x)
2.7
2.6
2.5
P/BV (x)
n
n
Estimate change
TP change
Rating change
n
17 October 2017
16

Hindustan Media Ventures
BSE SENSEX
32,634
Bloomberg
Equity Shares (m)
M.Cap.(INRb)/(USD
52-Week
Range
1, 6, 12 Rel. Per (%)
Avg Val, INR m
Free float (%)
S&P CNX
10,231
HMVL IN
GST and RERA prune ad growth
73.4
19.6 / 0.3
n
A quarter of weak earnings:
Revenue fell 8% YoY (-11% QoQ) to INR2.1b
(below est. of INR2.3b) owing to subdued ad and circulation revenue. EBITDA
314 / 245
-6/-26/-33
dropped 10% YoY (-11% QoQ) to INR454m (est. of INR492m), largely led by a
8
decline in revenues and a rise of ~290bp in raw material cost. EBITDA margin
25.7
16 October 2017
2QFY18 Results Update | Sector: Media
CMP: INR250
TP: INR302(+21%)
Buy
Financials & Valuations (INR b)
Y/E Mar
2017 2018E 2019E
Net Sales
EBITDA
Adj. PAT
Adj. EPS (INR)
Gr. (%)
BV/Sh (INR)
RoE (%)
RoCE (%)
P/E (x)
P/BV (x)
9.3
2.1
1.9
25.8
6.0
159.0
18.2
17.4
9.7
1.6
9.5
2.1
1.9
25.6
-0.8
183.2
15.0
15.1
9.8
1.4
10.3
2.4
2.2
30.2
18.1
212.0
15.3
15.7
8.3
1.2
n
n
n
Estimate change
TP change
Rating change
Consolidated - Quarterly Earning Model
Y/E March
Net Sales
YoY Change (%)
Total Expenditure
EBITDA
Margins (%)
Depreciation
Interest
Other Income
PBT before EO expense
Extra-Ord expense
PBT
Tax
Rate (%)
Minority Interest & P/L of Asso. Cos.
Reported PAT
Adj PAT
YoY Change (%)
Margins (%)
E: MOSL Estimates
shrunk 50bp YoY (flat QoQ) to 21.5% (50bp above est. of 21%). PAT plunged
25% YoY (-9% QoQ) to INR409m (est. of INR445m).
High base, GST pull down ad business:
Ad revenue declined 8% YoY to INR1.6b
(est. of INR1.7b), mainly led by ~12% YoY volume decline due to GST, RERA and
a high base (UP elections last year). The strategy to boost yield saw the largest
impact on FMCG, health and fitness segment, partly offset by a 5% yield
improvement led by resurgence in Auto, BFSI and other sectors.
Circulation revenue growth on a freefall:
Circulation revenue continued to
decline (-7% YoY to INR500m v/s est. of INR581m) in 2QFY18, largely led by
lower realization/copy on intensified competition in Bihar.
Cut TP to INR302; maintain Buy:
We cut revenue/EPS estimates by 6%/10% for
FY18-19E on a weak 1HFY18 and moderate circulation/ad revenue.
Management indicated that the outlook has improved with the onset of the
festive season. We expect flat EPS in FY18 and 18% growth in FY19, led by a
recovery in ad/circular revenue of 9%/6%. We thus cut our TP to INR302 (prior:
INR 350), based on 10x P/E on FY19E EPS of INR30. Maintain
Buy.
1Q
2,392
6.8
1,823
569
23.8
50
47
201
673
0
673
186
27.6
0
487
487
16.9
20.4
FY17
2Q
2,295
1.4
1,791
504
22.0
52
41
338
749
0
749
202
27.0
0
547
547
20.9
23.8
3Q
2,303
-4.2
1,894
409
17.8
50
39
215
536
0
536
98
18.2
0
438
438
-7.5
19.0
4Q
2,343
3.1
1,770
573
24.4
50
34
167
655
0
655
191
29.1
41
424
424
-4.8
18.1
1Q
2,368
-1.0
1,858
510
21.5
53
25
251
683
0
683
203
29.7
32
448
448
-8.0
18.9
FY18
2Q
2,109
-8.1
1,655
454
21.5
49
29
204
580
0
580
141
24.4
29
409
409
-25.2
19.4
FY17
3QE
2,486
8.0
1,912
574
23.1
55
26
215
708
0
708
170
24.0
30
508
508
16.0
20.4
4QE
2,526
7.8
1,933
593
23.5
55
26
215
727
0
727
188
25.9
30
508
508
20.1
20.1
9,333
1.7
7,277
2,055
22.0
202
161
921
2,612
0
2,612
676
25.9
41
1,895
1,895
6.0
20.3
(INR m)
FY18E
9,489
1.7
7,359
2,130
22.4
212
105
885
2,698
0
2,698
703
26.0
121
1,874
1,874
-1.1
19.7
17 October 2017
17

Metals Weekly
Reliance Industries
Alumina continues to rise due to bauxite supply disruption
n
16 October 2017
14 October 2017
Q2FY18 Results Update | Sector: Oil Update
& Gas
n
n
n
n
Indian steel: Long product (TMT Mumbai) prices were down ~2% WoW. Sponge iron prices were down ~2%
WoW, while domestic scrap prices were unchanged. NMDC cut iron ore fines/lump prices by INR100/t. Pellet
prices were unchanged. Domestic HRC prices were unchanged.
Raw materials: Iron ore prices (China cfr) were unchanged as the market is quiet due to Chinese holidays.
Chinese iron ore port inventories were marginally higher. Thermal coal prices were up ~2% WoW. Coking coal
prices were down ~3% WoW. China's pellet import prices were unchanged.
Europe: HRC prices were unchanged. HRC product spreads were marginally higher. CIS HRC export prices were
up ~1% WoW. Rotterdam scrap prices remain weak, down ~1% WoW.
China: Local HRC and rebar prices were unchanged. Exports HRC were also unchanged amid holidays in China.
Base metals: Aluminum (cash LME) prices were up ~1% WoW. Alumina prices were marginally higher. Zinc
(cash LME) was up 4% WoW. Lead was up ~1% WoW. Copper was up ~2% WoW. Crude oil (Brent) prices were
down ~3% WoW.
17 October 2017
18

September 2017 Results Preview | Sector: Cement
ACC
Bloomberg
Equity Shares (m)
M. Cap. (INR b)/(USD b)
52-Week Range (INR)
1,6,12 Rel Perf. (%)
ACC IN
188.0
320 / 5
1869 / 1257
-5 / 11 / -8
CMP: INR1,702 TP: INR1,706 (0%)
Neutral
Financial Snapshot (INR Billion)
Y/E Dec
2016 2017E 2018E 2019E
Sales
EBITDA
NP
Adj. EPS (INR)
EPS Gr. (%)
BV/Sh (INR)
RoE (%)
RoCE (%)
Payout (%)
Valuations
P/E (x)
P/BV (x)
EV/EBITDA (x)
EV/Ton (x)
47
4
24
134
33
4
19
132
25
3
15
124
22
3
12
117
108
13
7
36
-4
461
8
8
88
124
15
10
51
41
482
11
11
59
139
19
13
67
31
513
13
13
54
156
23
15
78
17
507
15
15
108
n
Dispatches in 3QCY17 are estimated at 5.88mt (+16% YoY), led by
capacity ramp-up at Jamul and Sindri, and a favorable base from
the previous year. Average realizations are expected to fall 2.7%
QoQ (flat YoY) to INR4,389/ton due to weak pricing in most
regions.
n
Revenues are expected to increase 15.8% YoY to INR28.6b. EBITDA
margin is expected to be 10%, down 4.9pp QoQ (+0.9pp YoY).
n
EBITDA/ton is estimated at INR487 (+INR43 YoY, -INR248 QoQ) due
to weak realization. PAT is likely to increase 129% YoY to INR1.9b.
n
The stock trades at P/E of 25x /22x on CY18E/CY19E earnings,
15x/12x CY18E/CY19E EV/EBITDA and CY18E/CY19E EV/ton of
USD124/USD117. Maintain Neutral.
Key issues to watch out for:
Ø
Cement pricing recovery.
Ø
Volume growth and demand revival.
Ø
Ramp-up of new plant in east.
Quarterly Performance (Standalone)
Y/E December
Cement Sales (m ton)
YoY Change (%)
Cement Realization
YoY Change (%)
QoQ Change (%)
Net Sales
YoY Change (%)
Total Expenditure
EBITDA
Margins (%)
Depreciation
Interest
Other Income
PBT before EO Item
EO Income/(Expense)
PBT after EO Item
Tax
Rate (%)
Reported PAT
Adjusted PAT
Margins (%)
YoY Change (%)
E: MOSL Estimates
1Q
6.36
9.3
4,109
-9.4
-5.3
28,727
-0.4
24,953
3,774
13.1
1,434
188
1,131
3,283
0
3,283
937
28.5
2,346
2,346
8.2
-6.0
CY16
2Q
3Q
6.12
5.07
-1.3
-9.6
4,206
4,371
-4.1
-1.5
2.4
3.9
28,326
24,706
-4.3
-9.8
24,190
22,458
4,136
2,247
14.6
9.1
1,410
1,529
208
197
730
744
3,248
1,265
0
0
3,248
1,265
824
424
25.4
33.5
2,424
841
2,424
841
8.6
3.4
84.5
-28.1
4Q
5.45
-9.0
4,353
0.3
-0.4
26,346
-7.4
24,116
2,231
8.5
1,679
209
934
1,277
-428
849
44
5.2
805
1,233
4.7
-49.4
1Q
6.60
3.8
4,265
3.8
-2.0
30,997
7.9
27,579
3,418
11.0
1,650
252
1,101
2,617
0
2,617
502
19.2
2,115
2,115
6.8
-9.9
CY17
2Q
3QE
6.74
5.88
10.1
16.0
4,509
4,389
7.2
0.4
5.7
-2.7
33,125
28,613
16.9
15.8
28,175
25,751
4,951
2,862
14.9
10.0
1,621
1,660
225
200
1,663
1,500
4,768
2,502
0
0
4,768
2,502
1,550
575
32.5
23.0
3,218
1,926
3,218
1,926
9.7
6.7
32.7
129.1
(INR m)
CY16
CY17E
4QE
6.30
15.6
4,427
1.7
0.9
31,549
19.7
27,621
3,927
12.4
1,672
223
1,036
3,068
0
3,068
741
24.1
2,327
2,327
7.4
88.8
22.99
-2.7
4,218
-4.6
107,676
-5.8
95,159
12,518
11.6
6,052
826
3,503
9,143
-428
8,715
2,244
25.8
6,470
6,898
6.4
-7.4
25.52
11.0
4,398
4.3
124,284
15.4
109,126
15,158
12.2
6,603
900
5,300
12,954
0
12,954
3,368
26.0
9,586
9,586
7.7
39.0
17 October 2017
19

September 2017 Results Preview | Sector: Financials
Axis Bank
Bloomberg
Equity Shares (m)
M. Cap. (INR b)/(USD b)
52-Week Range (INR)
1,6,12 Rel Perf. (%)
Financial Snapshot (INR b)
Y/E March
2017 2018E
NII
180.9 192.4
OP
175.8 172.1
NP
36.8 52.3
NIM (%)
3.6
3.4
EPS (INR)
15.4 21.8
EPS Gr. (%)
-55.5 42.2
BV/Sh. (INR)
226.5 242.9
ABV/Sh. (INR)
203.1 214.9
RoE (%)
6.9
9.3
RoA (%)
0.6
0.8
Payout (%)
32.5 25.2
Valuations
P/E(X)
P/BV (X)
P/ABV (X)
Div. Yield (%)
32.9
2.2
2.5
1.0
23.1
2.1
2.3
0.9
AXSB IN
2395.0
1200 / 18
553 / 425
0 / -6 / -18
n
2019E
225.5
197.7
91.2
3.4
38.1
74.4
274.3
241.9
14.7
1.2
17.6
13.3
1.8
2.1
1.1
2020E
271.2
236.5
120.7
3.4
50.4
32.3
315.8
288.7
17.1
1.3
17.6
10.0
1.6
1.7
1.5
CMP: INR501
n
TP: INR524 (+5%)
Neutral
n
n
n
We expect AXSB to report ~14% loan growth, driven by continued
strong growth in the retail and SME segments. Overall deposit
growth is likely to be ~10%, bringing down the CD ratio, which is
elevated at ~96%.
Yield on loans would remain under pressure following MCLR
cuts/aggressive competition in the refinance market. Margins are
expected to stay flat QoQ at ~3.5%, weighed down further by
interest reversals.
Current watch-list stands at INR95b (~2.3% of customer assets) and
is expected to be done away with completely by FY19. While
slippages should moderate in 2Q, we expect them to remain at
elevated levels (4% annualized slippage ratio), leading to high credit
costs.
We estimate PAT at INR13.1b (flat QoQ) vs INR3.2b in a muted
2QFY17, weighed down by provisions.
AXSB trades at 1.8x FY19E BV and 13.3x FY19E EPS. Neutral.
Key issues to watch for
Ø
Quantum of corporate slippages from watch list and any revision in the
size of the same.
Ø
Quantum of loans rescheduled under 5:25, SDR and S4A.
Quarterly Performance
Net Interest Income
% Change (Y-o-Y)
Other Income
Net Income
Operating Expenses
Operating Profit
% Change (Y-o-Y)
Other Provisions
Profit before Tax
Tax Provisions
Net Profit
% Change (Y-o-Y)
Operating Parameters
NIM (Cal, %)
Deposit Growth (%)
Loan Growth (%)
CD Ratio (%)
Core CASA ratio (%)
Asset Quality
OSRL (INR b)
OSRL (%)
Gross NPA (INR b)
Gross NPA (on cust. assets, %)
E: MOSL Estimates
1Q
45,169
11.4
27,383
72,552
27,858
44,694
9.2
21,172
23,522
7,967
15,555
-21.4
3.7
16.3
21.2
96.4
40.0
73.6
2.1
95.5
2.5
FY17
2Q
45,139
11.1
25,397
70,535
29,534
41,002
13.0
36,227
4,774
1,584
3,191
-83.3
3.7
17.3
18.5
92.9
41.0
67.0
1.9
163.8
4.2
3Q
43,337
4.1
34,002
77,339
30,937
46,402
16.4
37,958
8,444
2,649
5,796
-73.4
3.5
9.6
10.1
93.6
42.0
63.4
1.8
204.7
5.2
4Q
47,286
3.9
30,132
77,418
33,670
43,747
-0.5
25,813
17,935
5,684
12,251
-43.1
3.7
15.8
10.1
90.0
45.0
53.8
1.4
212.8
5.0
1Q
46,161
2.2
29,998
76,160
33,248
42,912
-4.0
23,419
19,492
6,436
13,056
-16.1
3.5
10.0
11.8
97.9
0.0
FY18
2QE
47,308
4.8
29,700
77,008
34,874
42,134
2.8
22,500
19,634
6,577
13,057
309.2
3.5
9.8
13.5
96.1
FY17
3QE
48,737
12.5
30,450
79,187
37,011
42,176
-9.1
22,500
19,676
6,592
13,085
125.8
3.4
20.4
20.7
93.8
4QE
50,147
6.1
34,738
84,886
40,008
44,878
2.6
25,027
19,850
6,743
13,107
7.0
3.4
16.0
18.0
91.6
1,80,931
7.5
1,16,913
2,97,844
1,21,999
1,75,845
9.2
1,21,170
54,676
17,883
36,793
-55.3
3.6
15.8
10.1
90.0
45.0
53.8
1.4
212.8
5.0
(INR m)
FY18E
1,92,355
6.3
1,24,886
3,17,241
1,45,142
1,72,099
-2.1
93,447
78,653
26,349
52,304
42.2
3.4
16.0
18.0
91.6
220.3
5.0
237.1
5.7
249.7
5.8
250.2
5.5
0.0
0.0
250.2
5.5
17 October 2017
20

September 2017 Results Preview | Sector: Automobiles
Bajaj Auto
Bloomberg
Equity Shares (m)
M. Cap. (INR b)/(USD b)
52-Week Range (INR)
1,6,12 Rel Perf. (%)
BJAUT IN
289.4
906 / 14
3208 / 2510
7 / 8 / -2
CMP: INR3,164 TP:INR3,589 (+13%)
Buy
Financial Snapshot (INR b)
Y/E MAR
2017 2018E 2019E 2020E
Sales
EBITDA
NP
Adj. EPS (INR)
EPS Gr. (%)
BV/Sh. (INR)
RoE (%)
RoCE (%)
Payout (%)
Valuations
P/E (x)
P/BV (x)
EV/EBITDA (x)
Div. Yield (%)
23.9
5.4
17.7
1.7
218
21.9
4.8
16.2
2.1
247
18.2
4.4
13.0
2.5
280
15.6
4.1
11.1
4.1
321
218
44.2
38.3
132
-2.6
589
25.3
24.6
247
46.8
41.8
144
9.1
655
23.2
22.5
280
56.9
50.4
174
20.7
725
25.3
24.5
321
66.3
58.7
203
16.4
775
27.1
36.0
Key issues to watch
Ø
Update on demand of new launches, channel inventory and outlook
for FY18.
n
Overall volume increased ~3.8% YoY (+20.6% QoQ) to 1,072k units
due to ~6.5% YoY increase in export volume, while domestic
volumes increased by ~2.3% YoY. Volume growth was led by 3W,
as domestic 3W sales increased by 14.2% YoY, while 3W exports
grew by 13% YoY.
n
We expect realization to grow by 4.7% YoY (0.3% QoQ) led by
improvement in product mix. Consequently, net revenues are
expected to increase by ~8.7% YoY (+20.9% QoQ).
n
We expect EBITDA margin to contract by ~240bp YoY (+180bp
QoQ) to 19.1%, primarily due to higher commodity prices.
n
We expect PAT to remain flat YoY (+18.2% QoQ) at INR11.2b.
n
We have revised upward our total volume estimates by 1.2% in
FY18 and 2.2% in FY19, resulting in EPS increase of 5.2%/6.6% for
FY18E/FY19E.
n
The stock trades at 21.7x FY18E and 18x FY19E EPS; maintain
Buy.
Ø
Ø
Ø
Ø
Export demand outlook and pricing in key currency market.
Comments on 3W demand drivers in domestic market.
Comments on entry into electric 3Ws.
Strategy for KTM, Husqvarna; further details on partnership with
Triumph.
Quarterly Performance
Y/E March
Volumes ('000 units)
Growth YoY (%)
Realization (INR/unit)
Growth YoY (%)
Net Sales
Change (%)
RM/Sales %
Staff cost/Sales %
Oth. Exp./Sales %
EBITDA
EBITDA Margins (%)
Other Income
Interest
Depreciation
PBT
Tax
Effective Tax Rate (%)
Adj. PAT
Change (%)
E: MOSL Estimates
1Q
995
-1.8
57,784
4.5
57,480
2.7
67.2
4.7
7.7
11,763
20.5
2,671
2
775
13,657
3,873
28.4
9,784
2.2
FY17
2Q
1,032
-2.3
58,676
2.0
60,545
-0.4
67.0
4.3
7.4
12,961
21.4
3,420
7
770
15,605
4,378
28.1
11,228
6.7
3Q
852
-10.5
59,495
2.0
50,669
-8.7
66.8
4.8
7.9
10,439
20.6
3,193
3
772
12,858
3,612
28.1
9,246
(4.7)
4Q
788
-9.7
62,171
1.2
48,973
-8.6
67.8
4.6
9.2
9,060
18.5
2,936
2
757
11,236
3,218
28.6
8,018
(15.5)
1Q
888
-10.7
61,258
6.0
54,424
-5.3
70.0
5.0
7.8
9,384
17.2
4,573
2
753
12,881
3,642
28.3
9,469
(3.2)
FY18
2QE
1,072
3.8
61,411
4.7
65,803
8.7
69.7
4.3
7.0
12,537
19.1
4,000
3
775
15,760
4,570
29.0
11,189
(0.3)
FY17
3QE
1,035
21.5
62,025
4.3
64,165
26.6
68.8
4.4
7.3
12,670
19.7
3,200
3
785
15,082
4,449
29.5
10,633
15.0
4QE
962
22.1
64,794
4.2
62,314
27.2
67.7
4.5
8.4
12,225
19.6
3,394
3
823
14,794
4,401
29.8
10,393
29.6
3,666
(5.8)
59,419
2.4
217,827
(3.6)
67.1
4.6
8.0
44,384
20.4
12,220
14
3,073
53,516
15,081
28.2
38,436
(2.2)
(INR m)
FY18E
3,956
7.9
62,360
4.9
246,705
13.3
69.2
4.5
7.6
46,271
18.8
15,167
10
3,135
58,293
17,063
29.3
41,774
8.7
17 October 2017
21

September 2017 Results Preview | Sector: Media
HT Media
Bloomberg
Equity Shares (m)
M. Cap. (INR b)/(USD b)
52-Week Range (INR)
1,6,12 Rel Perf. (%)
HTML IN
230.5
22 / 0
109 / 70
0 / 8 / -1
CMP: INR97
n
n
n
n
n
n
n
n
TP: INR90 (-7%)
Neutral
Financial Snapshot (INR Billion)
Y/E MARCH
2017 2018E 2019E 2020E
Net Sales
EBITDA
Adj. NP
Adj. EPS (INR)
Adj. EPS Gr. (%)
BV/Sh (INR)
RoE (%)
RoCE (%)
Div. Payout (%)
Valuations
P/E (x)
P/BV (x)
EV/EBITDA (x)
Div. Yield (%)
13.1
1.0
10.8
0.4
13.2
0.9
9.0
0.4
12.4
0.9
8.2
0.4
11.4
0.8
6.7
0.4
24.5
3.0
1.7
7.4
-1.8
7.9
9.7
6.9
25.0
3.2
1.7
7.3
-0.8
7.3
8.7
6.9
26.3
3.1
1.8
7.8
6.9
7.3
8.6
6.5
27.5
3.3
2.0
8.5
8.6
7.4
8.9
5.9
96.8 103.6 111.0 119.0
We expect revenue to decline 3% YoY to INR5.8b.
Ad revenue is likely to decline 6% YoY to INR4.0b, as July and
August were impacted due to GST-led pressure on ad spends.
English print ad revenue decline ~10% YoY to INR2.34b impacted by
digital medium.
Hindi ad revenue is expected to remain flat at INR1.7b.
Radio ad revenue growth is expected to grow 5% to INR0.38b.
We expect circulation revenue to increase 6% YoY to INR0.8b.
EBITDA margin is expected to expand 160bp YoY to 10%.
Adjusted net profit is likely to come in at INR0.24b. The stock
trades at 13.2x FY18E and 12.4x FY19E EPS. Neutral.
Key things to watch for
Ø
YoY English ad growth (we expect ~10% YoY ad de-growth).
Ø
Ø
Hindi ad growth (we expect to remain flat).
EBITDA margin (we expect 10%).
Consolidated - Quarterly Earning Model
Y/E March
Net Sales
YoY Change (%)
Total Expenditure
EBITDA
Margins (%)
Depreciation
Interest
Other Income
PBT before EO expense
Extra-Ord expense
PBT
Tax
Rate (%)
Minority Interest & P/L of Asso. Cos.
Reported PAT
Adj PAT
YoY Change (%)
1Q
6,147
4.5
5,504
643
10.5
295
247
478
579
0
579
186
32.2
168
224
224
-9.5
FY17
2Q
6,022
0.2
5,518
505
8.4
304
245
780
736
0
736
224
30.5
202
309
309
-16.1
3Q
6,499
-4.6
5,394
1,105
17.0
312
241
549
1,100
0
1,100
36
3.3
150
914
914
32.9
4Q
5,853
-7.3
5,122
731
12.5
337
218
488
665
0
665
225
33.8
184
256
256
-40.7
1Q
5,990
-2.5
5,191
799
13.3
320
194
531
817
0
817
239
29.2
162
415
415
85.5
FY18
2QE
5,822
-3.3
5,238
585
10.0
363
236
552
538
0
538
129
24.0
168
240
240
-22.2
FY17
3QE
6,968
7.2
6,003
965
13.9
363
236
552
918
0
918
211
23.0
168
539
539
-41.0
4QE
6,275
7.2
5,406
868
13.8
363
236
552
821
0
821
195
23.7
168
459
459
79.4
24,521
-2.0
21,538
2,983
12.2
1,248
951
2,295
3,079
0
3,079
671
21.8
705
1,703
1,703
-1.9
(INR m)
FY18E
25,055
2.2
21,837
3,218
12.8
1,410
901
2,187
3,094
0
3,094
774
25.0
667
1,653
1,653
-2.9
17 October 2017
22

September 2017 Results Preview | Sector: Technology
Wipro
Bloomberg
Equity Shares (m)
M. Cap. (INR b)/(USD b)
52-Week Range (INR)
1,6,12 Rel Perf. (%)
WPRO IN
4925.5
1397 / 21
304 / 205
-4 / 6 / 7
n
CMP: INR284
n
TP: INR270 (-5%)
Neutral
Financial Snapshot (INR b)
y/e mar
2017 2018E 2019E 2020E
Sales
EBITDA
PAT
EPS (INR)
EPS Gr. (%)
BV/Sh. (INR)
RoE (%)
RoCE (%)
Payout (%)
Valuations
P/E (x)
P/BV (x)
EV/EBITDA
(x)
Div Yld (%)
16.8
2.7
10.8
0.3
15.6
2.6
10.5
0.0
14.5
2.2
8.9
0.0
13.2
2.1
8.0
3.5
550.4 564.5 616.8 663.3
108.8 111.9 125.5 136.6
83.3
16.9
-6.3
16.9
13.6
5.8
82.2
18.2
7.8
16.2
13.7
0.0
88.0
19.5
7.1
16.4
15.0
0.0
96.9
21.5
10.1
16.1
15.3
46.5
n
n
n
n
n
105.9 109.3 128.9 138.3
In the previous quarter, Wipro had guided -0.5% to +1.5% QoQ CC
growth for 2Q. The weak guidance reflected the pressure in
Healthcare vertical and sluggishness in Communications and Retail.
We expect growth to be at the mid-point of the guided range at
+1%. A cross-currency tailwind of 110bp would lead to USD
revenue growth of 2.1% QoQ.
However, on an organic YoY basis, growth expectations for the
quarter translate into 1% growth.
We expect EBIT margin in IT Services to decline by 60bp because
of the organic revenue softness and partial wage hikes.
We expect overall EBIT margin to decline by 50bp, led by
improved profitability in the Products business.
Our PAT estimate is INR19.5b, -5.9% QoQ on account of the dip in
profitability, and lower other income.
The stock trades at 15.6x FY18E and 14.5x FY19E earnings.
Neutral.
Key issues to watch for
n
Revenue growth guidance for 3QFY18.
n
Commentary on Healthcare, Communications and Retail
verticals.
n
Commentary on large deal wins and ramp-up schedule.
FY18E
2QE
3QE
2,013
2,054
2.1
2.0
138,122 143,358
1.4
3.8
0.3
4.7
27.7
28.7
12.2
12.2
16.2
17.3
15.5
16.5
3,846
3,645
22.3
22.3
19,544
21,190
-5.9
8.4
-5.5
0.5
4.0
4.7
170,905 174,290
82.1
82.1
46.1
46.2
FY17
4QE
2,094
2.0
146,710
2.3
4.9
29.0
12.2
17.7
16.9
1,973
22.3
20,672
-2.4
6.9
4.6
177,925
82.1
46.1
7,705
4.9
550,402
7.4
28.9
12.8
17.9
16.1
20,254
23.2
83,326
-6.3
16.9
181,482
77.4
46.4
(INR m)
FY18E
8,132
5.6
564,451
2.6
28.5
12.3
17.0
16.2
14,544
22.3
82,172
-1.4
18.2
177,925
77.3
46.2
Quarterly Performance (IFRS)
Y/E March
Revenue (USD m)
QoQ (%)
Revenue (INR m)
QoQ (%)
YoY (%)
GPM (%)
SGA (%)
IT Serv. EBIT (%)
EBIT Margin (%)
Other income
ETR (%)
PAT
QoQ (%)
YoY (%)
EPS (INR)
Headcount
Util excl. trainees (%)
Attrition (%)
Offshore rev. (%)
Fixed Price (%)
E: MOSL Estimates
1Q
1,931
2.6
135,992
-0.2
11.1
29.1
13.0
17.8
16.1
4,848
22.9
20,518
-8.2
-6.2
4.2
173,863
79.7
16.5
45.6
56
FY17
2Q
3Q
1,916
1,903
-0.8
-0.7
137,657 136,878
1.2
-0.6
10.0
6.4
28.9
29.4
13.2
13.0
17.8
18.3
15.8
16.4
4,958
5,120
22.2
23.3
20,672
21,094
0.8
2.0
-7.5
-5.6
4.3
4.4
174,238 179,129
82.8
81.9
16.6
16.3
46.1
46.5
56.4
57.7
4Q
1,955
2.7
139,875
2.2
2.6
28.0
11.9
17.7
16.1
5,328
24.2
19,340
-8.3
-13.5
4.0
181,482
84.8
16.3
47.2
58.3
1Q
1,972
0.9
136,261
-2.6
0.2
28.7
12.8
16.8
16.0
5,079
22.3
20,765
7.4
1.2
4.3
166,790
82.1
15.9
46.4
1915-
17 October 2017
23

In conversation
1. GRUH FINANCE: Expect disbursement growth to be over 30%;
Sudhin Choksey, MD
n
n
n
n
n
n
n
Experiencing good demand in affordable housing segment.
Many developers have shown interest in middle-income group (MIG) segment
of affordable housing.
Expect significant supply in the MIG segment in the second half of next year.
Expect disbursement growth to be over 30 percent.
Do not expect real estate prices to go up any further.
18 percent out of total 28 percent growth in disbursements from new customer
acquisition.
Spreads in first half of FY18 was at 3.3 percent. However, expect spreads to not
go below 3 percent for FY18.
2. BHARAT FINANCIAL: Merger will enable us to give higher
ticket size loans; MR Rao, MD & CEO
n
n
n
n
n
n
Bharat Financial's shareholders will get 639 shares of the bank for every 1,000
held.
Deal likely to be completed in 9-10 months.
IndusInd scored on all parameters for a merger.
Previous partnership with IndusInd made it easier to agree to merger terms.
Will score lot of operating synergies which will take a couple of years to come in.
Merger will enable company to give higher ticket size loans.
3. KANSAI NEROLAC: Hope to maintain margin at current levels;
HM Bharuka, VC & MD
n
n
n
n
n
Last quarter (Q1) had excise duty included in the topline and because of goods
and services tax (GST) there is no excise duty, so GST is removed from this
quarter.
Total volume growth is 18 percent, decorative growth is more than 20 percent
and industrial segments grew by 10 percent this quarter.
Paint industry will continue to have double-digit volume growth.
Volumes this quarter were partially aided by GST restocking and early festive
season.
Hope to maintain margin at current levels.
4. FUTURE RETAIL: Focus on strong like-to-like growth this
festive season; Rakesh Biyani, Joint MD
n
n
n
Festive season expected to show similar growth rate as the last few quarters.
Tricky to gauge the sentiment this Diwali because it has come a bit early.
However, happy with the business during earlier festivals that is Dussehra and
Onam.
As actual Diwali day comes closer, the last minute footfalls are important in
terms of doing business.
Very excited about the Hyercity acquisition. Looking forward to work along with
the Hypercity team and build a more viable and successful model. At present
not looking for any new acquisition.
17 October 2017
24

n
n
n
n
Currently focus is on existing businesses and on driving strong like-to-like
growth.
About Lifestyle, because of the Goods and Services tax (GST), sales were
preponed and so early part of Q2 was impacted but again during Dussehra and
Onam the footfalls were strong. Expansion strategy in Brand Factory has worked
well and would continue to drive for higher Same Store Growth.
Expansion strategy in Brand Factory has worked well and would continue to
drive for higher Same Store Growth in Lifestyle business.
Plan to open 10 Centrals and about 16 odd Brand Factories by the end of FY18.
17 October 2017
25

From the think tank
1. Make in India: The smartphone challenge
n
History shows that manufacturing follows trade. In 1914, India was the world’s
largest importer, not of British textiles, but of British textile machinery. That is,
India was becoming a major textile manufacturer. This happened because
merchants of British textile had developed mature markets in India and had
themselves started manufacturing. The case with smartphones would be no
different if things were that simple. Unfortunately, complications abound. Morgan
Stanley expects India to overtake the US as the second-largest smartphone
market in 2018, with an expected compound annual growth rate (CAGR) of 23%.
India will grow nearly five times faster than the world’s largest smartphone
market China, where growth has decelerated. Morgan Stanley estimated that
there are only 225 million smartphone subscribers in the country, accounting for
18% of the total population. Therefore, there is tremendous untapped potential
for growth.
2. GST anti-profiteering body: Here is why Narendra Modi
government must trust the market, take this action
n
President Xi Jinping of China may not have the world eating out of his palm yet.
Revenue secretary Hasmukh Adhia, in an interview to this newspaper, has
suggested the government may not, in fact, end up using the anti-profiteering
authority that was an integral part of the GST architecture. Though the GST
Council has cleared the setting up of the authority, the Cabinet is yet to approve
this—only once this is done can the authority be set up and start operations. As
Adhia has said, the government has not got any major complaints on
profiteering by firms—in the sense of not passing on the benefits of GST rates
being lower than what they were paying before the new system came into
place. The complaints got, he said, were about a few restaurants and real estate
and were local in nature, not even national. While a very small number of
complaints is natural right now, given the way the GST was designed, the rates
were fixed in such a manner that they were more or less the same as those
being paid pre-GST.
3. Strengthening India’s corporate bond market
n
Low private investment, sputtering exports, and stunted private consumption
growth have raised calls for a fiscal stimulus, with some even suggesting
breaching the fiscal deficit target of 3.2% of gross domestic product (GDP) for
the year. A fundamental reason for the slowdown in the economy is the twin
balance sheet problem. India’s companies have been bogged down by high
debt, and the balance sheet of India’s public sector banks, which have
historically financed economic growth, have been weakened by persistently high
bad loans. This has led to a slowdown in the credit cycle, pushing companies to
increasingly tap non-bank sources of financing such as external commercial
borrowings (ECBs), commercial paper (CP), or corporate bonds. Former Federal
Reserve chairman Alan Greenspan famously referred to the bond market as the
“spare tyre” of the credit market that can supplement the banking system
during periods of distress. In India’s case, this is reflected in the fact that the
share of non-bank credit to total new debt rose from just 20% in 2015 to about
53% in 2016.
17 October 2017
26

International
4. The emerging blocs in the Afghan great game
n
While unveiling its long-awaited Afghanistan strategy, the US embraced India
and dropped Pakistan as its ally. Broadly speaking, it occurred against the
backdrop of the formation of a tripartite alliance of Russia, China and Pakistan.
Donald Trump’s move can further push Pakistan towards Russia and its “iron
brother” China, and away from the US. Also, the two blocs differ in their
approaches towards Afghanistan, and the destiny of this war-ravaged country is
aligned with the interests of these states. So in this prevailing geopolitical
quagmire and hostile environment, will terrorism scale down and will
Afghanistan progress in terms of peace and stability? The US and its allies have
spent a tremendous amount of dollars, shed their soldiers’ blood, even used a
munition popularly called “Mother Of All Bombs” in order to eradicate terrorists
but to no avail. It seems that the US’ Afghan approach is not the right one.
Besides, the interests of many rival states clash in this unfortunate land, further
breeding terrorism.
17 October 2017
27

Click excel icon
for detailed
valuation guide
Rs
Valuation snapshot
P/E (x)
P/B (x)
ROE (%)
FY17 FY18E FY17 FY18E FY17 FY18E FY19E
24.3
28.0
24.4
49.2
46.7
18.6
51.8
48.6
36.1
25.2
22.3
25.2
43.7
31.6
22.0
59.6
29.3
33.9
27.1
30.3
25.9
32.7
17.9
19.3
35.7
NM
40.4
43.8
13.0
25.2
30.6
23.1
NM
16.4
34.5
9.3
NM
21.5
848.0
15.7
93.2
59.0
48.5
31.0
24.5
18.9
63.5
37.7
18.8
38.9
17.2
26.6
23.9
22.3
35.1
40.9
18.4
38.4
38.5
19.5
22.9
20.4
19.7
23.8
27.5
21.8
46.4
25.6
23.8
22.7
90.0
23.2
27.2
18.9
20.9
28.2
19.0
33.4
30.3
17.4
19.9
25.1
14.5
NM
10.2
8.2
7.9
6.8
22.9
17.3
14.0
16.5
41.6
34.1
23.2
20.1
14.8
52.0
33.8
15.4
29.8
15.8
4.5
6.1
5.5
7.3
7.7
2.9
16.2
9.3
3.7
3.5
7.5
3.2
2.7
6.6
2.6
13.8
5.0
2.3
2.8
2.3
2.5
5.5
2.0
1.3
5.0
0.7
5.2
4.6
1.2
3.9
3.5
0.9
0.6
0.7
0.5
0.9
0.3
0.7
1.2
0.4
0.8
11.3
5.7
3.3
4.1
2.2
19.0
7.0
4.5
4.6
3.1
3.9
5.3
4.9
6.3
6.9
2.6
12.1
7.7
3.1
3.2
6.5
2.9
2.4
5.7
2.3
11.3
4.4
2.1
2.3
2.3
2.0
4.8
1.9
1.3
4.4
0.7
4.7
3.3
1.2
3.4
3.1
0.9
0.6
0.6
0.5
0.8
0.3
0.7
1.1
0.4
0.8
6.6
4.7
2.9
3.5
2.0
15.6
6.3
4.0
4.0
2.7
20.3
23.1
25.3
16.2
15.8
16.9
37.1
20.8
10.6
13.9
35.7
14.2
6.4
20.3
9.8
25.6
17.1
6.9
10.8
9.5
9.9
18.3
10.2
7.2
15.3
-27.0
13.8
12.3
9.0
18.9
11.5
4.0
-6.7
4.2
1.4
10.1
-8.4
3.6
-0.2
2.7
0.9
21.6
15.1
12.0
18.0
14.4
32.5
18.9
25.5
12.4
19.4
15.8
23.8
23.2
19.3
17.8
14.8
36.1
21.8
17.3
13.8
34.0
13.5
10.8
20.4
11.0
26.7
17.2
9.3
11.4
2.5
10.0
18.8
8.6
6.3
16.9
3.5
15.0
13.0
6.7
18.3
12.4
6.1
-5.2
6.2
5.8
10.9
4.6
3.2
7.0
3.0
4.6
20.1
15.1
13.2
18.6
14.1
33.0
18.6
27.6
14.7
18.2
17.7
27.0
25.3
22.9
20.5
17.3
36.4
24.0
18.3
14.8
31.4
14.3
11.5
23.0
27.4
34.2
22.6
14.7
11.8
8.6
10.5
19.7
9.3
6.9
19.0
7.2
16.3
13.3
12.6
19.5
14.2
12.4
3.0
9.1
7.3
11.2
5.4
5.9
11.4
6.1
8.3
20.2
22.4
15.0
19.2
15.6
31.8
17.8
30.6
18.5
18.5
Company
Automobiles
Amara Raja
Ashok Ley.
Bajaj Auto
Bharat Forge
Bosch
CEAT
Eicher Mot.
Endurance Tech.
Escorts
Exide Ind
Hero Moto
M&M
Mahindra CIE
Maruti Suzuki
Tata Motors
TVS Motor
Aggregate
Banks - Private
Axis Bank
DCB Bank
Equitas Hold.
Federal Bank
HDFC Bank
ICICI Bank
IDFC Bank
IndusInd
J&K Bank
Kotak Mah. Bk
RBL Bank
South Indian
Yes Bank
Aggregate
Banks - PSU
BOB
BOI
Canara
IDBI Bk
Indian Bk
OBC
PNB
SBI
Union Bk
Aggregate
NBFCs
Bajaj Fin.
Bharat Fin.
Capital First
Cholaman.Inv.&Fn
Dewan Hsg.
GRUH Fin.
HDFC
Indiabulls Hsg
L&T Fin Holdings
LIC Hsg Fin
Reco
Buy
Buy
Buy
Buy
Neutral
Buy
Buy
Buy
Neutral
Buy
Neutral
Buy
Not Rated
Buy
Buy
Buy
CMP
(INR)
TP
% Upside
EPS (INR)
(INR) Downside FY17 FY18E FY19E
25
14
11
13
3
17
15
8
1
36
2
16
20
29
3
28.0
4.6
132.3
13.1
473.1
93.3
612.7
23.5
20.0
8.1
169.1
54.3
5.4
248.6
19.8
11.7
25.6
32.9
5.3
7.0
144.4 174.3
18.3
25.5
540.8 698.6
94.2 126.8
826.7 1,119.2
29.6
39.3
37.1
45.8
8.9
10.8
185.0 197.1
69.5
81.7
9.9
11.8
285.5 381.7
20.0
61.3
15.1
24.5
681
854
127
145
3,222 3,589
643
726
22,117 22,781
1,732 2,029
31,736 36,487
1,142 1,229
721
732
205
279
3,774 3,868
1,367 1,585
234
-
7,848 9,417
437
562
700
719
Neutral
Neutral
Buy
Buy
Buy
Buy
Neutral
Buy
Neutral
Buy
Buy
Buy
Buy
521
190
153
125
1,857
274
58
1,717
74
1,085
521
32
368
524
188
212
139
2,066
366
56
2,000
91
1,197
651
36
446
1
-1
39
11
11
34
-3
16
24
10
25
11
21
15.4
7.0
5.0
4.8
56.8
15.3
3.0
48.1
-31.3
26.8
11.9
2.5
14.6
21.8
8.4
1.7
5.4
68.2
14.5
2.8
60.9
3.9
32.4
17.2
1.9
18.5
38.1
10.4
6.1
6.8
82.6
16.6
3.2
78.6
8.3
41.0
22.5
3.8
22.9
Buy
Neutral
Neutral
Neutral
Buy
Neutral
Buy
Buy
Neutral
138
137
307
53
271
115
134
252
127
217
141
323
49
333
150
184
341
135
57
3
5
-6
23
30
38
35
6
6.0
-14.8
18.8
1.5
29.3
-31.6
6.2
0.3
8.1
9.5
-11.2
30.1
6.4
34.4
17.1
5.8
14.6
9.0
20.8
6.6
47.0
8.6
38.3
21.4
11.0
26.8
19.1
Buy
Neutral
Buy
Buy
Buy
Neutral
Buy
Buy
Buy
Neutral
1,889
1,019
763
1,127
559
517
1,764
1,294
204
658
2,300
900
925
1,400
690
490
2,020
1,450
230
730
22
-12
21
24
24
-5
15
12
13
11
32.0
21.0
24.6
46.0
29.6
8.1
46.8
69.0
5.2
38.2
45.4
29.9
32.8
56.0
37.7
9.9
52.2
84.2
6.8
41.6
62.9
54.9
42.4
68.1
47.1
11.7
58.2
105.6
10.1
48.9
17 October 2017
28

Company
Manappuram
M&M Fin.
Muthoot Fin
PNB Housing
Repco Home
Shriram City Union
STF
Aggregate
Capital Goods
ABB
Bharat Elec.
BHEL
Blue Star
CG Cons. Elec.
CG Power & Indu.
Cummins
GE T&D
Havells
K E C Intl
L&T
Pennar Eng.
Siemens
Solar Ind
Suzlon Energy
Thermax
Va Tech Wab.
Voltas
Aggregate
Cement
Ambuja Cem.
ACC
Birla Corp.
Dalmia Bharat
Grasim Inds.
India Cem
J K Cements
JK Lakshmi Ce
Ramco Cem
Orient Cem
Prism Cem
Shree Cem
Ultratech
Aggregate
Consumer
Asian Paints
Britannia
Colgate
Dabur
Emami
Godrej Cons.
GSK Cons.
HUL
ITC
Jyothy Lab
Marico
Reco
Not Rated
Buy
Buy
Buy
Buy
Buy
Buy
CMP
(INR)
104
431
502
1,498
637
2,066
1,101
TP
% Upside
EPS (INR)
(INR) Downside FY17 FY18E FY19E
-
8.6
9.2
9.7
481
11
7.1
13.9
17.8
550
10
29.5 38.7
44.4
1,750
17
31.6 48.1
65.1
800
26
29.1 33.7
38.4
2,700
31
84.3 118.3 155.3
1,320
20
55.6 80.0 102.4
P/E (x)
P/B (x)
ROE (%)
FY17 FY18E FY17 FY18E FY17 FY18E FY19E
12.1 11.3
2.6
2.4
24.0 22.3 21.4
60.9 31.1
3.9
3.6
6.5
12.0 14.2
17.0 13.0
3.1
2.6
19.4 21.8 21.2
47.4 31.1
4.5
4.1
13.8 13.8 16.6
21.9 18.9
3.5
3.0
17.4 17.1 16.7
24.5 17.5
2.7
2.4
11.7 14.6 16.8
19.8 13.8
2.2
2.0
11.7 15.0 16.9
31.8 25.7
5.1
4.4
16.1 17.1 18.0
68.8
27.2
62.8
61.4
46.0
19.0
33.9
67.0
56.8
25.2
27.1
14.0
68.4
47.9
24.4
31.5
19.7
34.3
34.9
57.2
49.4
34.9
70.8
16.8
31.8
28.2
56.3
25.2
NM
397.5
48.8
41.7
37.2
55.7
61.7
50.1
44.4
43.2
51.7
31.7
65.2
31.9
34.5
50.5
60.4
25.5
30.9
46.4
42.8
38.4
32.5
41.3
50.5
22.9
24.6
10.9
56.3
40.8
17.6
32.2
17.0
31.6
30.6
40.2
35.0
24.3
43.6
16.2
23.8
23.9
40.3
25.1
35.1
31.1
37.0
43.5
31.6
52.7
53.2
43.5
41.7
42.6
45.3
31.3
55.8
28.9
39.5
46.5
8.7
5.6
1.0
10.0
25.0
1.2
6.6
9.5
10.3
4.8
3.2
1.4
6.4
8.8
-1.4
4.3
3.2
5.3
3.9
2.9
3.9
2.3
4.9
1.7
1.1
3.8
3.3
4.4
3.2
5.7
8.5
4.6
3.5
14.8
20.2
22.7
11.7
14.8
12.6
6.7
42.7
7.2
6.5
17.6
7.6
4.3
0.9
9.4
18.5
1.1
6.2
8.3
9.3
4.1
2.9
1.3
5.5
7.5
-1.5
3.9
2.8
4.7
3.5
2.7
3.7
2.2
4.4
1.5
1.0
3.3
3.1
3.8
3.0
5.0
7.0
4.2
3.2
13.4
16.7
21.5
10.0
12.6
9.8
6.5
42.3
7.1
6.5
15.1
12.7
20.6
1.5
18.0
76.4
6.2
21.2
12.4
18.2
21.2
12.5
10.2
9.3
19.8
NM
14.3
16.8
18.0
11.2
5.1
7.9
7.1
7.2
10.8
3.4
14.4
6.1
19.0
-3.2
1.4
18.4
11.6
9.4
28.5
36.9
50.4
28.4
35.8
24.6
22.2
66.5
23.5
21.1
36.7
12.6
17.1
3.1
20.9
49.7
3.0
19.7
21.5
18.3
19.5
12.4
11.6
9.8
19.8
-8.8
12.7
17.6
15.8
11.6
7.0
10.8
9.2
10.7
10.0
4.4
14.8
8.0
16.1
8.8
17.0
20.8
10.1
10.2
26.7
34.3
50.8
26.0
32.0
24.2
21.1
76.2
24.8
16.5
34.9
15.8
17.0
4.1
28.9
48.8
3.7
22.8
22.7
20.9
20.9
13.8
12.6
13.8
20.9
-11.0
12.8
17.4
16.0
13.1
7.9
13.5
12.2
13.3
12.9
6.1
17.5
12.3
17.5
12.8
22.9
18.8
14.0
12.4
28.1
34.5
58.2
26.3
33.9
22.8
22.6
87.2
26.3
18.4
37.7
Sell
Buy
Sell
Neutral
Buy
Neutral
Buy
Neutral
Neutral
Neutral
Buy
Not Rated
Neutral
Neutral
Not Rated
Neutral
Buy
Sell
1,354
171
84
791
215
78
897
384
543
299
1,145
99
1,219
988
16
970
587
530
1,235
187
75
690
240
80
1,170
395
460
295
1,400
-
1,355
900
-
840
800
470
-9
9
-11
-13
12
2
30
3
-15
-1
22
11
-9
-13
36
-11
19.7
6.3
1.3
12.9
4.7
4.1
26.5
5.7
9.6
11.9
42.3
7.1
17.8
20.6
0.6
30.8
29.8
15.5
22.4
6.7
2.7
17.1
5.0
2.0
27.7
9.3
10.7
13.1
46.5
9.1
21.7
24.2
0.9
30.1
34.6
16.8
31.6
7.4
3.8
25.5
6.3
2.5
35.0
11.3
13.9
16.4
56.6
11.2
33.4
30.0
1.0
33.4
39.8
19.1
Buy
Neutral
Buy
Buy
Neutral
Neutral
Buy
Buy
Buy
Buy
Buy
Buy
Buy
279
317
1,785 1,706
996
1,150
2,744 3,272
1,142 1,276
179
198
951
1,196
392
485
688
832
155
182
109
140
18,760 22,084
4,004 4,937
13
-4
15
19
12
11
26
24
21
17
29
18
23
4.9
7.0
36.1 51.0
28.5 40.9
38.8 62.9
67.8 70.6
5.6
7.5
33.7 39.7
7.0
9.7
27.3 27.4
-1.6
4.4
0.3
3.5
384.4 507.1
96.1 92.1
8.2
66.9
58.9
88.3
101.2
10.8
54.4
16.4
34.4
7.1
5.6
547.8
138.8
Neutral
Buy
Buy
Neutral
Buy
Neutral
Neutral
Buy
Neutral
Neutral
Neutral
1,170
4,544
1,064
322
1,146
977
4,953
1,279
268
388
317
1,315
5,165
1,385
330
1,400
1,005
4,630
1,400
290
410
350
12
14
30
2
22
3
-7
9
8
6
10
21.0 22.2
73.7 85.3
21.2 24.5
7.2
7.7
26.5 26.9
18.9 21.5
156.1 158.1
19.6 22.9
8.4
9.3
11.2
9.8
6.3
6.8
26.5
104.6
29.8
9.1
33.1
24.7
182.1
27.4
10.3
11.1
8.2
17 October 2017
29

Company
Nestle
Page Inds
Parag Milk
Pidilite Ind.
P&G Hygiene
Prabhat Dairy
United Brew
United Spirits
Aggregate
Healthcare
Alembic Phar
Alkem Lab
Ajanta Pharma
Aurobindo
Biocon
Cadila
Cipla
Divis Lab
Dr Reddy’s
Fortis Health
Glenmark
Granules
GSK Pharma
IPCA Labs
Jubilant Life
Lupin
Sanofi India
Shilpa Medicare
Strides Shasun
Sun Pharma
Syngene Intl
Torrent Pharma
Aggregate
Logistics
Allcargo Logistics
Blue Dart
Concor
Gateway
Distriparks
Gati
Transport Corp.
Aggregate
Media
Dish TV
D B Corp
Den Net.
Ent.Network
Hind. Media
HT Media
Jagran Prak.
Music Broadcast
PVR
Siti Net.
Sun TV
Zee Ent.
Reco
Neutral
Buy
Neutral
Neutral
Neutral
Not Rated
Buy
Neutral
CMP
TP
% Upside
(INR) (INR) Downside
7,281 6,160
-15
18,942 21,310
13
272
280
3
809
865
7
8,671 9,200
6
146
-
840
980
17
2,425 2,600
7
FY17
118.0
238.7
3.6
16.7
132.9
3.5
8.7
26.7
EPS (INR)
FY18E FY19E
115.0 133.6
294.7 398.4
9.1
12.5
18.1
20.6
151.6 176.0
3.5
6.4
9.9
14.0
34.5
51.5
P/E (x)
FY17 FY18E
61.7 63.3
79.3 64.3
75.5 29.9
48.4 44.8
65.2 57.2
41.4 42.1
96.7 84.9
90.7 70.3
47.0 42.5
22.9
24.3
20.6
19.3
36.8
35.2
38.1
21.9
33.0
14.6
15.6
19.4
71.1
31.1
17.7
18.9
32.7
47.3
27.2
21.0
38.0
23.2
24.3
16.7
40.7
35.8
35.3
13.8
16.7
31.1
70.3
18.2
NM
70.2
9.7
13.0
16.1
61.4
66.7
NM
32.8
37.0
25.0
25.4
22.8
16.9
38.6
28.6
28.7
25.8
33.0
69.0
15.4
17.6
52.2
30.1
13.9
25.8
31.6
31.4
18.5
36.4
30.7
24.0
27.0
16.0
32.2
32.1
27.3
7.3
13.5
26.3
71.0
15.6
NM
65.9
8.8
13.1
14.1
42.4
51.7
NM
28.4
42.3
P/B (x)
ROE (%)
FY17 FY18E FY17 FY18E FY19E
23.3 21.7 39.0 35.5 38.1
31.7 25.5 40.0 39.6 43.1
3.5
3.1
6.0
11.0 13.3
12.5 10.2 28.2 25.2 23.5
40.9 33.9 39.3 64.9 62.8
2.1
2.0
5.2
4.9
8.5
9.5
8.7
10.2 10.7 13.6
18.2 12.7 21.3 18.0 20.3
12.9 12.0 27.5 28.3 29.3
4.9
5.2
6.8
4.7
4.7
7.4
3.9
4.3
3.2
1.6
3.8
3.6
10.3
2.6
3.0
3.6
5.6
5.8
2.9
3.6
7.7
5.0
4.1
2.3
18.1
3.8
2.6
1.9
2.6
3.8
15.7
4.3
1.8
4.5
1.6
1.0
2.6
4.1
6.6
4.0
8.0
5.8
4.3
4.5
5.4
3.7
4.3
6.2
3.5
4.5
3.1
1.4
3.1
2.5
12.0
2.4
2.5
3.2
5.2
4.9
2.6
3.4
6.3
4.4
3.7
2.0
13.8
3.6
2.5
1.7
2.2
3.5
12.8
3.5
1.9
4.2
1.3
0.9
2.6
3.7
5.9
4.3
7.3
5.4
23.0
23.4
37.7
27.6
12.3
23.0
10.2
22.0
9.7
11.3
24.7
21.1
14.5
8.6
18.1
20.9
17.1
14.4
10.7
18.1
22.2
23.8
16.9
13.7
50.5
10.8
7.3
12.4
16.7
12.3
25.1
25.1
-19.1
6.7
18.2
7.9
18.5
11.2
10.4
-28.7
26.0
19.3
18.4
19.0
26.5
24.8
11.1
23.5
12.1
17.0
9.7
2.1
20.3
17.7
23.0
8.2
19.5
13.2
16.6
17.0
14.7
9.6
22.5
19.5
13.6
13.4
48.6
11.4
9.2
19.4
17.8
13.5
19.9
24.7
-6.4
6.6
16.5
7.3
18.6
9.3
12.1
-7.5
27.0
14.7
20.5
20.9
25.9
22.1
14.5
26.0
13.2
19.5
14.4
4.9
20.4
18.8
30.9
12.2
19.6
16.4
18.1
20.4
20.2
13.8
20.7
21.5
16.1
15.1
46.8
12.4
12.1
25.4
18.6
15.1
35.2
23.9
0.2
10.3
16.6
7.3
19.0
12.4
17.3
6.4
31.6
18.7
Neutral
Neutral
Buy
Buy
Sell
Buy
Neutral
Neutral
Neutral
Buy
Neutral
Buy
Neutral
Neutral
Buy
Buy
Buy
Buy
Buy
Buy
Not Rated
Neutral
495
1,840
1,201
758
375
501
606
873
2,397
151
611
141
2,445
499
656
1,070
4,222
663
879
548
495
1,280
510
1,830
1,605
850
330
555
520
720
2,400
220
775
200
2,500
430
905
1,125
4,850
805
1,300
515
-
1,350
3
-1
34
12
-12
11
-14
-18
0
46
27
42
2
-14
38
5
15
22
48
-6
5
21.6 19.8
75.7 72.5
58.4 52.8
39.3 44.9
10.2
9.7
14.2 17.5
15.9 21.1
39.9 33.9
72.6 72.6
10.3
2.2
39.3 39.7
7.2
8.0
34.4 46.8
16.1 16.6
37.0 47.1
56.6 41.4
129.1 133.6
14.0 21.1
32.3 47.4
26.1 15.1
13.0 16.1
55.2 53.4
25.5
93.3
64.2
50.0
14.2
23.6
26.0
40.4
119.9
5.6
49.1
11.0
54.9
26.8
56.7
58.0
160.6
30.4
74.8
23.3
18.0
67.3
Buy
Not Rated
Neutral
Buy
Not Rated
Not Rated
164
4,178
1,361
240
115
284
206
-
1,214
280
-
-
25
-11
17
9.8
10.3
102.5 129.9
38.0 42.4
6.8
8.4
16.9
8.8
15.9
21.0
12.9
163.2
48.6
12.2
23.9
25.9
Buy
Buy
Neutral
Neutral
Buy
Neutral
Buy
Buy
Buy
Neutral
Neutral
Buy
72
370
85
802
250
96
172
395
1,370
25
816
514
106
450
90
928
350
90
225
469
1,597
32
860
630
47
22
6
16
40
-6
31
19
17
29
5
23
1.0
20.4
-9.3
11.4
25.8
7.4
10.7
6.4
20.5
-1.8
24.9
13.9
1.0
23.7
-2.9
12.2
28.5
7.3
12.2
9.3
26.5
-0.4
28.8
12.2
2.4
28.0
0.1
20.6
33.6
7.8
13.4
14.0
43.6
0.4
36.9
17.8
17 October 2017
30

Company
Aggregate
Metals
Hindalco
Hind. Zinc
JSPL
JSW Steel
Nalco
NMDC
SAIL
Vedanta
Tata Steel
Aggregate
Oil & Gas
BPCL
GAIL
Gujarat Gas
Gujarat St. Pet.
HPCL
IOC
IGL
MRPL
Oil India
ONGC
PLNG
Reliance Ind.
Aggregate
Retail
Jubilant Food
Titan Co.
Aggregate
Technology
Cyient
HCL Tech.
Hexaware
Infosys
KPIT Tech
L&T Infotech
Mindtree
Mphasis
NIIT Tech
Persistent Sys
Tata Elxsi
TCS
Tech Mah
Wipro
Zensar Tech
Aggregate
Telecom
Bharti Airtel
Bharti Infratel
Idea Cellular
Tata Comm
Aggregate
Utiltites
Coal India
Reco
CMP
(INR)
TP
% Upside
EPS (INR)
(INR) Downside FY17 FY18E FY19E
P/E (x)
P/B (x)
ROE (%)
FY17 FY18E FY17 FY18E FY17 FY18E FY19E
36.9 31.8
4.9
4.6
13.4 14.5 17.8
31.7
16.3
NM
17.6
23.2
12.3
NM
22.1
18.9
23.9
10.3
19.4
57.4
22.9
11.3
9.6
34.6
8.6
18.0
10.5
22.1
18.1
13.6
13.7
14.3
NM
11.7
19.3
9.4
NM
13.2
10.7
15.2
10.1
16.5
29.5
16.7
10.0
8.1
30.7
12.0
11.9
9.6
17.8
15.8
12.1
2.1
4.4
0.5
2.8
1.6
1.7
0.7
2.1
2.2
1.8
3.2
1.9
7.8
2.5
3.5
1.9
7.3
2.2
1.0
1.0
4.6
1.9
1.8
12.7
13.2
13.0
2.9
3.9
4.9
3.1
1.6
5.1
3.2
2.2
2.2
2.7
9.5
5.8
2.5
2.7
2.3
3.9
1.8
4.7
0.5
2.3
1.6
1.6
0.7
1.9
1.9
1.7
2.6
1.8
6.4
2.3
2.8
1.6
6.2
1.9
0.9
1.0
3.9
1.7
1.6
11.7
12.0
11.9
2.7
3.4
4.3
2.8
1.5
3.9
3.2
2.4
2.1
2.6
7.7
6.2
2.3
2.7
2.1
3.9
2.7
5.6
1.6
11.2
2.9
7.0
7.4
24.4
-7.9
17.3
7.2
12.8
-6.7
9.7
15.7
7.6
32.4
9.6
14.2
11.6
32.4
21.2
21.0
31.4
5.7
10.1
23.2
11.6
13.2
8.2
20.6
17.2
16.2
27.5
26.5
22.0
14.3
40.4
16.8
13.2
13.7
17.0
37.1
32.6
18.4
16.9
17.2
22.9
14.3
31.8
-5.5
21.6
8.3
15.5
-9.1
15.0
19.1
11.5
28.5
11.3
23.9
14.3
31.0
21.9
21.7
17.3
7.9
10.2
23.9
11.9
13.5
11.1
21.0
18.6
17.4
25.5
25.6
19.6
13.3
33.3
17.2
14.4
14.7
17.7
33.6
30.6
17.9
16.2
14.9
22.7
15.4
37.9
0.6
20.8
10.1
16.2
-5.3
20.3
15.9
14.1
25.2
11.9
27.0
14.1
24.2
17.4
20.4
16.5
8.8
10.5
25.5
12.3
13.1
14.0
22.2
19.6
18.3
24.6
23.1
19.1
14.7
28.3
20.1
16.2
16.0
20.6
32.4
33.5
17.1
16.4
17.9
22.1
1.9
23.2
-32.6
33.1
0.3
47.7
Buy
Neutral
Buy
Buy
Neutral
Buy
Sell
Buy
Neutral
271
320
165
261
86
123
58
334
715
308
322
192
298
87
188
30
360
665
13
1
17
14
1
53
-48
8
-7
8.6
19.7
-20.9
14.8
3.7
10.0
-6.2
15.1
37.9
19.8
22.4
-17.4
22.3
4.5
13.1
-7.7
25.4
66.9
24.5
29.3
2.0
25.7
5.8
12.9
-4.2
37.5
63.4
Buy
Sell
Sell
Neutral
Buy
Buy
Neutral
Sell
Buy
Buy
Buy
Buy
499
438
931
202
460
413
1,522
128
348
172
251
875
644
634
712
180
585
559
1,295
112
340
190
275
1,005
29
45
-24
-11
27
35
-15
-12
-2
11
10
15
48.3
22.6
16.2
8.8
40.7
43.0
44.0
14.8
19.3
16.4
11.4
48.3
49.2
26.5
31.6
12.1
45.9
51.1
49.6
10.7
29.1
17.8
14.1
55.5
52.0
30.0
44.0
13.3
42.9
46.5
54.8
11.6
34.1
19.2
18.0
64.0
Sell
Neutral
1,550
627
960
590
-38
-6
10.0
9.0
14.8
10.5
20.7
12.6
154.9 104.7
69.4 59.9
75.5 63.8
18.0
15.4
20.2
14.9
10.8
14.6
19.8
16.7
16.4
17.6
30.4
19.4
15.4
17.1
14.6
17.2
15.3
14.5
17.7
15.1
11.8
13.3
17.4
16.2
14.4
15.5
25.3
19.6
13.6
15.9
14.7
17.1
Buy
Neutral
Neutral
Buy
Neutral
Buy
Neutral
Neutral
Neutral
Buy
Buy
Neutral
Buy
Neutral
Buy
553
923
277
939
128
811
494
651
624
663
856
2,585
474
290
758
600
950
250
1,050
140
880
450
610
540
750
996
2,450
490
270
950
9
3
-10
12
9
8
-9
-6
-13
13
16
-5
3
-7
25
30.6 36.0
59.8 63.5
13.7 15.6
62.9 62.3
11.9 10.8
55.5 60.9
24.9 28.4
38.9 40.2
38.0 43.3
37.7 42.9
28.1 33.8
133.4 131.8
30.9 34.8
16.9 18.2
52.1 51.5
41.9
68.9
16.5
66.3
13.6
65.3
32.9
43.0
50.8
51.9
40.2
151.4
37.3
19.5
70.0
Buy
Buy
Buy
Buy
453
471
83
719
470
440
105
775
4
-7
26
8
11.1
14.9
-1.1
27.2
2.4
17.3
-15.5
8.3
3.2
19.7
-14.9
25.4
40.8 189.1 2.7
31.7 27.2
5.6
NM
NM
1.2
26.4 86.9 12.9
40.4 -252.2 2.8
19.4
16.6
7.3
6.7
1.4
16.2 20.7
-1.6 -25.6
132.2 13.8
6.9
-1.2
37.8
42.4
Buy
290
335
15
14.9
17.5
20.7
17 October 2017
31

Company
Reco
CESC
Buy
JSW Energy
Sell
NTPC
Buy
Power Grid
Buy
Tata Power
Sell
Aggregate
Others
Arvind
Neutral
Avenue Supermarts Under Review
Bata India
Under Review
BSE
Neutral
Castrol India
Buy
Century Ply.
Neutral
Coromandel Intl Buy
Delta Corp
Buy
Dynamatic Tech
Buy
Eveready Inds.
Buy
Interglobe
Neutral
Indo Count
Neutral
Info Edge
Buy
Inox Leisure
Sell
Jain Irrigation
Under Review
Just Dial
Neutral
Kaveri Seed
Buy
Kitex Garm.
Buy
Manpasand
Buy
MCX
Buy
Monsanto
Buy
Navneet Education Buy
Quess Corp
Buy
PI Inds.
Buy
Piramal Enterp.
Buy
SRF
Buy
S H Kelkar
Buy
Symphony
Sell
Team Lease Serv. Buy
Trident
Buy
TTK Prestige
Neutral
V-Guard
Neutral
Wonderla
Buy
CMP
(INR)
1,032
79
175
206
82
TP
% Upside
EPS (INR)
(INR) Downside FY17 FY18E FY19E
1,360
32
51.9 88.9
99.3
49
-38
3.8
3.3
2.7
211
20
12.0 13.5
15.7
262
27
14.2 17.4
20.6
71
-13
7.4
7.3
7.3
P/E (x)
P/B (x)
ROE (%)
FY17 FY18E FY17 FY18E FY17 FY18E FY19E
19.9 11.6
1.3
1.2
6.5
10.6 10.8
20.6 23.6
1.2
1.2
6.3
5.3
4.2
14.7 13.0
1.5
1.4
10.5 11.0 11.9
14.4 11.8
2.2
1.9
16.2 17.3 17.8
11.0 11.3
1.9
1.7
17.1 15.8 14.2
16.4 14.0
2.4
2.2
14.5 15.7 16.8
31.7
160.5
58.0
23.8
27.4
31.6
29.0
74.5
31.0
25.9
25.9
8.6
70.7
70.2
16.9
23.4
29.1
11.8
71.1
45.5
28.5
23.3
82.9
22.9
37.8
20.1
38.6
60.0
41.5
15.3
46.2
53.1
51.8
30.4
96.8
49.9
23.1
29.6
28.0
20.0
40.7
18.6
24.4
20.3
12.6
51.0
29.1
12.3
22.1
16.3
9.9
46.4
42.6
23.4
20.2
43.4
25.2
26.3
21.5
36.8
40.4
43.7
12.2
44.2
42.3
30.3
2.8
20.0
7.6
2.0
31.0
8.6
4.9
5.7
4.3
8.4
11.4
2.6
6.8
4.1
1.4
3.1
3.8
3.2
4.5
4.2
8.0
5.7
11.2
6.5
3.2
3.2
5.0
22.3
7.2
1.9
8.3
12.6
4.7
2.7
17.5
6.8
2.0
28.2
7.1
4.2
3.8
3.5
6.8
6.6
2.1
6.2
3.6
1.4
2.8
4.0
2.6
4.2
4.3
7.2
4.9
4.8
5.4
2.9
2.9
4.5
19.6
6.2
1.7
7.6
10.3
4.2
10.3
17.9
13.9
8.3
115.2
31.1
17.5
8.1
15.1
37.7
51.0
34.8
10.2
5.9
8.6
14.8
13.6
29.8
7.3
10.2
31.5
26.7
19.0
32.8
9.0
16.6
13.7
43.3
19.2
13.0
19.5
27.4
9.5
9.1
19.3
14.4
8.5
99.8
27.7
22.5
11.9
20.7
30.8
41.1
18.6
12.7
12.5
11.7
13.4
23.3
28.6
8.2
10.0
32.5
26.3
15.6
23.4
11.7
13.7
12.9
51.6
15.3
14.5
18.0
26.9
14.8
12.0
23.0
15.8
7.7
95.8
29.6
23.4
12.4
24.3
30.1
46.6
18.3
13.1
16.2
14.8
13.7
27.4
27.6
13.4
15.9
34.5
27.9
15.0
22.9
15.3
16.0
15.2
54.5
19.5
16.1
20.7
28.8
17.5
393
1,231
783
974
374
275
482
227
2,098
333
1,119
112
1,109
234
94
408
554
220
452
1,128
2,456
170
829
766
2,746
1,728
280
1,419
1,611
101
6,099
190
362
376
-
-
1,100
467
323
523
232
3,334
358
1,142
118
1,130
240
-
465
738
394
534
1,300
3,295
209
990
894
3,266
1,751
298
1,288
1,990
114
5,281
167
393
-4
13
25
17
8
2
59
7
2
5
2
3
14
33
79
18
15
34
23
19
17
19
1
7
-9
24
12
-13
-12
8
12.4
7.7
13.5
41.0
13.6
8.7
16.6
3.1
67.6
12.9
43.2
13.0
15.7
3.3
5.5
17.5
19.1
18.6
6.3
24.8
86.2
7.3
10.0
33.4
72.6
85.9
7.2
23.7
38.8
6.6
132.1
3.6
7.0
12.9
12.7
15.7
42.2
12.6
9.8
24.1
5.6
112.9
13.6
55.2
8.9
21.8
8.0
7.6
18.5
34.1
22.1
9.7
26.5
105.0
8.4
19.1
30.4
104.6
80.2
7.6
35.1
36.8
8.3
137.8
4.5
11.9
18.6
17.6
19.4
44.6
13.3
12.9
29.0
7.7
166.7
16.3
81.6
10.8
24.7
12.0
10.0
21.1
41.0
26.2
15.3
43.4
126.6
10.4
27.8
35.8
149.7
103.0
9.9
42.9
56.0
10.4
176.1
6.0
16.0
17 October 2017
32

MOSL Universe stock performance
Company
Automobiles
Amara Raja
Ashok Ley.
Bajaj Auto
Bharat Forge
Bosch
CEAT
Eicher Mot.
Endurance Tech.
Escorts
Exide Ind
Hero Moto
M&M
Mahindra CIE
Maruti Suzuki
Tata Motors
TVS Motor
Banks - Private
Axis Bank
DCB Bank
Equitas Hold.
Federal Bank
HDFC Bank
ICICI Bank
IDFC Bank
IndusInd
J&K Bank
Kotak Mah. Bk
RBL Bank
South Indian
Yes Bank
Banks - PSU
BOB
BOI
Canara
IDBI Bk
Indian Bk
OBC
PNB
SBI
Union Bk
NBFCs
Bajaj Fin.
Bharat Fin.
Capital First
Cholaman.Inv.&Fn
Dewan Hsg.
GRUH Fin.
HDFC
Indiabulls Hsg
L&T Fin.Holdings
LIC Hsg Fin
Manappuram
M&M Fin.
Muthoot Fin
PNB Housing
PFC
Repco Home
REC
STF
Shriram City Union
1 Day (%)
-1.2
1.7
1.8
0.5
2.6
-0.1
1.2
2.8
1.7
-0.1
0.5
3.1
-1.1
-0.3
2.9
0.2
-1.7
-0.7
0.4
6.5
0.2
1.0
-2.1
-1.9
0.3
0.3
0.7
0.0
-0.6
-1.1
0.9
-0.3
-0.5
-1.0
0.3
-1.0
-0.1
-0.6
-3.4
1.6
1.2
-0.9
3.8
-1.0
-0.1
0.7
-0.4
1.1
-0.7
2.8
1.0
0.9
-0.4
0.2
-1.7
0.5
-0.6
1M (%)
-12.0
9.0
6.6
3.7
1.5
-2.1
-0.7
12.1
7.9
-6.1
-3.0
5.7
-3.1
-3.0
8.8
7.8
0.6
-0.1
-5.6
8.4
0.4
-6.1
-3.9
1.0
-2.3
7.5
-2.1
10.6
-0.2
-4.9
-11.2
-11.5
-6.5
-4.2
-13.7
-7.5
-7.3
-7.5
-0.7
7.9
-4.9
-3.3
-1.6
-3.9
-0.4
2.3
-1.7
1.8
-3.4
-0.2
-0.7
-7.9
-5.8
-3.3
-9.0
1.8
-2.0
12M (%)
-34.6
57.8
14.9
40.5
-3.1
25.7
25.0
86.5
7.2
8.4
0.8
23.6
38.1
-21.4
79.2
0.0
55.7
-12.5
75.9
47.2
24.6
-23.3
41.0
8.1
38.8
65.6
51.7
45.8
-10.4
22.6
0.9
-23.4
28.9
-7.0
-3.8
0.1
-10.0
77.9
14.0
1.4
-6.1
85.5
46.6
33.7
54.5
105.2
12.4
10.3
16.3
43.4
0.7
-14.7
16.9
-4.8
-9.7
Company
Capital Goods
ABB
Bharat Elec.
BHEL
Blue Star
CG Cons. Elec.
CG Power & Inds Sol.
Cummins
GE T&D
Havells
K E C Intl
L&T
Pennar Eng.
Siemens
Solar Ind
Suzlon Energy
Thermax
Va Tech Wab.
Voltas
Cement
Ambuja Cem.
ACC
Birla Corp.
Dalmia Bharat
Grasim Inds.
India Cem
J K Cements
JK Lakshmi Ce
Ramco Cem
Orient Cem
Prism Cem
Shree Cem
Ultratech
Consumer
Asian Paints
Britannia
Colgate
Dabur
Emami
Godrej Cons.
GSK Cons.
HUL
ITC
Jyothy Lab
Marico
Nestle
Page Inds
Parag Milk
Pidilite Ind.
P&G Hygiene
Prabhat Dairy
United Brew
United Spirits
Healthcare
Alembic Phar
Alkem Lab
Ajanta Pharma
Aurobindo
Biocon
Cadila
Cipla
1 Day (%)
0.6
0.1
-0.5
0.8
2.4
-0.2
-1.3
0.4
0.5
-1.1
0.6
-0.4
-1.7
-0.4
-0.3
4.4
0.8
-0.3
0.7
1.0
-1.0
0.6
-0.2
-0.6
-0.4
1.9
0.2
-1.2
1.2
1.2
0.0
-0.1
-0.7
-2.6
0.1
1.9
0.6
0.1
2.6
0.6
0.1
0.2
-0.8
1.5
3.2
0.3
0.0
-2.4
-0.4
-0.3
0.0
0.9
2.1
1.7
1.4
-0.2
2.4
1M (%)
-4.7
-0.8
-4.5
0.8
-0.4
-6.2
-4.4
-5.1
7.1
-6.5
-5.6
-12.1
-11.5
5.1
-8.6
1.8
-7.7
-2.3
-1.6
-2.0
5.2
-2.7
-7.6
-5.6
-5.3
-8.9
-8.1
-2.5
0.5
0.8
-4.8
-5.9
4.0
-6.2
4.1
0.3
4.3
-2.8
2.7
-0.7
-7.6
-3.1
-0.7
0.8
9.8
-3.3
3.0
11.1
6.5
-8.4
1.8
1.8
-1.1
-0.1
8.2
4.0
8.2
12M (%)
17.4
48.6
-5.3
38.7
21.5
3.7
3.3
10.4
22.6
140.5
16.6
-45.3
-0.6
46.0
6.0
7.5
5.1
33.6
10.3
8.8
33.6
44.2
37.5
13.2
-1.0
-20.0
4.4
-17.8
-0.8
10.1
-0.8
-2.9
36.7
15.7
15.2
-1.7
24.1
-20.2
52.0
11.6
9.0
14.7
6.2
21.3
-10.8
11.3
30.7
26.5
-11.3
0.1
-27.3
8.8
-38.1
-8.0
18.5
27.7
3.4
17 October 2017
33

MOSL Universe stock performance
Company
Divis Lab
Dr Reddy’s
Fortis Health
Glenmark
Granules
GSK Pharma
IPCA Labs
Jubilant Life
Lupin
Sanofi India
Shilpa Medicare
Strides Shasun
Sun Pharma
Syngene Intl
Torrent Pharma
Logistics
Allcargo Logistics
Blue Dart
Concor
Gateway Distriparks
Gati
Transport Corp.
Media
Dish TV
D B Corp
Den Net.
Ent.Network
Hind. Media
HT Media
Jagran Prak.
Music Broadcast
PVR
Siti Net.
Sun TV
Zee Ent.
Metals
Hindalco
Hind. Zinc
JSPL
JSW Steel
Nalco
NMDC
SAIL
Vedanta
Tata Steel
Oil & Gas
BPCL
GAIL
Gujarat Gas
Gujarat St. Pet.
HPCL
IOC
IGL
MRPL
Oil India
ONGC
PLNG
Reliance Ind.
Retail
Jubilant Food
Titan Co.
1 Day (%)
0.1
1.9
-0.7
1.3
3.3
-0.3
-0.3
0.3
0.8
0.0
-3.2
1.3
2.5
0.4
0.8
-0.9
1.8
0.0
0.5
-1.2
1.3
0.6
-0.2
-0.9
0.4
0.4
1.9
-0.9
-0.1
-2.4
0.6
2.1
0.7
2.0
-0.2
1.3
2.8
1.4
2.0
0.9
4.1
0.7
2.0
0.3
5.5
2.8
0.2
-0.3
0.0
-1.8
-0.5
1.1
0.0
-0.2
2.5
0.2
1M (%)
0.5
8.5
0.5
1.2
11.5
1.4
-3.7
-7.7
6.2
3.5
12.6
-10.9
4.6
3.2
5.5
-4.4
-2.3
0.4
3.1
0.3
-3.8
-6.7
0.1
-9.4
-4.7
-4.6
-1.8
-6.0
-1.2
2.5
0.0
-0.9
-3.6
9.8
5.2
10.5
-2.3
7.9
-7.0
-6.4
5.0
5.3
0.3
9.5
11.2
2.6
1.8
-0.5
5.9
-5.9
7.4
3.0
8.4
3.8
14.1
-0.8
12M (%)
-29.3
-20.9
-11.5
-33.7
17.2
-17.3
-19.5
1.3
-26.9
-0.2
15.2
-10.1
-26.5
-1.7
-21.8
-5.4
-20.7
26.8
-6.7
-11.7
57.0
-22.6
-7.2
21.4
-1.5
-14.6
5.9
-14.1
15.3
-27.3
50.5
-2.7
75.6
42.5
115.2
49.3
67.6
4.7
21.6
71.1
73.7
14.8
35.7
62.2
29.8
57.5
28.4
79.4
37.8
11.1
-6.8
25.2
62.3
48.3
62.4
Company
Technology
Cyient
HCL Tech.
Hexaware
Infosys
KPIT Tech
L&T Infotech
Mindtree
Mphasis
NIIT Tech
Persistent Sys
Tata Elxsi
TCS
Tech Mah
Wipro
Zensar Tech
Telecom
Bharti Airtel
Bharti Infratel
Idea Cellular
Tata Comm
Utiltites
Coal India
CESC
JSW Energy
NTPC
Power Grid
Tata Power
Others
Arvind
Avenue Super.
Bata India
BSE
Castrol India
Century Ply.
Coromandel Intl
Delta Corp
Dynamatic Tech
Eveready Inds.
Interglobe
Indo Count
Info Edge
Inox Leisure
Jain Irrigation
Just Dial
Kaveri Seed
Kitex Garm.
Manpasand
MCX
Monsanto
Navneet Educat.
PI Inds.
Piramal Enterp.
Quess Corp
SRF
S H Kelkar
Symphony
Team Lease Serv.
Trident
TTK Prestige
V-Guard
Wonderla
1 Day (%)
2.5
0.0
0.6
0.8
0.3
0.0
2.0
1.5
0.1
0.9
-0.8
1.1
-0.2
-0.6
-0.4
5.0
4.7
5.3
4.2
0.8
-1.1
-1.2
-0.3
0.0
0.2
1.1
-0.2
-0.6
-0.3
1.6
2.6
0.0
-0.4
-0.3
-2.1
-0.8
1.6
3.5
-3.7
0.7
-0.8
0.7
-0.8
1.1
-0.4
-1.3
0.2
1.9
0.1
0.6
-0.1
1.0
0.9
-0.3
3.7
1.3
-1.2
-1.9
1M (%)
9.9
4.2
-0.4
3.4
7.1
7.0
6.1
4.9
24.8
5.5
-6.3
3.5
7.1
1.5
-1.5
14.5
26.3
4.3
1.6
11.7
-1.7
1.4
4.9
-3.7
-3.1
-4.8
13.1
8.7
-4.3
-3.5
11.5
15.1
17.1
-7.0
9.5
-5.2
-5.9
-6.6
-0.5
-10.2
6.1
-3.8
-4.6
-5.9
2.2
-0.9
-0.8
-0.7
-4.7
-1.3
9.5
1.6
0.8
-0.3
1.5
-3.9
-3.6
4.6
12M (%)
9.8
13.6
51.7
-8.6
-2.2
33.3
-1.4
18.8
41.9
-3.3
29.3
9.3
13.1
22.3
-23.7
48.1
29.1
11.1
10.4
-7.3
71.3
11.0
21.1
15.9
4.2
13.0
60.2
-19.6
7.8
82.1
33.7
-36.6
30.5
19.8
-23.0
25.2
-10.6
-1.0
-7.9
33.8
-29.7
23.5
-15.9
2.8
66.2
-5.5
49.5
40.0
-7.7
-8.5
24.4
56.1
76.0
12.7
46.3
-9.1
17 October 2017
34

THEMATIC/STRATEGY RESEARCH GALLERY

REPORT GALLERY
RECENT INITIATING COVERAGE REPORTS
Rs

DIFFERENTIATED PRODUCT GALLERY

Disclosures:
The following Disclosures are being made in compliance with the SEBI Research Analyst Regulations 2014 (herein after referred to as the Regulations).
Motilal Oswal Securities Ltd. (MOSL) is a SEBI Registered Research Analyst having registration no. INH000000412. MOSL, the Research Entity (RE) as defined in the Regulations, is engaged in the business of providing Stock
broking services, Investment Advisory Services, Depository participant services & distribution of various financial products. MOSL is a subsidiary company of Motilal Oswal Financial Service Ltd. (MOFSL). MOFSL is a listed
public company, the details in respect of which are available on
www.motilaloswal.com.
MOSL is registered with the Securities & Exchange Board of India (SEBI) and is a registered Trading Member with National Stock
Exchange of India Ltd. (NSE) and Bombay Stock Exchange Limited (BSE), Metropolitan Stock Exchange Of India Ltd. (MSE) for its stock broking activities & is Depository participant with Central Depository Services Limited
(CDSL) & National Securities Depository Limited (NSDL) and is member of Association of Mutual Funds of India (AMFI) for distribution of financial products. Details of associate entities of Motilal Oswal Securities Limited are
available on the website at
http://onlinereports.motilaloswal.com/Dormant/documents/Associate%20Details.pdf
Pending Regulatory Enquiries against Motilal Oswal Securities Limited by SEBI:
SEBI pursuant to a complaint from client Shri C.R. Mohanraj alleging unauthorized trading, issued a letter dated 29th April 2014 to MOSL notifying appointment of an Adjudicating Officer as per SEBI regulations to hold
inquiry and adjudge violation of SEBI Regulations; MOSL requested SEBI to provide all documents, records, investigation report relied upon by SEBI which were referred in Show Cause Notice and also sought personal
hearing. The matter is currently pending.
MOSL, it’s associates, Research Analyst or their relative may have any financial interest in the subject company. MOSL and/or its associates and/or Research Analyst may have beneficial ownership of 1% or more securities in
the subject company at the end of the month immediately preceding the date of publication of the Research Report.
MOSL and its associate company(ies), their directors and Research Analyst and their relatives may; (a) from
time to time, have a long or short position in, act as principal in, and buy or sell the securities or derivatives thereof of companies mentioned herein. (b) be engaged in any other transaction involving such securities and earn
brokerage or other compensation or act as a market maker in the financial instruments of the company(ies) discussed herein or act as an advisor or lender/borrower to such company(ies) or may have any other potential
conflict of interests with respect to any recommendation and other related information and opinions.; however the same shall have no bearing whatsoever on the specific recommendations made by the analyst(s), as the
recommendations made by the analyst(s) are completely independent of the views of the associates of MOSL even though there might exist an inherent conflict of interest in some of the stocks mentioned in the research
report.
Research Analyst may have served as director/officer, etc. in the subject company in the last 12 month period. MOSL and/or its associates may have received any compensation from the subject company in the past
12 months.
In the last 12 months period ending on the last day of the month immediately preceding the date of publication of this research report, MOSL or any of its associates may have:
n
n
n
n
managed or co-managed public offering of securities from subject company of this research report,
received compensation for investment banking or merchant banking or brokerage services from subject company of this research report,
received compensation for products or services other than investment banking or merchant banking or brokerage services from the subject company of this research report.
Subject Company may have been a client of MOSL or its associates during twelve months preceding the date of distribution of the research report.
MOSL and it’s associates have not received any compensation or other benefits from the subject company or third party in connection with the research report. To enhance transparency, MOSL has incorporated a Disclosure
of Interest Statement in this document. This should, however, not be treated as endorsement of the views expressed in the report. MOSL and / or its affiliates do and seek to do business including investment banking with
companies covered in its research reports. As a result, the recipients of this report should be aware that MOSL may have a potential conflict of interest that may affect the objectivity of this report. Compensation of Research
Analysts is not based on any specific merchant banking, investment banking or brokerage service transactions.
Terms & Conditions:
This report has been prepared by MOSL and is meant for sole use by the recipient and not for circulation. The report and information contained herein is strictly confidential and may not be altered in any way, transmitted to,
copied or distributed, in part or in whole, to any other person or to the media or reproduced in any form, without prior written consent of MOSL. The report is based on the facts, figures and information that are considered
true, correct, reliable and accurate. The intent of this report is not recommendatory in nature. The information is obtained from publicly available media or other sources believed to be reliable. Such information has not
been independently verified and no guaranty, representation of warranty, express or implied, is made as to its accuracy, completeness or correctness. All such information and opinions are subject to change without notice.
The report is prepared solely for informational purpose and does not constitute an offer document or solicitation of offer to buy or sell or subscribe for securities or other financial instruments for the clients. Though
disseminated to all the customers simultaneously, not all customers may receive this report at the same time. MOSL will not treat recipients as customers by virtue of their receiving this report.
Analyst Certification
The views expressed in this research report accurately reflect the personal views of the analyst(s) about the subject securities or issues, and no part of the compensation of the research analyst(s) was, is, or will be directly or
indirectly related to the specific recommendations and views expressed by research analyst(s) in this report.
Disclosure of Interest Statement
§
Analyst ownership of the stock
Companies where there is interest
No
A graph of daily closing prices of securities is available at
www.nseindia.com, www.bseindia.com.
Research Analyst views on Subject Company may vary based on Fundamental research and Technical Research. Proprietary
trading desk of MOSL or its associates maintains arm’s length distance with Research Team as all the activities are segregated from MOSL research activity and therefore it can have an independent view with regards to
subject company for which Research Team have expressed their views.
Regional Disclosures (outside India)
This report is not directed or intended for distribution to or use by any person or entity resident in a state, country or any jurisdiction, where such distribution, publication, availability or use would be contrary to law,
regulation or which would subject MOSL & its group companies to registration or licensing requirements within such jurisdictions.
For Hong Kong:
This report is distributed in Hong Kong by Motilal Oswal capital Markets (Hong Kong) Private Limited, a licensed corporation (CE AYY-301) licensed and regulated by the Hong Kong Securities and Futures Commission (SFC)
pursuant to the Securities and Futures Ordinance (Chapter 571 of the Laws of Hong Kong) “SFO”. As per SEBI (Research Analyst Regulations) 2014 Motilal Oswal Securities (SEBI Reg No. INH000000412) has an agreement with
Motilal Oswal capital Markets (Hong Kong) Private Limited for distribution of research report in Hong Kong. This report is intended for distribution only to “Professional Investors” as defined in Part I of Schedule 1 to SFO. Any
investment or investment activity to which this document relates is only available to professional investor and will be engaged only with professional investors.” Nothing here is an offer or solicitation of these securities,
products and services in any jurisdiction where their offer or sale is not qualified or exempt from registration. The Indian Analyst(s) who compile this report is/are not located in Hong Kong & are not conducting Research
Analysis in Hong Kong.
For U.S.
Motilal Oswal Securities Limited (MOSL) is not a registered broker - dealer under the U.S. Securities Exchange Act of 1934, as amended (the"1934 act") and under applicable state laws in the United States. In addition MOSL is
not a registered investment adviser under the U.S. Investment Advisers Act of 1940, as amended (the "Advisers Act" and together with the 1934 Act, the "Acts), and under applicable state laws in the United States.
Accordingly, in the absence of specific exemption under the Acts, any brokerage and investment services provided by MOSL, including the products and services described herein are not available to or intended for U.S.
persons. This report is intended for distribution only to "Major Institutional Investors" as defined by Rule 15a-6(b)(4) of the Exchange Act and interpretations thereof by SEC (henceforth referred to as "major institutional
investors"). This document must not be acted on or relied on by persons who are not major institutional investors. Any investment or investment activity to which this document relates is only available to major institutional
investors and will be engaged in only with major institutional investors. In reliance on the exemption from registration provided by Rule 15a-6 of the U.S. Securities Exchange Act of 1934, as amended (the "Exchange Act") and
interpretations thereof by the U.S. Securities and Exchange Commission ("SEC") in order to conduct business with Institutional Investors based in the U.S., MOSL has entered into a chaperoning agreement with a U.S.
registered broker-dealer, Motilal Oswal Securities International Private Limited. ("MOSIPL"). Any business interaction pursuant to this report will have to be executed within the provisions of this chaperoning agreement.
The Research Analysts contributing to the report may not be registered /qualified as research analyst with FINRA. Such research analyst may not be associated persons of the U.S. registered broker-dealer, MOSIPL, and
therefore, may not be subject to NASD rule 2711 and NYSE Rule 472 restrictions on communication with a subject company, public appearances and trading securities held by a research analyst account.
For Singapore
Motilal Oswal Capital Markets Singapore Pte Limited is acting as an exempt financial advisor under section 23(1)(f) of the Financial Advisers Act(FAA) read with regulation 17(1)(d) of the Financial Advisors Regulations and is a
subsidiary of Motilal Oswal Securities Limited in India. This research is distributed in Singapore by Motilal Oswal Capital Markets Singapore Pte Limited and it is only directed in Singapore to accredited investors, as defined in
the Financial Advisers Regulations and the Securities and Futures Act (Chapter 289), as amended from time to time. In respect of any matter arising from or in connection with the research you could contact the following
representatives of Motilal Oswal Capital Markets Singapore Pte Limited:
Disclaimer:
The report and information contained herein is strictly confidential and meant solely for the selected recipient and may not be altered in any way, transmitted to, copied or distributed, in part or in whole, to any other person
or to the media or reproduced in any form, without prior written consent. This report and information herein is solely for informational purpose and may not be used or considered as an offer document or solicitation of
offer to buy or sell or subscribe for securities or other financial instruments. Nothing in this report constitutes investment, legal, accounting and tax advice or a representation that any investment or strategy is suitable or
appropriate to your specific circumstances. The securities discussed and opinions expressed in this report may not be suitable for all investors, who must make their own investment decisions, based on their own investment
objectives, financial positions and needs of specific recipient. This may not be taken in substitution for the exercise of independent judgment by any recipient. Each recipient of this document should make such investigations
as it deems necessary to arrive at an independent evaluation of an investment in the securities of companies referred to in this document (including the merits and risks involved), and should consult its own advisors to
determine the merits and risks of such an investment. The investment discussed or views expressed may not be suitable for all investors. Certain transactions -including those involving futures, options, another derivative
products as well as non-investment grade securities - involve substantial risk and are not suitable for all investors. No representation or warranty, express or implied, is made as to the accuracy, completeness or fairness of
the information and opinions contained in this document. The Disclosures of Interest Statement incorporated in this document is provided solely to enhance the transparency and should not be treated as endorsement of the
views expressed in the report. This information is subject to change without any prior notice. The Company reserves the right to make modifications and alternations to this statement as may be required from time to time
without any prior approval. MOSL, its associates, their directors and the employees may from time to time, effect or have effected an own account transaction in, or deal as principal or agent in or for the securities
mentioned in this document. They may perform or seek to perform investment banking or other services for, or solicit investment banking or other business from, any company referred to in this report. Each of these entities
functions as a separate, distinct and independent of each other. The recipient should take this into account before interpreting the document. This report has been prepared on the basis of information that is already
available in publicly accessible media or developed through analysis of MOSL. The views expressed are those of the analyst, and the Company may or may not subscribe to all the views expressed therein. This document is
being supplied to you solely for your information and may not be reproduced, redistributed or passed on, directly or indirectly, to any other person or published, copied, in whole or in part, for any purpose. This report is not
directed or intended for distribution to, or use by, any person or entity who is a citizen or resident of or located in any locality, state, country or other jurisdiction, where such distribution, publication, availability or use would
be contrary to law, regulation or which would subject MOSL to any registration or licensing requirement within such jurisdiction. The securities described herein may or may not be eligible for sale in all jurisdictions or to
certain category of investors. Persons in whose possession this document may come are required to inform themselves of and to observe such restriction. Neither the Firm, not its directors, employees, agents or
representatives shall be liable for any damages whether direct or indirect, incidental, special or consequential including lost revenue or lost profits that may arise from or in connection with the use of the information.
The
person accessing this information specifically agrees to exempt MOSL or any of its affiliates or employees from, any and all responsibility/liability arising from such misuse and agrees not to hold MOSL or any of its affiliates or
employees responsible for any such misuse and further agrees to hold MOSL or any of its affiliates or employees free and harmless from all losses, costs, damages, expenses that may be suffered by the person accessing this
information due to any errors and delays.
Registered Office Address: Motilal Oswal Tower, Rahimtullah Sayani Road, Opposite Parel ST Depot, Prabhadevi, Mumbai-400025; Tel No.: 022-3980 4263; www.motilaloswal.com. Correspondence Address: Palm Spring
Centre, 2nd Floor, Palm Court Complex, New Link Road, Malad (West), Mumbai- 400 064. Tel No: 022 3080 1000. Compliance Officer: Neeraj Agarwal, Email Id:
na@motilaloswal.com,
Contact No.:022-30801085.
Registration details of group entities.: MOSL: NSE (Cash): INB231041238; NSE (F&O): INF231041238; NSE (CD): INE231041238; BSE (Cash): INB011041257; BSE(F&O): INF011041257; BSE(CD); MSE(Cash): INB261041231;
MSE(F&O): INF261041231; MSE(CD): INE261041231; CDSL: IN-DP-16-2015; NSDL: IN-DP-NSDL-152-2000; Research Analyst: INH000000412. AMFI: ARN 17397. Investment Adviser: INA000007100. Motilal Oswal Asset
Management Company Ltd. (MOAMC): PMS (Registration No.: INP000000670) offers PMS and Mutual Funds products. Motilal Oswal Wealth Management Ltd. (MOWML): PMS (Registration No.: INP000004409) offers wealth
management solutions. *Motilal Oswal Securities Ltd. is a distributor of Mutual Funds, PMS, Fixed Deposit, Bond, NCDs, Insurance and IPO products. * Motilal Oswal Commodities Broker Pvt. Ltd. offers Commodities
Products. * Motilal Oswal Real Estate Investment Advisors II Pvt. Ltd. offers Real Estate products. * Motilal Oswal Private Equity Investment Advisors Pvt. Ltd. offers Private Equity products
13 December 2016
36