17 October 2017
Q2FY18 Results Update | Sector: Technology
Wipro
Neutral
BSE SENSEX
32,634
Bloomberg
Equity Shares (m)
M.Cap.(INRb)/(USDb)
52-Week Range (INR)
1, 6, 12 Rel. Per (%)
Avg Val, INRm
Free float (%)
S&P CNX
10,231
WPRO IN
Asymmetrical growth dynamics…
4,867
…continue restricting broad-based revival
1,411.6 / 21.8
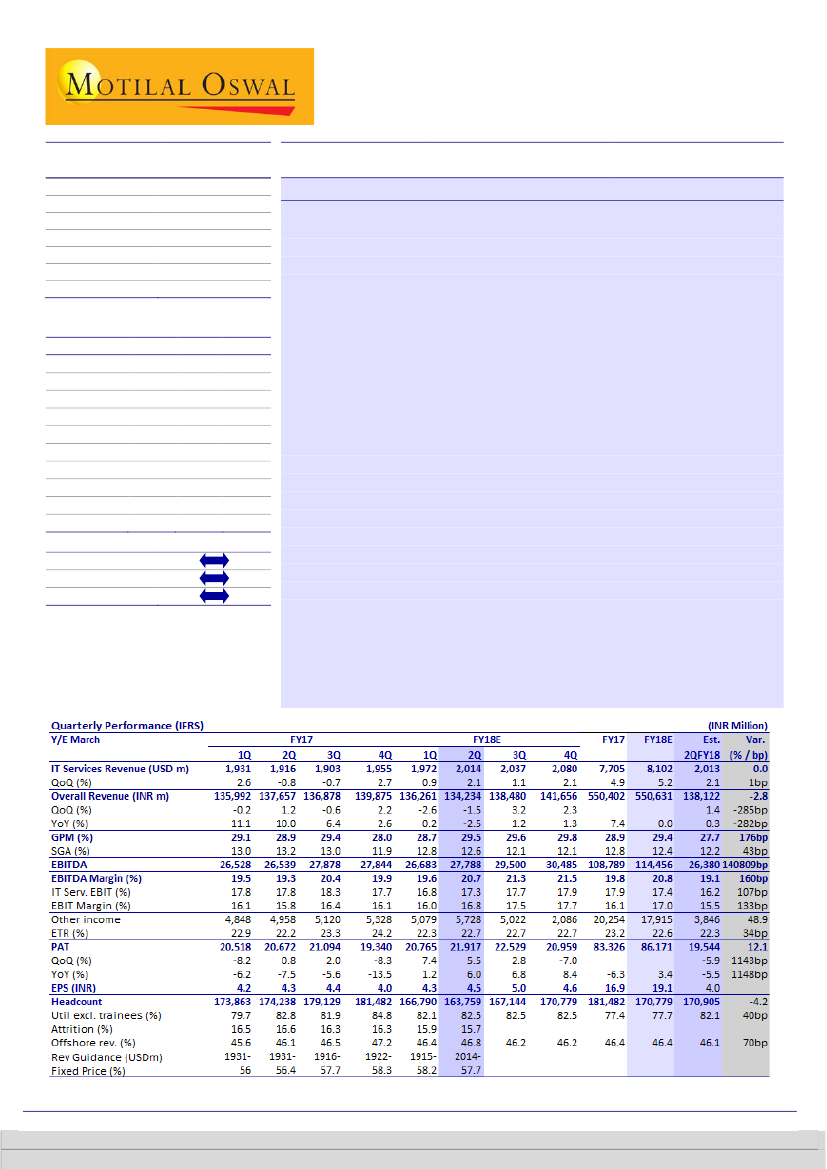
Revenue growth below expectations:
2QFY18 CC revenue growth of 0.3%
304 / 205
QoQ was below our estimate of 1% QoQ and at the lower end of WPRO’s
0/5/4
guidance of -0.5% to +1.5% QoQ. Barring Communications (-4.4% QoQ CC)
868.5
and Healthcare (-5.9%), performance across verticals was impressive, mainly
26.8
CMP: INR290
TP: INR280(-3%)
Financials & Valuations (INR b)
2017 2018E
Y/E Mar
550.4
550.6
Net Sales
108.8
114.5
EBITDA
83.3
86.2
PAT
16.9
19.1
EPS (INR)
-6.3
13.0
Gr. (%)
105.9
110.3
BV/Sh (INR)
16.9
17.0
RoE (%)
13.6
13.9
RoCE (%)
17.1
15.2
P/E (x)
2.7
2.6
P/BV (x)
2019E
598.7
129.3
90.7
20.1
5.2
130.4
16.7
15.2
14.4
2.2
Estimate change
TP change
Rating change
in BFSI (+3.3%). Though WPRO expects bottoming out of these problem
areas, the guidance tells a different story.
3Q guidance not signifying revival:
For 3Q, WPRO expects revenue of
USD2,014-2,054m, implying CC growth of 0-2%. On YoY CC basis, this implies
growth of 2.3-4.4% for 3Q, which at its midpoint is not materially higher
than +2.9% YoY CC in 2Q. Given that the two problem verticals alone pulled
overall growth down by 180bp QoQ, a revival there is necessary to translate
into broad-based performance; portfolio issues and lopsided growth are a
familiar story in the case of WPRO.
Profitability beat across businesses:
IT Services EBIT margin at 17.3% (+50bp
QoQ) beat our estimate by 110bp. Margin expansion, despite wage hike
impact, was commendable, driven by improved operational efficiency (also
reflected in steady 80%+ utilization and headcount reduction). Products
business saw sharp profitability improvement as WPRO consolidated its
operations (business is half the size of previous quarter). This aided overall
EBIT margin of 16.8% (130bp beat). Apart from this, higher other income led
to PAT of INR21.9b (+5.5% QoQ, est. of -5.9% QoQ).
Valuation view:
We raise EPS by 3% for FY19/20E, factoring in margin beat
in Services/Products. However, we believe it would be crucial for WPRO to
start seeing recovery on organic growth and it to be reflected in optimistic
guidance to sustain current valuations. WPRO trades at 15.2/14.4x FY18/
FY19E EPS. We expect revenues/earnings (led by buyback) CAGR of 6.3/9.0%
over FY17-19E. Our TP of INR280 discounts FY19E EPS by 14x.
Neutral.
Investors are advised to refer through important disclosures made at the last page of the Research Report.
Motilal Oswal research is available on www.motilaloswal.com/Institutional-Equities, Bloomberg, Thomson Reuters, Factset and S&P Capital.
Ashish Chopra – Research Analyst
(Ashish.Chopra@MotilalOswal.com); +91 22 6129 1530
Sagar Lele – Research Analyst
(Sagar.Lele@MotilalOswal.com); +91 22 6129 1531

Wipro
2QFY18:
Revenue pressure reflected in performance and guidance
WPRO’s 2QFY18 CC revenue growth was 0.3% QoQ, below of estimate of 1%
QoQ and slightly below the midpoint of its guidance range of -0.5% to +1.5%
QoQ.
In dollar terms, revenue grew 2.1% QoQ to USD2,014m, in line with our
estimate. This was largely driven by a cross-currency tailwind of 180bp QoQ
against our estimate of 110bp.
In Rupee terms, overall revenue was INR134.2b, -1.5% QoQ, compared to our
estimate of INR138.1b, +1.4% QoQ. The miss was a function of cutting of the
Product business into half.
Exhibit 1: Revenue growth of 0.3% QoQ CC in IT services
IT Services (USD m)
1.2
1.8
1.3
-1.2
1.1
2.1
2.4
QoQ Growth (%)
2.6
-0.8
-0.7
2.7
0.9
2.1
0.3
Source: Company, MOSL
IT Services EBIT margin was up 50bp QoQ to 17.3%, ahead of our estimate of
16.2% (-60bp QoQ). Margin improvement during the quarter, despite negative
impact of wage hikes was a function of improved operational efficiency.
Overall EBIT margin was higher by 80bp QoQ to 16.8%; a beat of 130bp as the
company’s Product business saw an improvement in profitability.
Exhibit 2: IT Services EBIT margin expanded by 50bp to
17.3%
IT Services EBIT margin (%)
IT Services SGA as % of Sales
Exhibit 3: Utilization steadily above 80%
Utilization % (incl. trainees)
Utilization % (excl. trainees)
Source: Company, MOSL
PAT was INR21.9b, growth of 5.5% QoQ, above our estimate of INR19.5b, led by
higher profitability in both Services and Products and higher-than-expected
other income.
17 October 2017
2

Wipro
Tepid guidance for 3Q implies no pick-up going forward
For 3QFY18, the company expects revenues between USD2,014m –USD2,054m
– implying QoQ CC growth between 0% to +2.0%.
The company expects a recovery in Communications starting in 3Q, which has
been seeing a decline because of project closures; and in Healthcare starting in
4Q, as uncertainty around reforms in the US has already severely impacted the
ecosystem.
The guidance is in constant currency and is based on the average realized rates
during for 2QFY18, at GBP/USD at 1.34, Euro/USD at 1.19, AUD/USD at 0.81,
USD/INR at 64.26 and USD/CAD at 1.23.
Segmental analysis
In terms of verticals, while strength was seen in BFSI (3.3% QoQ CC); growth was
dragged down by Communications (-4.4% QoQ CC), Energy, Natural Resources
and Utilities (-1.3% QoQ CC) and Healthcare and Lifesciences (-5.9% QoQ CC).
Amongst geographies, growth was led by APAC and Other Emerging Markets
(3.4% QoQ CC). Americas continued to exhibit weakness as it declined by 0.1%
QoQ CC basis, and grew by 2.2% YoY CC.
Business Process Services (1.7% QoQ CC), Global Infrastructure Services (1.5%
QoQ CC) and Product Engineering (1.2% QoQ CC) drove growth during the
quarter.
Exhibit 4: Growth bogged down by Healthcare and Communications
Verticals
Communications
Consumer Business Unit
Energy, Natural Resources & Utilities
Finance Solutions
Healthcare, Life Sciences and Services
Manufacturing & Technology
Contri to
Rev. (%)
6.5
15.9
13.5
27.6
13.7
22.8
CC Growth -
QoQ (%)
-4.4
1.7
-1.3
3.3
-5.9
1.9
CC Growth -
YoY (%)
-12.1
4.5
5.2
10.8
-10.5
5.4
Source: Company, MOSL
Exhibit 5: US continues to remain weak, growing at 2.2% YoY CC
Geographies
US
Europe
India & Middle East business
APAC and other emerging markets
Contri to
Rev. (%)
53.6
25.1
9.9
11.4
CC Growth
- QoQ (%)
-0.1
1.3
-3.4
3.4
CC Growth
- YoY (%)
2.2
4.4
-2.3
7.0
Source: Company, MOSL
Exhibit 6: Decline seen in Analytics and Application Services
Geographies
Analytics
Application Services
Business Process Services
Global Infrastructure Services
Product Engineering
Contri to
Rev. (%)
7.1
45.5
12.1
28.4
6.9
CC Growth
- QoQ (%)
-1.3
-0.8
1.7
1.5
1.2
CC Growth
- YoY (%)
-1.0
6.3
-6.3
3.3
-0.2
Source: Company, MOSL
17 October 2017
3

Wipro
Update on the 6 themes that define strategic direction
[1] Digital:
Digital now constitutes to 24.1% of overall revenue, and grew by 10%
QoQ. It has further advanced its capabilities in the area of design, with the
acquisition of Cooper, a leading design consultancy firm based out of the US. The
Cloud business, which is a subset of Digital has now reached USD1b in terms of
annual run-rate. WPRO opened two additional Digital pods during the quarter; one
in Mountain View, California and one in Edinburgh, Scotland; taking the total to 16
globally.
[2] Client mining:
Growth in the top 10 customers has been picking up for WPRO,
with it bettering company average. It is now able to sell new offerings to existing
customers in order to mine the accounts better.
[3] Markets:
Localization efforts taken by the company improved further this
quarter as the percentage of locals across markets increased by 200bp. In the US,
52% of the workforce is now local.
[4] Non linearity:
WPRO applied for 80 patents during the quarter, taking the total
(applications plus grants) to 1,789. Many of the patents applied during the quarter
are around HOLMES and Blockchain.
[5] Hyper-automation:
The company has deployed 2,000 instances of automation
through 74 bots across 250 customers. Automation initiatives have been progressing
well. While it was automating L1 tasks earlier, WPRO has now started to measure
automation and productivity improvement in L2 activities. In 2QFY18, it redeployed
2,500 people from these initiatives.
[6] Leveraging the partner ecosystem:
WPRO won 18 new customers in partnership
with investments in Wipro Ventures. It has also been seeing increased traction with
industry analysts, who have placed with WPRO in the top quadrant in 65 categories,
versus 14 in CY14.
Takeaways from management commentary
Recovery seen in problem areas:
Over the past few quarters, WPRO has seen
gradual improvement across its problem areas – first it was Energy & Utilities,
and then the India & Middle East business. While Communications and
Healthcare have been an issue in the recent past, it expects a bottoming out of
both these verticals; and revival starting in 3Q and 4Q respectively.
Digital-led strength in BFSI:
Unlike peers, WPRO has been seeing strong traction
in BFSI. Historically, this vertical has formed a lower proportion of overall
revenue. Customers in the BFSI vertical have ben adopting Digital at a faster
pace, and at scale. That has been the primary growth driver for Wipro in BFSI
across geographies.
3Q to be impacted by seasonality:
Although the company has been seeing
strength in BFSI, stability in Consumer and E&U, and revival in Communications
and Healthcare; it isn’t being reflected in guidance as 3Q is likely to be
negatively impacted by furloughs and a lower number of working days. Adjusted
17 October 2017
4

Wipro
for seasonality, the company has been seeing a revival in operational
performance.
Endeavor is to maintain margins (more or less):
2Q margins were stable despite
two months of wage hike as the company managed to pull its operational
efficiency levers. For FY18E, WPRO’s endeavor would be to maintain margins in
a narrow band compared to FY17, on a constant currency basis. As revenue
growth expectations get better, margin trajectory is also expected to go upward.
Change in Estimates: Adjusting revenue estimates for the miss and margin
estimates for the beat!
We factor in the constant currency revenue miss in 2Q and the tepid guidance
for 3Q, which is a function of pressure in the verticals of Communications and
Healthcare. As a result of this, our revenue estimates for FY18/19/20 have been
reduced by ~0.4% each.
On account of the 110bp margin beat in the quarter, Wipro has demonstrated
strong execution through sustained operational efficiency and productivity
improvement resulting out of its HOLMES platform, despite a soft performance
in revenue growth. This leads us to revise our IT Services EBIT margin estimates
by ~40bp going forward. Unlike peers, we expect margin expansion for Wipro
going forward, in anticipation of revenue growth revival.
Our estimates for consolidated margins have inched higher by ~100bp for
FY19/20 as the business saw improvement in profitability in the Products
segment.
This boosts overall EPS expectations by 3% for FY19/20 despite the revenue
growth miss in 2Q and lower-than-expected guidance for 3Q.
Exhibit 7: Change in estimates
FY18E
66.1
8,102
5.2
17.0
17.4
19.1
Revised
FY19E
67.2
8,710
7.5
17.8
18.1
20.1
FY20E
67.5
9,335
7.2
18.2
18.5
22.1
FY18E
66.1
8,132
5.6
16.2
17.0
18.2
Earlier
FY19E
67.2
8,742
7.5
16.9
17.7
19.5
FY20E
67.5
9,372
7.2
17.2
18.1
21.5
FY18E
0.0%
-0.4%
-40bp
77bp
40bp
4.8%
Change
FY19E
0.0%
-0.4%
1bp
98bp
39bp
3.0%
FY20E
0.0%
-0.4%
-3bp
98bp
39bp
2.9%
INR/USD
USD Revenue - m
Growth (%)
EBIT Margin - Overall (%)
EBIT Margin - IT Services (%)
EPS - INR (IT Serv & Products)
Source: Company, MOSL
Valuation and view – Performance lacking broad-based traction
The change in leadership at WPRO has been followed by some tweaks to the
organization structure, while role redundancies and senior exits are a natural
consequence of the process. WPRO to its credit got through with most of those
changes swiftly, to shift focus on execution of the strategy than the distraction
from getting the team in place.
As WPRO’s new leader, Mr. Abid Ali has chalked out an aggressive plan for
WPRO, targeting to reach USD15b revenues with 23% EBIT margin. That implies
revenue CAGR of ~20% over the next four years, and if the margins attain the
300bp expansion, then even higher CAGR for earnings. However, as is the case
with INFO, this is far-fetched and they will do well to get anywhere near these
levels given the current momentum in bread-n-butter business.
5
17 October 2017

Wipro
Much before that, WPRO expects to catch up with industry-growth by 4QFY18.
However, revenue growth YoY has decelerated in the last four quarters and
guidance of 3.4% YoY CC growth at the midpoint for 3QFY18 implies no revival in
trajectory. Growth underperformance at WPRO is an outcome of persistent
issues with the portfolio mix - while Energy & Utilities has started to stabilize;
performance in Communications, Consumer and Healthcare is being diluted by
industry pressures. These three verticals together constitute to 37% of total
revenue, making it difficult to make a case for an immediate recovery in
performance.
WPRO has been active on the investment front, with spending aimed towards
building capabilities, training and incentivizing people, acquiring businesses, and
investing in strategic accounts. This has dragged margins in the past couple of
years, and with Automation stepping in, it now expects margins to stabilize in a
narrow band (17-18% IT Services EBIT).
WPRO trades at 15.2/14.4x FY18/19E EPS. We expect the revenues and earnings
(aided by the buyback) CAGR of 6.3/9.0% over FY17-19E. Our price target of
INR280 discounts FY19E EPS by 14x. Maintain
Neutral.
Key triggers
Pick-up in YoY CC growth guidance ex-acquisitions
Broad-basing of growth across verticals
Uptick in margins from automation and productivity initiatives
Key risk factors
Prolonged weakness in Healthcare / Consumer vertical
Weakness in top accounts
Continued softness in the Americas and Europe
Exhibit 9: 1-year forward PB band
Max (x)
-1SD
17.5
20.5
15.1
11.9
6.0
5.8
4.6
3.4
2.2
1.0
3.0
2.4
1.4
2.4
P/B (x)
Min (x)
Avg (x)
+1SD
Max (x)
-1SD
4.8
3.6
Exhibit 8: 1-year forward PE band
P/E (x)
Min (x)
24.0
18.0
12.0
6.0
0.0
14.7
Avg (x)
+1SD
Source: Bloomberg, MOSL
17 October 2017
6

Wipro
Story in charts
Exhibit 10: Growth guidance has failed to materially pick-up
Midpoint of QoQ CC growth guidance (%)
2.9 3.0
2.0
0.9
0.3
2.5
1.5
3.0
2.0
0.5
1.0
1.5
0.5
1.0
5.0
-1.0
6.4
Exhibit 11: Resulting in yet another year of under
performance
18.9
13.4
7.0
3.7
7.5
7.2
Revenue (USD m)
Growth (%)
4.9
5.2
Source: Company, MOSL
Exhibit 12: While E&U stabilizes, other verticals take a hit
15.5
10.3
9.0
3.7
(1.3)(2.1)
(4.2)
(9.5)
(10.1)
(6.5)
(8.2)
(6.6)
(2.8)
10.0
Exhibit 13: Utilization has been inching up
Utilization % (incl. trainees)
Utilization % (excl. trainees)
Source: Company, MOSL
Exhibit 14: Visible uptick in investments (indexed at 100)
144
128
112
96
80
S&M (IT Serv)
USD revenues
Exhibit 15: Lever of FPP continues to play…
Revenue proportion fron Fixed price contracts (%)
Source: Company, MOSL
17 October 2017
7

Wipro
Operating metrics
Exhibit 16: Operating metrics
2QFY16
Services Composition (%)
IMS
BPO
Product Engg and Mobility
Wipro Analytics
Application Services
Total
R&D
Consulting
Verticals (%)
Global Media & Telecom
Finance Solutions
Manufacturing & Hitech
Healthcare Lifescience
Retail & Transportation
Energy, Natural Resources & Utilities
Communications
Consumer
Manufacturing & Technology
3QFY16
28.1
9.8
8.0
7.4
46.7
100.0
10.4
1.6
4QFY16
28.9
10.6
8.0
7.2
45.3
100.0
10.3
1.4
1QFY17
27.9
12.9
7.1
7.4
44.7
100.0
-
-
2QFY17
28.2
13.4
7.3
7.3
43.8
100.0
-
-
3QFY17
28.1
13.3
7.2
7.0
44.4
100.0
-
-
4QFY17
28.0
12.3
7.1
6.9
45.7
100.0
-
-
1QFY18
28.1
12.0
7.0
7.1
45.8
100.0
-
-
2QFY18
28.4
12.1
6.9
7.1
45.5
100.0
-
-
28.0
9.8
7.9
7.5
46.8
100.0
10.5
1.9
26.7
11.4
14.7
7.6
16.2
23.4
53.0
25.2
10.6
11.2
10
17
31
85
154
244
321
533
26.2
12.0
14.4
7.7
16.5
23.2
52.8
24.8
11.0
11.4
9
17
32
85
154
247
325
536
25.4
13.3
14.0
7.7
16.4
23.2
52.5
25.6
11.0
10.9
9
18
33
89
160
248
331
550
25.6
15.3
13.2
7.6
15.8
22.5
53.5
25.4
10.4
10.7
9
19
33
91
170
252
336
565
25.5
16.0
12.9
7.5
15.7
22.4
54.8
24.0
10.4
10.8
8
19
33
91
171
258
341
571
25.5
16.0
13.0
7.4
15.8
22.3
55.5
23.6
10.0
10.9
9
17
33
90
170
264
349
576
26.0
15.4
13.1
6.9
15.8
22.8
54.9
24.4
9.9
10.8
9
18
34
91
163
268
354
602
26.7
14.8
13.4
6.8
15.8
22.5
54.5
24.2
10.4
10.9
9
18
36
90
163
262
357
624
27.6
13.7
13.5
6.5
15.9
22.8
53.6
25.1
9.9
11.4
9
16
39
90
170
270
370
627
Geography (%)
Americas
Europe
India & Middle East business
APAC and Other Emerging Markets
Customer size distribution (TTM)
> $100M
> $75M
> $50M
> $20M
> $10M
> $5M
> $3M
> $1M
Customer metrics
Revenue from Existing customers %
Number of new customers
Total Number of active customers
Customer Concentration (%)
Top customer
Top 5
Top 10
98.5
67
1100
3.1
11.7
19.8
97.9
39
1105
3.2
11.5
19.3
96.5
119
1223
2.7
11.0
18.2
99.7
50
1208
2.5
10.3
17.6
98.6
47
1180
2.6
10.1
17.5
97.6
108
1259
2.8
10.0
16.9
96.0
51
1323
2.9
10.0
16.9
99.6
45
1244
2.9
10.3
17.5
99.2
45
1274
3.1
11.0
18.0
Source: MOSL, Company
17 October 2017
8

Wipro
Exhibit 17: Operating metrics
2QFY16
EMPLOYEE METRICS
Closing Headcount - IT Services
163,396
Sales & Support staff - IT Services (average)
13,068
Utilization (IT Services excl. BPO, IFOX and I&ME)
Gross Utilization (%)
69.5
Net Utilization (excl support) (%)
77.2
Net Utilization (excl trainees) (%)
82.3
Attrition
IT Services excluding BPO and I&ME
Voluntary TTM
16.4
Voluntary Quarterly Annualized
16.8
Involuntary Quarterly Annualized
-
BPO - Quarterly
10.2
BPO - Post training
8.5
IT SERVICES (EXCL INFOX, BPO, I&ME)
Service Delivery
Revenue from FPP
53.4
% of onsite revenue
53.9
% of offshore revenue
46.1
IMS
2.1
BPO
7.6
Product Engg and Mobility
4.8
Wipro Analytics
2.1
Application Services
0.6
R&D
Consulting
Vertical wise
Global Media and Telecom
Finance Solutions
Manufacturing and Hi-Tech
Healthcare, Life Sciences and Services
Retail and Transportation
Energy and Utilities
Communications
Consumer
Manufacturing & Technology
3QFY16
170,664
13,239
66.4
73.8
78.0
4QFY16
172,912
13,737
68.1
76.1
77.5
1QFY17
173,863
14,324
69.9
78.8
79.7
2QFY17
174,238
14,543
71.2
80.2
82.8
3QFY17
174,238
14,543
71.6
80.0
81.9
4QFY17
181,482
14,612
73.1
81.9
84.8
1QFY18
166,790
14,769
72.0
80.3
82.1
2QFY18
163,759
14,880
72.9
81.8
82.5
16.3
16.3
-
9.9
8.8
16.1
14.9
-
11.1
9.9
16.5
17.9
-
11.7
9.0
16.6
17.2
-
12.2
10.8
16.3
15.4
-
10.7
8.2
16.3
14.8
-
11.2
9.0
15.9
16.1
-
12.8
11.4
15.7
16.7
-
13.5
11.9
55.9
53.8
46.2
0.7
0.3
1.6
-1.0
0.1
-0.6
-15.5
56.9
54.2
45.8
5.3
10.7
2.4
-0.4
-0.7
1.4
-10.4
56.0
54.4
45.6
-1.0
24.9
-8.9
5.4
1.2
-
-
56.4
53.9
46.1
0.3
3.1
2.0
-2.1
-2.7
-
-
57.7
53.5
46.5
-1.1
-1.4
-2.1
-4.8
0.7
-
-
58.3
52.8
47.2
2.4
-5.0
1.3
1.3
5.7
-
-
58.2
53.6
46.4
1.2
-1.6
-0.5
3.8
1.1
-
-
57.7
53.2
46.8
3.2
3.0
0.7
2.1
1.5
-
-
4.1
14.1
1.7
3.9
-1.3
4.9
2.1
3.0
3.1
0.5
2.1
1.2
-4.1
-1.3
4.7
2.5
-1.5
5.6
-1.7
1.7
2.2
-0.5
0.0
-1.2
4.1
2.1
3.6
-3.2
-3.4
1.0
-0.7
13.5
-0.5
2.4
1.8
2.4
1.8
5.7
2.4
-2.1
-13.6
2.4
-5.5
3.8
3.4
18.0
-3.3
1.3
-1.2
-0.5
4.5
1.8
-3.0
0.7
-5.0
-3.6
4.0
3.3
-1.1
3.8
-3.0
-2.1
-1.4
-1.2
1.7
-6.2
-0.8
0.2
3.2
-4.6
0.6
-0.6
-0.7
-0.7
0.1
-2.0
-0.1
-1.1
0.6
-2.4
-4.5
0.2
6.9
-4.7
-7.4
0.0
4.7
-1.1
3.5
-4.2
2.7
5.0
1.6
6.2
1.7
1.8
6.4
1.3
2.7
2.7
3.6
-3.1
3.2
-0.6
0.9
-0.5
0.1
0.0
6.0
1.8
0.9
5.1
5.3
0.1
5.6
-5.5
2.9
-1.8
3.3
3.4
0.4
5.9
-2.8
6.8
9.2
9.0
-0.7
1.5
Geography wise
US
Europe
India & Middle East business
Other Emerging markets
Client Concentration
Top client
top 2-5 clients
Top 6-10 clients
Non top 10 clients
Source: MOSL, Company
17 October 2017
9

Wipro
Financials and Valuations
Key assumption
Y/E Mar
INR/USD Rate
Revenues (USD m)
Offshore Revenue (%)
Total Headcount
Net Addition
Per Capita Productivity (USD)
Gross Utilization (%)
IT Services EBIT Margin (%)
2013
54.3
6,218
46.4
145,812
9,892
42,643
66.7
20.5
2013
374,256
17.4
77,996
20.8
10,650
67,346
0
11,250
0
78,596
16,912
21.5
322
61,362
61,362
17.3
2013
4,926
278,886
283,812
63,816
0
348,799
115,556
65,031
50,525
0
69,222
263,513
3,263
108,623
87,869
63,758
90,931
90,931
0
172,582
348,799
2014
60.4
6,618
45.9
146,053
241
45,312
66.4
22.6
2014
434,269
16.0
97,099
22.4
11,106
85,993
0
15,012
0
101,005
22,601
22.4
438
77,966
77,966
27.1
2014
4,932
338,567
343,499
51,592
0
396,478
127,586
76,137
51,449
0
60,843
324,654
2,293
124,726
117,862
79,773
105,826
105,826
0
218,828
396,478
2015
62.2
7,082
46.0
158,217
12,164
44,759
68.7
22.0
2015
469,545
8.1
104,609
22.3
12,823
91,786
0
19,897
0
111,683
24,594
22.0
531
86,558
86,558
11.0
2015
4,937
403,045
407,982
78,913
0
488,541
143,166
88,960
54,206
0
57,775
412,043
4,849
133,869
164,017
109,308
111,492
111,492
0
300,551
488,541
2016
66.3
7,346
45.9
172,912
14,695
42,486
68.9
20.5
2016
512,440
9.1
108,119
21.1
14,965
93,154
0
21,565
0
114,719
25,305
22.1
492
88,922
88,922
2.7
2016
4,941
461,137
466,078
125,221
0
593,523
168,877
103,925
64,952
0
137,851
404,286
5,390
150,653
104,724
143,519
131,398
131,398
0
272,888
593,523
2017
68.6
7,705
46.4
181,482
8,570
42,453
71.6
17.9
2017
550,402
7.4
108,789
19.8
20,256
88,533
0
20,254
0
108,787
25,213
23.2
248
83,326
83,326
-6.3
2017
4,861
515,443
520,304
142,412
0
665,107
193,975
124,181
69,794
0
299,133
282,871
3,915
139,941
62,457
76,558
128,409
128,409
0
154,462
665,107
2018E
66.1
8,102
46.4
170,779
-10,703
47,439
71.8
17.4
2018E
550,631
0.0
114,456
20.8
20,890
93,566
0
17,915
0
111,482
25,207
22.6
118
86,171
86,171
3.4
2018E
9,733
486,206
495,939
141,839
0
640,222
245,551
145,071
100,480
0
267,900
253,220
2,717
153,570
-27,548
124,481
130,788
130,788
0
122,432
640,222
2019E
67.2
8,710
46.2
184,529
13,750
47,199
71.2
18.1
2019E
598,742
8.7
129,256
21.6
22,516
106,740
2020E
67.5
9,335
46.1
197,229
12,700
47,333
71.3
18.5
2020E
643,891
7.5
140,690
21.9
23,571
117,119
Y/E Mar
Net Sales
Change (%)
EBITDA
EBITDA Margin (%)
Depreciation
EBIT
Interest
Other Income
Extraordinary items
PBT
Tax
Tax Rate (%)
Min. Int. & Assoc. Share
Reported PAT
Adjusted PAT
Change (%)
Y/E Mar
Share Capital
Reserves
Net Worth
Debt
Deferred Tax
Total Capital Employed
Gross Fixed Assets
Less: Acc Depreciation
Net Fixed Assets
Capital WIP
Investments
Current Assets
Inventory
Debtors
Cash & Bank
Loans & Adv, Others
Curr Liabs & Provns
Curr. Liabilities
Provisions
Net Current Assets
Total Assets
Income Statement
(INR Million)
0
11,921
0
118,661
27,885
23.5
125
90,671
90,671
5.2
2019E
9,733
576,876
586,609
129,724
0
718,778
281,447
167,587
113,860
0
267,900
327,855
2,955
166,974
22,004
135,922
140,247
140,247
0
187,608
718,778
0
13,385
0
130,504
30,668
23.5
126
99,730
99,730
10.0
2020E
9,733
622,223
631,956
117,617
0
752,018
294,827
167,587
127,240
0
267,900
356,554
3,177
179,563
32,422
141,392
149,087
149,087
0
207,468
752,018
Balance Sheet
(INR Million)
17 October 2017
10

Wipro
Financials and Valuations
Y/E Mar
Basic (INR)
EPS
Cash EPS
Book Value
DPS
Payout (incl. Div. Tax.)
Valuation(x)
P/E
Cash P/E
Price / Book Value
EV/Sales
EV/EBITDA
Dividend Yield (%)
Profitability Ratios (%)
RoE
RoCE
RoIC
Turnover Ratios (%)
Asset Turnover (x)
Debtors (No. of Days)
Leverage Ratios (%)
Net Debt/Equity (x)
Y/E Mar
Adjusted EBITDA
Non cash opr. exp (inc)
(Inc)/Dec in Wkg. Cap.
Tax Paid
Other operating activities
CF from Op. Activity
(Inc)/Dec in FA & CWIP
Free cash flows
(Pur)/Sale of Invt
Others
CF from Inv. Activity
Inc/(Dec) in Net Worth
Inc / (Dec) in Debt
Interest Paid
Divd Paid (incl Tax) & Others
CF from Fin. Activity
Inc/(Dec) in Cash
Add: Opening Balance
Closing Balance
Ratios
2013
12.5
14.6
57.8
3.5
28.1
2014
15.8
18.1
69.9
4.0
25.3
2015
17.6
20.2
83.0
6.0
34.2
2016
18.1
21.1
94.8
3.0
16.6
2017
16.9
21.0
105.9
1.0
5.8
17.1
13.8
2.7
2.2
11.1
0.3
2018E
19.1
23.7
110.3
0.0
0.0
15.2
12.2
2.6
2.2
10.5
0.0
17.0
13.9
0.0
6.7
97
2019E
20.1
25.1
130.4
0.0
0.0
14.4
11.6
2.2
1.9
8.9
0.0
16.7
15.2
0.0
5.7
98
2020E
22.1
27.3
140.5
10.0
45.2
13.1
10.6
2.1
1.7
8.0
3.4
16.4
15.5
0.0
5.5
98
21.6
18.9
0.0
7.0
107
24.9
22.5
0.0
8.8
98
23.0
20.2
0.0
9.3
101
20.3
16.7
0.0
9.0
101
16.9
13.6
0.0
8.5
96
-0.1
2013
77,996
2,872
7,501
0
0
88,369
-2,187
86,182
-8,949
0
-11,136
-42,436
4,368
0
-28,962
-67,030
10,203
77,666
87,869
-0.2
2014
97,099
-57
-11,909
0
0
85,133
-12,030
73,103
-5,753
0
-17,783
4,919
-11,324
0
-30,952
-37,357
29,993
87,869
117,862
-0.2
2015
104,609
-24,594
-40,250
0
0
39,765
-15,580
24,185
41,476
0
25,896
0
30,937
0
-50,443
-19,506
46,155
117,862
164,017
0.0
2016
108,119
-7,970
-36,478
0
0
63,671
-25,711
37,960
-124,079
0
-149,790
-12,421
53,336
0
-14,088
26,826
-59,293
164,017
104,724
0.2
2017
108,789
-19,615
79,553
0
0
168,727
-25,098
143,629
-189,532
0
-214,630
-23,087
18,161
0
8,561
3,636
-42,267
104,724
62,457
0.3
2018E
114,456
-25,311
-51,742
0
0
37,403
-51,576
-14,173
18,296
0
-33,279
-110,482
-1,561
0
17,915
-94,128
-90,005
62,457
-27,548
0.2
2019E
129,256
-27,990
-12,984
0
0
88,282
-35,896
52,386
-2,640
0
-38,536
0
-12,115
0
11,921
-194
49,552
-27,548
22,004
0.1
2020E
140,690
23,610
-8,180
0
0
156,120
-36,951
119,169
-1,262
0
-38,213
0
-12,107
0
-95,383
-107,490
10,418
22,004
32,422
Cash Flow Statement
(INR Million)
17 October 2017
11

Wipro
Corporate profile
Company description
Exhibit 1: Sensex rebased
Wipro is the third largest Indian IT services
company and the largest third-party BPO operator
in India. It is the largest third-party R&D services
provider globally, employing over 156,000
employees. It offers among the widest range of IT
and ITeS services and its corporate governance and
transparency are at the highest level in the industry.
Source: MOSL/Bloomberg
Exhibit 2: Shareholding pattern (%)
Jun-17
Promoter
DII
FII
Others
73.2
6.6
10.8
9.5
Mar-17
73.3
6.5
10.8
9.5
Jun-16
55.5
4.9
6.9
32.7
Source: Capitaline
Exhibit 3: Top holders
Holder Name
Life Insurance Corporation Of India
Icici Prudential Equity Income Fund
First State Investments Icvc- Stewart
Investors Asia Pacific Leaders Fund
NA
NA
% Holding
3.0
1.5
1.3
0.0
0.0
Source: Capitaline
Note: FII Includes depository receipts
Exhibit 4: Top management
Name
Azim H Premji
Abidali Z Neemuchwala
M Sanaulla Khan
Designation
Chairman & Managing Director
Executive Director & CEO
Company Secretary
Exhibit 5: Directors
Name
Ashok S Ganguly
M K Sharma
Patrick Dupuis
William Arthur Owens
Name
Ireena Vittal
N Vaghul
Patrick J Ennis
Rishad Azim Premji
Source: Capitaline
*Independent
Exhibit 6: Auditors
Name
B S R & Co LLP
Type
Statutory
Exhibit 7: MOSL forecast v/s consensus
EPS
(INR)
FY18
MOSL
forecast
19.1
20.1
22.1
Consensus
forecast
17.9
19.2
20.4
Variation (%)
6.8
4.5
8.1
Source: Bloomberg
Source: Capitaline
FY19
FY20
17 October 2017
12

Wipro
NOTES
17 October 2017
13

Disclosures:
The following Disclosures are being made in compliance with the SEBI Research Analyst Regulations 2014 (herein after referred to as the Regulations).
Motilal Oswal Securities Ltd. (MOSL) is a SEBI Registered Research Analyst having registration no. INH000000412. MOSL, the Research Entity (RE) as defined in the Regulations, is engaged in the business of providing Stock
broking services, Investment Advisory Services, Depository participant services & distribution of various financial products. MOSL is a subsidiary company of Motilal Oswal Financial Service Ltd. (MOFSL). MOFSL is a listed
public company, the details in respect of which are available on
www.motilaloswal.com.
MOSL is registered with the Securities & Exchange Board of India (SEBI) and is a registered Trading Member with National Stock
Exchange of India Ltd. (NSE) and Bombay Stock Exchange Limited (BSE), Metropolitan Stock Exchange Of India Ltd. (MSE) for its stock broking activities & is Depository participant with Central Depository Services Limited
(CDSL) & National Securities Depository Limited (NSDL) and is member of Association of Mutual Funds of India (AMFI) for distribution of financial products. Details of associate entities of Motilal Oswal Securities Limited are
available on the website at
http://onlinereports.motilaloswal.com/Dormant/documents/Associate%20Details.pdf
Pending Regulatory Enquiries against Motilal Oswal Securities Limited by SEBI:
SEBI pursuant to a complaint from client Shri C.R. Mohanraj alleging unauthorized trading, issued a letter dated 29th April 2014 to MOSL notifying appointment of an Adjudicating Officer as per SEBI regulations to hold
inquiry and adjudge violation of SEBI Regulations; MOSL requested SEBI to provide all documents, records, investigation report relied upon by SEBI which were referred in Show Cause Notice and also sought personal
hearing. The matter is currently pending.
MOSL, it’s associates, Research Analyst or their relative may have any financial interest in the subject company. MOSL and/or its associates and/or Research Analyst may have beneficial ownership of 1% or more securities in
the subject company at the end of the month immediately preceding the date of publication of the Research Report.
MOSL and its associate company(ies), their directors and Research Analyst and their relatives may; (a)
from time to time, have a long or short position in, act as principal in, and buy or sell the securities or derivatives thereof of companies mentioned herein. (b) be engaged in any other transaction involving such securities and
earn brokerage or other compensation or act as a market maker in the financial instruments of the company(ies) discussed herein or act as an advisor or lender/borrower to such company(ies) or may have any other
potential conflict of interests with respect to any recommendation and other related information and opinions.; however the same shall have no bearing whatsoever on the specific recommendations made by the analyst(s),
as the recommendations made by the analyst(s) are completely independent of the views of the associates of MOSL even though there might exist an inherent conflict of interest in some of the stocks mentioned in the
research report.
Research Analyst may have served as director/officer, etc. in the subject company in the last 12 month period. MOSL and/or its associates may have received any compensation from the subject company in
the past 12 months.
In the last 12 months period ending on the last day of the month immediately preceding the date of publication of this research report, MOSL or any of its associates may have:
a)
managed or co-managed public offering of securities from subject company of this research report,
b)
received compensation for investment banking or merchant banking or brokerage services from subject company of this research report,
c)
received compensation for products or services other than investment banking or merchant banking or brokerage services from the subject company of this research report.
d)
Subject Company may have been a client of MOSL or its associates during twelve months preceding the date of distribution of the research report.
MOSL and it’s associates have not received any compensation or other benefits from the subject company or third party in connection with the research report. To enhance transparency, MOSL has incorporated a Disclosure
of Interest Statement in this document. This should, however, not be treated as endorsement of the views expressed in the report. MOSL and / or its affiliates do and seek to do business including investment banking with
companies covered in its research reports. As a result, the recipients of this report should be aware that MOSL may have a potential conflict of interest that may affect the objectivity of this report. Compensation of Research
Analysts is not based on any specific merchant banking, investment banking or brokerage service transactions.
Terms & Conditions:
This report has been prepared by MOSL and is meant for sole use by the recipient and not for circulation. The report and information contained herein is strictly confidential and may not be altered in any way, transmitted to,
copied or distributed, in part or in whole, to any other person or to the media or reproduced in any form, without prior written consent of MOSL. The report is based on the facts, figures and information that are considered
true, correct, reliable and accurate. The intent of this report is not recommendatory in nature. The information is obtained from publicly available media or other sources believed to be reliable. Such information has not
been independently verified and no guaranty, representation of warranty, express or implied, is made as to its accuracy, completeness or correctness. All such information and opinions are subject to change without notice.
The report is prepared solely for informational purpose and does not constitute an offer document or solicitation of offer to buy or sell or subscribe for securities or other financial instruments for the clients. Though
disseminated to all the customers simultaneously, not all customers may receive this report at the same time. MOSL will not treat recipients as customers by virtue of their receiving this report.
Analyst Certification
The views expressed in this research report accurately reflect the personal views of the analyst(s) about the subject securities or issues, and no part of the compensation of the research analyst(s) was, is, or will be directly or
indirectly related to the specific recommendations and views expressed by research analyst(s) in this report.
Wipro
Disclosure of Interest Statement
Analyst ownership of the stock
Wipro
No
A graph of daily closing prices of securities is available at
www.nseindia.com, www.bseindia.com.
Research Analyst views on Subject Company may vary based on Fundamental research and Technical Research. Proprietary
trading desk of MOSL or its associates maintains arm’s length distance with Research Team as all the activities are segregated from MOSL research activity and therefore it can have an independent view with regards to
subject company for which Research Team have expressed their views.
Regional Disclosures (outside India)
This report is not directed or intended for distribution to or use by any person or entity resident in a state, country or any jurisdiction, where such distribution, publication, availability or use would be contrary to law,
regulation or which would subject MOSL & its group companies to registration or licensing requirements within such jurisdictions.
For Hong Kong:
This report is distributed in Hong Kong by Motilal Oswal capital Markets (Hong Kong) Private Limited, a licensed corporation (CE AYY-301) licensed and regulated by the Hong Kong Securities and Futures Commission (SFC)
pursuant to the Securities and Futures Ordinance (Chapter 571 of the Laws of Hong Kong) “SFO”. As per SEBI (Research Analyst Regulations) 2014 Motilal Oswal Securities (SEBI Reg No. INH000000412) has an agreement with
Motilal Oswal capital Markets (Hong Kong) Private Limited for distribution of research report in Hong Kong. This report is intended for distribution only to “Professional Investors” as defined in Part I of Schedule 1 to SFO. Any
investment or investment activity to which this document relates is only available to professional investor and will be engaged only with professional investors.” Nothing here is an offer or solicitation of these securities,
products and services in any jurisdiction where their offer or sale is not qualified or exempt from registration. The Indian Analyst(s) who compile this report is/are not located in Hong Kong & are not conducting Research
Analysis in Hong Kong.
For U.S.
Motilal Oswal Securities Limited (MOSL) is not a registered broker - dealer under the U.S. Securities Exchange Act of 1934, as amended (the"1934 act") and under applicable state laws in the United States. In addition MOSL is
not a registered investment adviser under the U.S. Investment Advisers Act of 1940, as amended (the "Advisers Act" and together with the 1934 Act, the "Acts), and under applicable state laws in the United States.
Accordingly, in the absence of specific exemption under the Acts, any brokerage and investment services provided by MOSL, including the products and services described herein are not available to or intended for U.S.
persons. This report is intended for distribution only to "Major Institutional Investors" as defined by Rule 15a-6(b)(4) of the Exchange Act and interpretations thereof by SEC (henceforth referred to as "major institutional
investors"). This document must not be acted on or relied on by persons who are not major institutional investors. Any investment or investment activity to which this document relates is only available to major institutional
investors and will be engaged in only with major institutional investors. In reliance on the exemption from registration provided by Rule 15a-6 of the U.S. Securities Exchange Act of 1934, as amended (the "Exchange Act") and
interpretations thereof by the U.S. Securities and Exchange Commission ("SEC") in order to conduct business with Institutional Investors based in the U.S., MOSL has entered into a chaperoning agreement with a U.S.
registered broker-dealer, Motilal Oswal Securities International Private Limited. ("MOSIPL"). Any business interaction pursuant to this report will have to be executed within the provisions of this chaperoning agreement.
The Research Analysts contributing to the report may not be registered /qualified as research analyst with FINRA. Such research analyst may not be associated persons of the U.S. registered broker-dealer, MOSIPL, and
therefore, may not be subject to NASD rule 2711 and NYSE Rule 472 restrictions on communication with a subject company, public appearances and trading securities held by a research analyst account.
For Singapore
Motilal Oswal Capital Markets Singapore Pte Limited is acting as an exempt financial advisor under section 23(1)(f) of the Financial Advisers Act(FAA) read with regulation 17(1)(d) of the Financial Advisors Regulations and is a
subsidiary of Motilal Oswal Securities Limited in India. This research is distributed in Singapore by Motilal Oswal Capital Markets Singapore Pte Limited and it is only directed in Singapore to accredited investors, as defined in
the Financial Advisers Regulations and the Securities and Futures Act (Chapter 289), as amended from time to time. In respect of any matter arising from or in connection with the research you could contact the following
representatives of Motilal Oswal Capital Markets Singapore Pte Limited:
Disclaimer:
The report and information contained herein is strictly confidential and meant solely for the selected recipient and may not be altered in any way, transmitted to, copied or distributed, in part or in whole, to any other person
or to the media or reproduced in any form, without prior written consent. This report and information herein is solely for informational purpose and may not be used or considered as an offer document or solicitation of
offer to buy or sell or subscribe for securities or other financial instruments. Nothing in this report constitutes investment, legal, accounting and tax advice or a representation that any investment or strategy is suitable or
appropriate to your specific circumstances. The securities discussed and opinions expressed in this report may not be suitable for all investors, who must make their own investment decisions, based on their own investment
objectives, financial positions and needs of specific recipient. This may not be taken in substitution for the exercise of independent judgment by any recipient. Each recipient of this document should make such investigations
as it deems necessary to arrive at an independent evaluation of an investment in the securities of companies referred to in this document (including the merits and risks involved), and should consult its own advisors to
determine the merits and risks of such an investment. The investment discussed or views expressed may not be suitable for all investors. Certain transactions -including those involving futures, options, another derivative
products as well as non-investment grade securities - involve substantial risk and are not suitable for all investors. No representation or warranty, express or implied, is made as to the accuracy, completeness or fairness of
the information and opinions contained in this document. The Disclosures of Interest Statement incorporated in this document is provided solely to enhance the transparency and should not be treated as endorsement of the
views expressed in the report. This information is subject to change without any prior notice. The Company reserves the right to make modifications and alternations to this statement as may be required from time to time
without any prior approval. MOSL, its associates, their directors and the employees may from time to time, effect or have effected an own account transaction in, or deal as principal or agent in or for the securities
mentioned in this document. They may perform or seek to perform investment banking or other services for, or solicit investment banking or other business from, any company referred to in this report. Each of these entities
functions as a separate, distinct and independent of each other. The recipient should take this into account before interpreting the document. This report has been prepared on the basis of information that is already
available in publicly accessible media or developed through analysis of MOSL. The views expressed are those of the analyst, and the Company may or may not subscribe to all the views expressed therein. This document is
being supplied to you solely for your information and may not be reproduced, redistributed or passed on, directly or indirectly, to any other person or published, copied, in whole or in part, for any purpose. This report is not
directed or intended for distribution to, or use by, any person or entity who is a citizen or resident of or located in any locality, state, country or other jurisdiction, where such distribution, publication, availability or use would
be contrary to law, regulation or which would subject MOSL to any registration or licensing requirement within such jurisdiction. The securities described herein may or may not be eligible for sale in all jurisdictions or to
certain category of investors. Persons in whose possession this document may come are required to inform themselves of and to observe such restriction. Neither the Firm, not its directors, employees, agents or
representatives shall be liable for any damages whether direct or indirect, incidental, special or consequential including lost revenue or lost profits that may arise from or in connection with the use of the information.
The
person accessing this information specifically agrees to exempt MOSL or any of its affiliates or employees from, any and all responsibility/liability arising from such misuse and agrees not to hold MOSL or any of its affiliates or
employees responsible for any such misuse and further agrees to hold MOSL or any of its affiliates or employees free and harmless from all losses, costs, damages, expenses that may be suffered by the person accessing this
information due to any errors and delays.
Registered Office Address: Motilal Oswal Tower, Rahimtullah Sayani Road, Opposite Parel ST Depot, Prabhadevi, Mumbai-400025; Tel No.: 022-3980 4263; www.motilaloswal.com. Correspondence Address: Palm Spring
Centre, 2nd Floor, Palm Court Complex, New Link Road, Malad (West), Mumbai- 400 064. Tel No: 022 3080 1000. Compliance Officer: Neeraj Agarwal, Email Id:
na@motilaloswal.com,
Contact No.:022-30801085.
Registration details of group entities.: MOSL: NSE (Cash): INB231041238; NSE (F&O): INF231041238; NSE (CD): INE231041238; BSE (Cash): INB011041257; BSE(F&O): INF011041257; BSE(CD); MSE(Cash): INB261041231;
MSE(F&O): INF261041231; MSE(CD): INE261041231; CDSL: IN-DP-16-2015; NSDL: IN-DP-NSDL-152-2000; Research Analyst: INH000000412. AMFI: ARN 17397. Investment Adviser: INA000007100. Motilal Oswal Asset
Management Company Ltd. (MOAMC): PMS (Registration No.: INP000000670) offers PMS and Mutual Funds products. Motilal Oswal Wealth Management Ltd. (MOWML): PMS (Registration No.: INP000004409) offers wealth
management solutions. *Motilal Oswal Securities Ltd. is a distributor of Mutual Funds, PMS, Fixed Deposit, Bond, NCDs, Insurance and IPO products. * Motilal Oswal Commodities Broker Pvt. Ltd. offers Commodities
Products. * Motilal Oswal Real Estate Investment Advisors II Pvt. Ltd. offers Real Estate products. * Motilal Oswal Private Equity Investment Advisors Pvt. Ltd. offers Private Equity products
17 October 2017
14