18 October 2017
2QFY18 Results Update | Sector: Automobiles
Bajaj Auto
Buy
BSE SENSEX
32,584
Bloomberg
Equity Shares (m)
M.Cap.(INRb)/(USDb)
52-Week Range (INR)
1, 6, 12 Rel. Per (%)
Avg Val, INRm
Free float (%)
S&P CNX
10,211
BJAUT IN
289
935.2 / 14.4
3310 / 2510
6/3/0
808
50.7
CMP: INR3,232 TP: INR3,753(+16%)
Better mix, lower staff cost drive above-estimate operating performance
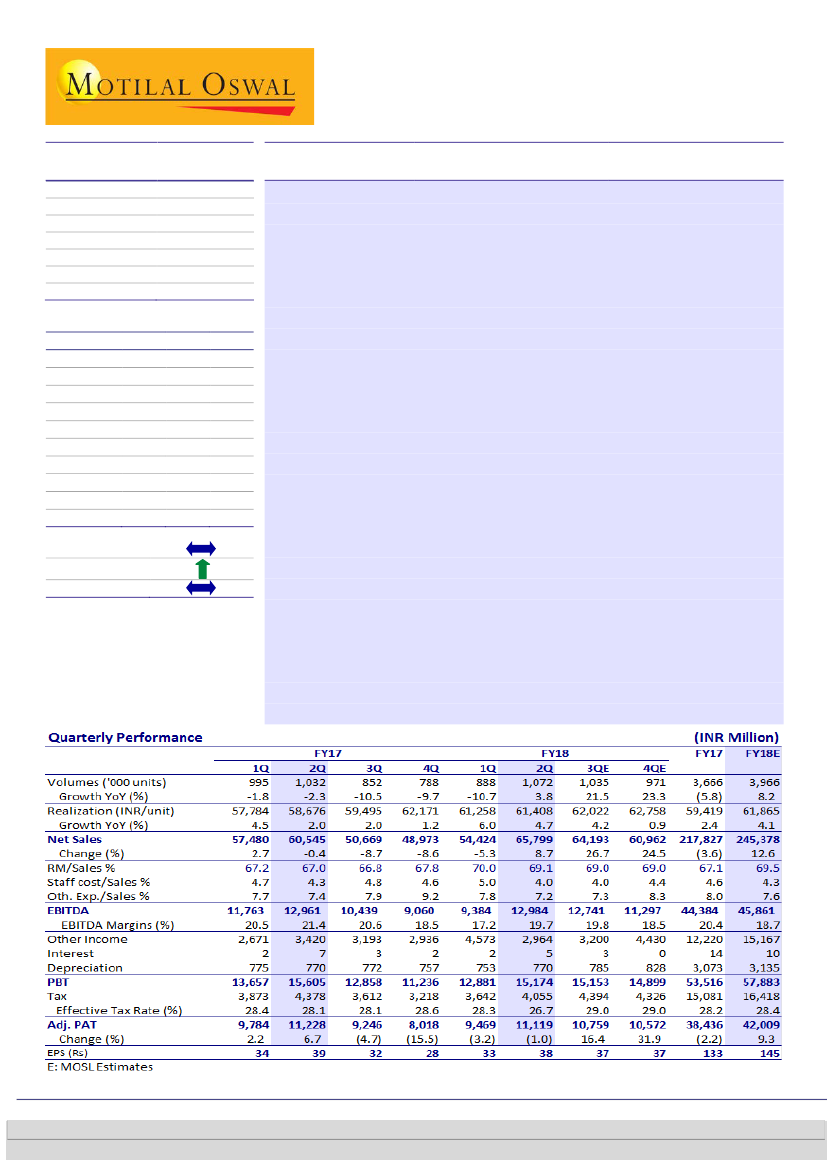
Favorable product mix drives realization:
Net sales rose 8.7% YoY (+20.9%
QoQ) to INR65.8b (in-line), led by volume growth of 3.8% YoY (+20.6% QoQ).
Realization improved 4.7% YoY (flat QoQ) due to a favorable mix (higher share
of 3W).
EBITDA margin recovers from multi-quarter low:
EBITDA came in flat YoY at
INR13b (in-line), implying EBITDA margin of 19.7% (-170bp YoY, +250bp QoQ;
est. of 19.1%). Lower-than-estimated RM cost and lower staff cost boosted the
operating performance. The impact of lower other income was diluted by a
lower tax rate. Adj. PAT declined 1% YoY to INR11.1b (est. of INR11.2b).
Management commentary:
(a)
Company expects domestic motorcycle
industry growth at 8-8.5% in FY18, with BJAUT’s domestic motorcycles growth
at ~3% (+20% in 2HFY18). (b) Recent launches of CT100 ES, Platina and Pulsar
160 NS have started on a positive note. (c) Exports are estimated at 1.7m units,
led by ramp-up in nascent markets and recovery in Nigeria. (d) Management
guided for domestic 3W volumes at 300k (~20% growth), as momentum in key
markets remains strong. (e) It guided for EBITDA margin of ~20%. (f) Impact of
higher raw material prices should reflect in 2HFY18, which might be passed on
gradually to customers. (g) It plans to launch a new brand in the 125cc segment
and an Avenger upgrade in 4QFY18. Also, it is in the process of launching a
modified V. (h) Price hikes were taken in export markets in July and October
2017. No price hike was taken in domestic markets in 2QFY18.
Valuation and view:
Valuations at 22.3x/18.5x FY18E/19E standalone EPS are
attractive, considering the worst of volumes and margins is behind. We value
BJAUT at INR3,753 (21x Sep-19 core EPS, and add INR526 cash/share and
INR256/share value of KTM stake), implying Sep-19 PE of 19.8x. Maintain
Buy.
Financials & Valuations (INR b)
Y/E Mar
2018E 2019E 2020E
Net Sales
245
279
319
EBITDA
46.4
57.1
66.5
PAT
42.0
50.7
58.9
EPS (INR)
145
175
204
Gr. (%)
9.8
20.6
16.4
BV/Sh (INR)
656
726
777
RoE (%)
23.3
25.3
27.1
RoCE (%)
22.6
24.6
36.2
P/E (x)
22.3
18.5
15.9
P/BV (x)
4.9
4.5
4.2
Estimate change
TP change
Rating change
Jinesh Gandhi – Research Analyst
(Jinesh@MotilalOswal.com); +91 22 3982 5416
Deep Shah – Research Analyst
(Deep.Shah@MotilalOswal.com) |
Suneeta Kamath – Research Analyst
(Suneeta.Kamath@MotilalOswal.com)
Investors are advised to refer through important disclosures made at the last page of the Research Report.
Motilal Oswal research is available on www.motilaloswal.com/Institutional-Equities, Bloomberg, Thomson Reuters, Factset and S&P Capital.

Bajaj Auto
Favourable product mix drives realization growth of 4.7% YoY, moderates
RM costs
Net sales increased by 8.7% YoY (+20.9% QoQ) to INR65.8b (in-line) as volume
grew by 3.8% YoY (+20.6% QoQ).
Realization improved by 4.7% YoY (flat QoQ) due to a favorable mix (higher
share of 3W, Pulsar). Recovery in key export markets and domestic 3W market
gave a boost to volumes in the current quarter.
Total motorcycle volumes increased by 2.4% YoY (+18.4% QoQ) to ~919k units
as domestic motorcycle volume was flat YoY (+37% QoQ). 2W exports volume
grew 5.3% YoY (-4.1% QoQ).
3W volume increased by ~13.6% YoY (+35.5% QoQ) as domestic volume
increased by ~14.6% YoY (+62.6% QoQ) while exports recovered and grew by
~12.5% YoY (+11.9% QoQ).
KTM’s domestic volume increased 35% YoY led by healthy response to recently
launched KTM 250 and KTM 390.
BJAUT’s market share in domestic motorcycle segment contracted by 180bp YoY
to 17% (+300bp QoQ). The sequential market share gain has been led by new
launches.
The company is temporarily deferring 3W export orders and diverting capacity
to the domestic market due to an overwhelming demand in the domestic
market. Management’s outlook for 3W continues to remain very positive.
Recently launched motorcycles like Pulsar NS series, CT 100 ES, New Platina
continue to do well.
Exhibit 1: Trend in product mix
2QFY18
Motorcycles
Domestic
% of total domestic
Exports
% of total exports
Total Motorcycles
% of total
Three Wheelers
Domestic
% of total domestic
Exports
% of total exports
Total 3Ws
% of total volumes
Total Volumes
583,997
87.2
334,724
83.3
918,721
85.7
85,594
12.8
67,195
16.7
152,789
14.3
1,071,510
2QFY17
579,545
88.6
317,869
84.2
897,414
87.0
74,694
11.4
59,751
15.8
134,445
13.0
1,031,859
YoY (%)
0.8
5.3
2.4
1QFY18
426,562
89.0
349,152
85.3
775,714
87.3
52,655
11.0
60,065
14.7
112,720
12.7
888,434
QoQ (%)
36.9
-4.1
18.4
FY17
2,001,391
88.8
1,218,541
86.3
3,219,932
87.8
253,226
11.2
192,792
13.7
446,018
12.2
3,665,950
FY16
1,898,957
88.2
1,459,295
83.9
3,358,252
86.3
254,995
11.8
280,334
16.1
535,329
13.7
3,893,581
YoY (%)
-5.1
19.8
4.3
14.6
12.5
13.6
3.8
62.6
11.9
35.5
20.6
0.7
45.4
20.0
6.2
Source: Company, MOSL
18 October 2017
2

Bajaj Auto
Exhibit 2: Trend in market share
(%)
Segment Wise
Economy
Executive
Executive 100
Executive 125
Premium
Premium excl RE
Dom. Motorcycles
Total Motorcycles
Total Dom. 2W
Total 2W (incl exports)
Dom. 3W
3W (incl exports)
2QFY18
32.0
1.8
0.0
5.7
33.6
46.5
17.0
22.7
10.3
14.6
55.4
60.8
2QFY17
35.1
1.6
0.0
5.1
40.5
53.7
18.8
24.9
11.4
16.0
50.4
57.9
YoY (bp)
-300
30
0
60
-690
-710
-180
-220
-110
-140
510
290
1QFY18
25.3
2.2
0.0
6.9
29.3
42.0
14.0
21.3
8.6
14.0
48.3
60.3
QoQ (bp)
670
-40
0
-120
420
450
300
140
160
60
720
50
FY17
32.2
2.3
0.0
7.7
38.1
52.4
18.0
24.5
11.2
16.2
49.5
56.7
FY16
35.6
3.6
1.3
9.1
36.4
48.6
17.7
26.0
11.4
17.7
47.3
56.7
YoY (%)
-340
-130
-130
-140
170
380
20
-150
-20
-160
210
-10
Source: Company, MOSL
Exhibit 3: Domestic realizations stable on QoQ basis
Export Realizations
Domestic Realizations
62 59 60 61
62
60 60
57 55 60 60
55
49 54 53
67
62 62
Exhibit 4: Domestic motorcycle market share to revive as
benefit of new product launch to accrue
Domestic Motorcycle
29
28 27 27
26 26 26
23
Total Motorcycle
24
25 25 25
23 21 23
27 27 26
23
61 56 56 57 55 61 60
52 53 50 52 51 53 55 59 55 55 56
20 19
19 19 18
18 18
17
16 17 15 18 18 18 18
16
14
1Q 2Q 3Q 4Q 1Q 2Q 3Q 4Q 1Q 2Q 3Q 4Q 1Q 2Q 3Q 4Q 1Q 2Q
FY14
FY15
FY16
FY17
FY18
1Q 2Q 3Q 4Q 1Q 2Q 3Q 4Q 1Q 2Q 3Q 4Q 1Q 2Q 3Q 4Q 1Q 2Q
FY14
FY15
FY16
FY17
FY18
Source: Company, MOSL
Exhibit 5: Domestic 2W product mix worsens QoQ
Economy
Premium <200
11.2
12.8
31.2
11.8
0.3
45.4
40.4
0.0 7.5
39.2
Executive 100
Premium >200
8.7
10.8
43.8
0.0 5.3
42.2
41.4
0.0 4.4
43.4
Executive 125
Premium >300
9.5
39.2
0.0 6.7
44.5
11.3
39.5
0.0
11.0
36.0
9.3
37.9
0.0 8.4
43.6
9.0
36.3
5.5
48.2
6.3
29.1
4.7
8.2
51.5
8.8
31.7
10.5
3.2
45.9
1QFY16 2QFY16 3QFY16 4QFY16 1QFY17 2QFY17 3QFY17 4QFY17 1QFY18 2QFY18
Source: Company, MOSL
18 October 2017
3

Bajaj Auto
EBITDA margin shrinks ~170bp YoY (+250bp QoQ) to 19.7%, ~60bp higher
than estimate
EBITDA was flat YoY at Rs13b (in-line), implying EBITDA margin of 19.7% (-170bp
YoY, +250bp QoQ; v/s est. of 19.1%).
Lower than estimated RM cost and lower staff cost boosted operating
performance.
Impact of lower other income was diluted by lower tax rate. Adj. PAT declined
1% to INR11.1b (v/s est. INR11.2b).
Bajaj’s share of profit from KTM increased by 4% YoY (+74% QoQ) to INR0.82b.
Exhibit 6: EBITDA margin recovers from multi-quarter low
21.9 22.1
18.5
EBITDA (INR/Unit)
EBITDA Margins (%)
21.7
21.7 21.1 21.5
21.4
20.6
20.5
20.4
19.7
18.5
18.9
18.9
17.7
17.6
17.2
1Q
2Q 3Q
FY14
4Q
1Q
2Q
3Q
4Q
1Q
2Q
3Q
4Q
1Q
2Q
3Q
4Q
1Q
2Q
FY15
FY16
FY17
FY18
Source: Company, MOSL
Key takeaways from Earnings call
Management
guided for domestic motorcycle industry growth of ~8-8.5%
in
FY18, with BJAUT growing at ~3%. It expects BJAUT to outperform the industry
in 2HFY18, with growth of ~20% in 2HFY18. Consequently, management
estimates a market share of 24% in Mar-18 (v/s 19.5% in Sep 17).
Expects domestic 3W industry growth to clock in ~310k volumes in FY18
(implying growth of ~22% YoY), led by discontinuation of permits in
Maharashtra, new permits released in Delhi and replacement of 2-stroke
vehicles to 4-stroke vehicles in Bengaluru. Incremental domestic demand of
100k vehicles would be coming from the above-mentioned factors in the next 6-
7 months. The company is deferring 3W export orders in Oct and Nov, and
diverting capacity to the domestic market to meet incremental domestic
demand.
Management has guided for total three wheeler volume of 570k for FY18
(implying growth of ~28% v/s our estimate ~25%).
Guided for 15% CAGR in export volumes over next three years
on the back of
stability returning in Nigeria, increasing contribution from new/nascent markets,
and substantial growth in Bangladesh and Philippines. Expects exports to clock
1.7m units
in FY18 (v/s our estimate of 1.62m units).
Guided for EBITDA margin to remain in the
20% range
going forward. EBITDA
margin in 2HFY18 to be ~22% (as per company reporting).
Management indicated further pressure on raw material cost in 2HFY18 due to
the continuing uptrend in steel and aluminum prices. Price hike would be taken
as and when management deems appropriate.
18 October 2017
4

Bajaj Auto
On new launches:
A new brand in the 125cc mid-commuter segment would be
launched in 4QFY18. The company would also come out with an Avenger
upgrade and a modified V in 4QFY18.
The company witnessed festive-to-festive retail growth of 25% YoY.
The new /nascent markets currently constitute ~16% of the total export
volumes v/s 10% in FY17. This can go up to 20-22%. These markets are medium
to small geographies with high growth potential. Sales in these markets are
tilted toward higher-end motorcycles.
On the profitability front, management indicated that EBITDA margins in 3W
are ~25%. While
Pulsar
family margins remain at ~20%,
CT100
is EBITDA
negative and
Platina
has low-single-digit margins. Spares business generates
30% EBITDA margin.
The new Pulsar NS series is doing well and has clocked 42k units in sales in
2QFY18. It has enabled BJAUT to regain 45% market share in the premium (ex
RE) segment.
Management estimates a run-rate of 60k from
Pulsar
post festive season. It
expects
Dominar
to sell 7-7.5k units aggregately in the domestic and export
market by Mar 18. They expect the
V series
and
Avenger
to register 30k
units/month and 15k units/month respectively, after the new launch in 4QFY18.
Management expects
spare parts revenue to grow at 12-15% CAGR
over the
next three years.
Tax rate is likely to be 29-30% in H2FY18.
Sales in Nigeria were 23k units in Sep-17 v/s 8k in Apr-17 v/s peak of over 30k.
Sales in Nigeria could average 25k/month in 2HFY18.
BJAUT does not compete with Honda in export market, main competitor is TVS.
Hedging rate would be around INR67/USD for the next one year.
Took price hikes of INR500-1,000/unit in 2W and INR1,500-2,000/unit in 3W in
domestic markets towards the end of May. Export price hike taken on 1
st
July
and 1
st
October.
Capex of INR2.5-3b, most of which would be maintenance capex, is outlined for
FY18. No plans of capacity expansion for three wheelers in the near term.
Valuation view
Domestic volume recovery to drive ~15.5% EPS CAGR:
Recovery in industry
demand, especially in premium segment would drive market share gains for BJAUT.
We expect premium motorcycle segment to grow faster than motorcycle industry.
This coupled with new product launches and operating leverage would drive 15.5%
EPS CAGR over FY17-20E.
Exports bottomed out, expect recovery on low base:
We expect a recovery in
exports with the Nigerian market stabilizing and increasing contribution from
new/nascent markets. Structurally, export is a big opportunity due to low 2 wheeler
penetrations in targeted markets and use of 2-wheeler for public transport. BJAUT is
best placed amongst Indian players in the long run due to strong presence.
Deploying accumulated cash a big challenge:
BJAUT has net cash of ~INR127b as of
Sep 2017. With annual FCF generation of over ~INR30b, we see limited avenues to
deploy such cash flows in its existing businesses. While BJAUT might be evaluating
18 October 2017
5

Bajaj Auto
alliances in global markets, there is considerable scope to increase payouts or do
buy-backs.
Maintain Buy with TP of ~INR3,753:
We believe worst of volumes and margins is
behind us, with expected recovery in volumes in domestic as well as export markets
from 2HFY18. Valuations at 22.3x/18.5x FY18E/19E S/A EPS are attractive. We value
BJAUT at 21x Sep 19 core EPS and add INR526/share cash/share and INR256/share
for its KTM stake to arrive at a TP of INR3,753. Implied reported PE at our TP is
~19.8x Sep-19 EPS. Maintain
Buy.
Exhibit 7: Revised estimates
FY18E
Vols ('000 units)
Net Sales
EBITDA
EBITDA Margins (%)
Net Profit
EPS (INR)
Rev
3,966
245,378
46,405
18.9
42,009
145.2
Old
3,956
246,705
46,815
19.0
41,774
144.4
Chg (%)
0.3
-0.5
-0.9
-10bp
0.6
0.6
Rev
4,398
278,567
57,146
20.5
50,652
175.0
FY19E
Old
4,386
280,075
56,950
20.3
50,434
174.3
Chg (%)
0.3
-0.5
0.3
20bp
0.4
0.4
Source: MOSL
Exhibit 8: BJAUT P/E trading above long-term average,
driven by improving fundamentals
26
20
14
8
3.1
2
P/E (x)
Min (x)
Avg (x)
+1SD
19.7
Max (x)
-1SD
20.2
21.7
15.1
10.5
Exhibit 9: BJAUT’s P/BV at below historical average
8.5
6
3.5
1
4.0
1.8
P/B (x)
Min (x)
Avg (x)
+1SD
8.0
6.4
5.2
4.8
Max (x)
-1SD
Source: MOSL
Source: MOSL
EV/EBITDA (x)
FY18E FY19E
16.8
13.3
13.0
12.4
29.5
18.9
14.9
12.8
17.2
13.1
5.0
2.9
12.7
9.8
29.0
23.4
19.0
14.3
14.4
24.9
17.8
15.0
12.0
11.1
19.5
14.8
RoE (%)
FY18E FY19E
23.3
25.3
34.0
31.4
26.7
34.2
13.5
14.3
20.4
23.0
11.0
27.4
23.8
27.0
36.1
36.4
19.3
13.8
15.8
17.8
21.8
22.9
14.8
17.7
20.5
24.0
Div Yield (%) EPS CAGR (%)
FY18E FY19E
FY17-19E
2.0
2.5
15.0
2.4
2.4
8.0
0.4
0.7
44.5
1.5
1.5
22.7
1.1
1.3
23.9
0.1
0.1
75.9
1.5
1.7
24.2
0.5
0.6
35.2
0.7
1.1
0.6
0.8
0.3
0.8
1.1
0.7
1.1
0.6
39.5
15.1
8.4
21.5
29.3
Exhibit 10: Comparative Valuation
Auto OEM's
Bajaj Auto
Hero MotoCorp
TVS Motor
M&M
Maruti Suzuki
Tata Motors
Ashok Leyland
Eicher Motors
Auto Ancillaries
Bharat Forge
Exide Industries
Amara Raja Batteries
BOSCH
Endurance Tech
CMP
Rating
(INR)*
3,232 Buy
3,748 Neutral
690 Buy
1,371 Buy
7,790 Buy
434 Buy
131 Buy
31,478 Buy
629 Buy
208 Buy
684 Buy
21,773 Neutral
1,108 Buy
TP
(INR)
3,753
3,868
719
1,585
9,417
562
145
36,487
726
279
854
22,781
1,229
P/E (x)
FY18E FY19E
22.3
18.5
20.3
19.0
45.7
28.1
19.7
16.8
27.3
20.4
21.6
7.1
24.5
18.6
38.1
28.1
34.4
23.3
26.7
40.3
37.4
24.7
19.4
20.8
31.2
28.2
Source: Company, MOSL
18 October 2017
6

Bajaj Auto
Exhibit 11: Key operating metrics
000 units
Motorcycles (units)
Domestic
Growth (%)
% of total volumes
Exports
Growth (%)
% of total volumes
Total M/Cycles
Growth (%)
% of total volumes
3Ws
Domestic
Growth (%)
% of total volumes
Exports
Growth (%)
% of total volumes
3Ws
Growth (%)
% of total volumes
Total Volumes
Growth (%)
Avg. Net Realn (INR/unit)
Growth (%)
Net Revenues (INR B)
Growth (%)
EBITDA (INR B)
Ebitda margins (%)
EBITDA (INR/Unit)
Growth (%)
PAT (INR B)
EPS
FY13
2,464
-4.0
58.1
1,293
2.0
30.5
3,757
-2.0
88.7
226
11.4
5.3
254
-18.7
6.0
480
-6.8
11.3
4,237
-2.6
44,665
5.4
195
3.2
36
18.2
8,579.5
-2.3
30
105
FY14
2,099
-14.8
54.2
1,323
2.3
34.2
3,422
-8.9
88.4
187
-17.3
4.8
261
2.7
6.7
448
-6.7
11.6
3,870
-8.7
48,443
8.5
197
1.2
41
20.4
10,608.9
12.9
32
112
FY15
1,771
-15.6
46.5
1,521
15.0
39.9
3,292
-3.8
86.4
234
25.4
6.1
285
9.2
7.5
519
16.0
13.6
3,811
-1.5
51,853
7.0
211
7.0
41
19.0
10,801.2
0.3
30
105
FY16
1,899
7.2
48.8
1,459
-4.1
37.5
3,358
2.0
86.3
255
8.8
6.5
280
-1.6
7.2
535
3.1
13.7
3,894
2.2
53,697
3.6
222
5.0
48
21.2
12,281.6
16.2
39
136
FY17
2,001
5.4
54.6
1,219
-16.5
33.2
3,220
-4.1
87.8
253
-0.7
6.9
193
-31.2
5.3
446
-16.7
12.2
3,666
-5.8
54,482
1.5
214
-3.5
44
20.3
12,063.3
-7.5
38
132
FY18E
2,041
2.0
51.5
1,368
12.3
34.5
3,410
5.9
86.0
304
20.0
7.7
253
31.0
6.4
556
24.8
14.0
3,966
8.2
56,174
3.1
241
12.6
46
18.9
11,699.9
4.9
42
145
FY19E
2,207
8.1
50.2
1,574
15.0
35.8
3,781
10.9
86.0
327
7.5
7.4
290
15.0
6.6
617
10.9
14.0
4,398
10.9
57,280
2.0
273
13.5
57
20.5
12,994.7
23.1
51
175
FY20E
2,428
10.0
49.5
1,810
15.0
36.9
4,237
12.1
86.3
346
6.0
7.1
325
12.0
6.6
672
8.8
13.7
4,909
11.6
58,297
1.8
313
14.6
67
20.8
13,551.6
16.4
59
204
Source: Company, MOSL
18 October 2017
7

Bajaj Auto
Story in charts: Domestic recovery, benefits of new launches key drivers
Exhibit 12: Domestic growth to drive volumes
Volumes ('000 Units)
2.2
(5.8)
54
Growth (%)
8.2
(1.5)
(8.7)
10.9
Exhibit 13: Share of 2W exports to increase gradually
2W - Dom
7
5
34
7
6
40
2W - Exports
7
7
37
3W - Dom
5
7
33
3W - Exports
6
8
35
7
7
36
46
49
55
51
50
FY14
FY15
FY16
FY17
FY18E
FY19E
FY14
FY15
FY16
FY17
FY18E
FY19E
Source: Company, MOSL
Exhibit 14: Volume mix to remain to remain stable
2W Exports
Discover (Dom)
0
1
17
2
3Ws (Exports)
Others (Dom)
CT100 (Dom)
15
6
16
5
12
9
16
7
3Ws (Dom)
Pulsar (Dom)
Exhibit 15: EBITDA margins to remain healthy
EBITDA (INR m)
21.2
20.4
EBITDA Margins (%)
20.3
19.0
20.5
16
1
5
7
0
2.4
14
6
18
5
13
6
18
5
18.9
6
7
0
14.0
7
7
0
-3.7
7
5
0
-18.9
8
6
0
10.7
7
7
0
FY14
FY15
FY16
FY17
FY18E
FY19E
Source: Company, MOSL
Exhibit 16: Return ratios to increase steadily
RoCE (%)
RoE (%)
Exhibit 17: Dividend payout to remain healthy
Dividend Payout (%)
Dividend Yield (%)
2.5
1.5
1.5
1.7
1.7
2.0
52.2
FY14
FY15
FY16
FY17
FY18E
FY19E
FY14
56.9
FY15
48.7
FY16
50.0
FY17
53.8
FY18E
60.0
FY19E
Source: Company, MOSL
18 October 2017
8

Bajaj Auto
Financials and Valuations
Income Statement
Y/E Mar
Net Sales
Change (%)
EBITDA
EBITDA Margin (%)
Depreciation
EBIT
Interest
Other Income
Extraordinary items
PBT
Tax
Tax Rate (%)
Min. Int. & Assoc. Share
Reported PAT
Adjusted PAT
Change (%)
2013
199,973
2.4
36,353
18.2
1,640
34,713
5
7,955
0
42,662
12,227
28.7
0
30,436
30,436
-2.0
2013
2,894
76,126
79,020
713
1,151
80,883
38,289
20,244
18,044
2,936
64,305
39,502
6,363
7,676
5,589
19,875
43,903
26,478
17,425
-4,401
80,883
2014
201,495
0.8
41,057
20.4
1,796
39,261
5
7,064
0
46,321
13,901
30.0
0
32,420
32,420
6.5
2014
2,894
93,187
96,080
577
1,432
98,089
40,770
20,710
20,060
1,441
85,496
40,479
6,397
7,962
4,955
21,165
49,387
29,650
19,737
-8,908
98,089
2015
216,120
7.3
41,166
19.0
2,674
38,492
65
5,824
-3,403
40,848
12,711
31.1
0
28,137
30,481
-6.0
2015
2,894
104,028
106,922
1,118
1,416
109,455
41,009
21,837
19,172
2,549
91,533
42,368
8,142
7,170
5,862
21,196
46,168
26,248
19,920
-3,800
109,455
2016
225,865
4.5
47,819
21.2
3,072
44,748
11
10,736
0
55,473
16,177
29.2
0
39,297
39,297
28.9
2016
2,894
129,772
132,666
1,886
2,028
136,579
51,572
24,183
27,389
522
102,606
34,348
7,191
7,179
8,176
11,803
28,286
26,680
1,605
6,063
136,580
2017
217,667
-3.6
44,224
20.3
3,073
41,151
14
12,220
0
53,356
15,081
28.3
0
38,276
38,276
-2.6
2017
2,894
167,448
170,341
1,764
3,136
175,242
46,027
26,009
20,018
422
132,606
47,706
7,284
9,533
2,798
28,091
25,509
23,519
1,991
22,197
175,242
2018E
245,378
12.7
46,405
18.9
3,135
43,270
10
15,167
0
58,427
16,418
28.1
0
42,009
42,009
9.8
2018E
2,894
186,848
189,742
1,764
4,363
195,869
50,448
29,144
21,304
2,000
152,606
50,361
8,484
10,655
4,284
26,938
30,402
28,281
2,121
19,959
195,869
(INR Million)
2019E
278,567
13.5
57,146
20.5
3,367
53,779
10
16,581
0
70,350
19,698
28.0
0
50,652
50,652
20.6
2019E
2,894
207,109
210,003
1,764
4,363
216,130
56,448
32,511
23,937
2,000
169,606
55,047
9,617
12,077
4,824
28,529
34,459
32,055
2,404
20,587
216,130
2020E
319,387
14.7
66,522
20.8
3,824
62,698
10
18,050
0
80,738
21,799
27.0
0
58,939
58,939
16.4
2020E
2,894
221,844
224,737
1,764
3,556
230,057
64,948
36,335
28,613
1,000
176,606
63,057
10,945
13,745
5,898
32,469
39,219
36,482
2,736
23,839
230,057
Balance Sheet
Y/E Mar
Share Capital
Reserves
Net Worth
Debt
Deferred Tax
Total Capital Employed
Gross Fixed Assets
Less: Acc Depreciation
Net Fixed Assets
Capital WIP
Investments
Current Assets
Inventory
Debtors
Cash & Bank
Loans & Adv, Others
Curr Liabs & Provns
Curr. Liabilities
Provisions
Net Current Assets
Total Assets
(INR Million)
18 October 2017
9

Bajaj Auto
Financials and Valuations
Ratios
Y/E Mar
Basic (INR)
EPS
Cash EPS
Book Value
DPS
Payout (incl. Div. Tax.)
Valuation(x)
P/E
Price / Book Value
EV/Sales
EV/EBITDA
Dividend Yield (%)
Profitability Ratios (%)
RoE
RoCE
RoIC
Turnover Ratios (%)
Asset Turnover (x)
Debtors (No. of Days)
Inventory (No. of Days)
Creditors (No. of Days)
Leverage Ratios (%)
Net Debt/Equity (x)
2013
105.2
110.8
273.1
45.0
49.7
31.0
12.0
4.4
24.1
1.4
43.7
42.6
1195.9
2.5
13
11
34
-0.1
2013
36,353
4,704
-7,319
-12,394
0
21,344
-5,285
16,059
-12,218
0
-17,503
0
324
-5
-15,109
-14,791
-10,950
16,538
5,589
2014
112.0
118.2
332.0
50.0
52.2
29.1
9.8
4.2
20.8
1.5
37.0
36.2
385.6
2.1
14
11
36
0.0
2014
41,057
3,376
4,176
-13,153
0
35,457
-2,547
32,910
-18,862
0
-21,409
0
505
-5
-15,182
-14,682
-634
5,589
4,955
2015
105.3
114.6
369.5
50.0
56.9
31.0
8.8
3.9
20.6
1.5
30.0
29.4
337.6
2.0
12
13
29
0.0
2015
43,510
-1,832
-7,350
-12,854
0
21,473
-2,933
18,540
-1,192
0
-4,125
0
532
-65
-16,909
-16,442
907
4,955
5,862
2016
135.8
146.4
458.5
55.0
48.7
24.0
7.1
3.7
17.5
1.7
32.8
32.0
182.2
1.7
11
11
31
0.0
2016
47,819
12,458
-6,055
-17,655
0
36,568
-2,582
33,986
2,394
0
-188
0
501
-5
-34,337
-33,841
2,539
5,637
8,176
2017
132.3
142.9
588.7
55.0
50.0
24.7
5.5
3.7
18.3
1.7
25.3
24.6
91.3
1.2
15
12
35
0.0
2017
44,224
14,956
-10,762
-15,026
0
33,392
-9,554
23,838
-27,330
0
-36,883
0
127
-6
-2,022
-1,901
-5,392
8,191
2,798
2018E
145.2
156.0
655.7
65.0
53.8
22.5
5.0
3.2
17.0
2.0
23.3
22.6
81.4
1.3
15
12
35
0.0
2018E
46,405
15,167
3,723
-15,191
0
50,105
-6,000
44,105
-20,000
0
-26,000
0
0
-10
-22,608
-22,618
1,486
2,798
4,285
2019E
175.0
186.7
725.7
80.0
60.0
18.6
4.5
2.8
13.5
2.5
25.3
24.6
101.0
1.3
15
12
35
0.0
2019E
57,146
16,581
-89
-19,698
0
53,940
-6,000
47,940
-17,000
0
-23,000
0
0
-10
-30,391
-30,401
539
4,284
4,824
2020E
203.7
216.9
776.6
131.4
75.0
16.0
4.2
2.4
11.5
4.0
27.1
36.2
80.5
1.4
15
12
35
0.0
2020E
66,522
18,050
-2,177
-22,607
0
59,788
-7,500
52,288
-7,000
0
-14,500
0
0
-10
-44,204
-44,214
1,074
4,824
5,898
Cash Flow Statement
Y/E Mar
Adjusted EBITDA
Non cash opr. exp (inc)
(Inc)/Dec in Wkg. Cap.
Tax Paid
Other operating activities
CF from Op. Activity
(Inc)/Dec in FA & CWIP
Free cash flows
(Pur)/Sale of Invt
Others
CF from Inv. Activity
Inc/(Dec) in Net Worth
Inc / (Dec) in Debt
Interest Paid
Divd Paid (incl Tax) & Others
CF from Fin. Activity
Inc/(Dec) in Cash
Add: Opening Balance
Closing Balance
(INR Million)
18 October 2017
10

Bajaj Auto
Corporate profile
Company description
Bajaj Auto (BJAUT), the flagship of the Bajaj group,
is a leading manufacturer of two-wheelers (~88% of
volumes) and three-wheelers (~12% of volumes). It
is the market leader in three-wheelers, and is the
second largest player in motorcycles and enjoys
leadership in the premium segment. It is also the
largest exporter of two-wheelers and three-
wheelers (~41% of its volumes).
Source: MOSL/Bloomberg
Exhibit 1: Sensex rebased
Exhibit 2: Shareholding pattern (%)
Jun-17
Promoter
DII
FII
Others
49.3
8.3
17.5
24.9
Mar-17
49.3
7.7
17.4
25.6
Jun-16
49.3
8.8
17.2
24.8
Source: Capitaline
Exhibit 3: Top holders
Holder Name
LIFE INSURANCE CORPORATION OF INDIA
JAYA HIND INVESTMENTS PRIVATE LIMITED
MAHARASHTRA SCOOTERS LIMITED
GOVERNMENT PENSION FUND GLOBAL
NIRAJ BAJAJ (As a trustee of Yamuna Trust)
% Holding
5.5
3.3
2.3
1.6
1.3
Source: Capitaline
Note: FII Includes depository receipts
Exhibit 4: Top management
Name
Rahul Bajaj
Madhur Bajaj
Rajiv Bajaj
J Sridhar
Designation
Chairman
Vice Chairman
Managing Director
Company Secretary
Exhibit 5: Directors
Name
Manish Kejriwal
Sanjiv Bajaj
D J Balaji Rao
Gita Piramal
Kantikumar R Podar
Naresh Chandra
Pradeep Shrivastava
Name
Niraj Bajaj
Shekhar Bajaj
D S Mehta
Jamshyd N Godrej
Nanoo Pamnani
P Murari
Source: Capitaline
*Independent
Exhibit 6: Auditors
Name
Dalal & Shah LLP
Shyamprasad D Limaye
Type
Statutory
Secretarial Audit
Exhibit 7: MOSL forecast v/s consensus
EPS
(INR)
FY18
FY19
FY20
MOSL
forecast
145.2
175.0
203.7
Consensus
forecast
140.0
160.3
180.0
Variation (%)
3.7
9.2
13.2
Source: Bloomberg
Source: Capitaline
18 October 2017
11

Disclosures:
The following Disclosures are being made in compliance with the SEBI Research Analyst Regulations 2014 (herein after referred to as the Regulations).
Motilal Oswal Securities Ltd. (MOSL) is a SEBI Registered Research Analyst having registration no. INH000000412. MOSL, the Research Entity (RE) as defined in the Regulations, is engaged in the business of providing Stock
broking services, Investment Advisory Services, Depository participant services & distribution of various financial products. MOSL is a subsidiary company of Motilal Oswal Financial Service Ltd. (MOFSL). MOFSL is a listed
public company, the details in respect of which are available on
www.motilaloswal.com.
MOSL is registered with the Securities & Exchange Board of India (SEBI) and is a registered Trading Member with National Stock
Exchange of India Ltd. (NSE) and Bombay Stock Exchange Limited (BSE), Metropolitan Stock Exchange Of India Ltd. (MSE) for its stock broking activities & is Depository participant with Central Depository Services Limited
(CDSL) & National Securities Depository Limited (NSDL) and is member of Association of Mutual Funds of India (AMFI) for distribution of financial products. Details of associate entities of Motilal Oswal Securities Limited are
available on the website at
http://onlinereports.motilaloswal.com/Dormant/documents/Associate%20Details.pdf
Pending Regulatory Enquiries against Motilal Oswal Securities Limited by SEBI:
SEBI pursuant to a complaint from client Shri C.R. Mohanraj alleging unauthorized trading, issued a letter dated 29th April 2014 to MOSL notifying appointment of an Adjudicating Officer as per SEBI regulations to hold
inquiry and adjudge violation of SEBI Regulations; MOSL requested SEBI to provide all documents, records, investigation report relied upon by SEBI which were referred in Show Cause Notice and also sought personal
hearing. The matter is currently pending.
MOSL, it’s associates, Research Analyst or their relative may have any financial interest in the subject company. MOSL and/or its associates and/or Research Analyst may have beneficial ownership of 1% or more securities in
the subject company at the end of the month immediately preceding the date of publication of the Research Report.
MOSL and its associate company(ies), their directors and Research Analyst and their relatives may; (a)
from time to time, have a long or short position in, act as principal in, and buy or sell the securities or derivatives thereof of companies mentioned herein. (b) be engaged in any other transaction involving such securities and
earn brokerage or other compensation or act as a market maker in the financial instruments of the company(ies) discussed herein or act as an advisor or lender/borrower to such company(ies) or may have any other
potential conflict of interests with respect to any recommendation and other related information and opinions.; however the same shall have no bearing whatsoever on the specific recommendations made by the analyst(s),
as the recommendations made by the analyst(s) are completely independent of the views of the associates of MOSL even though there might exist an inherent conflict of interest in some of the stocks mentioned in the
research report.
Research Analyst may have served as director/officer, etc. in the subject company in the last 12 month period. MOSL and/or its associates may have received any compensation from the subject company in
the past 12 months.
In the last 12 months period ending on the last day of the month immediately preceding the date of publication of this research report, MOSL or any of its associates may have:
a)
managed or co-managed public offering of securities from subject company of this research report,
b)
received compensation for investment banking or merchant banking or brokerage services from subject company of this research report,
c)
received compensation for products or services other than investment banking or merchant banking or brokerage services from the subject company of this research report.
d)
Subject Company may have been a client of MOSL or its associates during twelve months preceding the date of distribution of the research report.
MOSL and it’s associates have not received any compensation or other benefits from the subject company or third party in connection with the research report. To enhance transparency, MOSL has incorporated a Disclosure
of Interest Statement in this document. This should, however, not be treated as endorsement of the views expressed in the report. MOSL and / or its affiliates do and seek to do business including investment banking with
companies covered in its research reports. As a result, the recipients of this report should be aware that MOSL may have a potential conflict of interest that may affect the objectivity of this report. Compensation of Research
Analysts is not based on any specific merchant banking, investment banking or brokerage service transactions.
Terms & Conditions:
This report has been prepared by MOSL and is meant for sole use by the recipient and not for circulation. The report and information contained herein is strictly confidential and may not be altered in any way, transmitted to,
copied or distributed, in part or in whole, to any other person or to the media or reproduced in any form, without prior written consent of MOSL. The report is based on the facts, figures and information that are considered
true, correct, reliable and accurate. The intent of this report is not recommendatory in nature. The information is obtained from publicly available media or other sources believed to be reliable. Such information has not
been independently verified and no guaranty, representation of warranty, express or implied, is made as to its accuracy, completeness or correctness. All such information and opinions are subject to change without notice.
The report is prepared solely for informational purpose and does not constitute an offer document or solicitation of offer to buy or sell or subscribe for securities or other financial instruments for the clients. Though
disseminated to all the customers simultaneously, not all customers may receive this report at the same time. MOSL will not treat recipients as customers by virtue of their receiving this report.
Analyst Certification
The views expressed in this research report accurately reflect the personal views of the analyst(s) about the subject securities or issues, and no part of the compensation of the research analyst(s) was, is, or will be directly or
indirectly related to the specific recommendations and views expressed by research analyst(s) in this report.
Bajaj Auto
Disclosure of Interest Statement
Analyst ownership of the stock
Bajaj Auto
No
A graph of daily closing prices of securities is available at
www.nseindia.com, www.bseindia.com.
Research Analyst views on Subject Company may vary based on Fundamental research and Technical Research. Proprietary
trading desk of MOSL or its associates maintains arm’s length distance with Research Team as all the activities are segregated from MOSL research activity and therefore it can have an independent view with regards to
subject company for which Research Team have expressed their views.
Regional Disclosures (outside India)
This report is not directed or intended for distribution to or use by any person or entity resident in a state, country or any jurisdiction, where such distribution, publication, availability or use would be contrary to law,
regulation or which would subject MOSL & its group companies to registration or licensing requirements within such jurisdictions.
For Hong Kong:
This report is distributed in Hong Kong by Motilal Oswal capital Markets (Hong Kong) Private Limited, a licensed corporation (CE AYY-301) licensed and regulated by the Hong Kong Securities and Futures Commission (SFC)
pursuant to the Securities and Futures Ordinance (Chapter 571 of the Laws of Hong Kong) “SFO”. As per SEBI (Research Analyst Regulations) 2014 Motilal Oswal Securities (SEBI Reg No. INH000000412) has an agreement with
Motilal Oswal capital Markets (Hong Kong) Private Limited for distribution of research report in Hong Kong. This report is intended for distribution only to “Professional Investors” as defined in Part I of Schedule 1 to SFO. Any
investment or investment activity to which this document relates is only available to professional investor and will be engaged only with professional investors.” Nothing here is an offer or solicitation of these securities,
products and services in any jurisdiction where their offer or sale is not qualified or exempt from registration. The Indian Analyst(s) who compile this report is/are not located in Hong Kong & are not conducting Research
Analysis in Hong Kong.
For U.S.
Motilal Oswal Securities Limited (MOSL) is not a registered broker - dealer under the U.S. Securities Exchange Act of 1934, as amended (the"1934 act") and under applicable state laws in the United States. In addition MOSL is
not a registered investment adviser under the U.S. Investment Advisers Act of 1940, as amended (the "Advisers Act" and together with the 1934 Act, the "Acts), and under applicable state laws in the United States.
Accordingly, in the absence of specific exemption under the Acts, any brokerage and investment services provided by MOSL, including the products and services described herein are not available to or intended for U.S.
persons. This report is intended for distribution only to "Major Institutional Investors" as defined by Rule 15a-6(b)(4) of the Exchange Act and interpretations thereof by SEC (henceforth referred to as "major institutional
investors"). This document must not be acted on or relied on by persons who are not major institutional investors. Any investment or investment activity to which this document relates is only available to major institutional
investors and will be engaged in only with major institutional investors. In reliance on the exemption from registration provided by Rule 15a-6 of the U.S. Securities Exchange Act of 1934, as amended (the "Exchange Act") and
interpretations thereof by the U.S. Securities and Exchange Commission ("SEC") in order to conduct business with Institutional Investors based in the U.S., MOSL has entered into a chaperoning agreement with a U.S.
registered broker-dealer, Motilal Oswal Securities International Private Limited. ("MOSIPL"). Any business interaction pursuant to this report will have to be executed within the provisions of this chaperoning agreement.
The Research Analysts contributing to the report may not be registered /qualified as research analyst with FINRA. Such research analyst may not be associated persons of the U.S. registered broker-dealer, MOSIPL, and
therefore, may not be subject to NASD rule 2711 and NYSE Rule 472 restrictions on communication with a subject company, public appearances and trading securities held by a research analyst account.
For Singapore
Motilal Oswal Capital Markets Singapore Pte Limited is acting as an exempt financial advisor under section 23(1)(f) of the Financial Advisers Act(FAA) read with regulation 17(1)(d) of the Financial Advisors Regulations and is a
subsidiary of Motilal Oswal Securities Limited in India. This research is distributed in Singapore by Motilal Oswal Capital Markets Singapore Pte Limited and it is only directed in Singapore to accredited investors, as defined in
the Financial Advisers Regulations and the Securities and Futures Act (Chapter 289), as amended from time to time. In respect of any matter arising from or in connection with the research you could contact the following
representatives of Motilal Oswal Capital Markets Singapore Pte Limited:
Disclaimer:
The report and information contained herein is strictly confidential and meant solely for the selected recipient and may not be altered in any way, transmitted to, copied or distributed, in part or in whole, to any other person
or to the media or reproduced in any form, without prior written consent. This report and information herein is solely for informational purpose and may not be used or considered as an offer document or solicitation of
offer to buy or sell or subscribe for securities or other financial instruments. Nothing in this report constitutes investment, legal, accounting and tax advice or a representation that any investment or strategy is suitable or
appropriate to your specific circumstances. The securities discussed and opinions expressed in this report may not be suitable for all investors, who must make their own investment decisions, based on their own investment
objectives, financial positions and needs of specific recipient. This may not be taken in substitution for the exercise of independent judgment by any recipient. Each recipient of this document should make such investigations
as it deems necessary to arrive at an independent evaluation of an investment in the securities of companies referred to in this document (including the merits and risks involved), and should consult its own advisors to
determine the merits and risks of such an investment. The investment discussed or views expressed may not be suitable for all investors. Certain transactions -including those involving futures, options, another derivative
products as well as non-investment grade securities - involve substantial risk and are not suitable for all investors. No representation or warranty, express or implied, is made as to the accuracy, completeness or fairness of
the information and opinions contained in this document. The Disclosures of Interest Statement incorporated in this document is provided solely to enhance the transparency and should not be treated as endorsement of the
views expressed in the report. This information is subject to change without any prior notice. The Company reserves the right to make modifications and alternations to this statement as may be required from time to time
without any prior approval. MOSL, its associates, their directors and the employees may from time to time, effect or have effected an own account transaction in, or deal as principal or agent in or for the securities
mentioned in this document. They may perform or seek to perform investment banking or other services for, or solicit investment banking or other business from, any company referred to in this report. Each of these entities
functions as a separate, distinct and independent of each other. The recipient should take this into account before interpreting the document. This report has been prepared on the basis of information that is already
available in publicly accessible media or developed through analysis of MOSL. The views expressed are those of the analyst, and the Company may or may not subscribe to all the views expressed therein. This document is
being supplied to you solely for your information and may not be reproduced, redistributed or passed on, directly or indirectly, to any other person or published, copied, in whole or in part, for any purpose. This report is not
directed or intended for distribution to, or use by, any person or entity who is a citizen or resident of or located in any locality, state, country or other jurisdiction, where such distribution, publication, availability or use would
be contrary to law, regulation or which would subject MOSL to any registration or licensing requirement within such jurisdiction. The securities described herein may or may not be eligible for sale in all jurisdictions or to
certain category of investors. Persons in whose possession this document may come are required to inform themselves of and to observe such restriction. Neither the Firm, not its directors, employees, agents or
representatives shall be liable for any damages whether direct or indirect, incidental, special or consequential including lost revenue or lost profits that may arise from or in connection with the use of the information.
The
person accessing this information specifically agrees to exempt MOSL or any of its affiliates or employees from, any and all responsibility/liability arising from such misuse and agrees not to hold MOSL or any of its affiliates or
employees responsible for any such misuse and further agrees to hold MOSL or any of its affiliates or employees free and harmless from all losses, costs, damages, expenses that may be suffered by the person accessing this
information due to any errors and delays.
Registered Office Address: Motilal Oswal Tower, Rahimtullah Sayani Road, Opposite Parel ST Depot, Prabhadevi, Mumbai-400025; Tel No.: 022-3980 4263; www.motilaloswal.com. Correspondence Address: Palm Spring
Centre, 2nd Floor, Palm Court Complex, New Link Road, Malad (West), Mumbai- 400 064. Tel No: 022 3080 1000. Compliance Officer: Neeraj Agarwal, Email Id:
na@motilaloswal.com,
Contact No.:022-30801085.
Registration details of group entities.: MOSL: NSE (Cash): INB231041238; NSE (F&O): INF231041238; NSE (CD): INE231041238; BSE (Cash): INB011041257; BSE(F&O): INF011041257; BSE(CD); MSE(Cash): INB261041231;
MSE(F&O): INF261041231; MSE(CD): INE261041231; CDSL: IN-DP-16-2015; NSDL: IN-DP-NSDL-152-2000; Research Analyst: INH000000412. AMFI: ARN 17397. Investment Adviser: INA000007100. Motilal Oswal Asset
Management Company Ltd. (MOAMC): PMS (Registration No.: INP000000670) offers PMS and Mutual Funds products. Motilal Oswal Wealth Management Ltd. (MOWML): PMS (Registration No.: INP000004409) offers wealth
management solutions. *Motilal Oswal Securities Ltd. is a distributor of Mutual Funds, PMS, Fixed Deposit, Bond, NCDs, Insurance and IPO products. * Motilal Oswal Commodities Broker Pvt. Ltd. offers Commodities
Products. * Motilal Oswal Real Estate Investment Advisors II Pvt. Ltd. offers Real Estate products. * Motilal Oswal Private Equity Investment Advisors Pvt. Ltd. offers Private Equity products
18 October 2017
12