24 October 2017
Market snapshot
Equities - India
Close
Chg .%
Sensex
32,507
0.4
Nifty-50
10,185
0.4
Nifty-M 100
18,845
0.3
Equities-Global
Close
Chg .%
S&P 500
2,565
-0.4
Nasdaq
6,587
-0.6
FTSE 100
7,524
0.0
DAX
13,003
0.1
Hang Seng
11,491
-0.6
Nikkei 225
21,697
1.1
Commodities
Close
Chg .%
Brent (US$/Bbl)
57
-1.5
Gold ($/OZ)
1,276
-0.5
Cu (US$/MT)
6,975
0.8
Almn (US$/MT)
2,125
0.0
Currency
Close
Chg .%
USD/INR
65.0
-0.1
USD/EUR
1.2
-0.5
USD/JPY
113.9
0.4
YIELD (%)
Close
1MChg
10 Yrs G-Sec
6.8
0.0
10 Yrs AAA Corp
7.6
0.0
Flows (USD b)
19-Oct
MTD
FIIs
0.0
-0.9
DIIs
0.0
1.5
Volumes (INRb)
19-Oct
MTD*
Cash
331
295
F&O
6,997
6,206
Note: YTD is calendar year, *Avg
YTD.%
22.1
24.4
31.3
YTD.%
14.6
22.4
5.3
13.3
22.3
13.5
YTD.%
3.5
10.0
26.3
24.7
YTD.%
-4.2
11.4
-2.8
YTDchg
0.3
0.0
YTD
4.3
11.3
YTD*
294
5,478
Today’s top research idea
Indiabulls Housing Finance 2QFY18: Strong growth
Stable performance overall
v
IHFL's transformation from a diversified lender to a focused mortgage player
has yielded returns, with RoE/RoA improving from 3%/0.8% in FY09 to
26%/3.4% in FY17.
v
Focus on core mortgage loans and market share gains should drive AUM
growth of 25%+ over the next three years.
v
IHFL is among the lowest-levered HFCs. Asset quality trend is likely to remain
stable.
Research covered
Cos/Sector
Hindustan Zinc
Indiabulls Hsg Fin
Havells India
Oil & Gas
Automobile
Metals Weekly
Results Expectation
Key Highlights
Strong performance as expected; Zinc price outlook bullish
Strong growth, stable performance overall
Operating performance exceeds expectations
Auto fuel consumption remains strong; Positive on OMCs
Growth seen across segments, barring premium (ex RE)
Steel and aluminum production run-rate declines in China in Sep
A B B | Ambuja Cement | Asian Paints | HDFC Bank | Infosys |
Zee Entertainmen
Piping hot news
DII holdings in BSE companies at their highest in 25 quarters
The holdings of domestic mutual funds and insurance companies in India’s largest
listed companies rose to their highest level in at least 25 quarters as household
savings shifted from gold and real estate to financial assets…
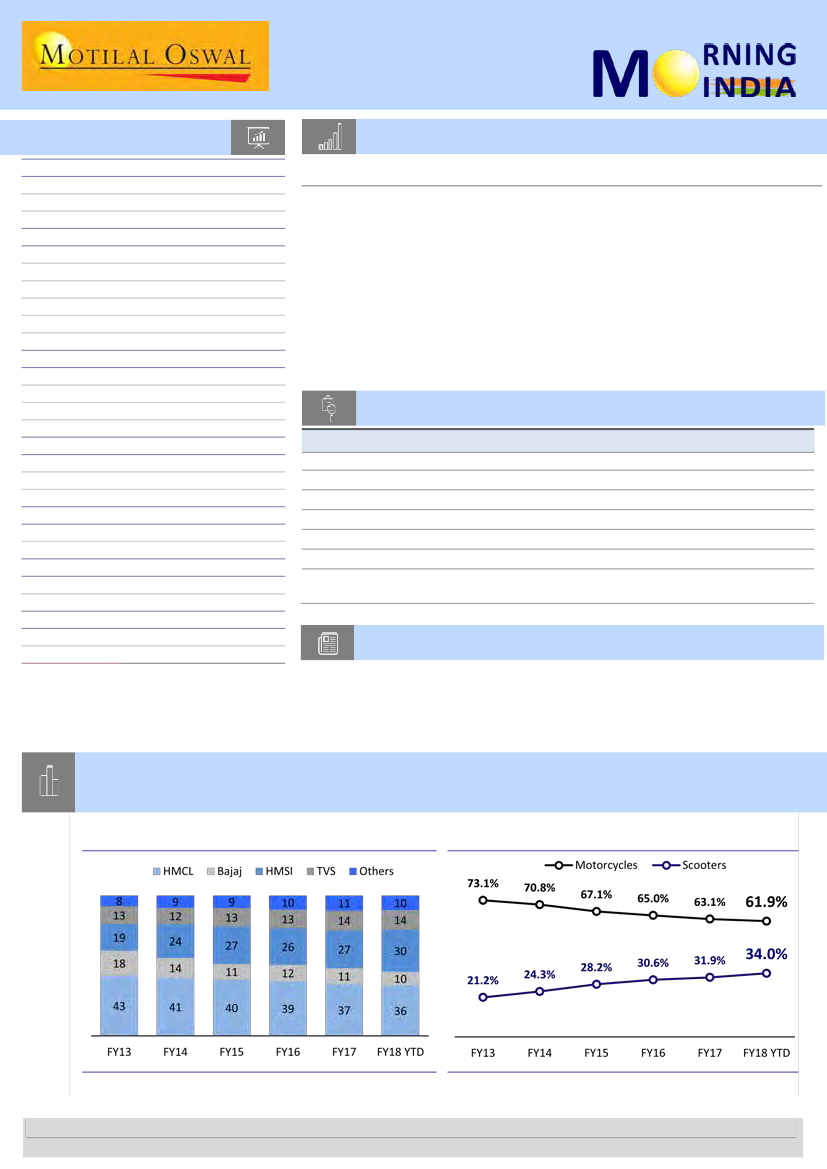
Chart of the Day: Automobiles – Growth seen across segments, barring
premium (ex RE)
Dom. 2W market share: Gap between HMCL and HMSI
gradually narrowing down
Executive 100 segment losing out to Scooters
Source: SIAM, MOSL
Source: SIAM, MOSL
Research Team (Gautam.Duggad@MotilalOswal.com)
Motilal Oswal research is available on www.motilaloswal.com/Institutional-Equities, Bloomberg, Thomson Reuters, Factset and S&P Capital.
Investors are advised to refer through important disclosures made at the last page of the Research Report.

In the news today
Kindly click on textbox for the detailed news link
1
Jan Dhan accounts see surge in
cash inflows in past 3 months
There has been a spurt in cash
flows into Prime Minister Jan
Dhan Yojana (PMJDY) bank
accounts in the past three
months. The period between July
and October witnessed a steep
rise in the cumulative balances,…
2
331 infra projects see cost overrun of ₹1.72 lakh crore
As many as 331 infrastructure projects, each worth ₹150 crore or above,
have seen a cost overrun of ₹1.72 lakh crore because of various reasons
including delays, according to a government report. Ministry of Statistics
and Programme Implementation monitors infrastructure projects worth
₹150 and above. The total original cost of implementing 1,257 projects
was ₹15,76,903.56 crore and their anticipated completion cost is likely to
be ₹17,49,274.62 crore, with a cost overrun of ₹1,72,371.06 crore (10.93
per cent of the original), the Ministry’s flash report for July this year has
stated…
3
World energy bodies caution
India on wind projects
The recent tariff-based auctions
for wind power capacity, which
threw up a surprise low tariff of
Rs. 2.64 a kWhr, is all fine, but
make sure that the projects do
come up, say world energy bodies.
Commenting on the auctions,…
4
Infosys likely to name next
CEO today
Infosys is likely to name its next
chief executive officer on Tuesday.
Finding a CEO was among the key
tasks taken up by co-founder and
Chairman Nandan Nilekani when
he took charge in August. Among
the probable candidates for the
post are B G Srinivas and Ashok
Vemuri…
5
Drug MNCs lobby against price
cuts of stents & knee implants
Multinational drug makers are
pulling out all the stops in
reaching out to the highest Indian
government officials to express
discontent over the drug pricing
regulator’s decision to cut prices
of cardiac stents and knee
implants. This time, the
negotiations will be held directly
by the international lobby group
of drugmakers instead of their
domestic offshoots. ET has learnt
that representatives of global
medical device makers and
pharma companies have met with
various Indian government
officials to express their views…
6
Government keen to woo $100
billion FDI in tourism
The government wants to attract
$100 billion foreign direct
investment in tourism sector and
generate up to 100 million jobs
over the next five years. “Tourism
industry has a multiplier effect on
the economy…
7
Tata Steel and the Ruias
themselves have put in bids for
debt-laden Essar Steel after the
company was put up for sale
under the Insolvency and
Bankruptcy Code (IBC). Sajjan
Jindal-led JSW Steel, aggressive in
bidding for Monnet Ispat’s and
Bhushan Steel’s businesses,…
Insolvency: Tatas, Ruias submit
bids for debt-laden Essar Steel
24 October 2017
2

23 October 2017
Q2FY18 Results Update | Sector: Metals
Hindustan Zinc
Neutral
BSE SENSEX
32,507
Bloomberg
Equity Shares (m)
M.Cap.(INRb)/(USDb)
52-Week Range (INR)
1, 6, 12 Rel. Per (%)
Avg Val, INRm
Free float (%)
S&P CNX
10,185
HZ IN
4,225
1,342.8 / 20.7
Zinc price outlook bullish, but priced in; Maintain Neutral
331 / 213
Strong performance as expected
7/8/12
n
HZL’s 2QFY17 EBITDA grew 46% YoY/27% QoQ to INR30.2b (in-line).
728.5
n
Mine production was contained (-6% QoQ to 219kt) to draw down
35.1
CMP: INR318
TP: INR322(+1%)
Strong performance as expected
Financials & Valuations (INR b)
Y/E March
2017 2018E
Sales
173.0
221
EBITDA
97.4
126.6
NP
83.2
96.1
Adj. EPS (INR)
19.7
22.7
EPS Gr(%)
15.5
BV/Sh. (INR)
72.9
68.1
RoE (%)
24.4
32.3
RoCE (%)
29.4
40.4
P/E (x)
16.2
14.0
P/BV
13.3
11.8
2019E
271
162.2
124.4
29.4
29.5
86.9
38.0
51.5
10.8
9.2
n
n
n
Hedges volumes to offset price volatility; Capacity expansion on track
n
inventory. Sales volumes grew 2% QoQ for zinc (to 193kt), 18% QoQ for lead
(to 40kt) and 33% QoQ for silver (to 146t).
Reported CoP grew 1% QoQ (22% YoY due to higher coal cost) to USD984/t.
Reversal of DMF of INR2.9b for the period Jan-Sep 2015 pursuant to the
Supreme Court order was reported as exceptional.
Adj. PAT grew 34% YoY/36% QoQ to INR22.5b (in-line), as higher other
income and lower depreciation were offset by a higher tax rate (23% v/s est.
of 21%).
HZL sold zinc (220kt @ USD3,084/t) and lead (30kt @ USD2,418/t) forwards
to offset extreme price volatility in recent months. The deliveries are
scheduled over 4QFY18-1QFY19.
Guidance for project capex was maintained at USD300-325m for FY18E, and
for CoP was raised to USD900-950/t for FY18E (as expected) on higher coal
cost. Expansion to 1.2mt mine metal capacity by FY20 remains on track.
Zinc market remains tight even as demand growth is modest on lag in supply
response. Thus, the price outlook remains bullish. At zinc LME of USD3,400/t
for FY19E, the stock is trading at 6.4x EV/EBITDA, leaving limited upside
potential. Maintain Neutral with a TP of INR322/sh. based on 6.5x FY19E
EV/EBITDA.
FY18
2Q
3QE
193
203
40
39
146
120
2,950 3,200
53,090 60,210
50.6
20.9
30,240 35,723
45.6
28.3
840
0
3,940 5,054
4,870 3,636
30,330 34,305
-2,910
0
33,240 34,305
7,790 7,204
23.4
21.0
25,450 27,101
22,540 27,101
18.5
16.8
FY17
4QE
209
41
124
3,200
62,227
-0.6
36,826
-1.7
0
5,105
3,292
35,013
0
35,013
7,353
21.0
27,660
27,660
-9.5
696
138
447
2,366
172,964
21.6
97,390
43.7
2,017
17,871
24,496
101,998
-5
102,003
18,837
18.5
83,166
83,161
-0.7
FY18E
795
154
499
2,985
221,287
27.9
126,629
30.0
2,210
17,699
17,098
123,817
-2,910
126,727
27,757
21.9
98,971
96,061
15.5
2QE
192
38
140
2,950
53,002
50.3
30,337
46.1
0
5,004
3,206
28,538
0
28,538
5,993
21.0
22,545
22,545
18.5
vs Est.
%
1
5
4
0
0
0
-21
52
6
16
30
13
0
-0.1
n
Estimate change
TP change
Rating change
Zinc price outlook remains bullish, but priced in; Maintain Neutral
n
Quarterly Performance (Standalone) – INR m
Y/E March
Zinc refined (kt)
Lead refined (kt)
Silver (tonnes)
Zinc LME (USD/t)
Net Sales
Change (YoY %)
EBITDA
Change (YoY %)
Finance cost
DD&A
Other Income
PBT (before EO item)
EO exp. (income)
PBT (after EO item)
Total Tax
% Tax
Reported PAT
Adjusted PAT
Change (YoY %)
1Q
120
23
88
1,918
25,306
-30.3
11,309
-42.5
712
3,644
6,101
13,053
-5
13,059
2,680
20.5
10,379
10,374
-53.4
FY17
2Q
3Q
148
211
32
36
107
117
2,252 2,518
35,257 49,799
-12.6
45.2
20,767 27,834
2.6
88.3
712
451
4,317 4,589
7,702 5,882
23,440 28,676
0
0
23,440 28,676
4,421 5,477
18.9
19.1
19,019 23,199
19,019 23,199
-11.4
28.1
4Q
217
47
135
2,777
62,602
99.9
37,480
186.5
142
5,321
4,811
36,829
0
36,829
6,259
17.0
30,570
30,570
42.2
1Q
190
34
110
2,589
45,760
80.8
23,840
110.8
1,370
3,600
5,300
24,170
0
24,170
5,410
22.4
18,760
18,760
80.8
24 October 2017
3

Indiabulls Housing Finance
BSE SENSEX
32,507
Bloomberg
Equity Shares (m)
M.Cap.(INRb)/(USDb)
52-Week Range (INR)
1, 6, 12 Rel. Per (%)
Avg Val, INRm
Free float (%)
S&P CNX
10,185
IHFL IN
421.3
486.6/7.6
1375 / 616
6/24/37
1872
76.4
24 October 2017
2QFY18
Results Update | Sector: Financials
CMP: INR1,343
n
TP: INR1,550 (+15%)
Buy
Strong growth, stable performance overall
Financials & Valuations (INR b)
Y/E March
2017 2018E 2019E
Net Fin inc
35.3 52.9 65.9
PPP
45.5 55.9 71.0
EPS (INR)
68.6 83.6 105.1
EPS Gr. (%)
23.2 21.9 25.8
BV/Sh. (INR)
286
321
364
RoA on AUM (%)
3.1
2.9
2.8
RoE (%)
25.5 27.6 30.7
Payout (%)
39.3 50.0 50.0
Valuations
P/E (x)
19.6 16.1 12.8
P/BV (x)
4.7
4.2
3.7
P/ABV (x)
4.7
4.2
3.7
Div. Yield (%)
2.0
3.1
3.9
n
n
n
n
Indiabulls Housing Finance's (IHFL) PAT grew 26% YoY to INR8.6b (4% above
our estimate). Core operating performance was robust, with strong AUM
growth (+33% YoY) and stable spreads. However, other income (income from
the liquid investment book) remains subdued due to lower incremental yields.
Note that IHFL had generated a good spread on its investment book above cost
of funds in FY16 and FY17 - that is beginning to vanish now.
AUM growth was in line with trend at 33% YoY to reach INR1t. This was driven
by 36% YoY growth in disbursements to INR95b. Management is bullish on
pick-up in supply in the affordable housing space.
Despite competitive pressures, IHFL managed to hold spreads steady at 3.25%.
Management continues to guide for incremental spreads in the range of 2.75-
3% and book spreads of 3-3.25%. Incremental cost of funds is around 7.3-7.5%.
The share of home loans in the overall book inched up 100bp to 58%. With the
share continuously inching up (to the target of 66% by FY20), we believe spread
pressure will continue.
Valuation and view:
IHFL's transformation from a diversified lender to a
focused mortgage player has yielded returns, with RoE/RoA improving from
3%/0.8% in FY09 to 26%/3.4% in FY17. Focus on core mortgage loans and
market share gains should drive AUM growth of 25%+ over the next three
years. IHFL is among the lowest-levered HFCs. Asset quality trend is likely to
remain stable. We keep our EPS estimates largely unchanged. Maintain
Buy
with a TP of INR1,550 (4x Sep19E P/B).
24 October 2017
4

23 October 2017
Q2FY18 Results Update | Sector: Capital Goods
Havells India
Neutral
BSE SENSEX
32,507
Bloomberg
Equity Shares (m)
M.Cap.(INRb)/(USDb)
52-Week Range (INR)
1, 6, 12 Rel. Per (%)
Avg Val, INRm
Free float (%)
S&P CNX
10,185
HAVL IN
Operating performance exceeds expectations
625
n
Operating performance impressive led by better-than-estimated margins:
340.8 / 5.0
Revenue grew 22.4% YoY to INR17.8b (est. of INR19b) in 2QFY18. However,
554 / 304
operating profit of INR2.6b (+26.3% YoY) was ahead of our estimate of
8/3/16
INR2.2b, led by price hikes in the cables & wires segment, lower ad spend
614.0
and withdrawal of dealer schemes. PAT of INR1.7b (+17.3% YoY) was above
38.4
CMP: INR542
TP: INR570 (+5%)
Financials & Valuations (INR b)
Y/E Mar
Net Sales
EBITDA
Adj PAT
Adj EPS (INR)
EPS Gr. (%)
BV/Sh(INR)
RoE (%)
RoCE (%)
P/E (x)
P/BV (x)
2018E
83.2
10.7
7.2
11.5
20.5
59.0
19.5
19.7
47.1
9.2
2019E
100.4
13.6
8.9
14.3
23.9
67.2
21.2
21.9
38.0
8.1
n
2020E
114.7
15.8
10.5
16.8
17.7
76.8
21.9
22.8
32.3
n
7.1
Estimate change
TP change
Rating change
n
n
our estimate of INR1.4b.
Core business (ex-Lloyd) growth muted on weak demand and low level of
restocking:
Core business revenue grew at a muted 4% YoY to INR15.1b
(+6.7% YoY, adj. for excise impact on exempted zones), below our estimate
of INR15.8b, due to weak demand in construction and industrial segments
and lower-than-expected restocking by retailers. Despite muted revenue
growth, operating profit increased 17% YoY to INR2.4b and adjusted EBIDTA
margin improved 180bp YoY to 15.8%, driven by price hikes taken in the
cables & wires segment, low advertising spend and withdrawal of dealer
schemes (2.3% v/s 3.3% in 2QFY17). Net profit improved 9% YoY to INR1.1b.
Lloyd’s consumer business grows 11% YoY:
The newly acquired Lloyd
business recorded revenue of INR2.7b (+11% YoY). Operating profit stood at
INR189m and EBIDTA margin at 7.0%. Cost-control measures led to margin
improvement on a QoQ basis (7.0% v/s 4.8% in 1QFY18).
Working capital cycle contraction led by increase in payable days:
Core net
working capital cycle contracted to -1 day from 30 days in 2QFY17. During
the quarter, creditor days were up to 89 from 48 in 2QFY17 due to vendor
financing and extended credit cycle provided by Lloyd’s vendors.
Valuation and view:
We raise our earnings estimate for FY18/19 by 5% each
to factor in better-than-estimated operating margins driven by cost-control
measures. We maintain our
Neutral
rating and raise our target price to
INR570, as we roll over our exit multiple to Dec-19E EPS of INR16.5.
FY17
2Q
3Q
14,522 15,060
8.7 13.2
2,034 1,907
7.6
4.0
14.0 12.7
308
301
19
15
323
264
-
189.5
2,030 1,877
572
537
28.2 28.6
1,458 1,530
22.0 27.6
1,458 1,135
21.1
-4.0
FY18
2Q
3QE
17,774 20,883
22.4 38.7
2,569 2,958
26.3 55.1
14.5 14.2
349
320
67
70
287
100
-
-
2,440 2,668
730
747
29.9 28.0
1,710 1,921
17.3 25.6
1,710 1,921
17.3 69.2
FY17 FY18E
4QE
25,978 61,353 83,240
51.9
6.2
35.7
3,424 8,241 10,675
49.1
9.2
29.5
13.2
13.4
12.8
309 1,196 1,314
79
122
250
115 1,343
850
-
3,151 8,266 9,962
803 2,298 2,769
25.5
27.8
27.8
2,347 5,969 7,192
147.9
-34.2
20.5
2,347 5,969 7,192
36.9
16.9
20.5
(INR Million)
MOSL
Var.
2QE
19,030
-6.6%
31.0
2,165
18.6%
6.5
11.4
330
30
120
0.0
1,925
26.7%
539
28.0
1,386
23.4%
-4.9
1,386
23.4%
-1.6
Quarterly Performance (Standalone)
Y/E March
Sales
Change (%)
Adj EBITDA
Change (%)
Adj EBITDA margin (%)
Depreciation
Interest
Other Income
Extra-ordinary Items
PBT
Tax
Effective Tax Rate (%)
Reported PAT
Change (%)
Adj PAT
Change (%)
1Q
14,668
17.1
2,004
23.7
13.7
280
16
314
-
2,022
567
28.0
1,456
36.3
1,456
22.2
4Q
17,102
17.2
2,296
3.5
13.4
308
71
419
(768)
2,337
622
26.6
947
-74.1
1,715
5.0
1Q
18,605
26.8
1,724
-14.0
9.3
336
34
348
-
1,703
489
28.7
1,214
-16.6
1,214
-16.6
24 October 2017
5

Sector Update | 24 October 2017
Oil & Gas
Auto fuel consumption growth
(% YoY)
MS
HSD
Auto fuel consumption remains strong
Positive on OMCs, with preference for IOC
Latest petroleum data suggest strong growth of 9.8% and 6.2% in petrol (MS) and
diesel (HSD) consumption, respectively, in YTD FY18. During the same period,
consumption of LPG grew by 10% and of kerosene (SKO) declined by 35.6%. Strong
auto fuel consumption is positive for the OMCs (IOC, BPCL and HPCL). We maintain
our optimistic stance on the OMCs, with a relatively high preference for IOC.
Strong consumption growth of 9.8% in MS and 6.2% in HSD
n
Gross marketing margins
(INR/ltr)
3.2
3.1
Petrol
3.1
2.7
2.6 2.7
2.7 2.6
2.4 2.5
2.3
Diesel
3.2
3.1
n
n
1.9
n
n
n
Our recommendations
OMCs
IOC
HPCL
BPCL
CMP
404
461
512
TP
559
585
644
Rating
Buy
Buy
Buy
Total petroleum products consumption in India grew by 9.9% YoY (+3.2% MoM)
to 16.3mmt in September 2017. For YTD FY18, consumption is up 1.5% YoY to
98.3mmt.
Consumption in September was driven by strong growth in HSD (+17.8% YoY to
2.1mmt) and MS (+16.6% YoY to 6.1mmt) consumption. YTD FY18 growth for MS
and HSD stands at 9.8% YoY and 6.2% YoY, respectively.
While LPG consumption grew 4.1% YoY to 1.9mmt, SKO consumption declined
33.6% YoY to 333kmt in September. YTD FY18 consumption growth for LPG and
SKO stands at 10% YoY and -35.6% YoY, respectively.
Naphtha consumption grew 4.9% YoY to 1.2mmt in September; it is down 13%
YoY in YTD FY18.
Consumption of lubricants & grease grew 34% YoY to 296kmt, while that of FO
& LSHS declined 14% YoY. In YTD FY18, consumption of lubricant & grease and
FO & LSHS is down 2.5% YoY and 8.7% YoY, respectively.
ATF consumption grew 7.3% YoY to 615kmt in September; YTD FY18 growth
stands at 9.2% YoY. Bitumen consumption grew 7.4% YoY to 287kmt in the
month; it is down 4.1% YoY in YTD FY18.
Strong consumption growth is positive for OMCs
n
Refer to our earlier report on OMC’s
n
n
n
n
Strong consumption of auto fuel is positive for OMCs. MS and HSD consumption
grew 8.9% YoY and 6.6% YoY, respectively, in 2QFY18. ATF consumption grew
9.2% YoY in 2QFY18, led by double-digit growth in air passenger traffic.
While LPG consumption grew 9.3% YoY, SKO consumption declined 37.2% YoY in
2QFY18. The continuous decline in SKO consumption is positive for OMCs, as
under-recoveries are becoming irrelevant.
We have observed strong gross margins for auto fuels in 2QFY18 for OMCs,
supported by daily retail price revisions.
Global refining and marketing companies trade at an EV/EBITDA of 6.9x FY19E
and a P/E of 10x FY19E. OMCs trade at an EV/EBITDA of 7.9x FY19E and a P/E of
10.9x FY19E (consensus) with superior return ratios compared to global peers.
The OMCs remain in a sweet spot considering high consumption growth,
potential marketing margin expansion, and low competitive intensity.
We reiterate Buy on IOCL, HPCL and BPCL, with targets of INR559, INR585 and
INR644, respectively.
24 October 2017
6

Exhibit 1: MS and HSD consumption grew 9.8% and 6.2% YoY for YTD FY18 (‘000 Metric Tonne)
PRODUCT
(A) Sensitive Products
LPG
SKO
Sub total
(B) Major Decontrolled Products
MS
HSD
Naptha+NGL
ATF
LDO
Lubricants & Greases
FO & LSHS
Bitumen
Sub total
(C ) Other Minor Decontrolled Products
Petroleum coke
Others
Sub total
All Products total
Sep-17
YoY gr %
MoM gr %
1,945
333
2,278
2,139
6,078
1,162
615
43
296
573
287
11,193
2,100
685
2,785
16,256
4.1%
-33.6%
-3.9%
17.8%
16.6%
4.9%
7.3%
17.1%
34.1%
-14.0%
7.4%
13.1%
7.4%
20.2%
10.3%
9.9%
-5.5%
14.0%
-3.0%
-2.2%
2.8%
9.8%
0.2%
16.8%
12.8%
5.7%
25.6%
3.3%
8.1%
11.1%
8.8%
3.2%
Q2 FY18
5,921
942
6,863
6,469
18,292
2,929
1,843
118
803
1,659
765
32,877
5,856
1,885
7,741
47,481
Q2 FY17
YoY gr %
YTD FY18 YTD FY17
YoY gr %
5,417
1,500
6,916
5,937
17,154
3,459
1,687
113
768
1,843
705
31,667
6,870
1,749
8,619
47,202
9.3%
-37.2%
-0.8%
8.9%
6.6%
-15.3%
9.2%
4.8%
4.5%
-10.0%
8.4%
3.8%
-14.8%
7.8%
-10.2%
0.6%
11,253
1,984
13,237
13,022
39,580
5,900
3,681
224
1,624
3,414
2,475
69,920
11,483
3,651
15,133
98,291
10,220
3,079
13,299
11,861
37,263
6,790
3,368
220
1,665
3,741
2,580
67,489
12,665
3,354
16,019
96,807
10.1%
-35.6%
-0.5%
9.8%
6.2%
-13.1%
9.3%
1.9%
-2.5%
-8.7%
-4.1%
3.6%
-9.3%
8.8%
-5.5%
1.5%
Source: Company, MOSL
24 October 2017
7

Sector Update | 23 October 2017
Automobiles
Growth seen across segments, barring premium (ex RE)
HMSI gains market share led by strong growth across segments; overtakes
BJAUT to occupy second spot in motorcycles
n
n
n
n
n
1HFY18 saw continuation of the scooterization trend, with scooters (~34% share v/s
32% in FY17) eating into the share of executive segment (32% share v/s 31% in FY17).
Economy segment grew 17% YoY in 1HFY18. HMCL’s volumes in this segment grew
32% YoY; the company now commands a market share of 57.7% in economy (v/s
55.1% in FY17).
Executive segment grew ~4% in 1HFY18, driven by 125cc segment (+9.8% YoY).
Scooterization continued to impact executive 100cc segment (grew just ~2%; -4%
CAGR over FY13-17).
Premium segment grew 5% in 1HFY18, but declined by 1% excluding Royal Enfield.
BJAUT’s premium segment volumes fell 20% YoY in 1HFY18, led by higher competition
from HMSI (+420bp to 14.9% market share) and TVS (+250bp to 13.4%).
Overall, HMSI, with a 29.8% market share, was the biggest gainer in 2Ws (overtook
BJAUT to occupy #2 spot in motorcycles; market share up ~290bp in 1HFY18). BJAUT,
with a 9.6% market share in 1HFY18, was the biggest loser (market share down
~180bp over FY17). However, BJAUT appeared to be reversing its fortunes in Sep-17,
with its market share at 12.1%, led by new launches.
Scooterization trend continues
n
n
n
n
In 2Ws, scooter volumes grew 17% YoY, while motorcycle volumes rose 8% YoY
in 1HFY18. Scooters have expanded its share by ~220bp to 34% (v/s FY17), led
by growing urban demand and increasing popularity among women population.
HMCL lost ~170bp market share to HMSI in 1HFY18. HMSI’s market share stood
at 59% in 1HFY18 (+190bp v/s FY17).
TVS’ scooter volume increased 41% YoY; it gained 113bp market share in
1HFY18 v/s FY17. TVS’ market share within scooters stood at 15.9% in 1HFY18.
Suzuki gained ~70bp market share to reach 5.7% in 1HFY18, led by its 125cc
offering Access (+67% YoY).
Bajaj loses share, HMSI emerges as #2 in motorcycles
n
n
n
BJAUT was the biggest loser in motorcycles; lost ~250bp market share to 15.5%
in 1HFY18 v/s FY17.
HMSI emerged #2 in motorcycles, gaining ~225bp market share in 1HFY18.
Interestingly, aided by its new launches, BJAUT regained the #2 spot within
motorcycles in Sep-17, with a market share of 19.5% (v/s 15.5% in 1HFY18).
Economy segment grows 17% YoY
n
n
CD Dawn & Deluxe volume rose 32% YoY in 1HFY18. Consequently, HMCL gained
~260bp market share in economy (v/s FY17) to 57.7%.
BJAUT lost 350bp market share within this segment in 1HFY18; its market share
now stands at 29% (v/s 32.5% in FY17). With BJAUT’s new offerings (CT100 ES
and new Platina) within this segment picking up pace, its market share has shot
up to 36.3% in Sep-17.
24 October 2017
8

Executive segment witnesses growth after three years of de-growth
n
n
n
Executive 100cc segment grew 2% YoY in 1HFY18, as HMCL’s
Splendor
volumes
grew 6% YoY, while Executive 125cc volumes increased 10% YoY.
HMSI’s
Shine
continues to gain share from HMCL’s
Glamour
in Executive 125cc
segment. Consequently, the market share gap between HMSI and HMCL has
widened, with the former achieving a comfortable #1 spot (48% market share in
1HFY18 v/s 44.5% in FY17).
HMSI’s Executive segment volumes grew 7% in 1HFY18, resulting in 300bp
market share gain in the segment at HMCL’s expense. BJAUT’s presence in this
segment is gradually languishing, as V12 and Discover volumes are on a
downtrend.
Premium segment (ex-RE) loses out, de-grows by 1% YoY
n
n
n
n
n
Overall premium segment grew 5% in 1HFY18, but declined 1% excluding Royal
Enfield.
BJAUT’s share in the premium segment shrunk 670bp to 31.6% in 1HFY18.
However, the company seems to be on track to capture lost market share in the
segment. With the launch of the new Pulsar NS series, its share within the
segment inched up to 36.1% in Sep-17. Pulsar also witnessed the highest
monthly dispatches in Sep-17.
KTM is also doing well in the segment (+43% YoY in 1HFY18), led by its new
250
Duke
and
390 Duke.
BJAUT’s loss in the premium segment resulted in market share gains for HMSI
and TVS, which have increased their market shares to 14.9% (+420bp v/s FY17)
and 13.4% (+250bp), respectively. HMSI’s premium segment volumes grew 59%
YoY in 1HFY18, while TVS’ volumes grew by 21% YoY, with
Apache
clocking the
highest monthly dispatch volumes in Sep-17 (39.5k)
.
Royal Enfield volumes grew 23% YoY, with its market share within the premium
segment expanding by 110bp to 25.2% in 1HFY18 v/s FY17.
Valuation and view
n
We prefer 4Ws over 2Ws/CVs due to stronger volume growth and a stable
competitive environment.
n
While we expect 2W volumes to benefit from a rural recovery in the near term,
competitive intensity remains high in the segment due to changing customer
preferences.
n
Our top picks in autos are MSIL, TTMT, Ashok Leyland and Amara Raja.
n
We also like MM as the best bet on a rural market recovery.
n
Eicher Motors
is our preferred pick in 2Ws.
24 October 2017
9

Metals Weekly
Steel and aluminum production run-rate declines in China in Sep
n
23 October 2017
Update
n
n
n
n
n
Indian steel: Long product (TMT Mumbai) prices were up ~1% WoW. Sponge iron prices were up 3% WoW, but
domestic scrap prices were unchanged. A few private miners have cut iron ore prices by INR100-200/t. Pellet
prices were also lower. Domestic HRC prices were unchanged.
Raw materials: Iron ore prices (China cfr) were unchanged. Thermal coal prices were down 1% WoW. Coking
coal prices were down ~2% WoW. China's pellet import prices were up ~2% WoW.
Europe: HRC prices were unchanged. CIS HRC export prices were marginally lower WoW. Rotterdam scrap
prices were down ~3% WoW.
China: Local HRC and rebar prices were down ~2%/~3% WoW. Export HRC prices rose ~2% WoW, but rebar
prices were down ~3% WoW.
Base metals: Aluminum (cash LME) prices were up ~1% WoW. Alumina prices were up ~4% WoW. Zinc (cash
LME) was down ~4%. Lead was down ~2% WoW. Copper was up ~2% WoW. Crude oil (Brent) prices were up
~1% WoW.
Steel/aluminum production in China moderates in Sep: Crude steel production growth decelerated from
9%/11% in August/July to 5.4% YoY (to 71.8mt) in September in China. Aluminum production declined 5% YoY
in September, accelerating from decline of ~3% in August. Early winter cuts and closure of illegal capacities are
driving lower production run-rate, in our view.
24 October 2017
10

September 2017 Results Preview | Sector: Capital Goods
ABB
Bloomberg
Equity Shares (m)
M. Cap. (INR b)/(USD b)
52-Week Range (INR)
1,6,12 Rel Perf. (%)
ABB IN
211.9
294 / 5
1619 / 950
4/0/7
n
CMP: INR1,388 TP: INR1,235 (-11%)
n
Sell
Financial Snapshot (INR b)
Y/E Dec
2016 2017E 2018E 2019E
Net Sales
EBITDA
Adj. PAT
Adj. EPS (INR)
EPS Gr (%)
BV/Sh (INR)
RoE (%)
RoCE (%)
Payout (%)
Valuations
P/E (x)
P/BV (x)
EV/EBITDA (x)
Div. Yield (%)
73.8
9.4
32.4
0.3
58.0
8.1
24.9
0.4
45.2
7.1
18.9
0.5
37.1
6.2
14.2
0.6
86.6
7.9
3.7
19.7
25.0
154.9
12.7
18.3
19.9
94.9
9.0
4.7
22.4
13.8
177.3
12.6
19.2
22.5
112.6
12.0
6.7
31.6
41.0
200.7
15.8
23.4
22.5
125.6
14.1
8.1
38.2
20.9
228.9
16.7
25.0
22.5
n
n
n
ABB has received orders to supply solar inverters to 750 railway
stations in North India.
During the quarter, we expect ABB to register 12% YoY growth in
revenue, led by robust performance from the electrification
products segment (+32% YoY growth).
We expect 150bp gross margin improvement on YoY basis to
35.8%, led by efficiencies generated on account of supply chain
initiatives taken by the company.
We expect 110bp YoY expansion in EBITDA margin to 8.5%.
Net profit growth is likely to remain a muted 3% YoY to INR897m
on account of higher interest cost (INR300m v/s INR178m in
3QCY17). Maintain
Sell.
Key issues to watch
Ø
Management commentary suggests cautious optimism. Continued focus
on exports and services to be an important driver of projected strong
double-digit revenue and profit growth.
Ø
Continued preference for cash generation vis-à-vis profits.
Quarterly Performance
Y/E December
Sales
Change (%)
EBITDA
Change (%)
As % of Sales
Depreciation
Interest
Other Income
PBT
Tax
Effective Tax Rate (%)
Reported PAT
Adj. PAT
Change (%)
1Q
20,035
10.4
1,808
25.9
9.0
359
223
149
1,376
442
32.1
854
934
72.0
CY16
2Q
3Q
20,947
20,550
8.4
4.4
1,136
1,516
-29.5
-2.7
5.4
7.4
357
406
197
178
299
299
881
1,231
324
427
36.8
34.7
556
811
556
871
-18.7
48.2
4Q
24,915
2.7
2,819
7.1
11.3
389
285
95
2,241
773
34.5
1,468
1,468
13.4
1Q
21,689
8.3
1,715
-5.2
7.9
376
212
186
1,312
428
32.6
884
884
-5.3
CY17
2Q
3QE
22,237
23,050
6.2
12.2
1,473
1,950
29.7
28.6
6.6
8.5
383
393
231
300
326
100
1,185
1,357
435
460
36.7
33.9
751
897
751
897
34.9
3.0
CY16
4QE
27,960
12.2
3,851
36.6
13.8
420
426
117
3,121
903
28.9
2,217
2,217
51.1
85,318
6.4
7,901
5.8
9.3
1510
919
658
6,131
1,957
31.9
3,687
4,175
25.0
CY17E
93,568
9.7
8,989
13.8
9.6
1573
1,169
728
6,975
2,226
31.9
4,749
4,749
13.8
24 October 2017
11

September 2017 Results Preview | Sector: Cement
Ambuja Cements
Bloomberg
Equity Shares (m)
M. Cap. (INR b)/(USD b)
52-Week Range (INR)
1,6,12 Rel Perf. (%)
ACEM IN
1985.7
545 / 8
291 / 191
-2 / 10 / -5
CMP: INR274
TP: INR317 (+16%)
Buy
Financial Snapshot (INR Billion)
Y/E DEC
2016 2017E 2018E 2019E
Sales
EBITDA
NP
Adj. EPS (INR)
EPS Gr. (%)
BV/Sh. (INR)
RoE (%)
RoCE (%)
Payout (%)
Valuations
P/E (x)
P/BV (x)
EV/EBITDA (x)
EV/Ton (USD)
39.6
2.0
23.3
186
27.9
1.9
19.6
178
23.5
1.8
15.7
165
19.1
1.7
12.6
151
91.6 102.0 113.0 126.2
15.8
9.7
4.9
-10.6
5.1
6.9
29.6
18.0
13.8
7.0
42.2
7.0
7.2
23.5
21.8
16.3
8.2
18.4
7.9
8.1
28.4
27.2
20.1
10.1
23.1
9.2
9.5
60.1
96.4 101.7 107.6 111.6
n
Dispatches in 3QCY17 are estimated to increase 10% YoY to
5.05mt, led by market share gains in north and a favorable base.
Average realizations are expected to decrease by 2.4% QoQ to
INR4,541/ton due to weak pricing. Revenue is estimated at
INR22.9b (+14% YoY).
n
EBITDA margin is expected to be 15.2% (-6.5pp QoQ, +1.4pp YoY).
EBITDA/ton is estimated at INR691 (-INR319 QoQ, +INR88 YoY).
n
Adjusted PAT is estimated to increase 5.3% YoY to INR2.9b due to
weak profitability.
n
The stock trades at P/E of 23.5x/19x on CY18E/CY19E earnings and
15.7x/12.6x CY18E/CY19E EV/EBITDA and CY18E/CY19E EV/ton of
USD165/USD151. Maintain Buy.
Key issues to watch out for:
Ø
Volume growth recovery and outlook.
Ø
Cement pricing outlook and sustainability.
Ø
Cost curve trend in CY17.
Quarterly Performance
Y/E December
Sales Volume (m ton)*
YoY Change (%)
Realization (INR/ton)
YoY Change (%)
QoQ Change (%)
Net Sales
YoY Change (%)
EBITDA
Margins (%)
Depreciation
Interest
Other Income
PBT before EO Item
Extraordinary Inc/(Exp)
PBT after EO Exp/(Inc)
Tax
Rate (%)
Reported Profit
Adj PAT
YoY Change (%)
E: MOSL Estimates
1Q
5.97
9.9
4,032
-9.7
-6.2
24,060
-0.8
4,255
17.7
3,830
188
1,303
1,541
210
1,751
1,216
69.4
535
471
-85.2
CY16
2Q
3Q
5.85
4.58
-1.7
-6.5
4,322
4,376
3.2
2.3
7.2
1.3
25,281
20,043
1.4
-4.3
5,782
2,760
22.9
13.8
1,507
1,595
212
192
1,900
2,503
5,963
3,477
0
0
5,963
3,477
1,444
707
24.2
20.3
4,519
2,770
4,519
2,770
99.7
80.4
4Q
5.09
-7.1
4,316
0.4
-1.4
21,967
-6.8
2,947
13.4
1,563
136
755
2,003
-105
1,898
297
15.7
1,601
1,689
16.2
1Q
6.02
0.9
4,208
4.4
-2.5
25,334
5.3
3,651
14.4
1,460
377
1,310
3,124
0
3,124
658
21.1
2,465
2,465
423.7
CY17
2Q
3QE
6.07
5.05
3.8
10.3
4,651
4,541
7.6
3.8
10.5
-2.4
28,233
22,933
11.7
14.4
6,131
3,490
21.7
15.2
1,439
1,500
165
150
940
2,000
5,466
3,840
0
0
5,466
3,840
1,544
922
28.2
24.0
3,922
2,918
3,922
2,918
-13.2
5.3
(INR m)
CY16
CY17E
4QE
5.68
11.6
4,483
3.9
-1.3
25,461
15.9
4,683
18.4
1,495
-103
1,751
5,041
0
5,041
545
10.8
4,496
4,496
166.2
21.49
-1.2
4,263
-1.0
91,604
7.7
15,755
17.2
8,501
715
6,837
13,376
0
13,376
3,672
27.5
9,703
9,703
14.4
22.82
6.2
4,468
4.8
101,961
5.4
17,953
17.6
5,894
589
6,000
17,471
0
17,471
3,669
21.0
13,802
13,802
42.2
24 October 2017
12

September 2017 Results Preview | Consumer
Asian Paints
Bloomberg
Equity Shares (m)
M. Cap. (INR b)/(USD b)
52-Week Range (INR)
1,6,12 Rel Perf. (%)
APNT IN
959.2
1105 / 17
1261 / 850
-4 / 1 / -17
CMP: INR1,152
TP: INR1,315 (+14%)
Neutral
Financial Snapshot (INR b)
y/e March
2017 2018E 2019E 2020E
Sales
EBITDA
Adj. PAT
Adj. EPS.INR
EPS Gr. (%)
BV/Sh.(INR)
RoE (%)
RoCE (%)
Payout (%)
Valuations
P/E (x)
P/BV (x)
EV/EBITDA
(x) Yield (%)
Div.
54.8
14.5
35.6
0.8
51.9
13.2
32.9
1.0
43.5
11.4
27.4
1.1
36.0
9.6
22.6
1.1
152.9 166.2 202.2 242.4
30.2
20.2
21.0
8.7
79.3
28.5
24.3
37.8
32.8
21.3
22.2
5.6
26.7
23.0
45.1
39.0
25.4
26.5
19.5
28.1
24.7
39.6
46.6
30.7
32.0
20.8
28.9
25.9
34.3
87.1 101.3 120.5
n
We expect revenue to grow 12.5% YoY to INR42.3b in 2QFY18,
with 15% volume growth in the domestic decorative business. We
have factored in GST related accounting impact of 7.5% on sales
and no impact on absolute EBITDA.
n
We note that crude prices are up 13% YoY and 3% QoQ in
2QFY18. The magnitude of price movement in crude derivatives is
lower vis-à-vis crude prices.
n
Operating margin is likely to expand slightly by 20bp to 19.1% in
2QFY18.
n
We estimate 10.7% PAT growth for 2QFY18.
n
The stock trades at 43.5x FY19E EPS of INR26.5; maintain
Neutral.
Key issues to watch for
Ø
Volume growth trends and demand scenario in urban and rural
geographies.
Ø
Demand outlook for industrial paints.
Ø
Outlook for raw materials/pricing actions.
Quarterly Performance (Consolidated)
Y/E March
Dom Deco Volume Growth %
Net Sales
Change (%)
EBITDA
Margin (%)
Change (%)
Interest
Depreciation
Other Income
PBT
Tax
Effective Tax Rate (%)
Adjusted PAT
E: MOSL Estimates
1Q
11.0
35,870
7.6
8,162
22.8
20.3
63
844
719
7,973
2,593
32.5
5,506
FY17
2Q
3Q
12.0
2.0
37,633 39,370
9.6
2.6
7,130
7,763
18.9
19.7
17.3
-1.2
60
92
844
855
791
415
7,017
7,231
2,207
2,465
31.5
34.1
4,759
4,662
4Q
10.0
39,525
7.8
7,119
18.0
2.1
90
835
701
6,895
2,205
32.0
4,796
1Q
4.0
38,152
6.4
6,654
17.4
-18.5
80
905
783
6,452
2,160
33.5
4,382
FY18
2QE
3QE
15.0
15.0
42,337 44,292
12.5
12.5
8,106
9,310
19.1
21.0
13.7
19.9
80
80
970
983
886
456
7,942
8,702
2,621
2,872
33.0
33.0
5,271
5,726
(INR Million)
FY17
4QE
10.0
8.8
41,388 152,398
4.7
6.8
8,703 30,173
21.0
19.8
22.3
9.0
104
305
998
3,378
742
2,626
8,342 29,116
2,722
9,469
32.6
32.5
5,911 20,162
FY18
11.0
166,169
9.0
32,772
19.7
8.6
344
3,857
2,867
31,438
10,375
33.0
21,289
24 October 2017
13

September 2017 Results Preview | Sector: Financials
HDFC Bank
Bloomberg
Equity Shares (m)
M. Cap. (INR b)/(USD b)
52-Week Range (INR)
1,6,12 Rel Perf. (%)
HDFCB IN
2562.5
4611 / 71
1868 / 1159
3 / 20 / 28
CMP: INR1,799
TP: INR2,066 (+15%)
Buy
Financial Snapshot (INR b)
Y/E MARCH
2017 2018E 2019E 2020E
NII
OP
NP
NIM (%)
EPS (INR)
EPS Gr. (%)
BV/Sh. (INR)
ABV/Sh. (INR)
RoE (%)
RoA (%)
Payout (%)
Valuations
P/E(X)
P/BV (X)
P/ABV (X)
Div. Yield (%)
31.7
5.4
5.4
0.6
26.4
4.6
4.7
0.8
21.8
4.0
4.0
0.9
18.1
3.4
3.4
1.1
331.4 400.9 479.4 576.0
257.3 321.6 389.0 466.8
145.5 174.8 211.6 255.1
4.6
56.8
16.7
4.7
68.2
20.1
4.6
82.6
21.0
4.5
99.6
20.6
336 388.2 451.5 527.9
331 381.7 448.1 523.2
18.3
1.8
23.4
18.8
1.8
23.4
19.7
1.9
23.4
20.3
1.8
23.4
n
Loan growth will be strong at 26% YoY. Deposit growth will be
healthy at ~18% YoY, led by CASA inflows.
n
COF decline would help to negate the impact of declining yields
environment, and we expect HDFCB to report only a marginal
~10bp contraction in margins and report strong NIM of 4.6%. NII
is expected to grow at 22% YoY.
n
Other income growth is expected to moderate to ~17% YoY,
factoring in lower trading gains. Fee income should remain healthy.
Tie-up with new banca partners will drive fee income growth.
n
Opex growth would be lower than total income growth at ~15%
YoY, aided by the bank’s strong digital initiatives and focus on
cutting excess flab (headcount reduced by ~10k in 2HFY17).
n
Healthy PPoP growth would lead to 22% YoY PAT growth, largely in
line with 20% growth trend exhibited by the bank in the last few
years. Asset quality is expected to remain stable, with GNPA at ~1.3%.
n
HDFCB trades at 4x FY19E BV and 21.8x FY19E EPS. Comfort on
earnings (~21% CAGR over FY17-20) remains high. Maintain Buy.
Key issues to watch for
Ø
Performance in retail loan/agri portfolio, especially in CV/CE.
Ø
Trends in digital banking/payments and various initiatives;
overall B/S growth outlook and economic recovery.
(INR m)
Quarterly Performance
1Q
77,814
21.8
28,066
1,05,881
47,689
58,192
20.0
8,667
49,525
17,136
32,389
20.2
Net Interest Income
% Change (Y-o-Y)
Other Income
Net Income
Operating Expenses
Operating Profit
% Change (Y-o-Y)
Other Provisions
Profit before Tax
Tax Provisions
Net Profit
% Change (Y-o-Y)
Operating Parameters
NIM (Reported,%)*
4.4
4.2
4.1
4.3
NIM (Cal, %)#
4.7
4.5
4.6
4.8
Deposit Growth (%)
18.5
16.7
21.1
17.8
Loan Growth (%)
23.2
18.1
13.4
19.4
CD Ratio (%)
82.0
83.6
78.0
86.2
CASA Ratio (%)
39.9
40.4
45.4
48.0
Asset Quality
OSRL (INR B)
4.7
4.9
5.0
3.3
OSRL (%)
0.1
0.1
0.1
0.1
Gross NPA (INR B)
49.2
50.7
52.3
58.9
Gross NPA (%)
1.0
1.0
1.1
1.1
E: MOSL Estimates; * Reported on total assets; # Cal. on interest earning assets
FY17
FY18E
FY17
FY18
2Q
3Q
4Q
1Q
2QE
3QE
4QE
79,936
83,091
90,551
93,707
97,661 1,02,403 1,07,091 3,31,392 4,00,863
19.6
17.6
21.5
20.4
22.2
23.2
18.3
20.1
21.0
29,010
31,427
34,463
35,167
33,840
36,341
41,327 1,22,965 1,46,675
1,08,945 1,14,518 1,25,014 1,28,874 1,31,502 1,38,744 1,48,418 4,54,357 5,47,538
48,700
48,425
52,220
53,675
55,942
56,451
59,898 1,97,033 2,25,965
60,246
66,093
72,794
75,199
75,559
82,293
88,521 2,57,324 3,21,573
19.5
15.2
26.9
29.2
25.4
24.5
21.6
20.4
25.0
7,490
7,158
12,618
15,588
11,000
12,500
15,659
35,933
54,747
52,756
58,935
60,176
59,612
64,559
69,793
72,862 2,21,391 2,66,826
18,202
20,281
20,275
20,673
22,273
24,079
25,030
75,894
92,055
34,553
38,653
39,901
38,938
42,286
45,714
47,832 1,45,496 1,74,771
20.4
15.1
18.3
20.2
22.4
18.3
19.9
18.3
20.1
4.3
4.6
17.8
19.4
86.2
48.0
3.3
0.1
58.9
1.1
4.2
4.6
22.0
22.0
86.2
46.0
4.7
17.0
23.4
86.5
4.6
18.0
25.7
89.0
4.6
16.1
31.9
88.6
4.6
22.0
22.0
86.2
0.0
0.0
0.0
94.7
1.4
0.0
0.0
72.4
1.2
0.0
0.0
81.4
1.3
0.0
0.0
90.4
1.4
94.7
1.4
24 October 2017
14

September 2017 Results Preview | Sector: Technology
Infosys
Bloomberg
Equity Shares (m)
M. Cap. (INR b)/(USD b)
52-Week Range (INR)
1,6,12 Rel Perf. (%)
INFO IN
2285.6
2064 / 32
1081 / 862
1 / -15 / -25
n
CMP: INR903
n
TP: INR1,050 (+16%)
Buy
Financial Snapshot (INR b)
y/e mar
2017 2018E 2019E 2020E
Sales
EBITDA
PAT
EPS (INR)
EPS Gr. (%)
BV/Sh. (INR)
RoE (%)
RoCE (%)
Payout (%)
Valuations
P/E (x)
P/BV (x)
EV/EBITDA (x)
Div Yield (%)
14.4
3.0
9.0
2.9
14.5
2.7
8.7
3.3
13.6
2.5
7.8
3.8
12.2
2.3
6.9
4.2
684.9
186.1
143.8
62.9
6.6
302
22.0
22.0
40.9
706.0
184.5
142.3
62.3
-1.1
333.5
19.6
19.6
48.2
772.8
200.3
151.6
66.3
6.5
361.1
19.1
19.1
51.3
846.2
219.3
169.5
74.2
11.8
391.7
19.7
19.7
51.2
n
n
n
n
In CC terms, our revenue growth estimate for 1QFY18 is 2% QoQ.
We expect absence of a seasonal pick-up, given the softness
witnessed in BFS and Retail. Cross-currency tailwinds of 110bp
would result in USD revenue growth of 3.1%.
At the end of 4QFY17, INFO guided for 6.5-8.5% YoY CC growth,
implying a CQGR of 2.2-3%. FY17 guidance would be tested by 2Q
revenue growth, and by expectations of momentum going forward
as the company continues to be faced with multiple internal issues.
We expect EBITDA margin to decline by 80bp QoQ to 25.9%, led by
continued investments in the business and the fact that operational
efficiency levers have been squeezed materially over the last few
quarters.
With this, we expect full-year EBIT margin at 23.6%, at the lower
end of the revised profitability guidance range of 23-25%.
Our PAT estimate is INR35.5b, +1.8% QoQ, led by lower profitability
and higher ETR.
The stock trades at 14.5x FY18E and 13.6x FY19E earnings. Buy.
Key issues to watch for
Ø
Update on internal stability of the company.
Ø
Commentary around contribution of newly launched services, and
revenue scale and growth from products and solutions.
Ø
Commentary around macro, verticals, margins and pricing.
FY18E
2QE
3QE
2,732
2,751
3.1
0.7
175,683
177,417
1.5
2.7
38.1
38.1
12.2
12.3
45,455
45,794
25.9
25.8
23.3
23.3
9,038
7,659
29.0
29.0
35,503
34,738
1.8
-2.2
-1.5
-6.3
15.5
15.2
202,141
211,885
87.0
84.2
FY17
4QE
2,802
1.9
171,200
0.0
38.4
12.2
47,625
27.8
23.6
8,262
29.0
36,430
4.9
1.1
15.9
215,126
83.8
10,208
7.4
684,850
9.7
39.3
12.2
186,050
27.2
24.7
30,790
28.0
143,830
6.6
62.9
200,364
82.8
(INR m)
FY18E
10,936
7.1
705,992
3.1
38.3
12.2
184,485
26.1
23.6
33,100
28.7
142,261
-1.1
62.3
215,126
84.9
Quarterly Performance (IFRS)
Y/E March
1Q
Revenue (USD m)
2,501
QoQ (%)
2.2
Revenue (INR m)
167,820
YoY (%)
16.9
GPM (%)
38.7
SGA (%)
12.2
EBITDA
44,470
EBITDA Margin (%)
26.5
EBIT Margin (%)
24.1
Other income
7,530
ETR (%)
28.4
PAT
34,360
QoQ (%)
-4.5
YoY (%)
13.4
EPS (INR)
15.0
Headcount
197,050
Util excl. trainees
81.1
Attrition (%)
21.0
Offshore rev. (%) (IT
43.0
Fixed Price (%)
45.7
E: MOSL Estimates
FY17
2Q
3Q
2,587
2,551
3.4
-1.4
173,100
172,730
10.7
8.6
39.1
39.7
11.8
12.2
47,330
47,670
27.3
27.6
24.9
25.1
7,600
8,200
28.8
28.1
36,060
37,080
4.9
2.8
6.1
7.0
15.8
16.2
199,829
199,763
83.1
82.4
20.0
18.4
43.0
43.5
47.1
49.5
4Q
2,569
0.7
171,200
3.4
39.7
12.5
46,580
27.2
24.6
7,460
27.0
36,030
-2.8
0.2
15.8
200,364
82.6
17.1
43.3
49.4
1Q
2,651
3.2
170,780
1.8
38.8
12.1
45,610
26.7
23.7
8,140
28.2
34,880
-3.2
1.5
15.3
198,553
84.5
21.0
43.4
49.3
24 October 2017
15

September 2017 Results Preview | Sector: Media
Zee Entertainment
Bloomberg
Equity Shares (m)
M. Cap. (INR b)/(USD b)
52-Week Range (INR)
1,6,12 Rel Perf. (%)
Z IN
960.4
501 / 8
580 / 429
1 / -9 / -20
n
n
n
CMP: INR522
n
TP: INR630 (+21%)
Buy
Financial Snapshot (INR Billion)
Y/E MARCH
2017 2018E 2019E 2020E
Net Sales
EBITDA
Adj. NP
Adj. EPS (INR)
Adj. EPS Gr. (%)
BV/Sh (INR)
RoE (%)
RoCE (%)
Div. Payout (%)
Valuations
P/E (x)
P/BV (x)
EV/EBITDA (x)
Div. Yield (%)
37.6
5.9
24.7
0.5
42.9
5.5
22.9
0.5
29.3
4.9
17.1
0.6
23.6
4.3
14.0
0.6
64.3
19.3
14.5
13.9
89.2
19.3
20.7
13.0
64.6
20.3
13.1
12.2
75.9
26.9
18.2
17.8
46.4
18.7
19.5
19.0
87.8
32.1
22.1
22.1
24.1
20.1
20.5
15.7
80.7 -12.4
14.7
15.7
22.7
95.4 106.8 122.2
n
n
We expect advertising revenue to grow 4% YoY to INR9.2b. Ex-
sports, ad revenue is expected to grow 3% YoY, as it will be offset
by RBL revenues. GST impacted ad growth in July and August
significantly.
Domestic subscription revenue is likely to decline 18% YoY to
INR4.8b. Excluding sports, it has grown 9%.
Total revenue is expected to decline 7% YoY to INR15.7b. Ex-sports,
revenue is likely to grow 4% YoY.
We expect EBITDA margin to improve 110bp YoY to 29.9% due to
the sale of sports business. Ex-Sports EBITDA margin is expected to
contract 420bp.
Adjusted PAT is expected to grow ~29% YoY to INR3.1b.
The stock trades at 42.6x FY18E and 29.1x FY19E EPS. Buy.
Key things to watch for
Ø
YoY ad growth (Ex-sports 3% growth).
Ø
Domestic subscription (Ex-sports 9% growth).
Consolidated - Quarterly Earning Model
Y/E March
Total Revenue from Operations
YoY Change (%)
Total Expenditure
EBITDA
Margins (%)
Depreciation
Interest
Other Income
PBT before EO expense
Extra-Ord expense
PBT
Tax
Rate (%)
Minority Interest & P/L of Asso. Cos.
Reported PAT
Adj PAT
YoY Change (%)
Margins (%)
E: MOSL Estimates
1Q
15,717
18.5
11,185
4,532
28.8
251
75
734
4,940
1,132
3,808
1,626
42.7
13
2,169
2,818
31.4
17.9
FY17
2Q
16,954
23.0
12,062
4,892
28.9
336
86
432
4,903
829
4,074
1,634
40.1
56
2,383
2,880
18.8
17.0
3Q
16,391
3.4
11,233
5,158
31.5
249
90
525
5,343
714
4,630
2,081
44.9
41
2,508
2,901
15.0
17.7
4Q
15,280
0.4
10,593
4,688
30.7
316
1,122
549
3,799
-12,705
16,504
1,464
8.9
-116
15,156
3,578
101.2
23.4
1Q
15,402
-2.0
10,559
4,844
31.4
311
147
1,011
5,396
532
4,864
2,344
48.2
4
2,516
2,791
-0.9
18.1
FY18
2QE
15,745
-7.1
11,033
4,712
29.9
336
410
698
4,664
0
4,664
1,586
34.0
0
3,078
3,078
6.9
19.6
FY17
3QE
17,441
6.4
11,830
5,611
32.2
336
410
698
5,563
0
5,563
1,891
34.0
0
3,672
3,672
26.6
21.1
4QE
16,014
4.8
10,863
5,151
32.2
336
410
698
5,102
0
5,102
1,647
32.3
0
3,455
3,455
-3.4
21.6
64,342
10.7
45,073
19,269
29.9
1,152
1,372
2,240
18,985
-10,030
29,015
6,805
23.5
-7
22,216
12,177
37.3
18.9
(INR m)
FY18E
64,602
0.4
44,285
20,317
31.4
1,319
1,377
3,104
20,726
532
20,193
7,469
37.0
4
12,721
12,996
6.7
20.1
24 October 2017
16

In conversation
1. BAJAJ AUTO: No official notification of 3-wheeler import ban
in Sri Lanka yet; S Ravikumar, President of Business
Development and Assurance
n
n
n
n
n
n
n
Waiting for official notification on the import ban in Sri Lanka for 3-wheelers and
in touch with distributors over there.
Sri Lanka's budget is due next week and usually before that these kind of reports
come.
Between domestic and international, company looking at sale of 6 lakh three-
wheelers. So far the numbers are quite good.
Total dependence on Sri Lanka with regards to 3-wheeler exports is 6 percent of
overall number.
Demand for exports have risen in the current year and demand is outstripping
production. The production is running at about over 100 percent installed
capacity and will continue for next few months even if Sri Lanka news is true.
See no impact on demand for the company and impact on earnings contribution
of the company.
With de-risking strategy in mind the company has come out with a 'Qute' model
which has all the benefits of three wheelers and is low risk and has low
emission.
Company in par with the guidance of 25 percent sales for the festive season.
Saw good traction for Platina and CT100, and Pulsar is also doing great.
2. PC JEWELLER: Expect 30% sales growth for FY18; Sanjeev
Bhatia, CFO
n
n
n
n
Festive season starts from Navratri and it peaks during Dhanteras. Therefore,
saw good growth in this festive season.
Also getting market share from unorganised players.
Expect 30 percent sales growth for FY18.
Store rollout funding will be done via internal accruals
3. SKIPPER: Expect 25% growth for polymer business in FY18;
Sharan Bansal, Director
n
n
n
n
Expect 25 percent growth for polymer business in FY18.
For consolidated revenue, expect 15-20 percent growth in FY18.
Expect capacity utilisation to go up to 65 percent by end of FY18.
Order book for engineering projects is at Rs 2,650 crore. Seeing pickup in
engineering order inflows.
4. IEX: Fund raising plans and growth targets; SN Goel, MD and
CEO
n
n
Will not require any fund for the existing business. Initial public offering (IPO)
was to provide an exit option to some investors.
Tata Power Company which was an early investor from 2008 is exiting
completely.
24 October 2017
17

From the think tank
1. Axis Bank has uncovered a second porky pie of bad loans
n
Axis Bank Ltd. has been caught lying again. On Tuesday evening, the Indian lender
reported that the central bank wasn’t happy with its classification of nine large
corporate accounts as standard assets. As a result, the non-state-owned bank, the
country’s sixth-largest by market value, has decided to rebrand the entire $750
million as nonperforming. It’s the second time this year that Axis has had to bump
up its bad-loan count under pressure from the Reserve Bank of India. In May, it
reported a previously undisclosed soured asset of almost $1.5 billion. That time
around, it wasn’t the only financial institution to try and hide a bad egg. ICICI Bank
Ltd. and Yes Bank Ltd. made similar disclosures, prompting me to coin a new
metric to value Indian banks: the price-to-truth ratio.
2. Can Block Chain technology be an answer to India’s land
governance woes?
n
Anyone who has watched Dibakar Banerjee’s comedy drama, Khosla ka Ghosla,
knows the nightmare of Kamal Kishore Khosla when his land—bought out of
hard earned ‘middle class’ income—is usurped by the land-shark Kishen
Khurana. Khosla’s original land ownership papers are no match for the forged
papers created by Khurana. No prizes for guessing that the judicial process to
reclaim land would have been far more complicated and Khosla would almost
certainly have failed to convince the courts due to the lack of ‘confirmed titling’.
As a result, the movie shows his sons attempting to ‘buy’ their land back from
Khurana. The brilliant plot provides only a glimpse of the complex world of land
conflicts, which is a cause for stalling of investments to the tune of Rs12 trillion
in India. But it nudges us to ask why we have a land titling problem? The
apparent reason is an archaic piece of legislation, The Registration Act, 1908
that allows only ‘presumptive’ ownership
3. Will an economic slowdown hamper Narendra Modi's re-
election bid?
n
Apparently, “there is something in the New Delhi air”. Veteran political
observers of India reckon that slowing economic growth over the last six
quarters has infused pollutants into what was once considered the clean and
visible air of the 2019 general elections. It is undeniable that measured in the
metric of gross domestic product (GDP) growth, the economy has experienced a
slowdown. Political science theorists and public commentators intuit a
relationship between GDP and electoral outcomes and thus proclaim that the
2019 electoral air is now getting murkier. Successful re-elections in the last
decade of Narendra Modi as chief minister of Gujarat, Nitish Kumar in Bihar and
Shivraj Singh Chouhan in Madhya Pradesh are often cited as examples to argue
that high GDP growth can help an incumbent get re-elected. In national
elections, the National Democratic Alliance (NDA) government from 1999-2004
delivered average 5.8% GDP growth and was voted out while the United
Progressive Alliance (UPA) 1 (2004-09) delivered 8% GDP growth and was voted
back.
24 October 2017
18

International
4. Apple losing its supply chain mojo is a major threat
n
While consumers remember the iPhone for its cool design, closed-wall operating
system and hefty price tag, industry insiders in Asia turn to the US giant as an
example of incredible manufacturing discipline. First under Tim Cook, and now
Jeff Williams, the current chief operating officer, Apple has shone as a beacon of
how to discover and develop unique materials, coerce and cajole suppliers, and
churn out millions of units all without owning any factories. By now, everyone
has heard about delays in the supply chain. But analysts have so far forgiven
Apple, with full-year sales forecasts swinging by a mere 1.5% in the past six
months. A look at its key suppliers shows a different story. Thanks to Taiwan
rules requiring the disclosure of monthly sales, we can track endemic weakness
at its exclusive processor maker Taiwan Semiconductor Manufacturing Co. and
primary assembler Hon Hai Precision Industry Co.
24 October 2017
19

Click excel icon
for detailed
valuation guide
Rs
Valuation snapshot
P/E (x)
P/B (x)
ROE (%)
FY17 FY18E FY17 FY18E FY17 FY18E FY19E
24.8
28.2
24.3
48.9
44.9
18.0
50.8
45.7
36.3
25.4
22.4
25.2
44.6
31.4
21.3
58.4
29.4
29.3
26.1
30.1
25.9
32.8
17.2
18.8
35.3
NM
39.6
44.4
12.8
24.3
29.8
23.0
NM
16.3
33.8
9.0
NM
21.0
826.2
15.7
89.9
57.3
48.3
30.3
24.8
19.7
61.9
36.7
19.5
40.0
17.1
27.1
24.1
22.2
35.0
39.3
17.9
37.7
36.2
19.5
23.1
20.5
19.7
24.3
27.4
21.1
45.4
25.7
24.8
21.4
89.3
22.5
27.3
18.1
20.3
27.8
18.9
32.7
30.7
17.2
19.2
24.9
14.5
NM
10.2
8.0
7.7
6.7
22.4
16.8
14.0
15.9
40.1
33.9
22.7
20.4
15.5
51.0
32.9
16.0
30.6
15.7
4.6
6.1
5.5
7.2
7.4
2.8
15.9
8.7
3.7
3.5
7.5
3.2
2.8
6.5
2.5
13.5
5.0
2.0
2.7
2.3
2.5
5.5
1.9
1.3
4.9
0.7
5.1
4.7
1.2
3.8
3.4
0.9
0.6
0.6
0.5
0.9
0.3
0.7
1.2
0.4
0.8
11.0
5.7
3.2
4.1
2.3
18.5
6.8
4.7
4.7
3.1
4.0
5.4
4.9
6.3
6.6
2.5
11.9
7.2
3.1
3.2
6.5
2.9
2.5
5.7
2.2
11.0
4.4
1.8
2.2
2.2
2.0
4.8
1.8
1.2
4.4
0.7
4.6
3.3
1.2
3.3
3.0
0.9
0.6
0.6
0.5
0.8
0.3
0.7
1.1
0.4
0.7
6.4
4.6
2.8
3.5
2.1
15.2
6.2
4.2
4.1
2.7
20.3
23.1
25.3
16.2
15.8
16.9
37.1
20.8
10.6
13.9
35.7
14.2
6.4
20.3
9.8
25.6
17.1
6.9
10.8
9.5
9.9
18.3
10.2
7.2
15.3
-27.0
13.8
12.3
9.0
18.9
11.5
4.0
-6.7
4.2
1.4
10.1
-8.4
3.6
-0.2
2.7
0.9
21.6
15.1
12.0
18.0
14.4
32.5
18.9
25.5
12.4
19.4
15.8
23.8
23.3
19.3
17.8
14.8
36.1
21.8
17.3
13.8
34.0
13.5
10.8
20.4
11.0
26.7
17.2
7.6
11.5
2.5
9.6
18.8
8.6
6.3
16.9
3.5
15.0
13.0
6.7
18.3
12.2
6.1
-5.2
6.2
5.8
10.9
4.6
3.2
7.0
3.0
4.6
20.2
15.1
13.2
18.6
14.1
32.8
18.6
27.6
14.7
18.2
17.7
27.0
25.3
22.9
20.5
17.3
36.4
24.0
18.3
14.8
31.4
14.3
11.5
23.0
27.4
34.2
22.6
11.6
11.8
8.6
10.0
19.7
9.3
6.9
19.0
7.2
16.3
13.3
12.6
19.5
13.8
12.4
3.0
9.1
7.3
11.2
5.4
5.9
11.4
6.1
8.3
20.4
22.4
15.0
19.2
15.3
32.8
17.8
30.6
18.5
18.5
Company
Automobiles
Amara Raja
Ashok Ley.
Bajaj Auto
Bharat Forge
Bosch
CEAT
Eicher Mot.
Endurance Tech.
Escorts
Exide Ind
Hero Moto
M&M
Mahindra CIE
Maruti Suzuki
Tata Motors
TVS Motor
Aggregate
Banks - Private
Axis Bank
DCB Bank
Equitas Hold.
Federal Bank
HDFC Bank
ICICI Bank
IDFC Bank
IndusInd
J&K Bank
Kotak Mah. Bk
RBL Bank
South Indian
Yes Bank
Aggregate
Banks - PSU
BOB
BOI
Canara
IDBI Bk
Indian Bk
OBC
PNB
SBI
Union Bk
Aggregate
NBFCs
Bajaj Fin.
Bharat Fin.
Capital First
Cholaman.Inv.&Fn
Dewan Hsg.
GRUH Fin.
HDFC
Indiabulls Hsg
L&T Fin Holdings
LIC Hsg Fin
Reco
Buy
Buy
Buy
Buy
Neutral
Buy
Buy
Buy
Neutral
Buy
Neutral
Buy
Not Rated
Buy
Buy
Buy
CMP
(INR)
TP
% Upside
EPS (INR)
(INR) Downside FY17 FY18E FY19E
23
13
17
13
7
20
17
15
1
35
2
16
20
33
5
28.0
4.6
132.3
13.1
473.1
93.3
612.7
23.5
20.0
8.1
169.1
54.3
5.4
248.6
19.8
11.7
25.6
32.9
5.3
7.0
145.2 175.0
18.3
25.5
540.8 698.6
94.2 126.8
826.7 1,119.2
29.6
39.3
37.1
45.8
8.9
10.8
185.0 197.1
69.5
81.7
9.9
11.8
285.5 381.7
20.0
61.3
15.1
24.5
694
854
128
145
3,216 3,753
640
726
21,251 22,781
1,684 2,029
31,141 36,487
1,073 1,229
724
732
206
279
3,790 3,868
1,367 1,585
239
-
7,819 9,417
422
562
686
719
Neutral
Neutral
Buy
Buy
Buy
Buy
Neutral
Buy
Neutral
Buy
Buy
Buy
Buy
450
182
152
125
1,863
263
56
1,696
73
1,062
528
32
354
470
197
212
146
2,066
366
56
2,000
91
1,197
651
36
446
4
8
40
17
11
39
-1
18
25
13
23
13
26
15.4
7.0
5.0
4.8
56.8
15.3
3.0
48.1
-31.3
26.8
11.9
2.5
14.6
18.1
8.5
1.7
5.5
68.2
14.5
2.8
60.9
3.9
32.4
17.2
1.9
18.5
29.9
10.5
6.1
6.6
82.6
16.6
3.2
78.6
8.3
41.0
22.5
3.8
22.9
Buy
Neutral
Neutral
Neutral
Buy
Neutral
Buy
Buy
Neutral
138
135
306
52
264
114
131
246
127
217
141
323
49
333
150
184
341
135
57
4
6
-5
26
32
41
39
7
6.0
-14.8
18.8
1.5
29.3
-31.6
6.2
0.3
8.1
9.5
-11.2
30.1
6.4
34.4
17.1
5.8
14.6
9.0
20.8
6.6
47.0
8.6
38.3
21.4
11.0
26.8
19.1
Buy
Neutral
Buy
Buy
Buy
Neutral
Buy
Buy
Buy
Neutral
1,834
1,014
746
1,140
583
503
1,721
1,343
209
652
2,300
900
925
1,400
690
500
2,020
1,450
230
730
25
-11
24
23
18
-1
17
8
10
12
32.0
21.0
24.6
46.0
29.6
8.1
46.8
69.0
5.2
38.2
45.7
29.9
32.8
56.0
37.6
9.9
52.2
84.2
6.8
41.6
63.7
54.9
42.4
68.1
46.0
12.0
58.2
105.6
10.1
48.9
24 October 2017
20

Company
Manappuram
M&M Fin.
Muthoot Fin
PNB Housing
Repco Home
Shriram City Union
STF
Aggregate
Capital Goods
ABB
Bharat Elec.
BHEL
Blue Star
CG Cons. Elec.
CG Power & Indu.
Cummins
GE T&D
Havells
K E C Intl
L&T
Pennar Eng.
Siemens
Solar Ind
Suzlon Energy
Thermax
Va Tech Wab.
Voltas
Aggregate
Cement
Ambuja Cem.
ACC
Birla Corp.
Dalmia Bharat
Grasim Inds.
India Cem
J K Cements
JK Lakshmi Ce
Ramco Cem
Orient Cem
Prism Cem
Shree Cem
Ultratech
Aggregate
Consumer
Asian Paints
Britannia
Colgate
Dabur
Emami
Godrej Cons.
GSK Cons.
HUL
ITC
Jyothy Lab
Marico
Reco
Not Rated
Buy
Buy
Buy
Buy
Buy
Buy
CMP
(INR)
102
423
498
1,460
652
2,137
1,112
TP
% Upside
EPS (INR)
(INR) Downside FY17 FY18E FY19E
-
8.6
9.2
9.7
481
14
7.1
13.9
17.8
550
11
29.5 38.7
44.4
1,750
20
31.6 48.1
65.1
800
23
29.1 33.7
38.4
2,700
26
84.3 118.3 155.3
1,320
19
55.6 80.0 102.4
P/E (x)
P/B (x)
ROE (%)
FY17 FY18E FY17 FY18E FY17 FY18E FY19E
11.8 11.1
2.6
2.4
24.0 22.3 21.4
59.7 30.5
3.8
3.5
6.5
12.0 14.2
16.8 12.9
3.1
2.6
19.4 21.8 21.2
46.2 30.3
4.4
4.0
13.8 13.8 16.6
22.4 19.3
3.6
3.1
17.4 17.1 16.7
25.3 18.1
2.8
2.5
11.7 14.6 16.8
20.0 13.9
2.2
2.0
11.7 15.0 16.9
31.6 25.5
5.1
4.4
16.1 17.1 18.0
67.6
27.7
64.8
62.5
47.4
19.6
33.9
66.3
56.7
25.1
26.8
15.9
67.8
47.8
24.3
31.7
20.1
35.1
35.0
57.7
49.3
35.3
70.4
17.4
32.2
28.3
58.7
25.6
NM
412.5
49.5
43.8
37.1
55.8
63.3
50.0
43.7
43.1
49.6
31.7
63.6
31.8
34.2
50.5
59.4
25.9
31.9
47.2
44.1
39.6
32.5
40.9
50.4
22.7
24.4
12.4
55.8
40.7
17.5
32.4
17.3
32.3
30.7
40.5
34.1
24.6
43.4
16.7
24.1
24.0
42.0
25.5
35.7
32.3
37.5
41.2
30.7
52.8
54.7
45.4
41.0
42.5
43.6
31.3
54.4
28.8
39.1
46.5
8.6
5.7
1.0
10.2
25.8
1.2
6.7
9.4
10.3
4.8
3.2
1.6
6.3
8.8
-1.4
4.3
3.3
5.4
3.9
2.9
3.9
2.3
4.9
1.8
1.1
3.8
3.5
4.4
3.3
5.9
8.6
4.8
3.5
14.8
20.8
22.7
11.5
14.8
12.1
6.7
41.6
7.2
6.4
17.6
7.5
4.4
1.0
9.5
19.1
1.2
6.2
8.2
9.2
4.1
2.9
1.4
5.5
7.5
-1.5
3.9
2.8
4.8
3.6
2.8
3.7
2.2
4.4
1.6
1.1
3.3
3.2
3.9
3.0
5.1
7.1
4.3
3.2
13.5
17.1
21.6
9.9
12.6
9.4
6.5
41.3
7.1
6.5
15.1
12.7
20.6
1.5
18.0
76.4
6.2
21.2
12.4
18.2
21.2
12.5
10.2
9.3
19.8
NM
14.3
16.8
18.0
11.2
5.1
7.9
7.1
7.2
10.8
3.4
14.4
6.1
19.0
-3.2
1.4
18.4
11.6
9.4
28.5
36.9
50.4
28.4
35.8
24.6
22.2
66.5
23.5
21.1
36.7
12.6
17.1
3.1
20.9
49.7
3.0
19.7
21.5
18.3
19.5
12.4
11.6
9.8
19.8
-8.8
12.7
17.6
15.8
11.6
7.0
11.1
9.2
10.7
10.0
4.4
14.8
8.0
16.1
8.8
17.0
20.8
11.1
10.4
26.7
34.3
48.7
26.0
32.0
24.2
21.1
76.2
24.8
16.5
34.9
15.8
17.0
4.1
28.9
48.8
3.7
22.8
22.7
20.9
20.9
13.8
12.6
13.8
20.9
-11.0
12.8
17.4
16.0
13.1
7.9
14.2
12.2
13.3
12.9
6.1
17.5
12.3
17.5
12.8
22.9
18.8
14.2
12.5
28.1
34.5
56.2
26.3
33.9
22.8
22.6
87.2
26.3
18.4
37.7
Sell
Buy
Sell
Neutral
Buy
Neutral
Buy
Neutral
Neutral
Neutral
Buy
Not Rated
Neutral
Neutral
Not Rated
Neutral
Buy
Sell
1,332
174
87
805
222
81
899
380
542
297
1,135
112
1,208
985
15
977
598
543
1,235
187
75
690
240
80
1,170
395
460
295
1,400
-
1,355
900
-
840
800
470
-7
7
-14
-14
8
-1
30
4
-15
-1
23
12
-9
-14
34
-13
19.7
6.3
1.3
12.9
4.7
4.1
26.5
5.7
9.6
11.9
42.3
7.1
17.8
20.6
0.6
30.8
29.8
15.5
22.4
6.7
2.7
17.1
5.0
2.0
27.7
9.3
10.7
13.1
46.5
9.1
21.7
24.2
0.9
30.1
34.6
16.8
31.6
7.4
3.8
25.5
6.3
2.5
35.0
11.3
13.9
16.4
56.6
11.2
33.4
30.0
1.0
33.4
39.8
19.1
Buy
Neutral
Buy
Buy
Neutral
Neutral
Buy
Buy
Buy
Buy
Buy
Buy
Buy
282
317
1,780 1,797
1,007 1,150
2,731 3,272
1,181 1,276
181
198
954
1,196
409
485
699
832
158
182
113
140
19,024 22,084
4,209 4,906
13
1
14
20
8
9
25
19
19
15
24
16
17
4.9
7.0
36.1 52.2
28.5 40.9
38.8 62.9
67.8 70.6
5.6
7.5
33.7 39.7
7.0
9.7
27.3 27.4
-1.6
4.4
0.3
3.5
384.4 507.1
96.1 102.2
8.2
70.9
58.9
88.3
101.2
10.8
54.4
16.4
34.4
7.1
5.6
547.8
147.1
Neutral
Buy
Buy
Neutral
Buy
Neutral
Neutral
Buy
Neutral
Neutral
Neutral
1,172
4,666
1,062
317
1,144
938
4,944
1,249
267
384
317
1,315
5,165
1,328
330
1,400
1,005
4,630
1,400
290
410
350
12
11
25
4
22
7
-6
12
9
7
10
21.0 22.2
73.7 85.3
21.2 23.4
7.2
7.7
26.5 26.9
18.9 21.5
156.1 158.1
19.6 22.9
8.4
9.3
11.2
9.8
6.3
6.8
26.5
104.6
28.6
9.1
33.1
24.7
182.1
27.4
10.3
11.1
8.2
24 October 2017
21

Company
Nestle
Page Inds
Parag Milk
Pidilite Ind.
P&G Hygiene
Prabhat Dairy
United Brew
United Spirits
Aggregate
Healthcare
Alembic Phar
Alkem Lab
Ajanta Pharma
Aurobindo
Biocon
Cadila
Cipla
Divis Lab
Dr Reddy’s
Fortis Health
Glenmark
Granules
GSK Pharma
IPCA Labs
Jubilant Life
Lupin
Sanofi India
Shilpa Medicare
Strides Shasun
Sun Pharma
Syngene Intl
Torrent Pharma
Aggregate
Logistics
Allcargo Logistics
Blue Dart
Concor
Gateway
Distriparks
Gati
Transport Corp.
Aggregate
Media
Dish TV
D B Corp
Den Net.
Ent.Network
Hind. Media
HT Media
Jagran Prak.
Music Broadcast
PVR
Prime Focus
Siti Net.
Sun TV
Reco
Neutral
Buy
Neutral
Neutral
Neutral
Not Rated
Buy
Neutral
CMP
TP
% Upside
(INR) (INR) Downside
7,245 6,160
-15
19,615 21,310
9
275
280
2
801
865
8
8,593 9,200
7
148
-
838
980
17
2,497 2,600
4
FY17
118.0
238.7
3.6
16.7
132.9
3.5
8.7
26.7
EPS (INR)
FY18E FY19E
115.0 133.6
294.7 398.4
9.1
12.5
18.1
20.6
151.6 176.0
3.5
6.4
9.9
14.0
34.5
51.5
P/E (x)
FY17 FY18E
61.4 63.0
82.2 66.6
76.3 30.2
47.9 44.3
64.6 56.7
41.8 42.5
96.5 84.7
93.4 72.4
47.3 42.7
23.0
24.5
20.1
19.1
35.6
34.6
37.3
21.9
32.6
14.0
15.2
19.5
70.9
30.4
16.8
18.3
32.7
46.9
26.4
20.7
38.2
24.9
24.4
17.3
40.1
35.1
35.1
13.9
16.7
30.6
67.2
18.0
NM
68.4
9.4
14.0
16.6
59.5
68.9
84.7
NM
32.3
25.1
25.6
22.2
16.7
37.4
28.0
28.1
25.8
32.6
66.5
15.1
17.7
52.0
29.5
13.2
25.0
31.6
31.1
18.0
35.8
30.8
25.7
27.1
16.5
31.7
28.5
28.3
7.3
13.4
24.6
67.8
15.5
NM
64.2
9.5
10.0
14.5
41.1
53.4
34.2
NM
27.9
P/B (x)
ROE (%)
FY17 FY18E FY17 FY18E FY19E
23.2 21.6 39.0 35.5 38.1
32.9 26.4 40.0 39.6 43.1
3.5
3.2
6.0
11.0 13.3
12.4 10.1 28.2 25.2 23.5
40.5 33.6 39.3 64.9 62.8
2.1
2.0
5.2
4.9
8.5
9.5
8.7
10.2 10.7 13.6
18.7 13.0 21.3 18.0 20.3
13.0 12.1 27.5 28.2 29.3
4.9
5.3
6.6
4.7
4.5
7.2
3.8
4.3
3.2
1.5
3.8
3.6
10.3
2.5
2.8
3.5
5.6
5.7
2.8
3.5
7.7
5.3
4.1
2.3
17.8
3.7
2.6
1.9
2.6
3.8
15.0
4.2
1.8
4.4
1.5
1.1
2.7
4.0
6.9
5.6
3.9
7.9
4.3
4.5
5.3
3.7
4.2
6.1
3.4
4.5
3.0
1.3
3.1
2.5
12.0
2.3
2.4
3.1
5.2
4.9
2.5
3.4
6.3
4.7
3.7
2.1
13.6
3.5
2.5
1.7
2.2
3.5
12.3
3.5
1.9
4.1
1.3
1.0
2.7
3.6
6.1
4.8
4.2
7.2
23.0
23.4
37.7
27.6
12.3
23.0
10.2
22.0
9.7
11.3
24.7
21.1
14.5
8.6
18.1
20.9
17.1
14.4
10.7
18.1
22.2
23.8
16.9
13.7
50.5
10.8
7.3
12.4
16.7
12.3
25.1
25.1
-19.1
6.7
18.2
7.9
18.5
11.2
10.4
7.6
-28.7
26.0
18.4
19.0
26.5
24.8
11.1
23.5
12.1
17.0
9.7
2.1
20.3
17.7
23.0
8.2
19.5
13.2
16.6
17.0
14.7
9.6
22.5
19.5
13.6
13.4
48.6
12.5
8.8
19.4
17.8
14.1
19.9
24.7
-6.4
6.6
15.0
10.2
18.6
9.3
12.1
15.0
-7.5
27.0
20.5
20.9
25.9
22.1
14.5
26.0
13.2
19.5
14.4
4.9
20.4
18.8
30.9
12.2
19.6
16.4
18.1
20.4
20.2
13.8
20.7
21.5
16.1
15.1
46.8
14.6
11.0
25.4
18.6
16.3
35.2
23.9
0.2
10.3
15.3
10.6
19.0
12.4
17.3
23.9
6.4
31.6
Neutral
Neutral
Buy
Buy
Sell
Buy
Neutral
Neutral
Neutral
Buy
Neutral
Buy
Neutral
Neutral
Buy
Buy
Buy
Buy
Buy
Buy
Not Rated
Neutral
496
1,856
1,173
751
364
491
594
874
2,365
145
599
141
2,436
489
620
1,037
4,222
657
851
540
497
1,373
510
1,830
1,605
850
330
555
520
720
2,400
220
775
200
2,500
430
905
1,125
4,850
805
1,300
515
-
1,350
3
-1
37
13
-9
13
-12
-18
1
52
29
42
3
-12
46
9
15
23
53
-5
-2
21.6 19.8
75.7 72.5
58.4 52.8
39.3 44.9
10.2
9.7
14.2 17.5
15.9 21.1
39.9 33.9
72.6 72.6
10.3
2.2
39.3 39.7
7.2
8.0
34.4 46.8
16.1 16.6
37.0 47.1
56.6 41.4
129.1 133.6
14.0 21.1
32.3 47.4
26.1 15.1
13.0 16.1
55.2 53.4
25.5
93.3
64.2
50.0
14.2
23.6
26.0
40.4
119.9
5.6
49.1
11.0
54.9
26.8
56.7
58.0
160.6
30.4
74.8
23.3
18.0
67.3
Buy
Not Rated
Neutral
Buy
Not Rated
Not Rated
170
4,112
1,332
239
116
282
206
-
1,503
277
-
-
21
13
16
9.8
10.3
102.5 129.9
38.0 46.8
6.8
8.4
16.9
8.4
15.9
21.0
12.9
163.2
57.8
11.0
23.9
25.9
Buy
Buy
Neutral
Neutral
Buy
Neutral
Buy
Buy
Buy
Buy
Neutral
Neutral
69
367
83
782
242
103
177
383
1,415
103
24
804
106
450
90
928
302
113
225
469
1,597
130
32
860
54
23
8
19
25
9
27
23
13
26
33
7
1.0
20.4
-9.3
11.4
25.8
7.4
10.7
6.4
20.5
1.2
-1.8
24.9
1.0
23.7
-2.9
12.2
25.6
10.4
12.2
9.3
26.5
3.0
-0.4
28.8
2.4
28.0
0.1
20.6
30.2
11.9
13.4
14.0
43.6
5.9
0.4
36.9
24 October 2017
22

Company
Zee Ent.
Aggregate
Metals
Hindalco
Hind. Zinc
JSPL
JSW Steel
Nalco
NMDC
SAIL
Vedanta
Tata Steel
Aggregate
Oil & Gas
BPCL
GAIL
Gujarat Gas
Gujarat St. Pet.
HPCL
IOC
IGL
MRPL
Oil India
ONGC
PLNG
Reliance Ind.
Aggregate
Retail
Jubilant Food
Titan Co.
Aggregate
Technology
Cyient
HCL Tech.
Hexaware
Infosys
KPIT Tech
L&T Infotech
Mindtree
Mphasis
NIIT Tech
Persistent Sys
Tata Elxsi
TCS
Tech Mah
Wipro
Zensar Tech
Aggregate
Telecom
Bharti Airtel
Bharti Infratel
Idea Cellular
Tata Comm
Aggregate
Utiltites
Reco
Buy
CMP
(INR)
493
TP
% Upside
EPS (INR)
(INR) Downside FY17 FY18E FY19E
630
28
13.9 12.2
17.8
P/E (x)
P/B (x)
ROE (%)
FY17 FY18E FY17 FY18E FY17 FY18E FY19E
35.5 40.5
5.5
5.2
19.3 14.7 18.7
36.9 31.0
4.9
4.5
13.3 14.6 18.1
31.8
16.1
NM
17.5
22.8
12.1
NM
21.7
18.8
24.1
10.6
19.3
56.0
23.7
11.3
9.4
36.7
8.8
17.5
10.4
24.0
19.4
13.9
13.7
14.2
NM
11.7
19.0
9.2
NM
13.0
10.6
15.3
10.4
16.4
28.8
17.3
10.0
7.9
32.5
12.2
11.6
9.6
19.3
16.9
12.3
2.1
4.4
0.5
2.8
1.6
1.7
0.7
2.0
2.2
1.8
3.3
1.9
7.6
2.6
3.5
1.9
7.7
2.3
0.9
1.0
5.1
2.0
1.8
12.7
12.7
12.7
2.9
3.9
5.0
3.1
1.6
5.0
3.3
2.3
2.1
2.7
9.5
5.8
2.5
2.8
2.3
3.9
1.8
4.7
0.5
2.3
1.5
1.6
0.7
1.9
1.9
1.8
2.7
1.8
6.3
2.3
2.8
1.6
6.5
2.0
0.9
1.0
4.3
1.8
1.7
11.6
11.6
11.6
2.6
3.4
4.4
2.8
1.5
3.9
3.2
2.4
2.1
2.6
7.6
6.2
2.2
2.7
2.1
3.9
2.9
5.4
1.9
11.2
3.2
7.4
24.4
-7.9
17.3
7.2
12.8
-6.7
9.7
15.7
7.6
32.4
9.6
14.2
11.6
32.4
21.2
21.0
31.4
5.7
10.1
23.2
11.6
13.2
8.2
20.6
17.2
16.2
27.5
26.5
22.0
14.3
40.4
16.8
13.2
13.7
17.0
37.1
32.6
18.4
16.9
17.2
22.9
14.3
31.8
-5.5
21.6
8.3
15.5
-9.1
15.0
19.1
11.5
28.5
11.3
23.9
14.3
31.0
21.9
21.7
17.3
7.9
10.2
23.9
11.9
13.5
11.1
21.0
18.6
17.4
25.5
25.6
19.6
13.3
33.3
17.2
14.4
15.1
17.9
33.6
30.6
17.9
17.0
14.9
22.9
15.4
37.9
0.6
20.8
10.1
16.2
-5.3
20.3
15.9
14.1
25.2
11.9
27.0
14.1
24.2
17.4
20.4
16.5
8.8
10.5
25.5
12.3
13.1
14.0
22.2
19.6
18.3
24.6
23.1
19.1
14.7
28.3
20.1
16.2
16.4
20.8
32.4
33.5
17.1
16.7
17.9
22.1
1.9
23.2
-32.6
33.1
0.3
Buy
Neutral
Buy
Buy
Neutral
Buy
Sell
Buy
Neutral
272
318
158
260
85
121
59
329
711
308
322
192
298
87
188
30
360
665
13
1
22
15
3
56
-49
9
-7
8.6
19.7
-20.9
14.8
3.7
10.0
-6.2
15.1
37.9
19.8
22.4
-17.4
22.3
4.5
13.1
-7.7
25.4
66.9
24.5
29.3
2.0
25.7
5.8
12.9
-4.2
37.5
63.4
Buy
Sell
Sell
Neutral
Buy
Buy
Neutral
Sell
Buy
Buy
Buy
Buy
511
434
908
208
461
404
1,612
130
338
172
273
938
644
634
712
180
585
559
1,295
112
340
190
275
1,005
26
46
-22
-14
27
38
-20
-14
0
11
1
7
48.3
22.6
16.2
8.8
40.7
43.0
44.0
14.8
19.3
16.4
11.4
48.3
49.2
26.5
31.6
12.1
45.9
51.1
49.6
10.7
29.1
17.8
14.1
55.5
52.0
30.0
44.0
13.3
42.9
46.5
54.8
11.6
34.1
19.2
18.0
64.0
Sell
Neutral
1,547
604
960
590
-38
-2
10.0
9.0
14.8
10.5
20.7
12.6
154.6 104.4
66.9 57.7
73.7 62.3
17.7
15.6
20.7
14.9
10.6
14.5
20.2
17.3
16.1
17.7
30.2
19.4
15.0
17.5
14.4
17.2
15.1
14.7
18.1
15.1
11.7
13.2
17.7
16.7
14.0
15.4
25.1
19.6
13.3
15.5
14.6
17.0
Buy
Neutral
Neutral
Buy
Neutral
Buy
Neutral
Neutral
Neutral
Buy
Buy
Neutral
Buy
Neutral
Buy
544
935
283
940
127
804
503
672
611
667
850
2,586
462
297
751
600
950
250
1,050
140
880
450
610
600
780
996
2,450
490
280
950
10
2
-12
12
10
9
-11
-9
-2
17
17
-5
6
-6
26
30.6 36.0
59.8 63.5
13.7 15.6
62.9 62.3
11.9 10.8
55.5 60.9
24.9 28.4
38.9 40.2
38.0 43.7
37.7 43.3
28.1 33.8
133.4 131.8
30.9 34.8
16.9 19.1
52.1 51.5
41.9
68.9
16.5
66.3
13.6
65.3
32.9
43.0
50.3
52.4
40.2
151.4
37.3
20.1
70.0
Buy
Buy
Buy
Buy
498
449
98
718
470
440
105
775
-6
-2
7
8
11.1
14.9
-1.1
27.2
2.4
17.3
-15.5
8.3
3.2
19.7
-14.9
25.4
44.8 207.6 2.9
30.2 26.0
5.4
NM
NM
1.4
26.4 86.9 12.9
43.6 -271.7 3.0
6.7
1.4
16.2 20.7
-1.6 -25.6
132.2 13.8
6.9
-1.2
24 October 2017
23

Company
Reco
Coal India
Buy
CESC
Buy
JSW Energy
Sell
NTPC
Buy
Power Grid
Buy
Tata Power
Sell
Aggregate
Others
Arvind
Neutral
Avenue Supermarts Sell
Bata India
Under Review
BSE
Neutral
Castrol India
Buy
Century Ply.
Neutral
Coromandel Intl Buy
Delta Corp
Buy
Dynamatic Tech
Buy
Eveready Inds.
Buy
Interglobe
Neutral
Indo Count
Neutral
Info Edge
Buy
Inox Leisure
Sell
Jain Irrigation
Under Review
Just Dial
Neutral
Kaveri Seed
Buy
Kitex Garm.
Buy
Manpasand
Buy
MCX
Buy
Monsanto
Buy
Navneet Education Buy
Quess Corp
Buy
PI Inds.
Buy
Piramal Enterp.
Buy
SRF
Buy
S H Kelkar
Buy
Symphony
Sell
Team Lease Serv. Buy
Trident
Buy
TTK Prestige
Neutral
V-Guard
Neutral
Wonderla
Buy
CMP
(INR)
290
1,024
81
177
213
82
TP
% Upside
EPS (INR)
(INR) Downside FY17 FY18E FY19E
335
16
14.9 17.5
20.7
1,360
33
51.9 88.9
99.3
49
-40
3.8
3.3
2.7
211
19
12.0 13.5
15.7
262
23
14.2 17.4
20.6
71
-13
7.4
7.3
7.3
P/E (x)
P/B (x)
ROE (%)
FY17 FY18E FY17 FY18E FY17 FY18E FY19E
19.4 16.6
7.3
7.0
37.8 42.4 47.7
19.8 11.5
1.3
1.2
6.5
10.6 10.8
21.1 24.2
1.3
1.3
6.3
5.3
4.2
14.8 13.1
1.5
1.4
10.5 11.0 11.9
14.9 12.2
2.3
2.0
16.2 17.3 17.8
11.0 11.3
1.9
1.7
17.1 15.8 14.2
16.5 14.0
2.4
2.2
14.5 15.7 16.8
31.7
147.0
58.8
23.6
27.6
32.0
29.8
77.4
30.6
25.1
26.8
8.6
70.3
68.8
16.9
23.6
29.2
11.6
69.0
44.0
28.0
23.4
82.9
23.3
37.7
19.6
38.6
59.2
42.5
15.0
46.7
54.4
52.7
30.3
94.1
50.6
23.0
29.8
28.3
20.5
41.7
18.3
23.7
21.0
12.6
50.6
28.6
12.3
22.3
16.3
9.7
45.0
41.2
23.0
20.2
43.5
25.6
26.2
21.0
36.8
39.9
44.8
12.0
44.8
43.4
30.9
2.8
18.3
7.7
2.0
31.3
8.7
5.0
5.9
4.2
8.1
11.8
2.6
6.8
4.0
1.4
3.2
3.8
3.1
4.3
4.1
7.9
5.7
11.2
6.6
3.2
3.1
5.0
22.0
7.4
1.8
8.4
13.0
4.8
2.7
16.1
6.9
1.9
28.4
7.1
4.3
4.0
3.4
6.6
6.8
2.1
6.1
3.5
1.4
2.8
4.0
2.5
4.1
4.2
7.1
5.0
4.9
5.5
2.9
2.8
4.5
19.3
6.4
1.6
7.7
10.6
4.3
10.3
17.9
13.9
8.3
115.2
31.1
17.5
8.1
15.1
37.7
51.0
34.8
10.2
5.9
8.6
14.8
13.6
29.8
7.3
10.2
31.5
26.7
19.0
32.8
9.0
16.6
13.7
43.3
19.2
13.0
19.5
27.4
9.5
9.1
18.2
14.4
8.5
99.8
27.7
22.5
12.1
20.7
30.8
41.1
18.6
12.7
12.5
11.7
13.4
23.3
28.6
8.2
10.0
32.5
26.3
15.6
23.4
11.7
13.7
12.9
51.6
15.3
14.5
18.0
26.9
14.8
12.0
22.9
15.8
7.7
95.8
29.6
23.4
12.9
24.3
30.1
46.6
18.3
13.1
16.2
14.8
13.7
27.4
27.6
13.4
15.9
34.5
27.9
15.0
22.9
15.3
16.0
15.2
54.5
19.5
16.1
20.7
28.8
17.5
392
1,128
794
969
377
279
495
236
2,068
323
1,159
112
1,102
229
94
412
556
215
438
1,091
2,412
171
829
778
2,736
1,682
280
1,400
1,650
100
6,170
195
369
376
873
-
1,100
467
323
523
257
3,334
358
1,142
118
1,130
240
-
465
738
394
534
1,300
3,295
209
990
894
3,266
1,751
298
1,288
1,990
114
5,281
167
393
-4
-23
14
24
16
6
9
61
11
-1
5
3
5
13
33
83
22
19
37
23
19
15
19
4
7
-8
21
15
-14
-14
7
12.4
7.7
13.5
41.0
13.6
8.7
16.6
3.1
67.6
12.9
43.2
13.0
15.7
3.3
5.5
17.5
19.1
18.6
6.3
24.8
86.2
7.3
10.0
33.4
72.6
85.9
7.2
23.7
38.8
6.6
132.1
3.6
7.0
12.9
12.0
15.7
42.2
12.6
9.8
24.1
5.7
112.9
13.6
55.2
8.9
21.8
8.0
7.6
18.5
34.1
22.1
9.7
26.5
105.0
8.4
19.1
30.4
104.6
80.2
7.6
35.1
36.8
8.3
137.8
4.5
11.9
18.6
17.5
19.4
44.6
13.3
12.9
29.0
8.0
166.7
16.3
81.6
10.8
24.7
12.0
10.0
21.1
41.0
26.2
15.3
43.4
126.6
10.4
27.8
35.8
149.7
103.0
9.9
42.9
56.0
10.4
176.1
6.0
16.0
24 October 2017
24

MOSL Universe stock performance
Company
Automobiles
Amara Raja
Ashok Ley.
Bajaj Auto
Bharat Forge
Bosch
CEAT
Eicher Mot.
Endurance Tech.
Escorts
Exide Ind
Hero Moto
M&M
Mahindra CIE
Maruti Suzuki
Tata Motors
TVS Motor
Banks - Private
Axis Bank
DCB Bank
Equitas Hold.
Federal Bank
HDFC Bank
ICICI Bank
IDFC Bank
IndusInd
J&K Bank
Kotak Mah. Bk
RBL Bank
South Indian
Yes Bank
Banks - PSU
BOB
BOI
Canara
IDBI Bk
Indian Bk
OBC
PNB
SBI
Union Bk
NBFCs
Bajaj Fin.
Bharat Fin.
Capital First
Cholaman.Inv.&Fn
Dewan Hsg.
GRUH Fin.
HDFC
Indiabulls Hsg
L&T Fin.Holdings
LIC Hsg Fin
Manappuram
M&M Fin.
Muthoot Fin
PNB Housing
PFC
Repco Home
REC
STF
Shriram City Union
1 Day (%)
1.5
-0.5
0.0
1.7
-1.7
-1.9
-1.1
-2.5
0.5
-0.7
1.4
-0.5
1.4
1.1
-1.2
0.0
-2.3
2.0
-0.7
0.0
0.7
1.8
0.1
0.1
-1.3
-1.6
1.1
-0.6
-1.1
2.1
0.4
1.3
0.0
1.8
0.7
1.0
1.3
0.4
-0.7
-0.2
-1.3
2.4
-2.1
-1.9
-1.5
-1.4
2.3
-1.4
-0.9
-0.2
-0.1
-1.8
1.7
0.7
-0.5
2.3
2.2
1M (%)
-9.8
12.3
5.8
4.2
-1.1
-2.9
-1.2
5.8
13.9
-1.5
0.1
6.3
0.0
-3.2
2.7
8.1
-10.9
-1.2
-2.3
9.6
2.1
-5.3
-2.1
-0.7
-4.1
3.8
2.3
8.9
-1.8
-2.8
-7.2
-6.2
-4.1
-2.7
-11.2
-5.0
-6.2
-2.6
-1.4
7.7
-4.0
0.2
2.6
-7.2
-3.5
8.1
3.5
2.3
2.4
3.0
2.0
-6.6
5.2
5.7
-4.2
11.3
2.3
12M (%)
-32.3
47.9
14.9
43.5
-5.8
27.9
24.0
72.1
82.6
1.2
12.8
3.0
22.8
38.4
-22.4
73.3
-14.6
42.1
-17.1
70.2
46.6
4.0
-26.4
38.9
4.1
36.0
61.0
46.2
34.4
-11.8
19.1
-1.6
-32.3
17.6
-13.6
-11.3
-4.9
-13.9
61.7
10.4
-2.6
-5.0
75.6
48.6
28.8
53.2
105.2
8.8
2.3
16.5
43.8
3.9
-17.3
12.4
-3.5
-7.2
Company
Capital Goods
ABB
Bharat Elec.
BHEL
Blue Star
CG Cons. Elec.
CG Power & Inds Sol.
Cummins
GE T&D
Havells
K E C Intl
L&T
Pennar Eng.
Siemens
Solar Ind
Suzlon Energy
Thermax
Va Tech Wab.
Voltas
Cement
Ambuja Cem.
ACC
Birla Corp.
Dalmia Bharat
Grasim Inds.
India Cem
J K Cements
JK Lakshmi Ce
Ramco Cem
Orient Cem
Prism Cem
Shree Cem
Ultratech
Consumer
Asian Paints
Britannia
Colgate
Dabur
Emami
Godrej Cons.
GSK Cons.
HUL
ITC
Jyothy Lab
Marico
Nestle
Page Inds
Parag Milk
Pidilite Ind.
P&G Hygiene
Prabhat Dairy
United Brew
United Spirits
Healthcare
Alembic Phar
Alkem Lab
Ajanta Pharma
Aurobindo
Biocon
Cadila
Cipla
1 Day (%)
-0.6
1.2
2.3
0.4
2.9
-1.2
0.8
0.3
-1.0
-1.1
-0.5
-4.1
-1.5
-1.7
-0.3
0.0
-0.1
1.7
2.4
0.8
-1.2
1.1
4.5
1.7
-1.7
1.7
1.0
0.6
2.8
4.4
4.6
-0.7
0.4
1.4
-0.3
-1.2
-2.2
-1.0
-0.8
-1.1
-1.3
0.5
0.1
3.7
0.5
-0.1
-1.2
-1.5
0.0
1.0
-0.9
1.0
-2.0
-0.4
-3.5
0.1
-2.4
1M (%)
-6.5
5.9
0.3
7.8
5.0
1.9
0.4
-2.7
9.7
-2.9
-4.2
7.7
-11.4
7.6
-5.5
11.3
-3.2
5.6
4.9
5.3
9.1
2.5
0.5
3.0
0.3
0.9
-1.5
0.2
6.2
7.3
5.4
-3.5
9.5
-3.5
4.0
2.4
2.6
-0.6
0.7
-0.6
1.0
-1.2
1.1
3.1
15.4
-1.6
3.2
11.9
3.6
1.3
1.5
3.1
-3.3
3.7
2.4
0.4
1.7
12M (%)
18.6
51.3
-8.2
48.8
21.1
5.5
5.7
9.0
31.4
135.3
12.7
-40.0
-1.6
49.5
4.0
11.6
17.9
37.9
13.7
14.0
37.5
41.6
45.6
16.9
0.4
-18.0
11.6
-11.5
4.9
10.6
5.7
1.6
41.1
11.4
11.6
-0.6
15.5
-19.2
46.7
11.2
7.8
11.3
5.7
19.2
-14.3
12.2
22.6
18.3
-8.5
4.6
-26.6
12.1
-40.7
-8.9
8.4
25.4
1.9
24 October 2017
25

Company
Divis Lab
Dr Reddy’s
Fortis Health
Glenmark
Granules
GSK Pharma
IPCA Labs
Jubilant Life
Lupin
Sanofi India
Shilpa Medicare
Strides Shasun
Sun Pharma
Syngene Intl
Torrent Pharma
Logistics
Allcargo Logistics
Blue Dart
Concor
Gateway Distriparks
Gati
Transport Corp.
Media
Dish TV
D B Corp
Den Net.
Ent.Network
Hind. Media
HT Media
Jagran Prak.
Music Broadcast
PVR
Prime Focus
Siti Net.
Sun TV
Zee Ent.
Metals
Hindalco
Hind. Zinc
JSPL
JSW Steel
Nalco
NMDC
SAIL
Vedanta
Tata Steel
Oil & Gas
BPCL
GAIL
Gujarat Gas
Gujarat St. Pet.
HPCL
IOC
IGL
MRPL
Oil India
ONGC
PLNG
Reliance Ind.
Retail
Jubilant Food
Titan Co.
1 Day (%)
-0.6
-0.3
-0.7
-1.8
-1.8
0.1
-1.4
-2.8
-1.5
1.5
-1.7
-2.0
0.9
-1.4
1.2
0.6
0.2
1.0
0.5
0.9
0.7
-3.4
-0.4
-0.6
2.0
-1.4
0.7
0.1
0.3
3.6
-4.8
-2.2
-0.2
0.5
-0.6
-1.4
-1.4
2.1
-0.8
-1.7
0.1
0.4
1.0
0.5
0.3
-1.4
2.5
0.0
-1.5
3.5
0.2
-0.7
-0.3
3.6
3.0
1.0
-0.5
1M (%)
-9.8
-3.7
-3.7
-4.7
15.1
0.3
-6.4
-6.4
2.3
5.1
12.8
-10.3
5.3
1.9
8.7
-1.6
-1.8
2.0
5.5
3.3
3.5
-8.1
-0.7
-6.0
-4.9
-8.9
5.0
-1.2
-0.8
16.0
7.3
-4.8
-1.8
-5.5
17.8
8.6
13.2
5.1
11.5
-1.4
2.2
6.8
8.7
3.9
9.4
9.0
6.1
5.0
-1.1
12.2
1.5
2.9
4.3
21.2
14.8
12.4
0.4
12M (%)
-31.2
-23.9
-18.0
-35.8
14.7
-17.7
-22.5
-9.5
-30.8
-2.3
8.9
-14.7
-27.7
-9.1
-13.4
-4.7
-18.7
23.1
-5.3
-15.1
56.3
-28.1
-7.6
13.5
-3.3
-19.4
12.3
-13.6
15.3
41.0
-29.6
51.0
-5.5
79.3
27.6
106.9
49.7
65.7
-2.6
17.6
61.8
66.5
14.7
31.5
55.2
30.7
53.7
24.6
86.6
45.1
8.9
-8.1
40.4
76.3
40.7
59.2
Company
Technology
Cyient
HCL Tech.
Hexaware
Infosys
KPIT Tech
L&T Infotech
Mindtree
Mphasis
NIIT Tech
Persistent Sys
Tata Elxsi
TCS
Tech Mah
Wipro
Zensar Tech
Telecom
Bharti Airtel
Bharti Infratel
Idea Cellular
Tata Comm
Utiltites
Coal India
CESC
JSW Energy
NTPC
Power Grid
Tata Power
Others
Arvind
Avenue Super.
Bata India
BSE
Castrol India
Century Ply.
Coromandel Intl
Delta Corp
Dynamatic Tech
Eveready Inds.
Interglobe
Indo Count
Info Edge
Inox Leisure
Jain Irrigation
Just Dial
Kaveri Seed
Kitex Garm.
Manpasand
MCX
Monsanto
Navneet Educat.
PI Inds.
Piramal Enterp.
Quess Corp
SRF
S H Kelkar
Symphony
Team Lease Serv.
Trident
TTK Prestige
V-Guard
Wonderla
1 Day (%)
-1.1
1.5
0.7
1.4
0.2
-0.9
1.0
3.2
-0.2
0.2
1.4
0.2
0.8
1.6
0.3
5.0
-2.5
7.7
2.4
1.3
-0.7
0.1
0.9
1.0
0.0
-0.3
-3.4
0.2
-0.4
-0.3
-0.7
4.3
3.8
-0.3
-1.5
0.5
-1.8
-1.0
0.1
0.2
-0.9
-0.1
-2.0
-3.2
-0.5
-1.0
1.2
-0.5
-1.3
-1.4
2.0
0.6
-2.5
2.6
-0.6
0.9
2.3
1.3
1M (%)
6.3
5.7
5.6
4.6
6.7
3.1
8.6
9.4
17.7
4.0
0.4
3.3
0.8
0.9
0.1
25.9
15.2
25.5
5.5
14.2
1.1
10.6
6.3
1.4
1.6
3.4
8.8
9.6
-3.1
0.5
12.5
13.6
20.2
-4.5
8.3
4.3
4.7
4.0
-0.8
-5.9
6.6
4.7
-1.6
-9.6
0.8
-2.5
1.4
2.4
-0.4
0.7
9.2
8.6
0.5
3.8
2.4
-2.2
3.2
4.8
12M (%)
7.3
12.5
44.0
-9.5
-9.4
29.4
5.0
30.0
43.0
-1.6
26.6
6.5
6.5
18.8
-24.1
60.8
23.8
22.7
5.8
-7.5
66.5
14.2
18.2
20.7
-2.2
11.8
61.3
-19.3
10.5
78.5
32.2
-37.5
27.3
23.9
-27.7
22.6
-15.7
-9.9
-8.2
27.3
-38.9
21.5
-15.8
2.0
69.4
-3.9
47.7
32.4
-11.9
-7.5
19.1
63.2
65.8
10.4
46.9
-9.5
24 October 2017
26

THEMATIC/STRATEGY RESEARCH GALLERY

REPORT GALLERY
RECENT INITIATING COVERAGE REPORTS
Rs

DIFFERENTIATED PRODUCT GALLERY

Disclosures:
The following Disclosures are being made in compliance with the SEBI Research Analyst Regulations 2014 (herein after referred to as the Regulations).
Motilal Oswal Securities Ltd. (MOSL) is a SEBI Registered Research Analyst having registration no. INH000000412. MOSL, the Research Entity (RE) as defined in the Regulations, is engaged in the business of providing Stock
broking services, Investment Advisory Services, Depository participant services & distribution of various financial products. MOSL is a subsidiary company of Motilal Oswal Financial Service Ltd. (MOFSL). MOFSL is a listed
public company, the details in respect of which are available on
www.motilaloswal.com.
MOSL is registered with the Securities & Exchange Board of India (SEBI) and is a registered Trading Member with National Stock
Exchange of India Ltd. (NSE) and Bombay Stock Exchange Limited (BSE), Metropolitan Stock Exchange Of India Ltd. (MSE) for its stock broking activities & is Depository participant with Central Depository Services Limited
(CDSL) & National Securities Depository Limited (NSDL) and is member of Association of Mutual Funds of India (AMFI) for distribution of financial products. Details of associate entities of Motilal Oswal Securities Limited are
available on the website at
http://onlinereports.motilaloswal.com/Dormant/documents/Associate%20Details.pdf
Pending Regulatory Enquiries against Motilal Oswal Securities Limited by SEBI:
SEBI pursuant to a complaint from client Shri C.R. Mohanraj alleging unauthorized trading, issued a letter dated 29th April 2014 to MOSL notifying appointment of an Adjudicating Officer as per SEBI regulations to hold
inquiry and adjudge violation of SEBI Regulations; MOSL requested SEBI to provide all documents, records, investigation report relied upon by SEBI which were referred in Show Cause Notice and also sought personal
hearing. The matter is currently pending.
MOSL, it’s associates, Research Analyst or their relative may have any financial interest in the subject company. MOSL and/or its associates and/or Research Analyst may have beneficial ownership of 1% or more securities in
the subject company at the end of the month immediately preceding the date of publication of the Research Report.
MOSL and its associate company(ies), their directors and Research Analyst and their relatives may; (a) from
time to time, have a long or short position in, act as principal in, and buy or sell the securities or derivatives thereof of companies mentioned herein. (b) be engaged in any other transaction involving such securities and earn
brokerage or other compensation or act as a market maker in the financial instruments of the company(ies) discussed herein or act as an advisor or lender/borrower to such company(ies) or may have any other potential
conflict of interests with respect to any recommendation and other related information and opinions.; however the same shall have no bearing whatsoever on the specific recommendations made by the analyst(s), as the
recommendations made by the analyst(s) are completely independent of the views of the associates of MOSL even though there might exist an inherent conflict of interest in some of the stocks mentioned in the research
report.
Research Analyst may have served as director/officer, etc. in the subject company in the last 12 month period. MOSL and/or its associates may have received any compensation from the subject company in the past
12 months.
In the last 12 months period ending on the last day of the month immediately preceding the date of publication of this research report, MOSL or any of its associates may have:
n
n
n
n
managed or co-managed public offering of securities from subject company of this research report,
received compensation for investment banking or merchant banking or brokerage services from subject company of this research report,
received compensation for products or services other than investment banking or merchant banking or brokerage services from the subject company of this research report.
Subject Company may have been a client of MOSL or its associates during twelve months preceding the date of distribution of the research report.
MOSL and it’s associates have not received any compensation or other benefits from the subject company or third party in connection with the research report. To enhance transparency, MOSL has incorporated a Disclosure
of Interest Statement in this document. This should, however, not be treated as endorsement of the views expressed in the report. MOSL and / or its affiliates do and seek to do business including investment banking with
companies covered in its research reports. As a result, the recipients of this report should be aware that MOSL may have a potential conflict of interest that may affect the objectivity of this report. Compensation of Research
Analysts is not based on any specific merchant banking, investment banking or brokerage service transactions.
Terms & Conditions:
This report has been prepared by MOSL and is meant for sole use by the recipient and not for circulation. The report and information contained herein is strictly confidential and may not be altered in any way, transmitted to,
copied or distributed, in part or in whole, to any other person or to the media or reproduced in any form, without prior written consent of MOSL. The report is based on the facts, figures and information that are considered
true, correct, reliable and accurate. The intent of this report is not recommendatory in nature. The information is obtained from publicly available media or other sources believed to be reliable. Such information has not
been independently verified and no guaranty, representation of warranty, express or implied, is made as to its accuracy, completeness or correctness. All such information and opinions are subject to change without notice.
The report is prepared solely for informational purpose and does not constitute an offer document or solicitation of offer to buy or sell or subscribe for securities or other financial instruments for the clients. Though
disseminated to all the customers simultaneously, not all customers may receive this report at the same time. MOSL will not treat recipients as customers by virtue of their receiving this report.
Analyst Certification
The views expressed in this research report accurately reflect the personal views of the analyst(s) about the subject securities or issues, and no part of the compensation of the research analyst(s) was, is, or will be directly or
indirectly related to the specific recommendations and views expressed by research analyst(s) in this report.
Disclosure of Interest Statement
§
Analyst ownership of the stock
Companies where there is interest
No
A graph of daily closing prices of securities is available at
www.nseindia.com, www.bseindia.com.
Research Analyst views on Subject Company may vary based on Fundamental research and Technical Research. Proprietary
trading desk of MOSL or its associates maintains arm’s length distance with Research Team as all the activities are segregated from MOSL research activity and therefore it can have an independent view with regards to
subject company for which Research Team have expressed their views.
Regional Disclosures (outside India)
This report is not directed or intended for distribution to or use by any person or entity resident in a state, country or any jurisdiction, where such distribution, publication, availability or use would be contrary to law,
regulation or which would subject MOSL & its group companies to registration or licensing requirements within such jurisdictions.
For Hong Kong:
This report is distributed in Hong Kong by Motilal Oswal capital Markets (Hong Kong) Private Limited, a licensed corporation (CE AYY-301) licensed and regulated by the Hong Kong Securities and Futures Commission (SFC)
pursuant to the Securities and Futures Ordinance (Chapter 571 of the Laws of Hong Kong) “SFO”. As per SEBI (Research Analyst Regulations) 2014 Motilal Oswal Securities (SEBI Reg No. INH000000412) has an agreement with
Motilal Oswal capital Markets (Hong Kong) Private Limited for distribution of research report in Hong Kong. This report is intended for distribution only to “Professional Investors” as defined in Part I of Schedule 1 to SFO. Any
investment or investment activity to which this document relates is only available to professional investor and will be engaged only with professional investors.” Nothing here is an offer or solicitation of these securities,
products and services in any jurisdiction where their offer or sale is not qualified or exempt from registration. The Indian Analyst(s) who compile this report is/are not located in Hong Kong & are not conducting Research
Analysis in Hong Kong.
For U.S.
Motilal Oswal Securities Limited (MOSL) is not a registered broker - dealer under the U.S. Securities Exchange Act of 1934, as amended (the"1934 act") and under applicable state laws in the United States. In addition MOSL is
not a registered investment adviser under the U.S. Investment Advisers Act of 1940, as amended (the "Advisers Act" and together with the 1934 Act, the "Acts), and under applicable state laws in the United States.
Accordingly, in the absence of specific exemption under the Acts, any brokerage and investment services provided by MOSL, including the products and services described herein are not available to or intended for U.S.
persons. This report is intended for distribution only to "Major Institutional Investors" as defined by Rule 15a-6(b)(4) of the Exchange Act and interpretations thereof by SEC (henceforth referred to as "major institutional
investors"). This document must not be acted on or relied on by persons who are not major institutional investors. Any investment or investment activity to which this document relates is only available to major institutional
investors and will be engaged in only with major institutional investors. In reliance on the exemption from registration provided by Rule 15a-6 of the U.S. Securities Exchange Act of 1934, as amended (the "Exchange Act") and
interpretations thereof by the U.S. Securities and Exchange Commission ("SEC") in order to conduct business with Institutional Investors based in the U.S., MOSL has entered into a chaperoning agreement with a U.S.
registered broker-dealer, Motilal Oswal Securities International Private Limited. ("MOSIPL"). Any business interaction pursuant to this report will have to be executed within the provisions of this chaperoning agreement.
The Research Analysts contributing to the report may not be registered /qualified as research analyst with FINRA. Such research analyst may not be associated persons of the U.S. registered broker-dealer, MOSIPL, and
therefore, may not be subject to NASD rule 2711 and NYSE Rule 472 restrictions on communication with a subject company, public appearances and trading securities held by a research analyst account.
For Singapore
Motilal Oswal Capital Markets Singapore Pte Limited is acting as an exempt financial advisor under section 23(1)(f) of the Financial Advisers Act(FAA) read with regulation 17(1)(d) of the Financial Advisors Regulations and is a
subsidiary of Motilal Oswal Securities Limited in India. This research is distributed in Singapore by Motilal Oswal Capital Markets Singapore Pte Limited and it is only directed in Singapore to accredited investors, as defined in
the Financial Advisers Regulations and the Securities and Futures Act (Chapter 289), as amended from time to time. In respect of any matter arising from or in connection with the research you could contact the following
representatives of Motilal Oswal Capital Markets Singapore Pte Limited:
Disclaimer:
The report and information contained herein is strictly confidential and meant solely for the selected recipient and may not be altered in any way, transmitted to, copied or distributed, in part or in whole, to any other person
or to the media or reproduced in any form, without prior written consent. This report and information herein is solely for informational purpose and may not be used or considered as an offer document or solicitation of
offer to buy or sell or subscribe for securities or other financial instruments. Nothing in this report constitutes investment, legal, accounting and tax advice or a representation that any investment or strategy is suitable or
appropriate to your specific circumstances. The securities discussed and opinions expressed in this report may not be suitable for all investors, who must make their own investment decisions, based on their own investment
objectives, financial positions and needs of specific recipient. This may not be taken in substitution for the exercise of independent judgment by any recipient. Each recipient of this document should make such investigations
as it deems necessary to arrive at an independent evaluation of an investment in the securities of companies referred to in this document (including the merits and risks involved), and should consult its own advisors to
determine the merits and risks of such an investment. The investment discussed or views expressed may not be suitable for all investors. Certain transactions -including those involving futures, options, another derivative
products as well as non-investment grade securities - involve substantial risk and are not suitable for all investors. No representation or warranty, express or implied, is made as to the accuracy, completeness or fairness of
the information and opinions contained in this document. The Disclosures of Interest Statement incorporated in this document is provided solely to enhance the transparency and should not be treated as endorsement of the
views expressed in the report. This information is subject to change without any prior notice. The Company reserves the right to make modifications and alternations to this statement as may be required from time to time
without any prior approval. MOSL, its associates, their directors and the employees may from time to time, effect or have effected an own account transaction in, or deal as principal or agent in or for the securities
mentioned in this document. They may perform or seek to perform investment banking or other services for, or solicit investment banking or other business from, any company referred to in this report. Each of these entities
functions as a separate, distinct and independent of each other. The recipient should take this into account before interpreting the document. This report has been prepared on the basis of information that is already
available in publicly accessible media or developed through analysis of MOSL. The views expressed are those of the analyst, and the Company may or may not subscribe to all the views expressed therein. This document is
being supplied to you solely for your information and may not be reproduced, redistributed or passed on, directly or indirectly, to any other person or published, copied, in whole or in part, for any purpose. This report is not
directed or intended for distribution to, or use by, any person or entity who is a citizen or resident of or located in any locality, state, country or other jurisdiction, where such distribution, publication, availability or use would
be contrary to law, regulation or which would subject MOSL to any registration or licensing requirement within such jurisdiction. The securities described herein may or may not be eligible for sale in all jurisdictions or to
certain category of investors. Persons in whose possession this document may come are required to inform themselves of and to observe such restriction. Neither the Firm, not its directors, employees, agents or
representatives shall be liable for any damages whether direct or indirect, incidental, special or consequential including lost revenue or lost profits that may arise from or in connection with the use of the information.
The
person accessing this information specifically agrees to exempt MOSL or any of its affiliates or employees from, any and all responsibility/liability arising from such misuse and agrees not to hold MOSL or any of its affiliates or
employees responsible for any such misuse and further agrees to hold MOSL or any of its affiliates or employees free and harmless from all losses, costs, damages, expenses that may be suffered by the person accessing this
information due to any errors and delays.
Registered Office Address: Motilal Oswal Tower, Rahimtullah Sayani Road, Opposite Parel ST Depot, Prabhadevi, Mumbai-400025; Tel No.: 022-3980 4263; www.motilaloswal.com. Correspondence Address: Palm Spring
Centre, 2nd Floor, Palm Court Complex, New Link Road, Malad (West), Mumbai- 400 064. Tel No: 022 3080 1000. Compliance Officer: Neeraj Agarwal, Email Id:
na@motilaloswal.com,
Contact No.:022-30801085.
Registration details of group entities.: MOSL: NSE (Cash): INB231041238; NSE (F&O): INF231041238; NSE (CD): INE231041238; BSE (Cash): INB011041257; BSE(F&O): INF011041257; BSE(CD); MSE(Cash): INB261041231;
MSE(F&O): INF261041231; MSE(CD): INE261041231; CDSL: IN-DP-16-2015; NSDL: IN-DP-NSDL-152-2000; Research Analyst: INH000000412. AMFI: ARN 17397. Investment Adviser: INA000007100. Motilal Oswal Asset
Management Company Ltd. (MOAMC): PMS (Registration No.: INP000000670) offers PMS and Mutual Funds products. Motilal Oswal Wealth Management Ltd. (MOWML): PMS (Registration No.: INP000004409) offers wealth
management solutions. *Motilal Oswal Securities Ltd. is a distributor of Mutual Funds, PMS, Fixed Deposit, Bond, NCDs, Insurance and IPO products. * Motilal Oswal Commodities Broker Pvt. Ltd. offers Commodities
Products. * Motilal Oswal Real Estate Investment Advisors II Pvt. Ltd. offers Real Estate products. * Motilal Oswal Private Equity Investment Advisors Pvt. Ltd. offers Private Equity products
13 December 2016
29