Indiabulls Housing Finance
BSE SENSEX
32,507
Bloomberg
Equity Shares (m)
M.Cap.(INRb)/(USDb)
52-Week Range (INR)
1, 6, 12 Rel. Per (%)
Avg Val, INRm
Free float (%)
S&P CNX
10,185
IHFL IN
421.3
486.6/7.6
1375 / 616
6/24/37
1872
76.4
23 October 2017
2QFY18 Results Update | Sector: Financials
CMP: INR1,343
TP: INR1,550 (+15%)
Buy
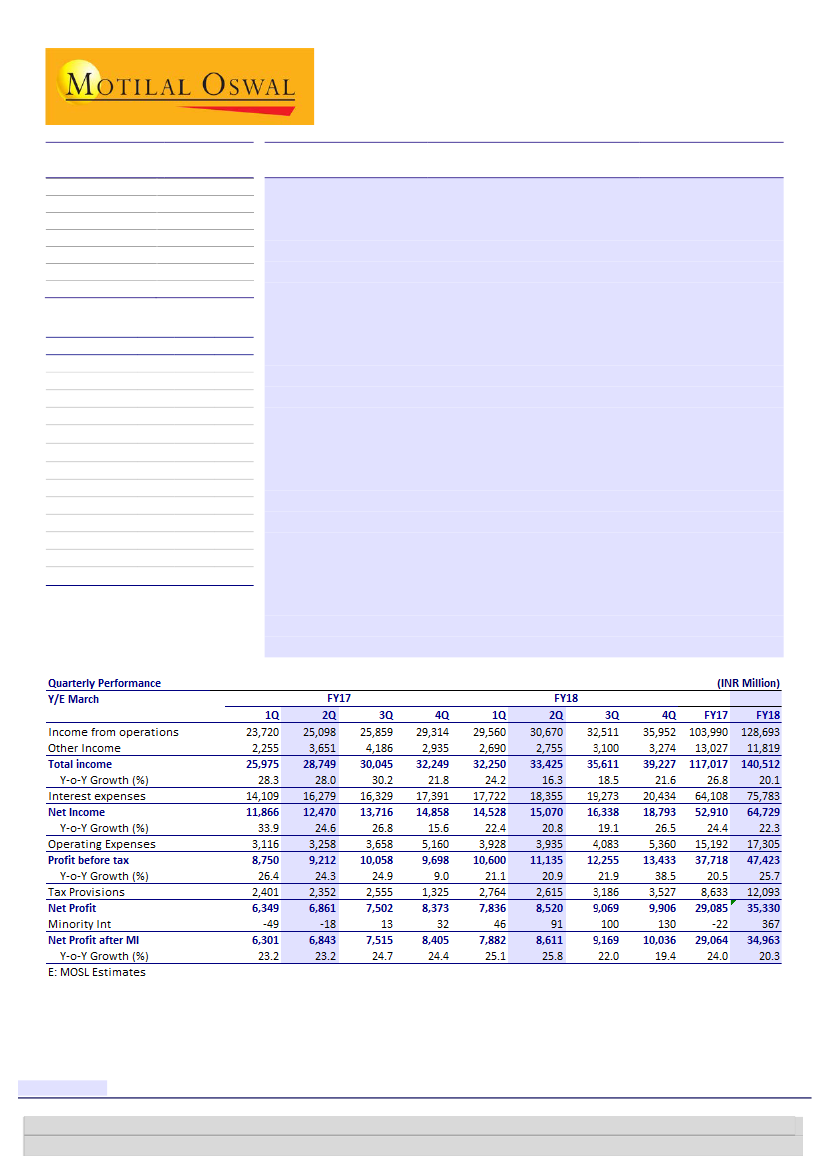
Strong growth, stable performance overall
Indiabulls Housing Finance's (IHFL) PAT grew 26% YoY to INR8.6b (4% above
our estimate). Core operating performance was robust, with strong AUM
growth (+33% YoY) and stable spreads. However, other income (income from
the liquid investment book) remains subdued due to lower incremental yields.
Note that IHFL had generated a good spread on its investment book above cost
of funds in FY16 and FY17 - that is beginning to vanish now.
AUM growth was in line with trend at 33% YoY to reach INR1t. This was driven
by 36% YoY growth in disbursements to INR95b. Management is bullish on
pick-up in supply in the affordable housing space.
Despite competitive pressures, IHFL managed to hold spreads steady at 3.25%.
Management continues to guide for incremental spreads in the range of 2.75-
3% and book spreads of 3-3.25%. Incremental cost of funds is around 7.3-7.5%.
The share of home loans in the overall book inched up 100bp to 58%. With the
share continuously inching up (to the target of 66% by FY20), we believe spread
pressure will continue.
Valuation and view:
IHFL's transformation from a diversified lender to a
focused mortgage player has yielded returns, with RoE/RoA improving from
3%/0.8% in FY09 to 26%/3.4% in FY17. Focus on core mortgage loans and
market share gains should drive AUM growth of 25%+ over the next three
years. IHFL is among the lowest-levered HFCs. Asset quality trend is likely to
remain stable. We keep our EPS estimates largely unchanged. Maintain
Buy
with a TP of INR1,550 (4x Sep19E P/B).
Financials & Valuations (INR b)
Y/E March
2017 2018E 2019E
Net Fin inc
35.3 52.9 65.9
PPP
45.5 55.9 71.0
EPS (INR)
68.6 83.6 105.1
EPS Gr. (%)
23.2 21.9 25.8
BV/Sh. (INR)
286
321
364
RoA on AUM (%)
3.1
2.9
2.8
RoE (%)
25.5 27.6 30.7
Payout (%)
39.3 50.0 50.0
Valuations
P/E (x)
19.6 16.1 12.8
P/BV (x)
4.7
4.2
3.7
P/ABV (x)
4.7
4.2
3.7
Div. Yield (%)
2.0
3.1
3.9
Research Analyst: Alpesh Mehta
(Alpesh.Mehta@MotilalOswal.com); +91 22 3982 5415
| Piran Engineer
(Piran.Engineer@MotilalOswal.com); +91 22 3980 4393
Nitin Aggarwal
(Nitin.Aggarwal@MotilalOswal.com); +91 22 3982 5540
| Anirvan Sarkar
(Anirvan.Sarkar@MotilalOswal.com); +91 22 3982 5505
Investors are advised to refer through important disclosures made at the last page of the Research Report.
Motilal Oswal research is available on www.motilaloswal.com/Institutional-Equities, Bloomberg, Thomson Reuters, Factset and S&P Capital.

Indiabulls Housing Finance
Exhibit 1: Quarterly performance v/s expectations and deviations for the same
Particulars
Income from operations
Other Income
Total income
Interest expenses
Net Income
Operating Expenses
Profit before Tax
Tax Provisions
Net Profit
Minority Int
Net Profit (after minority interest)
Int Exp/ operating inc (%)
Other Income / Total Income (%)
Tax Rate (%)
E: MOSt Estimates
2QFY18A
30,670
2,755
33,425
18,355
15,070
3,935
11,135
2,615
8,520
91
8,611
59.8
8.2
23.5
2QFY18E
30,151
3,200
33,351
18,342
15,009
3,843
11,166
2,903
8,263
40
8,303
60.8
9.6
26.0
Var. (%)
2
-14
0
0
0
2
0
-10
3
128
4
Comments
In-line
In-line
In-line
Lower-than-estimated
In-line
Marginally above estimate
AUM growth was robust at
33% YoY
Continued robust AUM growth at 33% YoY
Disbursements were up 36% YoY to INR95b, manifesting AUM growth of 33%
YoY to INR1t.
Share of home loans increased 100bp to 58%.
Management has guided for
incremental spreads of 275-
300bp
Reported spreads stable
Calculated yield on AUM declined 170bp YoY and 10bp QoQ to 13.2%, driven by
yields pressure as well as migration to retail home loans.
Yet, reported spreads remained largely stable at 3.25%.
Incremental cost of funds declined 53bp QoQ to 7.3%.
Incremental yields for different segments in 1QFY18 were: Home Loan – 9.6%;
LAP – 13%; Construction finance – 16%
Asset quality stable
Asset quality was stable, with GNPL ratio at 0.78% v/s 0.83% in 2QFY17.
Provisions made during the quarter amounted to INR1.87b, as against INR1.45b
in 2QFY17.
Others
In Oct 2017, Oak North Bank raised an investment of USD203m at a valuation of
USD1.27b (280% more than at the time of IHFL’s investment in Oak North Bank).
IHFL seems adequately equipped to gain market share from PSU banks, given its
low cost structure. We think IHFL will gain meaningfully from the government’s
impetus to affordable housing.
We believe the focus on mortgage and market share gains will drive AUM
growth of 25%+ for the next three years. As individual home loans have lower
risk weight than corporate loans, capital consumption will be lower with gradual
shift toward individual home loans. At the same time, increased sell-downs will
also help improve return ratios.
IHFL has consistently outperformed peers on key parameters. Average three-
year RoE at 26% is the best among the peer group. The company offers superior
return ratios with ~3% dividend yield.
Valuation and view
23 October 2017
2

Indiabulls Housing Finance
We keep our estimates largely unchanged. We use RI model with Rf of 7%, CoE
of 14% and terminal growth rate of 5%. Maintain
Buy
with a target price of
INR1,550 (4x Sep 2019E P/B).
Exhibit 2: We marginally cut our estimates
INR B
Net Financing income
Other Income
Net Income
Opex
PBT
Tax
PAT
AUM
Loans
Borrowings
Credit Cost
RoA on AUM
FY18
51.9
13.0
64.9
8.7
47.8
12.4
35.5
1,194
1,075
1,101
0.80
2.9
Old Est
FY19
64.0
16.9
81.0
10.1
60.0
15.6
44.5
1,536
1,382
1,423
0.80
2.9
FY20
80.6
22.0
102.7
11.7
77.1
20.0
57.2
1,938
1,744
1,805
0.80
2.9
FY18
52.9
11.8
64.7
8.9
47.4
12.1
35.4
1,194
1,075
1,128
0.80
2.9
New Est
FY19
65.9
15.4
81.2
10.3
60.1
15.6
44.6
1,536
1,382
1,465
0.80
2.8
FY20
80.7
20.0
100.7
11.9
74.9
19.5
55.6
1,938
1,744
1,866
0.80
2.8
FY18
2.0
-9.3
-0.3
1.8
-0.7
-2.6
-0.1
0.0
0.0
2.4
% Change
FY19
2.9
-9.3
0.3
1.7
0.2
0.2
0.2
0.0
0.0
2.9
FY20
0.1
-9.3
-1.9
1.7
-2.8
-2.8
-2.8
0.0
0.0
3.4
Source: Company, MOSL
Conference call highlights
Business updates
Management has guided for 30% AUM growth for FY18. AUM is likely to reach
~INR2t by FY20.
Reiterated guidance of 66% share of retail home loans by FY20 (currently 58%).
Incremental spreads = 2.99% (compared to guided range of 2.75-3%).
Presently, 70% HLs are sourced from top-20 cities. In next two years, half of the
home loan sourcing will come from the non-Top 10 cities.
Management targets INR75b worth of insurance premiums sold in FY18. Hence,
fee income growth to be more than loan book growth.
Disbursements in 2QFY18 – Total: INR95b; HL: INR58b, LAP: INR18b, Corp:
INR19b.
According to management, IHFL would be raising bonds at 10-50bp higher than
AAA rated entities like HDFC and LICHF. About 12 months back, it was 40-110bp
higher.
INR60b worth of liabilities will come up for refinancing in 2HFY18. Incremental
cost of funds likely to be around 7.3-7.5% in 2HFY18.
Fee income in 2QFY18 – INR1.85b.
HL book breakup – New construction – 70-75%; Self-construction – 10%; Resale
– 5%; Balance transfer 5%.
On-book yields: HL – 9.63%, LAP – 11%, CF – 16%, LRD – 11%.
Asset Quality
Provisions made during the quarter – INR1.87b (INR1.45b YoY).
Others
LAP constitutes 21% of total AUM.
Management expects the spread of home loans above GSec yields for the
industry to be in the range of 150-200bp.
3
23 October 2017

Indiabulls Housing Finance
Growth in mass housing for the industry should be 35-40% going forward,
according to management.
Management plans to raise USD750m in 2HFY18 via masala bonds/ECB route.
Delhi NCR contributes to 25% of HL book.
The company has changed its auditor from Deloitte to Ernst and Young.
Issued INR10b of Tier II Bonds in 2QFY18. Guidance to keep CAR above 20%.
In Oct 2017, Oak North Bank raised an investment of USD203m at a valuation of
USD1.27b (280% more than at the time of IHFL’s investment in Oak North Bank).
Exhibit 3: Quarterly Snapshot
FY16
1Q
Profit and Loss (INR m)
Income from operations
Interest Expenses
Net Interest Income
Other Income
Total Income
Operating Expenses
Employee
Others
PBT
Taxes
PAT
Minority Interest
PAT Post Minority Interest
Asset Quality
GNPA (INR m)
NNPA (INR m)
Gross NPA (%)
Net NPA (%)
Provisions on AUM (%)
Margins (%) - (calculated)
Yield on loans
Cost of funds
Spreads
NIMs
Ratios (%)
Cost to Income
Tax Rate
RoE (Calc.)
RoA (Calc.)
Business Details
Disbursements-Quarterly (INR b)
AUM (INR b)
Borrowings (INR b)
Total AUM Mix (%)
Mortgages
Corporate
Liability Mix (%)
Bank Loans
CP
NCD
ECB
Other Details
Dividend (INR/sh)
18,290
11,390
6,900
1,960
8,859
1,937
914
1,023
6,922
1,810
5,113
0
5,113
4,071
1,935
0.85
0.36
0.49
13.3
9.3
4.0
5.2
21.9
26.1
30.7
3.5
45
540
509
76
22
55
7
35
3
9
2Q
19,850
12,450
7,400
2,607
10,007
2,594
1,059
1,535
7,413
1,858
5,555
0
5,555
4,309
2,028
0.84
0.35
0.49
13.3
9.6
3.7
5.2
25.9
25.1
26.1
3.5
62
582
528
76
23
47
6
33
2
9
3Q
20,751
12,258
8,493
2,326
10,820
2,765
1,012
1,753
8,055
2,010
6,045
-21
6,024
4,553
2,169
0.83
0.35
0.48
13.0
9.0
4.0
5.2
25.6
25.0
23.1
3.5
65
623
636
76
23
49
6
31
2
9
4Q
24,009
13,616
10,392
2,463
12,855
3,957
1,147
2,811
8,898
2,083
6,815
-60
6,754
5,116
2,393
0.84
0.35
0.49
13.6
9.3
4.3
5.6
30.8
23.4
25.5
3.7
91
687
689
77
22
49
0
38
2
9
1Q
23,720
14,109
9,611
2,255
11,866
3,116
1,185
1,931
8,750
2,401
6,349
-49
6,301
5,430
2,545
0.84
0.36
0.48
12.8
8.9
4.0
5.0
26.3
27.4
22.9
3.2
53
710
745
77
23
47
0
40
2
9
2Q
25,098
16,279
8,819
3,651
12,470
3,258
1,358
1,900
9,212
2,352
6,861
-18
6,843
5,686
2,548
0.83
0.34
0.49
12.9
9.3
3.6
4.8
26.1
25.5
24.0
3.2
67
753
832
78
22
39
0
49
2
9
FY17
3Q
25,859
16,329
9,530
4,186
13,716
3,658
1,318
2,340
10,058
2,555
7,502
13
7,515
6,557
2,917
0.85
0.36
0.49
12.6
8.3
4.3
5.0
26.7
25.4
25.8
3.1
91
814
919
79
21
37
0
50
3
9
4Q
29,314
17,391
11,923
2,935
14,858
5,160
1,136
4,024
9,698
1,325
8,373
32
8,405
7,062
3,271
0.85
0.36
0.49
13.0
8.3
4.7
5.0
34.7
13.7
28.1
3.3
132
913
940
78
22
37
0
51
3
9
1Q
29,560
17,722
11,838
2,690
14,528
3,928
1,332
2,596
10,600
2,764
7,836
46
7,882
6,775
2,914
0.80
0.31
0.49
12.2
8.2
4.0
4.7
27.0
26.1
26.0
3.0
70
945
978
78
22
35
0
52
3
9
FY18
2Q
30,670
18,355
12,315
2,755
15,070
3,935
1,531
2,404
11,135
2,615
8,520
91
8,611
6,319
3,093
0.78
0.31
0.47
12.1
7.9
4.2
4.7
26.1
23.5
28.0
3.1
90
1,003
1,071
78
22
33
0
54
3
9
Source: Company, MOSL
29
6
10
34
33
29
Variation (%)
QoQ
YoY
4
4
4
2
4
0
15
(7)
5
(5)
9
9
(7)
6
22
13
40
(25)
21
21
13
27
21
11
24
26
11
21
23 October 2017
4

Indiabulls Housing Finance
Story in charts
Exhibit 4: Disb. growth of 34% YoY
Disbursement (INR b)
91
48
54
64
45
62
65
53
67
91
70
132
95
18
23
27
29
Exhibit 5: Continued robust AUM growth at +33%
AUM (INR b)
29
30
32
31
AUM Gr. (%)
29
31
33
33
33
Source: Company, MOSL
Exhibit 6: AUM mix has been stable
Others
3
21
3
21
2
22
2
22
1
23
CV
1
23
Corporate
1
22
0
23
0
22
Mortgages
0
21
0
22
0
22
0
22
Exhibit 7: Management targets 60% share of NCD by FY20
Sell Down (%)
32
8
28 28
7 7
ECB(%)
NCD (%)
CP (%)
Bank Loans (%)
76
76
76
76
76
76
77
77
78
79
78
78
78
33 31 38 40
49 50 51 52 54
6 0 0
6
0 0 0 0 0
60 54 53 59 55
47 49 49 47 39 37 37
35 33
7
7
31 35
Source: Company, MOSL
Exhibit 8: Asset quality remains healthy
GNPA (%)
NNPA (%)
Exhibit 9: Net gearing (x) among lowest compared to peers
5.7
6.1 5.9 6.3
3.9
4.7 4.6 4.8
4.3
5.2
6.2
5.7 5.9
0.9 0.9 0.8 0.8 0.9 0.9 0.9 0.9 0.8 0.8 0.8 0.8 0.8 0.9 0.9 0.8
0.8
0.4 0.5
0.4 0.4 0.3 0.3 0.4 0.4 0.4 0.4 0.4 0.4 0.3 0.4 0.4 0.3 0.3
Source: Company, MOSL
23 October 2017
5

Indiabulls Housing Finance
Exhibit 10: Financials: Valuation metrics
66
Rating
ICICIBC*
HDFCB
AXSB
KMB*
YES
IIB
IDFC Bk
FB
DCBB
JKBK
SIB
Equitas
RBL
Private Aggregate
SBIN (cons)*
PNB
BOI
BOB
CBK
UNBK
OBC
INBK
Public Aggregate
Banks Aggregate
HDFC*
LICHF
IHFL
PNBHF
GRHF
REPCO
DEWH
Housing Finance
SHTF
MMFS
BAF
CIFC
SCUF
LTFH
MUTH
CAFL
SKSM
Asset Finance
FY19E
Buy
Buy
Neutral
Buy
Buy
Buy
Neutral
Buy
Neutral
Neutral
Buy
Buy
Buy
Buy
Buy
Neutral
Buy
Neutral
Neutral
Neutral
Buy
CMP
(INR)
263
1,863
450
1,062
354
1,696
56
125
182
73
32
152
528
246
131
135
138
306
127
114
264
Mcap
(USDb)
25.4
73.0
17.0
30.5
12.6
15.6
2.9
3.3
0.8
0.6
0.7
0.8
3.0
32.2
4.2
2.2
4.8
2.5
1.3
0.6
1.9
FY18E
14.5
68.2
18.1
32.4
18.5
60.9
2.8
5.5
8.5
3.9
1.9
1.7
17.2
14.6
5.8
-11.2
9.5
30.1
9.0
17.1
34.4
FY19E
16.6
82.6
29.9
41.0
22.9
78.6
3.2
6.6
10.5
8.3
3.8
6.1
22.5
26.8
11.0
6.6
20.8
47.0
19.1
21.4
38.3
FY18E
12.0
27.3
24.8
32.7
19.2
27.8
20.3
22.5
21.4
18.9
17.2
89.3
30.7
14.7
22.4
-12.0
14.5
10.2
14.0
6.7
7.7
FY19E
9.6
22.6
15.0
25.9
15.5
21.6
17.4
18.7
17.4
8.9
8.5
25.1
23.5
7.8
11.9
20.4
6.6
6.5
6.6
5.3
6.9
FY18E
1.19
4.80
1.83
4.57
3.27
4.39
1.24
1.96
2.18
0.65
1.18
2.25
3.31
0.94
0.71
0.62
0.87
0.61
0.42
0.30
0.81
FY19E
1.01
4.13
1.66
3.90
2.80
3.74
1.18
1.80
1.94
0.62
1.06
2.08
2.96
0.85
0.68
0.62
0.79
0.57
0.40
0.28
0.74
FY18E
1.14
1.84
0.67
1.84
1.78
1.82
0.74
0.81
0.98
0.23
0.42
0.58
1.28
0.36
0.17
-0.19
0.31
0.29
0.14
0.22
0.73
FY19E
1.15
1.85
0.97
1.99
1.80
1.89
0.71
0.86
1.00
0.44
0.75
1.65
1.28
0.60
0.30
0.10
0.61
0.41
0.27
0.26
0.72
FY18E
8.6
18.8
7.6
15.0
18.3
16.9
6.3
9.6
11.5
3.5
6.7
2.5
13.0
7.0
3.2
-5.2
6.1
6.2
3.0
4.6
10.9
FY19E
9.3
19.7
11.6
16.3
19.5
19.0
6.9
10.0
11.8
7.2
12.6
8.6
13.3
11.4
5.9
3.0
12.4
9.1
6.1
5.4
11.2
Buy
Neutral
Buy
Buy
Neutral
Buy
Buy
Buy
Buy
Buy
Buy
Buy
Buy
Buy
Buy
Neutral
1,721
652
1,343
1,460
503
652
583
1,112
423
1,834
1,140
2,137
209
498
746
1,014
42.3
5.1
8.8
3.8
2.9
0.6
2.9
3.8
3.7
16.3
2.7
2.1
5.7
3.1
1.1
2.2
39.9
41.6
84.2
48.1
9.9
33.7
37.6
80.0
13.9
45.7
56.0
118.3
6.8
38.7
32.8
29.9
45.4
48.9
105.6
65.1
12.0
38.4
46.0
102.4
17.8
63.7
68.1
155.3
10.1
44.4
42.4
54.9
24.6
15.7
16.0
30.3
51.0
19.3
15.5
13.9
30.5
40.1
20.4
18.1
30.6
12.9
22.7
33.9
19.2
13.3
12.7
22.4
41.8
17.0
12.7
10.9
23.8
28.8
16.7
13.8
20.7
11.2
17.6
18.4
4.31
2.66
4.16
3.97
15.20
3.07
2.07
1.99
3.52
6.44
3.51
2.49
4.14
2.59
2.83
4.64
3.04
2.29
3.66
3.48
12.47
2.63
1.82
1.73
3.24
5.40
2.97
2.16
3.54
2.20
2.47
3.73
1.79
1.44
3.20
1.52
2.40
2.18
1.23
2.67
1.73
3.45
2.85
3.34
1.61
4.82
1.74
3.24
1.81
1.51
3.16
1.48
2.40
2.14
1.28
3.06
1.90
3.55
2.94
3.84
2.09
4.94
1.80
4.03
18.6
18.2
27.6
13.8
32.8
17.1
14.1
15.0
12.0
20.2
18.6
14.6
14.7
21.8
13.2
15.1
17.8
18.5
30.6
16.6
32.8
16.7
15.3
16.9
14.2
20.4
19.2
16.8
18.5
21.2
15.0
22.4
*Multiples adj. for value of key ventures/Investments; For ICICI Bank and HDFC Ltd BV is adjusted for investments in subsidiaries
23 October 2017
6

Indiabulls Housing Finance
Financials and valuations
Income Statement
Y/E March
Financing Income
Financing Charges
Net Financing income
Change (%)
Non interest Income
Net Income
Change (%)
Employee Cost
Other Operating Exp.
Operating profits
Change (%)
Total Provisions
% of operating profit
PBT
Tax
Tax Rate (%)
PAT
Change (%)
Minority Interest
PAT
Change (%)
Dividend (Including tax)
Balance Sheet
Y/E March
Equity Share Capital
Reserves & Surplus
Net Worth
Equity Net worth
Minority Interest
Borrowings
Change (%)
Deferred Tax Liability
Total Liabilities
Cash and bank balance
Investments
Change (%)
Loans
Change (%)
Net Current Assets
Net Fixed Assets
Total Assets
2013
42,634
25,991
16,643
27.7
5,145
21,788
17.0
2,245
1,761
17,782
19.1
1,231
6.9
16,551
3,891
23.5
12,660
34.4
76
12,584
34.8
7,277
2014
51,865
32,824
19,041
14.4
7,181
26,222
20.4
2,637
1,470
22,115
24.4
2,297
10.4
19,818
4,133
20.9
15,685
23.9
44
15,642
24.3
11,298
2015
61,210
39,442
21,768
14.3
11,494
33,262
26.8
3,249
2,285
27,728
25.4
3,003
10.8
24,725
5,713
23.1
19,012
21.2
1
19,011
21.5
10,531
2016
78,418
49,714
28,704
31.9
13,837
42,541
27.9
4,131
2,053
36,357
31.1
5,069
13.9
31,289
7,760
24.8
23,529
23.8
81
23,448
23.3
21,459
2017
99,377
64,108
35,270
22.9
17,640
52,910
24.4
4,997
2,366
45,547
25.3
7,829
17.2
37,718
8,633
22.9
29,086
23.6
22
29,064
24.0
13,746
2018E
128,693
75,783
52,910
50.0
11,819
64,729
22.3
5,996
2,882
55,851
22.6
8,428
15.1
47,423
12,093
25.5
35,330
21.5
-100
35,430
21.9
20,727
2019E
163,773
97,893
65,880
24.5
15,365
81,245
25.5
6,895
3,378
70,971
27.1
10,918
15.4
60,053
15,614
26.0
44,439
25.8
-120
44,559
25.8
26,067
(INR Million)
2020E
206,494
125,761
80,734
22.5
19,974
100,708
24.0
7,930
3,962
88,816
25.1
13,895
15.6
74,921
19,479
26.0
55,442
24.8
-144
55,586
24.7
32,518
2013
625
51,061
51,686
51,686
1,449
312,858
23.7
-1,641
364,351
48,882
23,079
28.4
307,824
20.9
-15,889
456
364,351
2014
668
56,387
57,055
57,055
19
355,395
13.6
-1,848
410,622
44,190
29,470
27.7
354,446
15.1
-18,639
469
410,622
2015
711
65,606
66,317
66,317
20
474,874
33.6
-26
541,186
34,903
61,638
109.2
460,396
29.9
-16,978
541
541,186
2016
843
106,097
106,939
106,939
0
610,853
28.6
760
718,552
29,017
106,928
73.5
608,643
32.2
-27,393
686
718,552
2017
848
120,373
121,221
121,221
0
853,011
39.6
1,103
975,335
56,825
136,166
27.3
826,139
35.7
-45,377
903
975,335
2018E
848
135,077
135,924
135,924
0
1,128,253
32.3
1,103
1,265,280
32,780
211,058
55.0
1,074,526
30.1
-54,452
690
1,265,280
2019E
848
153,569
154,416
154,416
0
1,464,939
29.8
1,103
1,620,458
48,564
253,269
20.0
1,382,018
28.6
-65,343
1,272
1,620,458
2020E
848
176,637
177,484
177,484
0
1,866,466
27.4
1,103
2,045,053
73,016
303,923
20.0
1,744,360
26.2
-78,411
1,487
2,045,053
23 October 2017
7

Indiabulls Housing Finance
Financials and valuations
AUM Mix
Assets Under Management
Change (%)
On Books
% of AUM
Off books
% of AUM
E: MOSL Estimates
Ratios
Y/E March
Spreads Analysis (%)
Avg. Yield - on Fin. Portfolio
Avg Cost of funds
Interest Spread on on books
Net Interest Margin on AUM
Profitability Ratios (%)
RoE
RoA
RoA (on AUM)
Int. Expended/Int.Earned
Cost/Income Ratio
Empl. Cost/Op. Exps.
Asset quality
GNPA (%)
NNPA (%)
Valuations
Book Value (INR)
BV Growth (%)
Price-BV (x)
Adjusted BV (INR)
Price-ABV (x)
EPS (INR)
EPS Growth (%)
Price-Earnings (x)
DPS (INR)
Dividend Payout (%)
Dividend Yield (%)
E: MOSL Estimates
344,250
25.1
307,824
89.4
36,426
10.6
411,690
19.6
354,446
86.1
57,244
13.9
522,350
26.9
460,396
88.1
61,954
11.9
686,830
31.5
608,643
88.6
78,187
11.4
913,010
32.9
826,139
90.5
86,871
9.5
1,193,918
30.8
1,074,526
90.0
119,392
10.0
1,535,575
28.6
1,382,018
90.0
153,558
10.0
(%)
1,938,178
26.2
1,744,360
90.0
193,818
10.0
2013
13.5
10.1
3.4
5.4
2014
13.1
10.1
3.0
5.0
2015
12.7
9.7
3.0
4.7
2016
12.6
9.2
3.4
4.7
2017
12.2
8.8
3.4
4.4
2018E
12.0
7.7
4.4
5.0
2019E
11.8
7.6
4.3
4.8
2020E
11.7
7.6
4.2
4.6
25.0
3.8
3.5
61.0
18.0
56.1
27.0
4.0
3.6
63.3
17.1
64.2
30.8
4.0
3.6
64.4
16.6
58.7
27.1
3.7
3.3
63.4
14.5
66.8
25.5
3.4
3.1
64.5
13.9
67.9
27.6
3.2
2.9
58.9
13.7
67.5
30.7
3.1
2.8
59.8
12.6
67.1
33.5
3.0
2.8
60.9
11.8
66.7
0.79
0.33
2013
165.4
5.1
165.4
40.3
25.8
20.0
49.6
0.83
0.36
2014
170.8
3.3
170.8
46.8
16.3
29.0
61.7
0.85
0.36
2015
186.5
9.2
186.5
53.5
14.2
35
47.9
0.84
0.35
2016
253.8
36.1
253.8
55.7
4.1
45.0
76.0
0.80
0.40
2017
286.0
12.7
4.7
286.0
4.7
68.6
23.2
19.6
27.0
39.3
2.0
0.80
0.40
2018E
320.7
12.1
4.2
320.7
4.2
83.6
21.9
16.1
41.8
50.0
3.1
0.80
0.40
2019E
364.3
13.6
3.7
364.3
3.7
105.1
25.8
12.8
52.6
50.0
3.9
0.80
0.40
2020E
418.7
14.9
3.2
418.7
3.2
131.1
24.7
10.2
65.6
50.0
4.9
23 October 2017
8

Indiabulls Housing Finance
Corporate profile
Company description
Indiabulls Housing Finance (IHFL) is the fourth largest
housing finance company in India with AUM of over
INR900b as of FY17. It was established as a wholly-owned
subsidiary of Indiabulls Financial Services (IBFSL). In early
2013, keeping with IHFL’s long-term commitment to the
housing finance business, the company was reversed-
merged into its housing finance subsidiary IHFL. IHFL
offers home loans to target client base of middle and
upper-middle income individuals and small and medium-
sized enterprises, or SMEs.
Source: MOSL/Bloomberg
Exhibit 1: Sensex rebased
Exhibit 2: Shareholding pattern (%)
Jun-17
Promoter
DII
FII
Others
23.6
6.0
61.7
8.7
Mar-17
23.6
3.7
63.5
9.2
Jun-16
24.2
2.6
59.4
13.8
Source: Capitaline
Exhibit 3: Top holders
Holder Name
EUROPACIFIC GROWTH FUND
MERRILL LYNCH MARKETS SINGAPORE PTE.
LTD
LIFE INSURANCE CORPORATION OF INDIA
TUPELO CONSULTANCY LLP
SMALLCAP WORLD FUND INC
% Holding
6.2
3.1
2.8
2.2
1.7
Source: Capitaline
Note: FII Includes depository receipts
Exhibit 4: Top management
Name
Sameer Gehlaut
Gagan Banga
Ashwini Kumar
Mukesh Garg
Pinank Shah
Ramnath Shenoy
Designation
Chairman
Vice Chairman and MD
Deputy Managing Director
Chief Financial Officer
Head Treasury
Executive Vice President, IR
Exhibit 5: Directors
Name
Sameer Gehlaut
Gagan Banga
Rajiv Rattan
Saurabh Kumar Mittal
Karan Singh Khera*
Ram Kumar Sheokand*
Prem Prakash Mirdha*
Name
Shamsher Singh Ahlawat*
Aisharya Katoch
Joginder Singh Kataria
Ajit Kumar Mittal
Ashwini Omprakash Kumar
Kamalesh Shailesh Chandra
Chakrabarty*
Source: Capitaline
*Independent
Exhibit 6: Auditors
Name
N D Kapur & Co
Jatin Gupta & Associates
Ernst & Young
Internal
Secretarial Audit
Statutory
Type
Exhibit 7: MOSL forecast v/s consensus
EPS
(INR)
FY18
FY19
FY20
MOSL
forecast
83.6
105.1
131.1
Consensus
forecast
84.8
104.1
132.7
Variation (%)
-1.4
0.9
-1.2
Source: Bloomberg
Source: Capitaline
23 October 2017
9

Disclosures:
The following Disclosures are being made in compliance with the SEBI Research Analyst Regulations 2014 (herein after referred to as the Regulations).
Motilal Oswal Securities Ltd. (MOSL) is a SEBI Registered Research Analyst having registration no. INH000000412. MOSL, the Research Entity (RE) as defined in the Regulations, is engaged in the business of providing Stock
broking services, Investment Advisory Services, Depository participant services & distribution of various financial products. MOSL is a subsidiary company of Motilal Oswal Financial Service Ltd. (MOFSL). MOFSL is a listed
public company, the details in respect of which are available on
www.motilaloswal.com.
MOSL is registered with the Securities & Exchange Board of India (SEBI) and is a registered Trading Member with National Stock
Exchange of India Ltd. (NSE) and Bombay Stock Exchange Limited (BSE), Metropolitan Stock Exchange Of India Ltd. (MSE) for its stock broking activities & is Depository participant with Central Depository Services Limited
(CDSL) & National Securities Depository Limited (NSDL) and is member of Association of Mutual Funds of India (AMFI) for distribution of financial products. Details of associate entities of Motilal Oswal Securities Limited are
available on the website at
http://onlinereports.motilaloswal.com/Dormant/documents/Associate%20Details.pdf
Indiabulls Housing Finance
Pending Regulatory Enquiries against Motilal Oswal Securities Limited by SEBI:
SEBI pursuant to a complaint from client Shri C.R. Mohanraj alleging unauthorized trading, issued a letter dated 29th April 2014 to MOSL notifying appointment of an Adjudicating Officer as per SEBI regulations to hold
inquiry and adjudge violation of SEBI Regulations; MOSL requested SEBI to provide all documents, records, investigation report relied upon by SEBI which were referred in Show Cause Notice and also sought personal
hearing. The matter is currently pending.
MOSL, it’s associates, Research Analyst or their relative may have any financial interest in the subject company. MOSL and/or its associates and/or Research Analyst may have beneficial ownership of 1% or more securities in
the subject company at the end of the month immediately preceding the date of publication of the Research Report.
MOSL and its associate company(ies), their directors and Research Analyst and their relatives may; (a)
from time to time, have a long or short position in, act as principal in, and buy or sell the securities or derivatives thereof of companies mentioned herein. (b) be engaged in any other transaction involving such securities and
earn brokerage or other compensation or act as a market maker in the financial instruments of the company(ies) discussed herein or act as an advisor or lender/borrower to such company(ies) or may have any other
potential conflict of interests with respect to any recommendation and other related information and opinions.; however the same shall have no bearing whatsoever on the specific recommendations made by the analyst(s),
as the recommendations made by the analyst(s) are completely independent of the views of the associates of MOSL even though there might exist an inherent conflict of interest in some of the stocks mentioned in the
research report.
Research Analyst may have served as director/officer, etc. in the subject company in the last 12 month period. MOSL and/or its associates may have received any compensation from the subject company in
the past 12 months.
In the last 12 months period ending on the last day of the month immediately preceding the date of publication of this research report, MOSL or any of its associates may have:
a)
managed or co-managed public offering of securities from subject company of this research report,
b)
received compensation for investment banking or merchant banking or brokerage services from subject company of this research report,
c)
received compensation for products or services other than investment banking or merchant banking or brokerage services from the subject company of this research report.
d)
Subject Company may have been a client of MOSL or its associates during twelve months preceding the date of distribution of the research report.
MOSL and it’s associates have not received any compensation or other benefits from the subject company or third party in connection with the research report. To enhance transparency, MOSL has incorporated a Disclosure
of Interest Statement in this document. This should, however, not be treated as endorsement of the views expressed in the report. MOSL and / or its affiliates do and seek to do business including investment banking with
companies covered in its research reports. As a result, the recipients of this report should be aware that MOSL may have a potential conflict of interest that may affect the objectivity of this report. Compensation of Research
Analysts is not based on any specific merchant banking, investment banking or brokerage service transactions.
Terms & Conditions:
This report has been prepared by MOSL and is meant for sole use by the recipient and not for circulation. The report and information contained herein is strictly confidential and may not be altered in any way, transmitted to,
copied or distributed, in part or in whole, to any other person or to the media or reproduced in any form, without prior written consent of MOSL. The report is based on the facts, figures and information that are considered
true, correct, reliable and accurate. The intent of this report is not recommendatory in nature. The information is obtained from publicly available media or other sources believed to be reliable. Such information has not
been independently verified and no guaranty, representation of warranty, express or implied, is made as to its accuracy, completeness or correctness. All such information and opinions are subject to change without notice.
The report is prepared solely for informational purpose and does not constitute an offer document or solicitation of offer to buy or sell or subscribe for securities or other financial instruments for the clients. Though
disseminated to all the customers simultaneously, not all customers may receive this report at the same time. MOSL will not treat recipients as customers by virtue of their receiving this report.
Analyst Certification
The views expressed in this research report accurately reflect the personal views of the analyst(s) about the subject securities or issues, and no part of the compensation of the research analyst(s) was, is, or will be directly or
indirectly related to the specific recommendations and views expressed by research analyst(s) in this report.
Disclosure of Interest Statement
Analyst ownership of the stock
Indiabulls Housing Finance
No
A graph of daily closing prices of securities is available at
www.nseindia.com, www.bseindia.com.
Research Analyst views on Subject Company may vary based on Fundamental research and Technical Research. Proprietary
trading desk of MOSL or its associates maintains arm’s length distance with Research Team as all the activities are segregated from MOSL research activity and therefore it can have an independent view with regards to
subject company for which Research Team have expressed their views.
Regional Disclosures (outside India)
This report is not directed or intended for distribution to or use by any person or entity resident in a state, country or any jurisdiction, where such distribution, publication, availability or use would be contrary to law,
regulation or which would subject MOSL & its group companies to registration or licensing requirements within such jurisdictions.
For Hong Kong:
This report is distributed in Hong Kong by Motilal Oswal capital Markets (Hong Kong) Private Limited, a licensed corporation (CE AYY-301) licensed and regulated by the Hong Kong Securities and Futures Commission (SFC)
pursuant to the Securities and Futures Ordinance (Chapter 571 of the Laws of Hong Kong) “SFO”. As per SEBI (Research Analyst Regulations) 2014 Motilal Oswal Securities (SEBI Reg No. INH000000412) has an agreement with
Motilal Oswal capital Markets (Hong Kong) Private Limited for distribution of research report in Hong Kong. This report is intended for distribution only to “Professional Investors” as defined in Part I of Schedule 1 to SFO. Any
investment or investment activity to which this document relates is only available to professional investor and will be engaged only with professional investors.” Nothing here is an offer or solicitation of these securities,
products and services in any jurisdiction where their offer or sale is not qualified or exempt from registration. The Indian Analyst(s) who compile this report is/are not located in Hong Kong & are not conducting Research
Analysis in Hong Kong.
For U.S.
Motilal Oswal Securities Limited (MOSL) is not a registered broker - dealer under the U.S. Securities Exchange Act of 1934, as amended (the"1934 act") and under applicable state laws in the United States. In addition MOSL is
not a registered investment adviser under the U.S. Investment Advisers Act of 1940, as amended (the "Advisers Act" and together with the 1934 Act, the "Acts), and under applicable state laws in the United States.
Accordingly, in the absence of specific exemption under the Acts, any brokerage and investment services provided by MOSL, including the products and services described herein are not available to or intended for U.S.
persons. This report is intended for distribution only to "Major Institutional Investors" as defined by Rule 15a-6(b)(4) of the Exchange Act and interpretations thereof by SEC (henceforth referred to as "major institutional
investors"). This document must not be acted on or relied on by persons who are not major institutional investors. Any investment or investment activity to which this document relates is only available to major institutional
investors and will be engaged in only with major institutional investors. In reliance on the exemption from registration provided by Rule 15a-6 of the U.S. Securities Exchange Act of 1934, as amended (the "Exchange Act") and
interpretations thereof by the U.S. Securities and Exchange Commission ("SEC") in order to conduct business with Institutional Investors based in the U.S., MOSL has entered into a chaperoning agreement with a U.S.
registered broker-dealer, Motilal Oswal Securities International Private Limited. ("MOSIPL"). Any business interaction pursuant to this report will have to be executed within the provisions of this chaperoning agreement.
The Research Analysts contributing to the report may not be registered /qualified as research analyst with FINRA. Such research analyst may not be associated persons of the U.S. registered broker-dealer, MOSIPL, and
therefore, may not be subject to NASD rule 2711 and NYSE Rule 472 restrictions on communication with a subject company, public appearances and trading securities held by a research analyst account.
For Singapore
Motilal Oswal Capital Markets Singapore Pte Limited is acting as an exempt financial advisor under section 23(1)(f) of the Financial Advisers Act(FAA) read with regulation 17(1)(d) of the Financial Advisors Regulations and is a
subsidiary of Motilal Oswal Securities Limited in India. This research is distributed in Singapore by Motilal Oswal Capital Markets Singapore Pte Limited and it is only directed in Singapore to accredited investors, as defined in
the Financial Advisers Regulations and the Securities and Futures Act (Chapter 289), as amended from time to time. In respect of any matter arising from or in connection with the research you could contact the following
representatives of Motilal Oswal Capital Markets Singapore Pte Limited:
Disclaimer:
The report and information contained herein is strictly confidential and meant solely for the selected recipient and may not be altered in any way, transmitted to, copied or distributed, in part or in whole, to any other person
or to the media or reproduced in any form, without prior written consent. This report and information herein is solely for informational purpose and may not be used or considered as an offer document or solicitation of
offer to buy or sell or subscribe for securities or other financial instruments. Nothing in this report constitutes investment, legal, accounting and tax advice or a representation that any investment or strategy is suitable or
appropriate to your specific circumstances. The securities discussed and opinions expressed in this report may not be suitable for all investors, who must make their own investment decisions, based on their own investment
objectives, financial positions and needs of specific recipient. This may not be taken in substitution for the exercise of independent judgment by any recipient. Each recipient of this document should make such investigations
as it deems necessary to arrive at an independent evaluation of an investment in the securities of companies referred to in this document (including the merits and risks involved), and should consult its own advisors to
determine the merits and risks of such an investment. The investment discussed or views expressed may not be suitable for all investors. Certain transactions -including those involving futures, options, another derivative
products as well as non-investment grade securities - involve substantial risk and are not suitable for all investors. No representation or warranty, express or implied, is made as to the accuracy, completeness or fairness of
the information and opinions contained in this document. The Disclosures of Interest Statement incorporated in this document is provided solely to enhance the transparency and should not be treated as endorsement of the
views expressed in the report. This information is subject to change without any prior notice. The Company reserves the right to make modifications and alternations to this statement as may be required from time to time
without any prior approval. MOSL, its associates, their directors and the employees may from time to time, effect or have effected an own account transaction in, or deal as principal or agent in or for the securities
mentioned in this document. They may perform or seek to perform investment banking or other services for, or solicit investment banking or other business from, any company referred to in this report. Each of these entities
functions as a separate, distinct and independent of each other. The recipient should take this into account before interpreting the document. This report has been prepared on the basis of information that is already
available in publicly accessible media or developed through analysis of MOSL. The views expressed are those of the analyst, and the Company may or may not subscribe to all the views expressed therein. This document is
being supplied to you solely for your information and may not be reproduced, redistributed or passed on, directly or indirectly, to any other person or published, copied, in whole or in part, for any purpose. This report is not
directed or intended for distribution to, or use by, any person or entity who is a citizen or resident of or located in any locality, state, country or other jurisdiction, where such distribution, publication, availability or use would
be contrary to law, regulation or which would subject MOSL to any registration or licensing requirement within such jurisdiction. The securities described herein may or may not be eligible for sale in all jurisdictions or to
certain category of investors. Persons in whose possession this document may come are required to inform themselves of and to observe such restriction. Neither the Firm, not its directors, employees, agents or
representatives shall be liable for any damages whether direct or indirect, incidental, special or consequential including lost revenue or lost profits that may arise from or in connection with the use of the information.
The
person accessing this information specifically agrees to exempt MOSL or any of its affiliates or employees from, any and all responsibility/liability arising from such misuse and agrees not to hold MOSL or any of its affiliates or
employees responsible for any such misuse and further agrees to hold MOSL or any of its affiliates or employees free and harmless from all losses, costs, damages, expenses that may be suffered by the person accessing this
information due to any errors and delays.
Registered Office Address: Motilal Oswal Tower, Rahimtullah Sayani Road, Opposite Parel ST Depot, Prabhadevi, Mumbai-400025; Tel No.: 022-3980 4263; www.motilaloswal.com. Correspondence Address: Palm Spring
Centre, 2nd Floor, Palm Court Complex, New Link Road, Malad (West), Mumbai- 400 064. Tel No: 022 3080 1000. Compliance Officer: Neeraj Agarwal, Email Id:
na@motilaloswal.com,
Contact No.:022-30801085.
Registration details of group entities.: MOSL: NSE (Cash): INB231041238; NSE (F&O): INF231041238; NSE (CD): INE231041238; BSE (Cash): INB011041257; BSE(F&O): INF011041257; BSE(CD); MSE(Cash): INB261041231;
MSE(F&O): INF261041231; MSE(CD): INE261041231; CDSL: IN-DP-16-2015; NSDL: IN-DP-NSDL-152-2000; Research Analyst: INH000000412. AMFI: ARN 17397. Investment Adviser: INA000007100. Motilal Oswal Asset
Management Company Ltd. (MOAMC): PMS (Registration No.: INP000000670) offers PMS and Mutual Funds products. Motilal Oswal Wealth Management Ltd. (MOWML): PMS (Registration No.: INP000004409) offers wealth
management solutions. *Motilal Oswal Securities Ltd. is a distributor of Mutual Funds, PMS, Fixed Deposit, Bond, NCDs, Insurance and IPO products. * Motilal Oswal Commodities Broker Pvt. Ltd. offers Commodities
Products. * Motilal Oswal Real Estate Investment Advisors II Pvt. Ltd. offers Real Estate products. * Motilal Oswal Private Equity Investment Advisors Pvt. Ltd. offers Private Equity products
23 October 2017
10