26 October 2017
Market snapshot
Equities - India
Close
Chg .%
Sensex
33,043
1.3
Nifty-50
10,295
0.9
Nifty-M 100
19,212
1.6
Equities-Global
Close
Chg .%
S&P 500
2,557
-0.5
Nasdaq
6,564
-0.5
FTSE 100
7,447
-1.1
DAX
12,953
-0.5
Hang Seng
11,493
0.8
Nikkei 225
21,708
-0.4
Commodities
Close
Chg .%
Brent (US$/Bbl)
58
0.1
Gold ($/OZ)
1,277
0.0
Cu (US$/MT)
6,984
-0.4
Almn (US$/MT)
2,173
1.3
Currency
Close
Chg .%
USD/INR
64.9
-0.3
USD/EUR
1.2
0.4
USD/JPY
113.6
-0.2
YIELD (%)
Close
1MChg
10 Yrs G-Sec
6.8
0.0
10 Yrs AAA Corp
7.7
0.0
Flows (USD b)
25-Oct
MTD
FIIs
0.6
-0.4
DIIs
0.0
1.5
Volumes (INRb)
25-Oct
MTD*
Cash
620
318
F&O
12,024
6,624
Note: YTD is calendar year, *Avg
YTD.%
24.1
25.8
33.9
YTD.%
14.2
21.9
4.3
12.8
22.3
13.6
YTD.%
5.0
10.9
26.4
27.5
YTD.%
-4.5
12.3
-2.9
YTDchg
0.3
0.1
YTD
4.8
11.3
YTD*
295
5,518
Today’s top research idea
RBL Bank: Strong growth with improving profitability and healthy asset
quality
v
Key positives are from 2QFY18: a) Loan growth of 8% QoQ and 35% YoY. b) Fee
income growth of 38% YoY, driven by a 150% increase in distribution/CC fees.
c) Margin improvement of 20bp QoQ to 3.7%, driven partly by a reduction in
cost of funds from CASA inflows and partly by capital from QIP
v
Loan growth was led by non-wholesale book growth of 41% YoY, increasing the
share of non-wholesale to 40.4% from 38.8% a year ago. Strong CASA growth of
56% YoY (ahead of deposit growth of 31% YoY) led to CASA ratio improving
380bp YoY (+160bp QoQ) to 23.7
v
With a diverse product portfolio, no legacy issues, highly capable management
and low market share, we expect RBL to report industry-leading loan CAGR of
~35% over FY17-20.
v
We maintain Buy with a TP of INR665 based on 3.5x Sept-19E BV.
Research covered
Cos/Sector
RBL Bank
Hindustan Unilever
Kotak Mah. Bank
HCL Tech
Emami
PNB Housing
M&M Fin. Serv.
Tata Comm
GSK Pharma
Exide Inds.
Quess Corp
PI Inds
Mindtree
Tata Elxsi
Key Highlights
Strong growth with improving profitability and healthy asset quality
Remarkable growth in EBITDA augurs well for future
Steady quarter; loan growth gaining momentum
Organic growth remains the dampener
EBITDA above estimate
Growth story continues
Biting the bullet - Migrated to 90dpd
EBITDA at INR5.6b, up 1% QoQ, 4% below estimate
Revenue impacted by GST rollout
EBITDA margin below estimate
Strong broad-based revenue performance
Revenue below estimate
In-line operating performance
Revenue, EBITDA in line
BIOS | CROMPTON | KKC | EQUITAS | JUBI | LTFH | MPHL | UNSP
Results Expectation
| YES
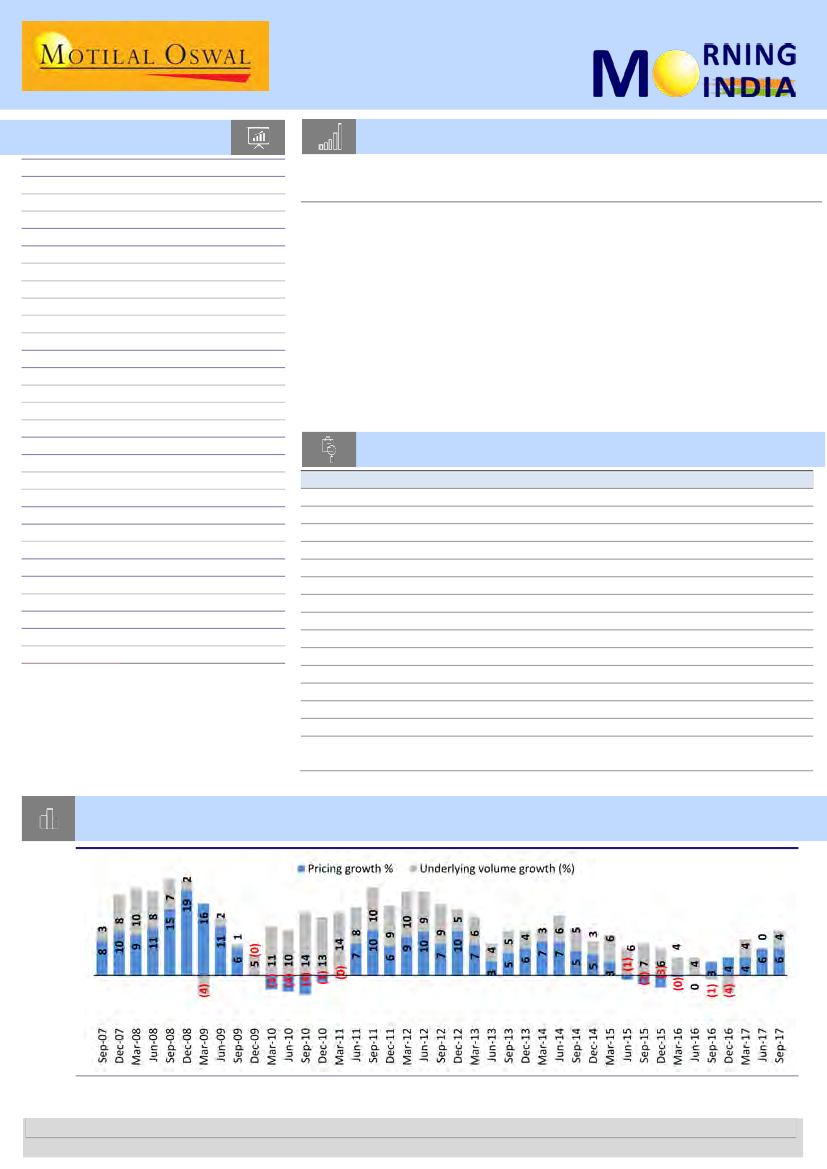
Chart of the Day: Hindustan Unilever – Consumer business sales growth of 10% minus volume growth of
4% minus ~3% price reduction in 2QFY18 plus ~3% input credit is equal to ~6% realization growth
Source: Company, MOSL
Research Team (Gautam.Duggad@MotilalOswal.com)
Motilal Oswal research is available on www.motilaloswal.com/Institutional-Equities, Bloomberg, Thomson Reuters, Factset and S&P Capital.
Investors are advised to refer through important disclosures made at the last page of the Research Report.