25 October 2017
2QFY18 Results Update | Sector: Financials
RBL Bank
Buy
BSE SENSEX
33,043
Bloomberg
Equity Shares (m)
M.Cap.(INRb)/(USDb)
52-Week Range (INR)
1, 6, 12 Rel. Per (%)
Avg. Val, INR m
Free float (%)
S&P CNX
10,295
RBL IN
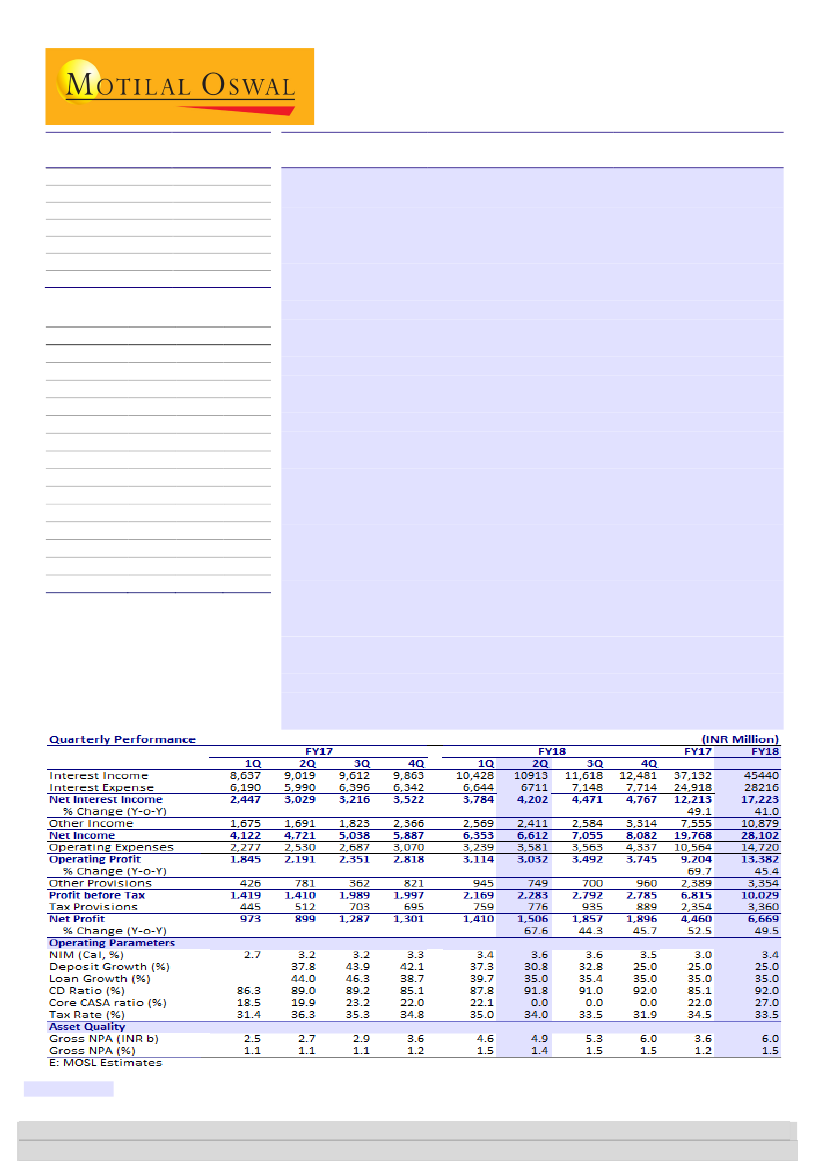
Strong growth with improving profitability and healthy asset quality
361.7
RBL’s 2QFY18 PAT increased 68% YoY (7% below estimate), mainly due to
1,33.1 /2.1
opex missing estimates by 5% (higher expansion costs), despite total income
600 / 320
(INR6.6b, +4%/+40% QoQ/YoY) being largely in line with estimates. Key
-2/-15/35
positives are: a) Loan growth of 8% QoQ and 35% YoY. b) Fee income growth
983
of 38% YoY, driven by a 150% increase in distribution/CC fees. c) Margin
100.0
CMP: INR524
TP: INR665 (+27%)
Financials & Valuations (INR b)
Y/E March
2018E 2019E
NII
17.2
21.8
OP
13.4
17.8
NP
6.7
9.4
NIM (%)
3.4
3.2
EPS (INR)
16.4
23.0
BV/Sh. (INR)
159.0
178.0
ABV/Sh. (INR)
154.3
171.7
RoE (%)
12.4
13.7
RoA (%)
1.2
1.3
Valuations
P/E(X)
32.1
22.8
P/BV (X)
3.3
2.9
P/ABV (X)
3.4
3.1
Div. Yield (%)
0.5
0.7
2020E
28.8
23.6
12.6
3.2
30.8
203.4
195.9
16.2
1.3
17.0
2.6
2.7
0.9
improvement of 20bp QoQ to 3.7%, driven partly by a reduction in cost of
funds from CASA inflows and partly by capital from QIP.
Absolute GNPAs increased 6% QoQ (+77% YoY) to 1.44% of loans (-2bp
QoQ). Sequential decline in asset quality was caused by a 30%/20% increase
in DB&FI/BBB portfolios, where GNPA ratios stood at 2.81%/1.49%
(+42bp/+8bp QoQ), while asset quality in Commercial Banking improved
with a decline in GNPA to 2% from 2.6% in the earlier quarter.
Loan growth was led by non-wholesale book growth of 41% YoY, increasing
the share of non-wholesale to 40.4% from 38.8% a year ago. Strong CASA
growth of 56% YoY (ahead of deposit growth of 31% YoY) led to CASA ratio
improving 380bp YoY (+160bp QoQ) to 23.7%.
Other highlights:
a) PAR>90 dpd in micro-banking stood at 4.68% (the bank
maintained PAR guidance of 5% and credit cost guidance of 2.5% on this
book). b) Post QIP in August 2017, Tier 1 ratio stood at 13.87%. c) Fees to
assets improved 10bp QoQ to 1.6%. d) Cost to core income ratio stood at
57% v/s 58% in 1Q.
Valuation view:
With a diverse product portfolio, no legacy issues, highly
capable management and low market share, we expect RBL to report industry-
leading loan CAGR of ~35% over FY17-20. We expect stable/improving margins
due to a changing loan mix toward high-yielding loans, a sharp fall in cost of bulk
deposits and an improvement in the CD ratio. Strong balance sheet growth is
expected to drive operating leverage. We cut FY18E PAT by ~5% to account for
continued high expansion costs, and maintain
Buy
with a TP of INR665 based on
3.5x Sept-19E BV.
Research Analyst: Nitin Aggarwal
(Nitin.Aggarwal@MotilalOswal.com); +91 22 3982 5540|Anirvan
Sarkar
(Anirvan.Sarkar@MotilalOswal.com); +91223982 5505
Alpesh Mehta
(Alpesh.Mehta@MotilalOswal.com); +91 22 3982 5415
| Piran Engineer
(Piran.Engineer@MotilalOswal.com); +91 22 3980 4393
Investors are advised to refer through important disclosures made at the last page of the Research Report.
Motilal Oswal research is available on www.motilaloswal.com/Institutional-Equities, Bloomberg, Thomson Reuters, Factset and S&P Capital.

RBL Bank
Exhibit 1: Quarterly performance v/s our estimates and reasons for deviation (INR m)
Y/E March
Interest Income
Interest Expense
Net Interest Income
% Change (YoY)
Other Income
Net Income
Operating Expenses
Operating Profit
% Change (YoY)
Other Provisions
Profit before Tax
Tax Provisions
Net Profit
% Change (YoY)
2QFY18A
10,913
6,711
4,202
39
2,411
6,612
3,581
3,032
38
749
2,283
776
1,506
68
2QFY18E
11,079
6,777
4,302
39
2,495
6,796
3,407
3,390
49
950
2,440
817
1,622
44
Var. (%)
-1
-1
-2
-3
-3
5
-11
-21
-6
-5
-7
Comments
Retail expansion leading to opex growth
Provisions were lower than expected
Opex miss drove PAT miss
Source: MOSL
Robust loan growth of 8%
QoQ was broad-based
across segments; retail
share steady QoQ at 40%
Robust loan growth; share of retail loans increases
Loan growth of 8% QoQ was spread evenly across retail and wholesale, keeping
retail share stable at ~40% sequentially.
Retail growth was driven by BBB with 13% sequential growth (+59% YoY). DB&FI
grew 10% QoQ led largely by 13% QoQ growth in micro-banking; management is
cautious on growth in micro-banking division owing to asset quality concerns.
Agri book declined 9% sequentially (+23% YoY).
Corporate loans grew 6% QoQ (+31% YoY) led by higher working capital
financing in large corporate lending. CB segment grew +12% QoQ and 32% YoY.
Exhibit 3: Strong growth across retail segments (%)
C&IB
14
8
17
23
15
8
16
22
39
14
8
17
21
40
CB
15
7
17
19
43
BBB
14
7
18
19
43
Agri
14
7
18
19
42
DB & FI
13
7
20
18
42
14
6
21
18
41
Exhibit 2: Share of retail business stable QoQ
Wholesale business
Retail Business
39
61
39
61
39
61
39
61
38
62
39
61
40
60
40
60
38
Source: MOSL, Company
Strong CASA deposit inflows
continued; CASA ratio
increased to 23.7% v/s
22.1% in 1Q
Margins improve 20bp QoQ to 3.7%
Bank reported 20bp QoQ improvement in margins to 3.7% (+34bp YoY). NIMs
were aided by a) reduced leverage post QIP, and b) re-pricing of bulk deposits
and c) healthy CASA inflows.
CASA deposits increased 56% YoY (+11% QoQ) led by robust 95% increase in SA
deposits (+17% QoQ). CASA ratio increased 380bp YoY to 23.7% v/s 19.9% in
2QFY17.
During the quarter the cost of funds declined 10bp QoQ to 6.6%, while yield on
loans stayed stable at 10.6%.
25 October 2017
2

RBL Bank
Exhibit 4: NIMs improved 20bp QoQ to 3.7%
NIMs (%)
11.7
Exhibit 5: COF declined 10bp QoQ (-60bp YoY)
YOF (%)
11.5
11.2
COF (%)
11.3
11.3
YOL (%)
10.8
10.6
9.8
6.8
6.7
COD (%)
11
10.4
7.8
3.0
3.2
3.2
2.8
3.4
3.4
3.5
3.5
3.7
7.4
10.2
7.6
7.3
9.9
7.5
7.3
10.2
7.5
7.1
10.1
7.2
6.9
9.9
6.9
6.7
10
7
Source: MOSL, Company
Asset quality stable, DB&FI
and BBB books continue to
witness elevated stress
Asset quality stable, micro-banking stress stays elevated
GNPAs increased 6.4% QoQ in absolute terms, but slippages moderated to
1.48% from 2.48% in the prior quarter. GNPA in % terms declined 2bp to 1.44%
v/s 1.46% in 1Q.
Recoveries came in at INR370m, driving net slippages lower at 0.88% compared
to 2.43% in 1Q.
Commercial banking witnessed improvement in asset quality with decline in
GNPA to 2% (-60bp QoQ), but stress in the DB&FI/BBB/Agri portfolios (farm loan
waiver related) stayed elevated as the 3 segments reported GNPA of
2.81%/1.49%/1.28%.
Provision coverage ratio increased 28bp QoQ to 58.27% v/s 57.99% in the
previous quarter.
Exhibit 6: QoQ Rise in GNPA led by BBB and DB&FI segment
GNPA
C&IB
CB
BBB
Agri
DB&FI
FY16
2,081
171
1,384
378
66
82
1QFY17
2,527
266
1,589
472
102
98
1HFY17
2,746
378
1,592
550
107
119
9MFY17
2,847
378
1,604
617
117
131
FY17
3,573
1,038
1,394
763
181
197
1QFY18
4,578
1,030
1,438
865
234
1,012
1HFY18
4,872
1,028
1,236
1,037
264
1,307
Source: Company, MOSL
Exhibit 7: GNPA (%) increased the most for DB&FI
GNPA %
C&IB
CB
BBB
Agri
DB&FI
FY16
0.98
0.21
2.96
1.09
0.38
0.26
1QFY17
1.13
0.30
3.42
1.26
0.56
0.31
1HFY17
1.10
0.36
3.44
1.26
0.64
0.33
9MFY17
1.06
0.33
3.29
1.29
0.67
0.36
FY17
1.20
0.84
2.53
1.42
0.86
0.48
1QFY18
1.46
0.78
2.60
1.41
1.03
2.39
1HFY18
1.44
0.74
2.00
1.49
1.28
2.81
Source: MOSL, Company
25 October 2017
3

RBL Bank
Valuation and View
Post management change in FY10, RBL has turned around the corners in key
operating parameters. Bank reported loan CAGR of 58% over FY10-17, earnings
CAGR of 57%, RoA improved to 1% v/s 0.2% in FY11 and Tier I stood at 11.4%.
RBL has adopted a unique business model whereby a) the bank has adopted a
linkages based approach to agricultural lending, b) has used large corporate
accounts as an entry strategy to gain access to their supply chain ecosystem,
and c) has strategically acquired business banking clients in the emerging sectors
(primary bankers to gain lion’s share of their wallet).
RBL’s business transformation has coincided with significant investments in
human capital (senior management), service offering (product suite), customer
acquisition (including inorganic portfolios), technology and brand building
(branch expansion and re-branding). With significant capacity already in place,
RBL is now primed to sweat its investments and benefit from improving
operating efficiencies. We expect gradual improvement in CI ratio to result from
digital initiatives.
We expect strong benefits to accrue to RBL from its partnership with Bajaj
Finance in co-branded credit cards. The bank has already booked around
130,000 cards since the launch in 4QFY17. RBL aims to be amongst the top 5
credit card payers in the next 3 years and strives to achieve 2m+ cards over the
next 5 years. We expect RBL to leverage on BAFs vast customer base (~12m;
60% don’t have credit cards), strong distribution scale, excellent risk and
analytics infrastructure. This would enable fast paced credit card customer
acquisition at lower operating costs and lower credit costs (as these are tested
customers of BAF).
We have cut our FY18 PAT estimates by ~5% to account for continued high
expansion costs. We strongly believe RBL has a potential to generate significant
returns in the next three years led by (1) pedigreed leadership team, which is
driving high-quality loan growth (CAGR of 35% over FY17-20E), (2) niche
business model, (3) improvement in core income, driving down cost-to-income
(C/I) ratio. We expect robust EPS CAGR of 40%, with RoA improving by ~30bp to
1.3%. Maintain Buy with a TP of INR665 based on 3.5 Sept 19 BV.
Exhibit 8: We cut FY18 PAT estimates by 5% to account for expansion costs
Old Estimates
FY18
FY19
FY20
Net Interest Income 17.1
21.5
28.7
Other Income
11.0
14.6
18.4
Total Income
28.2
36.2
47.1
Operating Expenses 14.3
18.7
24.3
Operating Profits
13.9
17.5
22.8
Provisions
3.4
3.8
4.9
PBT
10.6
13.7
18.0
Tax
3.5
4.5
5.9
PAT
7.0
9.2
12.0
Loans
398
537
725
Deposits
432
614
866
Margins (%)
3.39
3.23
3.21
Credit Cost (%)
0.97
0.82
0.77
RoA (%)
1.28
1.28
1.26
RoE (%)
13.03 13.29 15.50
INR b
Revised Estimates
FY18
FY19
FY20
17.2
21.8
28.8
10.9
14.8
18.0
28.1
36.6
46.8
14.7
18.8
23.2
13.4
17.8
23.6
3.4
3.8
4.9
10.0
14.0
18.7
3.4
4.6
6.2
6.7
9.4
12.6
398
537
725
432
614
866
3.39
3.23
3.21
0.85
0.70
0.65
1.22
1.32
1.31
12.42 13.67 16.15
Change (%)
FY18 FY19 FY20
0.5
1.3
0.3
-1.3 1.1 -1.9
-0.2 1.2 -0.5
3.3
0.5 -4.3
-3.8 2.0
3.4
0.0
0.0
0.0
-5.0 2.5
4.4
-5.0 2.5
4.4
-5.0 2.5
4.4
0.0
0.0
0.0
0.0
0.0
0.0
Source: MOSL, Company
25 October 2017
4

RBL Bank
Exhibit 9: DUPONT Analysis - Return ratios to go up driven by strong core operating profitability
Y/E MARCH
Interest Income
Interest Expended
Net Interest Income
Fee income
Core Income
Operating Expenses
Employee cost
Others
Core Operating Profit
Non Interest income
Trading and others
Operating Profit
Provisions
PBT
Tax
Tax Rate
RoA
Leverage (x)
RoE
FY13
8.72
6.16
2.55
0.98
3.54
2.22
1.23
0.99
1.31
1.25
0.27
1.58
0.22
1.36
0.44
32.2
0.92
7.3
6.75
FY14
8.67
6.48
2.19
1.40
3.60
2.72
1.19
1.53
0.88
1.67
0.27
1.15
0.30
0.85
0.26
30.1
0.59
8.6
5.12
FY15
8.62
6.17
2.46
1.53
3.98
2.65
1.33
1.32
1.33
1.78
0.25
1.59
0.27
1.32
0.41
30.9
0.91
10.7
9.76
FY16
8.28
5.81
2.47
1.30
3.77
2.32
1.12
1.20
1.46
1.48
0.18
1.64
0.35
1.29
0.41
31.7
0.88
12.7
11.21
FY17
8.45
5.67
2.78
1.45
4.23
2.41
1.02
1.39
1.82
1.72
0.27
2.10
0.54
1.55
0.54
34.5
1.02
12.1
12.32
FY18E
8.28
5.14
3.14
1.71
4.85
2.68
1.04
1.65
2.16
1.98
0.27
2.44
0.61
1.83
0.61
33.5
1.22
10.2
12.42
FY19E
7.99
4.94
3.05
1.79
4.85
2.63
1.00
1.63
2.22
2.07
0.28
2.50
0.54
1.96
0.65
33.0
1.32
10.4
13.67
FY20E
7.95
4.95
3.00
1.70
4.70
2.43
0.91
1.52
2.27
1.88
0.19
2.46
0.51
1.96
0.65
33.0
1.31
12.3
16.15
Source: MOSL, Company
25 October 2017
5

RBL Bank
Financials and Valuations
Income Statement
Y/E March
Interest Income
Interest Expense
Net Interest Income
Change (%)
Non Interest Income
Net Income
Change (%)
Operating Expenses
Pre Provision Profits
Change (%)
Provisions (excl tax)
PBT
Tax
Tax Rate (%)
PAT
Change (%)
Profits for Equity SH
Change (%)
Equity Dividend (Incl tax)
Core PPP*
Change (%)
*Core PPP is (NII+Fee income-Opex)
2013
8,793
6,218
2,575
37.9
1,264
3,840
51.2
2,244
1,596
40.1
226
1,370
442
32.2
929
42.6
929
42.6
178
1,318
26.6
2014
13,516
10,100
3,416
32.6
2,610
6,026
56.9
4,239
1,787
12.0
462
1,325
398
30.1
927
-0.2
927
-0.2
288
1,334
1.2
2015
19,531
13,967
5,564
62.9
4,034
9,598
59.3
5,997
3,601
101.5
602
2,999
928
30.9
2,072
123.6
2,072
123.6
438
2,880
116.0
2016
27,443
19,251
8,192
47.2
4,905
13,097
36.5
7,673
5,424
50.6
1,144
4,280
1,355
31.7
2,925
41.2
2,925
41.2
587
4,818
67.3
2017
37,132
24,918
12,213
49.1
7,555
19,768
50.9
10,564
9,204
69.7
2,389
6,815
2,354
34.5
4,460
52.5
4,460
52.5
813
7,965
65.3
2018E
45,440
28,216
17,223
41.0
10,879
28,102
42.2
14,720
13,382
45.4
3,354
10,029
3,360
33.5
6,669
49.5
6,669
49.5
1,170
11,882
49.2
(INR Million)
2019E
57,058
35,245
21,813
26.6
14,795
36,607
30.3
18,761
17,846
33.4
3,827
14,020
4,627
33.0
9,393
40.8
9,393
40.8
1,649
15,846
33.4
2020E
76,174
47,391
28,784
32.0
18,050
46,833
27.9
23,238
23,595
32.2
4,851
18,745
6,186
33.0
12,559
33.7
12,559
33.7
2,204
21,795
37.5
Balance Sheet
Y/E March
Share Capital
Equity Share Capital
Preference Share Capital
Reserves & Surplus
Net Worth
Of which Equity Networth
Deposits
Change (%)
of which CASA Dep
Change (%)
Borrowings
Other Liabilities & Prov.
Total Liabilities
Cash & Balances with RBI
Balances with Banks & money at Call & Short Notice
Investments
Change (%)
Loans
Change (%)
Fixed Assets
Other Assets
Total Assets
2013
2014
2015
2016
2017
2018E
2,529
2,720
2,935
3,247
3,752
4,078
2,529
2,720
2,935
3,247
3,752
4,078
0
0
0
0
0
0
13,538 17,427 19,370 26,645 38,791 60,763
16,067 20,148 22,304 29,892 42,543 64,841
16,067 20,148 22,304 29,892 42,543 64,841
83,405 115,986 170,993 243,487 345,881 432,351
76.0
39.1
47.4
42.4
42.1
25.0
16,444 23,697 31,574 45,378 76,027 116,548
61.3
44.1
33.2
43.7
67.5
53.3
27,373 38,955 69,627 105,362 79,798 90,506
2,787
6,892
8,123 12,870 18,526 23,234
129,634 181,981 271,047 391,611 486,748 610,933
2,908
9,807 14,557 13,397 29,479 17,456
3,977
2,115
7,147 11,102 12,457
10,457
55,160 64,770 97,923 144,360 134,817 165,825
143.6
17.4
51.2
47.4
-6.6
23.0
63,762 98,350 144,498 212,291 294,490 397,562
54.3
54.2
46.9
46.9
38.7
35.0
943
1,343
1,644
1,773
2,587
3,487
2,883
5,595
5,278
8,688 12,917 16,146
129,634 181,981 271,047 391,611 486,748 610,933
(INR Million)
2019E
2020E
4,078
4,078
4,078
4,078
0
0
68,508
78,863
72,586
82,941
72,586
82,941
613,939
865,653
42.0
41.0
177,969
261,770
52.7
47.1
101,376
114,084
29,161
36,624
817,062 1,099,303
27,563
46,548
14,306
19,595
213,914
278,089
29.0
30.0
536,709
724,557
35.0
35.0
4,387
5,287
20,182
25,228
817,062 1,099,303
Asset Quality
GNPA (INR m)
NNPA (INR m)
GNPA Ratio
NNPA Ratio
Slippage Ratio
Credit Cost
PCR (Excl Tech. write off)
E: MOSL Estimates
259
69
0.41
0.11
0.99
0.23
73.4
778
305
0.79
0.31
1.00
0.37
60.8
1,112
386
0.77
0.27
0.48
0.29
65.3
2,081
1,244
0.98
0.59
1.38
0.45
40.2
3,569
1,899
1.21
0.64
2.51
0.60
46.8
5,955
2,545
1.50
0.64
1.58
0.85
57.3
8,335
3,054
1.55
0.57
1.40
0.70
63.4
12,302
4,522
1.70
0.62
1.50
0.65
63.2
25 October 2017
6

RBL Bank
Financials and Valuations
Ratios
Y/E March
Spreads Analysis (%)
Avg. Yield-Earning Assets
Avg. Yield on loans
Avg. Yield on Investments
Avg. Cost-Int. Bear. Liab.
Avg. Cost of Deposits
Interest Spread
Net Interest Margin
Profitability Ratios (%)
RoE
RoA
Int. Expense/Int.Income
Fee Income/Net Income
Non Int. Inc./Net Income
Efficiency Ratios (%)
Cost/Income*
Empl. Cost/Op. Exps.
Busi. per Empl. (INR m)
NP per Empl. (INR lac)
* ex treasury and Recoveries from written off
accounts
Asset-Liability Profile (%)
Loans/Deposit Ratio
CASA Ratio
Investment/Deposit Ratio
G-Sec/Investment Ratio
CAR
Tier 1
2013
9.0
11.7
6.5
7.3
7.4
1.7
2.7
2014
9.0
11.4
6.9
7.6
7.7
1.4
2.4
2015
9.0
11.6
6.4
7.1
7.6
1.9
2.7
2016
8.5
10.9
6.2
6.5
7.3
2.0
2.7
2017
8.7
10.4
7.1
6.4
6.7
2.3
3.0
2018E
8.6
9.8
6.9
5.9
5.7
2.6
3.4
2019E
8.3
9.3
6.4
5.7
5.3
2.6
3.2
2020E
8.3
9.3
6.4
5.6
5.2
2.7
3.2
6.8
0.9
70.7
23.0
32.9
5.1
0.6
74.7
30.3
43.3
9.8
0.9
71.5
26.8
42.0
11.2
0.9
70.1
26.7
37.5
12.3
1.0
67.1
26.2
38.2
12.4
1.2
62.1
25.4
38.7
13.7
1.3
61.8
27.3
40.4
16.2
1.3
62.2
28.7
38.5
58.4
55.3
77.6
70.3
43.6
84.6
62.5
50.2
105.1
58.6
48.2
124.9
53.4
42.2
138.2
52.4
38.6
156.9
51.2
37.9
191.4
49.6
37.3
232.2
76.4
19.7
66.1
59.1
0.0
0.0
84.8
20.4
55.8
61.8
0.0
0.0
84.5
18.5
57.3
77.4
0.0
0.0
87.2
18.6
59.3
71.2
0.1
0.1
85.1
22.0
39.0
72.7
0.1
0.1
92.0
27.0
38.4
72.7
0.1
0.1
87.4
29.0
34.8
72.7
0.1
0.1
83.7
30.2
32.1
72.7
0.1
0.1
Valuation
Book Value (INR)
Change (%)
Price-BV (x)
Adjusted BV (INR)
Price-ABV (x)
EPS (INR)
Change (%)
Price-Earnings (x)
Dividend Per Share (INR)
Dividend Yield (%)
E: MOSL Estimates
63.5
19.5
63.2
3.7
21.2
0.6
0.1
74.0
16.6
72.9
3.4
-7.2
0.9
0.2
76.0
2.6
74.7
7.1
107.3
1.2
0.2
92.0
21.1
88.2
9.0
27.6
1.5
0.3
113.4
23.2
4.6
113.4
4.6
11.9
32.0
44.1
1.8
0.3
159.0
40.3
3.3
154.3
3.4
16.4
37.6
32.1
2.5
0.5
178.0
11.9
2.9
171.7
3.1
23.0
40.8
22.8
3.5
0.7
203.4
14.3
2.6
195.9
2.7
30.8
33.7
17.0
4.6
0.9
25 October 2017
7

Disclosures:
The following Disclosures are being made in compliance with the SEBI Research Analyst Regulations 2014 (herein after referred to as the Regulations).
Motilal Oswal Securities Ltd. (MOSL) is a SEBI Registered Research Analyst having registration no. INH000000412. MOSL, the Research Entity (RE) as defined in the Regulations, is engaged in the business of providing Stock
broking services, Investment Advisory Services, Depository participant services & distribution of various financial products. MOSL is a subsidiary company of Motilal Oswal Financial Service Ltd. (MOFSL). MOFSL is a listed
public company, the details in respect of which are available on
www.motilaloswal.com.
MOSL is registered with the Securities & Exchange Board of India (SEBI) and is a registered Trading Member with National Stock
Exchange of India Ltd. (NSE) and Bombay Stock Exchange Limited (BSE), Metropolitan Stock Exchange Of India Ltd. (MSE) for its stock broking activities & is Depository participant with Central Depository Services Limited
(CDSL) & National Securities Depository Limited (NSDL) and is member of Association of Mutual Funds of India (AMFI) for distribution of financial products. Details of associate entities of Motilal Oswal Securities Limited are
available on the website at
http://onlinereports.motilaloswal.com/Dormant/documents/Associate%20Details.pdf
Pending Regulatory Enquiries against Motilal Oswal Securities Limited by SEBI:
SEBI pursuant to a complaint from client Shri C.R. Mohanraj alleging unauthorized trading, issued a letter dated 29th April 2014 to MOSL notifying appointment of an Adjudicating Officer as per SEBI regulations to hold
inquiry and adjudge violation of SEBI Regulations; MOSL requested SEBI to provide all documents, records, investigation report relied upon by SEBI which were referred in Show Cause Notice and also sought personal
hearing. The matter is currently pending.
MOSL, it’s associates, Research Analyst or their relative may have any financial interest in the subject company. MOSL and/or its associates and/or Research Analyst may have beneficial ownership of 1% or more securities in
the subject company at the end of the month immediately preceding the date of publication of the Research Report.
MOSL and its associate company(ies), their directors and Research Analyst and their relatives may; (a)
from time to time, have a long or short position in, act as principal in, and buy or sell the securities or derivatives thereof of companies mentioned herein. (b) be engaged in any other transaction involving such securities and
earn brokerage or other compensation or act as a market maker in the financial instruments of the company(ies) discussed herein or act as an advisor or lender/borrower to such company(ies) or may have any other
potential conflict of interests with respect to any recommendation and other related information and opinions.; however the same shall have no bearing whatsoever on the specific recommendations made by the analyst(s),
as the recommendations made by the analyst(s) are completely independent of the views of the associates of MOSL even though there might exist an inherent conflict of interest in some of the stocks mentioned in the
research report.
Research Analyst may have served as director/officer, etc. in the subject company in the last 12 month period. MOSL and/or its associates may have received any compensation from the subject company in
the past 12 months.
In the last 12 months period ending on the last day of the month immediately preceding the date of publication of this research report, MOSL or any of its associates may have:
a)
managed or co-managed public offering of securities from subject company of this research report,
b)
received compensation for investment banking or merchant banking or brokerage services from subject company of this research report,
c)
received compensation for products or services other than investment banking or merchant banking or brokerage services from the subject company of this research report.
d)
Subject Company may have been a client of MOSL or its associates during twelve months preceding the date of distribution of the research report.
MOSL and it’s associates have not received any compensation or other benefits from the subject company or third party in connection with the research report. To enhance transparency, MOSL has incorporated a Disclosure
of Interest Statement in this document. This should, however, not be treated as endorsement of the views expressed in the report. MOSL and / or its affiliates do and seek to do business including investment banking with
companies covered in its research reports. As a result, the recipients of this report should be aware that MOSL may have a potential conflict of interest that may affect the objectivity of this report. Compensation of Research
Analysts is not based on any specific merchant banking, investment banking or brokerage service transactions.
Terms & Conditions:
This report has been prepared by MOSL and is meant for sole use by the recipient and not for circulation. The report and information contained herein is strictly confidential and may not be altered in any way, transmitted to,
copied or distributed, in part or in whole, to any other person or to the media or reproduced in any form, without prior written consent of MOSL. The report is based on the facts, figures and information that are considered
true, correct, reliable and accurate. The intent of this report is not recommendatory in nature. The information is obtained from publicly available media or other sources believed to be reliable. Such information has not
been independently verified and no guaranty, representation of warranty, express or implied, is made as to its accuracy, completeness or correctness. All such information and opinions are subject to change without notice.
The report is prepared solely for informational purpose and does not constitute an offer document or solicitation of offer to buy or sell or subscribe for securities or other financial instruments for the clients. Though
disseminated to all the customers simultaneously, not all customers may receive this report at the same time. MOSL will not treat recipients as customers by virtue of their receiving this report.
Analyst Certification
The views expressed in this research report accurately reflect the personal views of the analyst(s) about the subject securities or issues, and no part of the compensation of the research analyst(s) was, is, or will be directly or
indirectly related to the specific recommendations and views expressed by research analyst(s) in this report.
RBL Bank
Disclosure of Interest Statement
Analyst ownership of the stock
RBL Bank
No
A graph of daily closing prices of securities is available at
www.nseindia.com, www.bseindia.com.
Research Analyst views on Subject Company may vary based on Fundamental research and Technical Research. Proprietary
trading desk of MOSL or its associates maintains arm’s length distance with Research Team as all the activities are segregated from MOSL research activity and therefore it can have an independent view with regards to
subject company for which Research Team have expressed their views.
Regional Disclosures (outside India)
This report is not directed or intended for distribution to or use by any person or entity resident in a state, country or any jurisdiction, where such distribution, publication, availability or use would be contrary to law,
regulation or which would subject MOSL & its group companies to registration or licensing requirements within such jurisdictions.
For Hong Kong:
This report is distributed in Hong Kong by Motilal Oswal capital Markets (Hong Kong) Private Limited, a licensed corporation (CE AYY-301) licensed and regulated by the Hong Kong Securities and Futures Commission (SFC)
pursuant to the Securities and Futures Ordinance (Chapter 571 of the Laws of Hong Kong) “SFO”. As per SEBI (Research Analyst Regulations) 2014 Motilal Oswal Securities (SEBI Reg No. INH000000412) has an agreement with
Motilal Oswal capital Markets (Hong Kong) Private Limited for distribution of research report in Hong Kong. This report is intended for distribution only to “Professional Investors” as defined in Part I of Schedule 1 to SFO. Any
investment or investment activity to which this document relates is only available to professional investor and will be engaged only with professional investors.” Nothing here is an offer or solicitation of these securities,
products and services in any jurisdiction where their offer or sale is not qualified or exempt from registration. The Indian Analyst(s) who compile this report is/are not located in Hong Kong & are not conducting Research
Analysis in Hong Kong.
For U.S.
Motilal Oswal Securities Limited (MOSL) is not a registered broker - dealer under the U.S. Securities Exchange Act of 1934, as amended (the"1934 act") and under applicable state laws in the United States. In addition MOSL is
not a registered investment adviser under the U.S. Investment Advisers Act of 1940, as amended (the "Advisers Act" and together with the 1934 Act, the "Acts), and under applicable state laws in the United States.
Accordingly, in the absence of specific exemption under the Acts, any brokerage and investment services provided by MOSL, including the products and services described herein are not available to or intended for U.S.
persons. This report is intended for distribution only to "Major Institutional Investors" as defined by Rule 15a-6(b)(4) of the Exchange Act and interpretations thereof by SEC (henceforth referred to as "major institutional
investors"). This document must not be acted on or relied on by persons who are not major institutional investors. Any investment or investment activity to which this document relates is only available to major institutional
investors and will be engaged in only with major institutional investors. In reliance on the exemption from registration provided by Rule 15a-6 of the U.S. Securities Exchange Act of 1934, as amended (the "Exchange Act") and
interpretations thereof by the U.S. Securities and Exchange Commission ("SEC") in order to conduct business with Institutional Investors based in the U.S., MOSL has entered into a chaperoning agreement with a U.S.
registered broker-dealer, Motilal Oswal Securities International Private Limited. ("MOSIPL"). Any business interaction pursuant to this report will have to be executed within the provisions of this chaperoning agreement.
The Research Analysts contributing to the report may not be registered /qualified as research analyst with FINRA. Such research analyst may not be associated persons of the U.S. registered broker-dealer, MOSIPL, and
therefore, may not be subject to NASD rule 2711 and NYSE Rule 472 restrictions on communication with a subject company, public appearances and trading securities held by a research analyst account.
For Singapore
Motilal Oswal Capital Markets Singapore Pte Limited is acting as an exempt financial advisor under section 23(1)(f) of the Financial Advisers Act(FAA) read with regulation 17(1)(d) of the Financial Advisors Regulations and is a
subsidiary of Motilal Oswal Securities Limited in India. This research is distributed in Singapore by Motilal Oswal Capital Markets Singapore Pte Limited and it is only directed in Singapore to accredited investors, as defined in
the Financial Advisers Regulations and the Securities and Futures Act (Chapter 289), as amended from time to time. In respect of any matter arising from or in connection with the research you could contact the following
representatives of Motilal Oswal Capital Markets Singapore Pte Limited:
Disclaimer:
The report and information contained herein is strictly confidential and meant solely for the selected recipient and may not be altered in any way, transmitted to, copied or distributed, in part or in whole, to any other person
or to the media or reproduced in any form, without prior written consent. This report and information herein is solely for informational purpose and may not be used or considered as an offer document or solicitation of
offer to buy or sell or subscribe for securities or other financial instruments. Nothing in this report constitutes investment, legal, accounting and tax advice or a representation that any investment or strategy is suitable or
appropriate to your specific circumstances. The securities discussed and opinions expressed in this report may not be suitable for all investors, who must make their own investment decisions, based on their own investment
objectives, financial positions and needs of specific recipient. This may not be taken in substitution for the exercise of independent judgment by any recipient. Each recipient of this document should make such investigations
as it deems necessary to arrive at an independent evaluation of an investment in the securities of companies referred to in this document (including the merits and risks involved), and should consult its own advisors to
determine the merits and risks of such an investment. The investment discussed or views expressed may not be suitable for all investors. Certain transactions -including those involving futures, options, another derivative
products as well as non-investment grade securities - involve substantial risk and are not suitable for all investors. No representation or warranty, express or implied, is made as to the accuracy, completeness or fairness of
the information and opinions contained in this document. The Disclosures of Interest Statement incorporated in this document is provided solely to enhance the transparency and should not be treated as endorsement of the
views expressed in the report. This information is subject to change without any prior notice. The Company reserves the right to make modifications and alternations to this statement as may be required from time to time
without any prior approval. MOSL, its associates, their directors and the employees may from time to time, effect or have effected an own account transaction in, or deal as principal or agent in or for the securities
mentioned in this document. They may perform or seek to perform investment banking or other services for, or solicit investment banking or other business from, any company referred to in this report. Each of these entities
functions as a separate, distinct and independent of each other. The recipient should take this into account before interpreting the document. This report has been prepared on the basis of information that is already
available in publicly accessible media or developed through analysis of MOSL. The views expressed are those of the analyst, and the Company may or may not subscribe to all the views expressed therein. This document is
being supplied to you solely for your information and may not be reproduced, redistributed or passed on, directly or indirectly, to any other person or published, copied, in whole or in part, for any purpose. This report is not
directed or intended for distribution to, or use by, any person or entity who is a citizen or resident of or located in any locality, state, country or other jurisdiction, where such distribution, publication, availability or use would
be contrary to law, regulation or which would subject MOSL to any registration or licensing requirement within such jurisdiction. The securities described herein may or may not be eligible for sale in all jurisdictions or to
certain category of investors. Persons in whose possession this document may come are required to inform themselves of and to observe such restriction. Neither the Firm, not its directors, employees, agents or
representatives shall be liable for any damages whether direct or indirect, incidental, special or consequential including lost revenue or lost profits that may arise from or in connection with the use of the information.
The
person accessing this information specifically agrees to exempt MOSL or any of its affiliates or employees from, any and all responsibility/liability arising from such misuse and agrees not to hold MOSL or any of its affiliates or
employees responsible for any such misuse and further agrees to hold MOSL or any of its affiliates or employees free and harmless from all losses, costs, damages, expenses that may be suffered by the person accessing this
information due to any errors and delays.
Registered Office Address: Motilal Oswal Tower, Rahimtullah Sayani Road, Opposite Parel ST Depot, Prabhadevi, Mumbai-400025; Tel No.: 022-3980 4263; www.motilaloswal.com. Correspondence Address: Palm Spring
Centre, 2nd Floor, Palm Court Complex, New Link Road, Malad (West), Mumbai- 400 064. Tel No: 022 3080 1000. Compliance Officer: Neeraj Agarwal, Email Id:
na@motilaloswal.com,
Contact No.:022-30801085.
Registration details of group entities.: MOSL: NSE (Cash): INB231041238; NSE (F&O): INF231041238; NSE (CD): INE231041238; BSE (Cash): INB011041257; BSE(F&O): INF011041257; BSE(CD); MSE(Cash): INB261041231;
MSE(F&O): INF261041231; MSE(CD): INE261041231; CDSL: IN-DP-16-2015; NSDL: IN-DP-NSDL-152-2000; Research Analyst: INH000000412. AMFI: ARN 17397. Investment Adviser: INA000007100. Motilal Oswal Asset
Management Company Ltd. (MOAMC): PMS (Registration No.: INP000000670) offers PMS and Mutual Funds products. Motilal Oswal Wealth Management Ltd. (MOWML): PMS (Registration No.: INP000004409) offers wealth
management solutions. *Motilal Oswal Securities Ltd. is a distributor of Mutual Funds, PMS, Fixed Deposit, Bond, NCDs, Insurance and IPO products. * Motilal Oswal Commodities Broker Pvt. Ltd. offers Commodities
Products. * Motilal Oswal Real Estate Investment Advisors II Pvt. Ltd. offers Real Estate products. * Motilal Oswal Private Equity Investment Advisors Pvt. Ltd. offers Private Equity products
25 October 2017
8