9 November 2017
Market snapshot
Equities - India
Close
Chg .%
Sensex
33,219
-0.5
Nifty-50
10,303
-0.5
Nifty-M 100
19,363
-0.6
Equities-Global
Close
Chg .%
S&P 500
2,594
0.1
Nasdaq
6,789
0.3
FTSE 100
7,530
0.2
DAX
13,382
0.0
Hang Seng
11,576
-0.6
Nikkei 225
22,914
-0.1
Commodities
Close
Chg .%
Brent (US$/Bbl)
63
-0.3
Gold ($/OZ)
1,281
0.3
Cu (US$/MT)
6,826
0.5
Almn (US$/MT)
2,090
-1.1
Currency
Close
Chg .%
USD/INR
65.0
0.0
USD/EUR
1.2
0.3
USD/JPY
113.8
-0.4
YIELD (%)
Close
1MChg
10 Yrs G-Sec
6.9
0.0
10 Yrs AAA Corp
7.7
0.0
Flows (USD b)
8-Nov
MTD
FIIs
-0.6
0.1
DIIs
0.5
0.4
Volumes (INRb)
8-Nov
MTD*
Cash
527
451
F&O
8,009
6,713
Note: YTD is calendar year, *Avg
YTD.%
24.8
25.9
34.9
YTD.%
15.9
26.1
5.4
16.6
23.2
19.9
YTD.%
14.5
10.5
23.6
22.7
YTD.%
-4.2
10.0
-2.8
YTDchg
0.4
0.2
YTD
5.6
11.8
YTD*
303
5,565
Today’s top research theme
GST: Rate recalibration likely
Consumers, light electrical and home building may benefit
v
The GST Council in its 23rd meeting, which is scheduled to commence on 10th
November 2017, is likely to make sweeping changes to the GST framework, with
an aim to (i) ease the compliance burden for small businesses and (b) recalibrate
the tax rates on many common-use goods that fall under the 28% slab.
v
We believe that the Council might look to lower rates for items in the consumer,
light electrical and home building sectors.
v
In our view, this should positively impact companies like HUL, GCPL, Nestle, Asian
Paints, Berger Paints, Kansai Nerolac, Titan, Bata, Havells, Crompton Consumer,
Finolex, V Guard, Kajaria Ceramics, Somany Ceramics, Century Ply, and VIP
industries, among others.
Research covered
Cos/Sector
GST
United Spirits (ART)
Shree Cement
Petronet LNG
Pidilite Inds.
Ashok Leyland
Bharat Forge
United Breweries
Dalmia Bharat
GSK Consumer
Castrol India
Muthoot Finance
Other Results
Results Expectation
Key Highlights
Rate recalibration likely; Consumers
Earnings to cash conversion improves
EBITDA beat led by better realization and lower other expenses
EBTIDA significantly above est.; PAT boosted by higher OI
Good margins performance
EBITDA margin 50bp below estimate of 10.6% due to RM inflation
Above est.; strong growth in non-autos drives EBITDA margin
Quarter characterized by multi-year-high double-digit volume growth
In-line quarter; Net debt reduction program on track
Market share continues to decline, schemes impact gross margins
EBITDA beat led by higher volumes and realization
Strong quarter; Asset quality worsens
CESC | ARVND | TMX | RINDL | IRB | JKLC | NELI | VATW | TEAM
AGLL | AMRJ | ARBP | CGPOWER | ENDU | GDPL | HPCL | ICEM | IGL |
JAGP | JSP | PAG | SAIL | SRF | TTMT
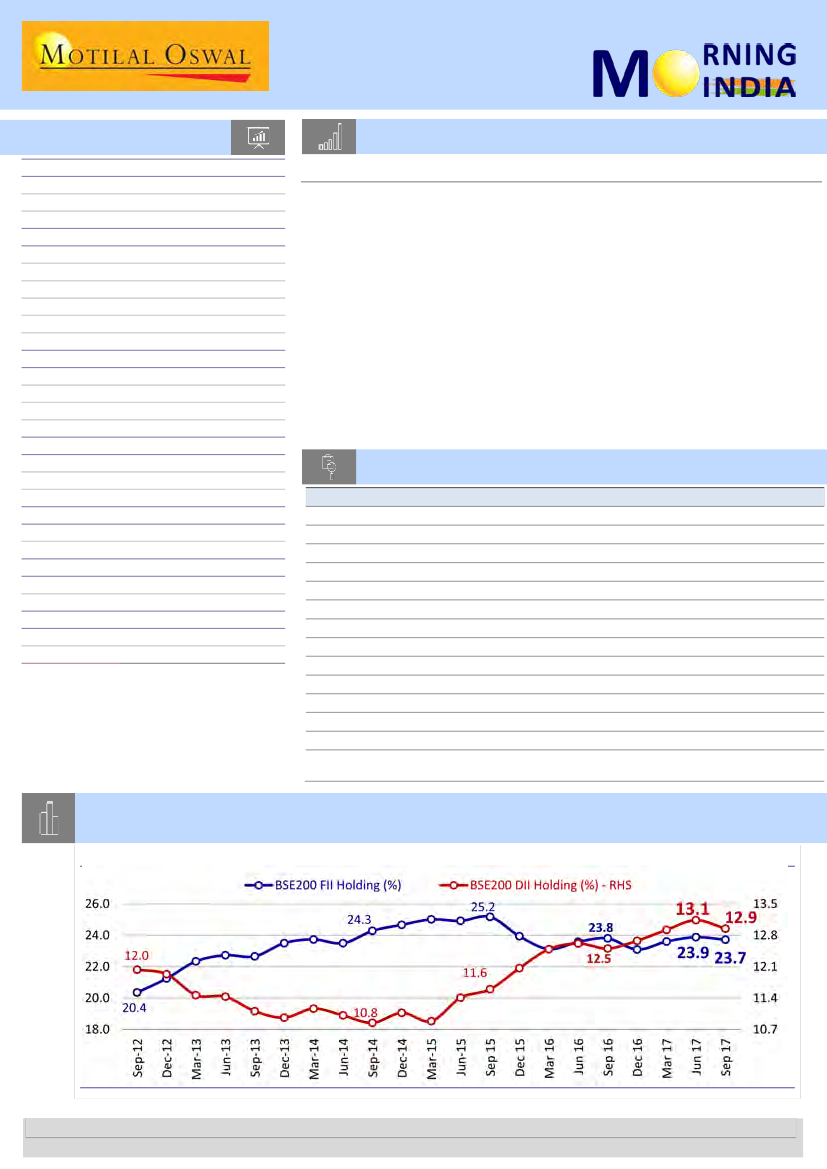
Chart of the Day: Institution holding in BSE-200 companies moderates by 20bp QoQ in
2QFY18
Trend in BSE-200 FII & DII Holding (%)
Research Team (Gautam.Duggad@MotilalOswal.com)
Motilal Oswal research is available on www.motilaloswal.com/Institutional-Equities, Bloomberg, Thomson Reuters, Factset and S&P Capital.
Investors are advised to refer through important disclosures made at the last page of the Research Report.

In the news today
Kindly click on textbox for the detailed news link
1
GST Council meeting begins
today, tax rules revision, GSTN
glitches on agenda
The Goods and Services Tax (GST)
Council is set to further amend tax
rules to fix glitches in the new
indirect tax system and make it
easier for businesses and traders
to settle into it. The move comes
as a tacit admission by the
authorities of the flaws…
2
A mix of tower companies, telecom operators and global private equity
players have evinced initial interest to buy Reliance Communications’
tower unit, Reliance Infratel, two people with direct knowledge of the
matter said. As many as 11 bidders — Indus Towers, ATC, Bharti Infratel,
Reliance Jio Infocomm, Brookfield Infrastructure, Sistema JSFC, Tillman
Global Holdings, TPG Capital, Carlyle Group, I-Squared Capital and
Gateway Partners — have submitted expressions of interest (EoIs) to buy
the whole of Reliance Infratel, they said…
Tower cos, operators, PE cos keen on Reliance Infratel
3
Indian Army builds defence
against outdated technology
In a move that could unlock
defence contracts of more than Rs
25,000 crore, the government is in
the process of amending its
defence procurement manual,
which will enable the armed
forces to procure the latest tech in
a speedy manner…
4
India, EU to hold free trade
talks next week
After months of deadlock, India
and the European Union (EU) chief
trade negotiators will meet next
week in New Delhi to hammer out
a way forward for the long-
pending free trade agreement
negotiations between the two
sides…
5
Reliance Infrastructure set to
bag Rs 1,000 crore NPCI Order
Anil Ambani-led Reliance
Infrastructure is slated to win a Rs
1,000-crore order from Nuclear
Power Corporation of IndiaBSE
0.48 % (NPCI) after emerging as
the lowest bidder for an
engineering and construction
contract for the Kudankulam
plant, people familiar with the
development told ET. NPCI
opened bids for the engineering,
procurement and construction
tenders related to the third and
fourth units of 1,000 MW each of
the Kudankulam nuclear power
project on Tuesday. Reliance Infra
was the lowest bidder, beating
Larsen & Toubro and Tata
Projects, the people said…
6
A consortium of Indian companies
led by ONGC Videsh (OVL) is likely
to acquire a 49 per cent stake in
Russia’s Vankor cluster oilfields
owned by Rosneft by February
2018. While OVL, a fully-owned
subsidiary of state-run Oil and
Natural Gas Corporation, is
expected to hold 26 per cent stake
in the cluster…
7
India eyes record sugar output
in 2018-19
Though these are early days, yet
there is a section within the Indian
sugar industry that has already
started talking of a record sugar
production of almost 29-30 million
tonnes in the 2018-19 crop
marketing year that will start from
October next year. The estimate is
based on the standing sugarcane
crop estimates in some states and
also planting intention by farmers…
India set to buy 49% in Russia
oilfield by Feb
9 November 2017
2

Strategy | 8 November 2017
GST
Refer our latest updates on GST
GST: Rate recalibration likely
Consumers, light electrical and home building may benefit
rd
The GST Council in its 23 meeting, which is scheduled to commence on 10 November
2017, is likely to make sweeping changes to the GST framework, with an aim to (i) ease the
compliance burden for small businesses and (b) recalibrate the tax rates on many
common-use goods that fall under the 28% slab. We believe that the Council might look to
lower rates for items in the consumer, light electrical and home building sectors. In our
view, this should positively impact companies like HUL, GCPL, Nestle, Asian Paints, Berger
Paints, Kansai Nerolac, Titan, Bata, Havells, Crompton Consumer, Finolex, V Guard, Kajaria
Ceramics, Somany Ceramics, Century Ply, and VIP industries, among others.
th
Major overhaul in GST rates expected
n
n
n
n
n
GST has consolidated all indirect taxes into a single umbrella, and categorized
them into four broad slabs (5, 12, 18 and 28%), along with a cess on luxury and
demerit goods such as tobacco, pan masala and aerated drinks.
As of now, 200+ items fall in the 28% slab, which include common-use and
luxury items.
The fitment committee (a panel that proposes GST rates for goods and services)
is preparing a list of items, for which rates could be reduced after assessing
revenue implications.
Our discussions with some of the tax experts highlight that the intent is to
recalibrate the GST rates for (a) common-use items and (b) items manufactured
by SMEs.
By making changes to the GST framework, the Indian government is attempting
to address the concerns facing the SMEs post the implementation of the new
tax system. We believe the reduction in rates will be a significant step toward
tax simplification to support the trader community.
Consumers, light electrical and home building to be major beneficiaries
n
n
We believe that among the items being taxed at 28%, paints, detergents,
shampoo, hair color, coffee, detergent, luggage, footwear, watches, fans,
switches, wires and cables, tiles and plywood may now come under a lower tax
bracket.
This is likely to benefit companies like HUL, GCPL, Nestle, Asian Paints, Berger
paints, Kansai Nerolac, Titan, Bata, Havells, Crompton Consumer, Finolex, V
Guard, Kajaria Ceramics, Somany Ceramics, Century Ply, and VIP Industries,
among others.
9 November 2017
3

Items likely to witness rate reduction
ITEMS
Consumers
COMPANIES
Paints
Detergents
Hair Color
Instant Coffee
Deodorants
Shampoo
Watches
Luggage
Footwear
Light Electricals
v
v
v
v
v
v
v
v
v
Asian Paints, Berger paints, Kansai Nerolac
HUL, Jyoti Labs
Godrej consumers
Nestle, HUL
HUL
HUL
Titan
VIP Industries, Safari
Bata, Relaxo
Fans
Switches
Cables & Wires
Home Building
v
Crompton Consumer, Havells, Orient Electric, Bajaj
Electricals
v
Havells
v
Havells, Finolex Cables, V Guard
Tiles and ceramic items
Wooden furniture – including plywood, veneered
panels and laminated wood
Mattress, Bedding articles and similar
furnishing items
v
Kajaria Ceramics, Somany Ceramics, Asian Granito
v
Century ply, Greenply
v
Bombay Dyeing
Source: MOSL
9 November 2017
4

8 November 2017
A
nnual
R
eport
T
hreadbare
United Spirits’ (UNSP) FY17 annual report analysis highlights net
revenue growth of 4%, driven by premiumization and price
increases, primarily at the standalone level. EBITDA margin
expanded 70bp to 11.4% at the standalone level, but declined 20bp
to 11.2% at the consolidated level. Losses in subsidiaries led to
consolidated PAT (at INR0.9b) being lower than standalone PAT (at
INR1.7b). UNSP recorded impairment loss of INR0.7b (FY16:
INR3.2b) towards investments in the three loss making subsidiaries
(SDL, TDL & PDL) in standalone financials and INR0.4b towards
goodwill in consolidated financials. Aggregate exposure of the
standalone entity towards these loss-making subsidiaries was
INR3.1b (17% of NW). Earnings-to-cash-conversion improved to
86% (FY16: 49%), with lower working capital requirements leading
to an increase in OCF to INR6.5b (FY16: INR2.8b). While D/E
remains high at 2.1x, further monetization of non-core assets
might help deleveraging. Additional inquiry on fund diversion by
the erstwhile promoter management highlights no material future
provisioning.
n
Premiumization and price increase drive operating
profitability:
Standalone net revenue increased 4% to
INR85.5b despite volumes declining 3% due to strategic
decision of franchising the brands and socio-economic
headwinds. Gross margin expanded 160bp to 42.9%, primarily
driven by price increase (90bp) and premiumization. EBITDA
increased 9% to INR9.7b, with EBITDA margin expanding to
11.4% (FY16: 10.7%).
n
Subsidiaries, however, remain a drag; investments impaired:
On an aggregate basis, subsidiaries reported a loss of INR0.9b
(47% of standalone profits) in FY17. Among the subsidiaries
three subsidiaries (SDL, TDL & PDL) remain loss-making, with
accumulated losses of INR5.9b. During FY17, the standalone
entity recognized impairment of INR0.8b (FY16: INR3.8b) in the
investments of the subsidiaries; of this, INR0.7b (FY16:INR3.2b)
pertains to these three subsidiaries.
n
FCF turns positive on reducing capital intensity:
Earnings-to-
cash-conversion improved to 86% (FY16: 45%), with working
capital changes contributing an inflow of INR1.4b against an
outflow of INR5.8b in FY16. This was led by increase in trade
payables and provisions, while receivables increased. FCF post
interest turned positive to INR0.1b (FY16: INR-4.8b) due to
lower finance cost at INR3.8b (FY16: INR4.6b) and capex at
INR2.6b (FY16: INR3b).
n
INR12.2b additional fund diversion reported; already
expensed:
Additional inquiry by the management into alleged
fund diversion by the erstwhile promoter management
concluded, indicating a fund diversion of INR12.2b. UNSP
provided INR217m in FY17 and believes that the remaining
fund diversion amount has already been provided in previous
years. Hence, no additional expenses are foreseen, except for
legal penalties arising, if any.
9 November 2017
UNITED SPIRITS FY17
The
ART
of annual report analysis
Earnings-to-cash-
conversion
improves from 45%
in FY16 to 86%
Ø
Diverted funds
amount to INR12.2b
– already provided
for
INR0.7b of investments in three loss-
making subsidiaries impaired; balance
exposure stands at INR3.1b
Ø
Ø
Auditor’s name
Price Waterhouse & Co. Chartered Accountants LLP
Stock Info
Bloomberg
Equity Shares (m)
52-Week Range (INR)
1, 6, 12 Rel. Per (%)
M.Cap. (INR b) /(USD b)
Avg Val, INRm
Free float (%)
UNSP IN
452
3181 / 1775
25/45/30
444.6/ 6.9
1111
41.5
Jun-17
58.5
4.9
23.3
13.4
Sep-16
58.5
5.0
22.8
13.7
Shareholding pattern (%)
As on
Promoter
DII
FII
Others
Sep-17
58.5
4.4
23.9
13.2
Stock Performance (1-year)
Sandeep Ashok Gupta
(S.Gupta@MotilalOswal.com); +91 22 3982 5544
Mohit Baheti
(Mohit.Baheti@MotilalOswal.com); +91 22 3010 2492
Somil Shah
(Somil.Shah@MotilalOswal.com); +91 22 3312 4975
5

8 November 2017
2QFY18 Results Update | Sector: Cement
Shree Cement
BSE SENSEX
33,219
Bloomberg
Equity Shares (m)
M.Cap.(INRb)/(USDb)
52-Week Range (INR)
1, 6, 12 Rel. Per (%)
Avg Val, INRm
Free float (%)
S&P CNX
CMP:INR18,629
TP:INR21,852(+22%)
Buy
10,303
SRCM IN
EBITDA beat led by better realization and lower other expenses
35
n
Healthy volume growth in north:
2QFY18 volume including clinker rose ~7%
649.3 / 9.7
YoY (-17% QoQ) to 4.88mt, led by healthy growth in north. Pure cement
20560 / 12477
volume rose 11% YoY. However, volume growth was somewhat impacted by
-5/-16/-11
the ongoing sand mining ban in Bihar. Realization increased ~3% YoY (-1%
316
QoQ), higher than our estimate, due to a higher proportion of cement sales to
35.2
clinker. Power units fell 45% YoY to 295m on weak merchant power rates.
Financials & Valuations (INR b)
Y/E Mar
2018E
2019E
Net Sales
99.9
124.7
EBITDA
27.8
35.8
PAT
16.9
17.4
EPS (INR)
486.2
499.3
Gr. (%)
26.5
2.7
BV/Sh (INR)
2,648
3,099
RoE (%)
20.0
17.4
RoCE (%)
18.6
16.5
P/E (x)
38.3
37.3
P/BV (x)
7.0
6.0
2020E
147.6
44.4
26.2
n
751.1
50.4
3,802
21.8
20.7
24.8
n
4.9
Estimate change
TP change
Rating change
n
Revenue rose 4% YoY to INR21.36b (est. of INR20.72b). Cement revenue was
INR20.34b (+10% YoY), with EBITDA of INR5.52b (-14% YoY) exceeding our
estimate due to the incorporation of incentives received as part of revenues
(prior-period EBITDA is restated). Power revenue fell 47% YoY to INR1,025m,
with EBITDA at INR78m (in-line) due to weak merchant power rates.
Healthy realization and lower other expenses drive margin:
EBITDA of
INR5.6b (-20% YoY) exceeded our estimate of INR4.41b due to higher
realization and lower other expenses. Overall margin contracted 7.9pp YoY (-
1.50pp QoQ) to 26.2% due to an increase in YoY unitary costing led by higher
freight and P&F cost, and lower power EBITDA. Tax rate was higher at 47% for
2Q due to the exclusion from MAT rate entitlement for SRCM. Hence, PAT fell
27% YoY to INR2.12b (est. of INR2.79b).
Capex, capacity addition plans:
SRCM is likely to incur INR20b of capex in
FY18, as it is likely to add capacity of 1) 3.6mt of GU in Rajasthan, 2) 2mt of
GU in Bihar, 3) 0.9mt of GU in Bihar and 4) 2.8mt of clinker unit in
Chhattisgarh by March 2018. It is also likely to add 3mt of integrated unit in
Karnataka by 1HFY19.
Deserves premium valuation:
SRCM is the most cost-efficient player in the
industry. Its superior execution capability enables it to achieve RoIC of over
~45% (FY20E). SRCM’s gross-block-to-capacity (GB/capacity) – currently at
~USD53/tonne – has been structurally trending downward, as the
proportion of brownfield expansion has increased. We believe SRCM
deserves to trade at premium valuations and value the cement business at
15.5x FY20E EV/EBITDA (10% premium to peers due to superior ROCE
profile) to arrive at a target price of INR21,852. Maintain
Buy.
FY17
FY18
FY17 FY18E FY18
2Q
3Q
4Q
1Q
2Q
3QE
4QE
2QE
4.57
4.91
5.93
5.89
4.88
5.25
6.62 20.54 22.63
4.94
9.2
4.5
10.7
14.8
6.8
7.0
11.6
10.5
10.2
8.0
4,064 3,699 3,771 4,205 4,170 4,270 4,352 3,825 4,255 3,996
12.3
7.2
13.9
8.3
2.6
15.4
15.4
10.7
11.2
0.8
20,519 18,434 23,803 25,714 21,368 23,122 29,698 84,292 99,903 20,719
19.9
2.2
19.1
17.0
4.1
25.4
24.8
16.5
18.5
3.2
7,013 4,689 5,112 7,133 5,605 6,096 8,983 23,672 27,816 4,406
34.2
25.4
21.5
27.7
26.2
26.4
30.2
28.1
27.8
21.3
4,322 3,176 3,109 2,312 2,253 2,000 2,760 12,147 9,324 2,000
293
411
314
329
380
320
290 1,294 1,318
320
782 1,356 1,510
974
995 1,000 1,031 5,077 4,000 1,200
3,180 2,459 3,199 5,466 3,968 4,776 6,965 15,308 21,174 3,286
0
21
0
0
0
0
0
0
0
0
3,180 2,438 3,199 5,466 3,968 4,776 6,965 15,308 21,174 3,286
265
83
154 1,065 1,850
478
785 1,917 4,235
493
8.3
3.4
4.8
19.5
46.6
10.0
11.3
12.5
20.0
15.0
2,915 2,354 3,045 4,401 2,118 4,298 6,180 13,391 16,939 2,793
2,915 2,375 3,045 4,401 2,118 4,298 6,180 13,391 16,939 2,793
18.3
1.6 -51.4 -13.3 -27.4
81.0 102.9
5.4
26.5
-4.2
Quarterly Performance - Shree Cement (S/A)
Sales Dispat. (m ton)
YoY Change (%)
Realization (INR/Ton)
YoY Change (%)
Net Sales
YoY Change (%)
EBITDA
Margins (%)
Depreciation
Interest
Other Income
PBT before EO Exp
Extra-Ord Expense
PBT
Tax
Rate (%)
Reported PAT
Adj PAT
YoY Change (%)
1Q
5.13
18.0
3,885
11.8
21,987
27.9
7,308
33.2
1,540
276
979
6,471
0
6,471
1,394
21.5
5,077
5,077
106.1
(INR mn)
Var.
(%)
-1
4
3
27
21
21
-24
9 November 2017
6

RESULTS
FLASH
Petronet LNG
BSE SENSEX
33,219
S&P CNX
10,303
8 November 2017
Results Flash | Sector: Oil & Gas
CMP: INR260
n
TP: INR275
Buy
We will revisit our estimates post
earnings call/management
interaction.
EBTIDA significantly above est.; PAT boosted by higher OI
The company reported EBITDA of INR8.9b (est. of INR7.8b; +24% YoY, +21%
QoQ), led by higher utilization at the Dahej and Kochi terminals.
n
PAT stood at INR5.9b (est. of INR4.9b; +28% YoY, +35% QoQ), further boosted
Conference Call Details
by higher other income of INR1b (est. of INR800m; +11% YoY, +44% QoQ).
th
Date:
9 Nov 2017
n
Dahej throughput touched a new high of 210tbtu (est. of 199tbtu; +14% YoY,
Time:
9:45am IST
+14% QoQ), implying 111% utilization on capacity of 15mmt.
Dial-in details:
+91-22-
n
Throughput of 210tbtu includes (in tbtu) – long-term: 127 (+23% YoY, +21%
3960 0663
QoQ), third-party: 79 (+30% YoY, flat QoQ) and pure short term: 4 (-81% YoY,
+433% QoQ, contributing to marketing margins).
n
Kochi throughput stood at 10tbtu (est. of 9.5tbtu; +122% YoY, +78% QoQ),
Financials & Valuations (INR b)
implying 15% utilization on capacity of 5mmt.
Y/E March
2018E 2019E 2020E
Sales
277.6 334.4 339.7
n
Results concall is scheduled on 9
th
November at 9:45am.
EBITDA
32.3
39.4
40.3
Valuation and view:
We will revisit our estimates post the earnings call. The stock
Adj. PAT
21.9
27.1
27.4
Adj. EPS INR
14.6
18.0
18.3
trades at 14.4x FY19E EPS and 9.4x FY19E EV/EBITDA. Maintain
Buy.
EPS Gr. (%)
BV/Sh.(INR)
RoE (%)
RoCE (%)
Payout (%)
Valuation
P/E (x)
P/BV (x)
EV/EBITDA.x
Div. Yld (%)
28.4
64.5
24.7
21.8
28.1
17.8
4.0
12.1
1.3
23.5
77.4
25.4
24.0
28.1
14.4
3.4
9.4
1.7
1.5
90.6
21.8
21.8
28.1
14.2
2.9
8.6
1.7
Standalone - Quarterly Earning Model
Y/E March
Net Sales
YoY Change (%)
EBITDA
Margins (%)
Depreciation
Interest
Other Income
PBT
Tax
Rate (%)
PAT
YoY Change (%)
Margins (%)
Key Assumptions
Regas volume (tbtu)
Sales volume (tbtu)
E: MOSL Estimates
1Q
53,373
-36.3
6,425
12.0
806
556
494
5,556
1,777
32
3,779
115.8
7.1
50.1
118.1
FY17
2Q
3Q
66,144 62,993
-12.3
22.4
7,264
6,071
11.0
9.6
860
1,009
554
517
915
550
6,765
5,095
2,170
1,121
32
22
4,596
3,975
84.7
122.8
6.9
6.3
60.7
128.2
75.3
116.1
4Q
63,651
4.9
6,163
9.7
1,016
469
1,508
6,186
1,478
24
4,708
96.8
7.4
71.1
108.9
1Q
64,351
20.6
7,442
11.6
1,027
465
707
6,658
2,282
34
4,376
15.8
6.8
80.5
111.1
2QE
65,436
-1.1
7,793
11.9
1,078
470
800
7,046
2,114
30
4,932
7.3
7.5
94.3
114.3
(INR Million)
FY18
2QAct Var (%) YoY (%) QoQ (%)
77,702
19%
17%
21%
17.5
8,987
15%
24%
21%
11.6
1,039
-4%
21%
1%
465
-1% -16%
0%
1,019
27%
11%
44%
8,504
21%
26%
28%
2,616
24%
21%
15%
31
5,888
19%
28%
35%
28.1
7.6
79.0
141.0
-16%
23%
30%
10%
-2%
27%
9 November 2017
7

RESULTS
FLASH
08 November 2017
Results Flash | Sector: Consumer
Pidilite
Neutral
BSE SENSEX
33,219
S&P CNX
10,303
CMP: INR767
TP: INR865(+13%)
We will revisit our estimates
post earnings call/management
interaction.
Good margins performance
Conference Call Details
Date:
10 Nov 2017
Time:
05:00pm IST
Dial-in details:
+91-22-3938 1074
th
Financials & Valuations (INR b)
2017 2018E 2019E
Y/E Mar
56.2
58.9
71.0
Net Sales
12.6
13.6
15.5
EBITDA
8.6
9.3
10.6
NP
16.7
18.1
20.6
EPS (INR)
6.7
7.9
14.0
EPS Gr. (%)
79.0
96.1
BV/Sh. (INR) 64.5
28.2
25.2
23.5
RoE (%)
26.8
24.1
22.7
RoCE (%)
45.9
42.5
37.3
P/E
30.5
27.9
24.1
EV/EBITDA
Consolidated performance
n
Reported net sales grew 7.9% YoY to INR15.3b. Reported growth will be
different than actual growth due to the GST accounting effect.
n
Reported consumer bazaar segment revenues were up 1.4% YoY to INR13b,
with segmental EBIT margin up sharply by 530bp YoY to 29.2%. Segment EBIT
grew 24% to INR3.8b. Reported industrial segment revenue declined 6.1% YoY
to INR2.3b, with segmental margin contracting 460bp to 14.4%.
n
Gross margin contracted 50bp YoY to 53%. Staff costs increased 100bp YoY to
12%, while lower other expenses (-340bp YoY to 16.4%) led to EBITDA margin
expansion of 190bp YoY to 24.6%.
n
EBITDA grew 17% YoY to INR3.8b (est. of INR3.6b).
n
Adj. PAT grew 9.6% YoY to INR2.5b (est. of INR2.4b).
Standalone performance
n
Reported net sales grew 11.8% YoY to INR13.6b. Reported growth will be
different than actual growth due to the GST accounting effect.
n
Reported consumer bazaar segment revenues were up 4.8% YoY to INR11.5b,
with segmental EBIT margin up sharply by 670bp YoY to 34.2%. Segment EBIT
grew 30.2% to INR3.9b. Domestic consumer bazaar volumes are likely to have
grown by ~2-3%.
n
Gross margin contracted 10bp YoY to 53.5%. Staff costs increased 70bp YoY to
10.8%, while lower other expenses (-300bp YoY to 15.3%) led to EBITDA margin
expansion of 220bp YoY to 27.3%.
n
EBITDA grew 21.7% YoY to INR3.7b.
n
Adj. PAT grew 15.4% YoY to INR2.6b.
We will review our estimates post the conference call. We currently have a
Neutral
rating on the stock.
(INR Million)
1Q
15,203
-3.1
11,994
3,210
21.1
313
37
432
3,292
1,033
31.4
2,260
-16.7
14.9
FY18
2Q
3QE
4QE
15,299 15,145 13,271
7.9
13.5
2.5
11,538 11,513 10,321
3,761
3,632
2,950
24.6
24.0
22.2
296
316
340
39
30
21
337
272
217
3,763
3,558
2,806
1,245
1,103
780
33.1
31.0
27.8
2,518
2,455
2,026
9.6
21.5
30.8
16.5
16.2
15.3
FY17
56,168
4.8
43,570
12,598
22.4
1,151
139
1,123
12,430
3,851
31.0
8,579
6.7
15.3
FY18E
58,918
4.9
45,366
13,552
23.0
1,264
127
1,259
13,419
4,160
31.0
9,259
7.9
15.7
FY18
2QE
14,531
2.5
10,964
3,568
24.6
318
26
275
3,499
1,085
31.0
2,414
4.6
16.6
Var.
(%)
5.3
Consolidated - Quarterly Earning Model
Y/E March
Net Sales
YoY Cha nge (%)
Tota l Expendi ture
EBITDA
Ma rgi ns (%)
Depreci a ti on
Interes t
Other Income
PBT
Ta x
Ra te (%)
Adj PAT
YoY Cha nge (%)
Ma rgi ns (%)
E: MOSL Estimates
1Q
15,694
6.8
11,754
3,939
25.1
258
35
241
3,887
1,174
30.2
2,713
16.3
17.3
FY17
2Q
3Q
4Q
14,177 13,344 12,954
7.5
-0.3
4.9
10,963 10,477 10,375
3,214
2,866
2,579
22.7
21.5
19.9
303
295
296
26
30
48
324
272
286
3,209
2,814
2,520
912
793
971
28.4
28.2
38.5
2,297
2,020
1,549
11.9
1.5
-7.5
16.2
15.1
12.0
5.4
7.5
4.3
9 November 2017
8

RESULTS
FLASH
Ashok Leyland
BSE SENSEX
33,219
S&P CNX
10,303
8 Nov 2017
Results Flash | Sector: Automobiles
CMP: INR119
n
TP: INR145
Buy
We will revisit our estimates
post earnings call/management
interaction.
EBITDA margin 50bp below estimate of 10.6% due to RM inflation
Net revenue grew 30.8% YoY to INR60.5b, below our estimate of INR61.3b.
n
Revenue growth was led by 22.6% YoY volume growth to 40.98k units;
realization grew 6.7% YoY (-0.8% QoQ) to INR1.47b (our estimate: INR1.49b).
n
AL’s domestic market share declined 110bp QoQ to 33.6% in M&HCVs and
40bp YoY to 7.6% in LCVs as of 2QFY18.
n
EBITDA grew 14% YoY to INR6.1b (our estimate: INR6.5b), led by higher than
expected RM and staff costs. However, impact of the same was diluted by
lower other expenses at INR6.5b (our estimate: INR7.2b).
n
EBITDA margin declined 150bp YoY (expanded 290bp QoQ) to 10.1% (our
estimate: 10.6%).
n
The impact of higher other income at INR557m (our estimate: INR425m) was
partially mitigated by higher effective tax rate at 30.7% (our estimate: 28%),
restricting PAT growth at 13.5% YoY to INR3.3b (our estimate: INR3.8b).
n
We will revisit our estimates post the earnings call.
Key questions for the management
n
Update on CV demand post GST and improvement in truck
movement/efficiencies due to removal of check posts.
n
RM cost guidance and price hikes to mitigate the impact of the same.
n
Discount pressure during 2QFY18 and update on new LCV launches.
n
Update on Hinduja Foundries and its profitability.
Valuation and view:
We will revisit our estimates post the earnings call. The stock
trades at 26.2x FY18E and 22.4x FY19E EPS.
Buy
with a TP of INR145.
FY18
FY17
FY18E
FY18
2Q
3Q
4Q
2QE
40,985 43,417 52,481 145,066 165,368 40,985
22.6
32.2
10.2
3.4
14.0
22.6
1,475 1,483 1,546
1,380
1,502 1,495
6.7
7.8
11.3
2.3
8.8
8.2
60,469 64,378 81,144 200,187 248,369 61,281
30.8
42.5
22.6
5.7
24.1
32.6
71.2
71.0
69.8
69.7
70.4
70.3
8.0
7.0
5.7
7.6
7.4
7.4
10.7
11.3
11.7
11.6
11.6
11.8
6,118 6,889 10,397 22,025 26,465 6,477
10.1
10.7
12.8
11.0
10.7
10.6
557
475
434
1,363
1,850
425
410
275
153
1,554
1,204
300
4,826 5,714 9,313 16,809 21,584 5,262
0
0
0
3,508
126
0
4,826 5,714 9,313 13,301 21,458 5,262
1,484 1,604 2,443
1,070
6,023 1,475
30.7
28.1
26.2
8.0
28.1
28.0
3,342 4,110 6,519 13,447 15,525 3,787
13.5 154.0
52.3
11.6
15.5
28.6
Var.
(%)
0.0
-1.3
-1.3
90bp
60bp
-110bp
-5.5
-50bp
31.0
36.7
-8.3
-8.3
-11.7
Conference Call Details
Date:
9 Nov 2017
Time:
10.00 AM IST
Dial-in details:
3960 0619/ 3940 3977
th
Financials & Valuations (INR b)
2017 2018E
Y/E Mar
Net Sales
200.2 248.4
EBITDA
22.0
26.5
NP
13.3
15.6
EPS (INR)
4.6
5.3
EPS Gr. (%)
8.0
17.2
BV/Sh. (INR)
20.9
23.8
RoE (%)
23.1
23.8
RoCE (%)
21.8
21.0
P/E (x)
26.2
22.4
P/BV (x)
5.7
5.0
2019E
292.2
32.4
20.6
7.0
31.6
28.1
27.0
24.7
17.0
4.2
Quarterly Performance
(INR Million)
Total Volumes (nos)
Growth %
Realizations (INR '000)
% change
Net operating revenues
Change (%)
RM/sales %
Staff/sales %
Other exp/sales %
EBITDA
EBITDA Margins(%)
Other Income
Interest
PBT before EO Item
EO Exp/(Inc)
PBT
Tax
Effective Tax Rate (%)
Adj. PAT
Change (%)
E: MOSL Estimates
1Q
31,165
10.7
1,367
-0.9
42,588
9.7
68.7
8.4
11.6
4,820
11.3
385
338
4,154
0
4,154
1,246
30.0
2,908
130.0
FY17
2Q
3Q
4Q
33,441 32,838 47,622
-10.5
6.2
8.5
1,382 1,375 1,390
4.0
3.4
2.1
46,224 45,163 66,179
-6.9
9.8
10.8
67.8
69.4
71.9
8.0
8.7
6.2
12.6
11.8
10.8
5,365 4,542 7,299
11.6
10.1
11.0
316
258
404
339
453
423
4,146 2,396 6,114
0
0 3,508
4,146 2,396 2,605
1,202
778 -2,157
29.0
32.5
-
2,944 1,618 4,279
14.5
-25.6
-16.5
1Q
28,484
-8.6
1,488
8.9
42,378
-0.5
69.4
10.3
13.0
3,061
7.2
384
366
1,730
126
1,605
492
30.7
1,199
-58.7
9 November 2017
9

8 November 2017
2QFY18 Results Update | Sector: Automobiles
Bharat Forge
Buy
BSE SENSEX
33,219
Bloomberg
Equity Shares (m)
M.Cap.(INRb)/(USDb)
52-Week Range (INR)
1, 6, 12 Rel. Per (%)
Avg Val, INRm
Free float (%)
S&P CNX
10,303
BHFC IN
Above est.; strong growth in non-autos drives EBITDA margin
233
n
Better mix, price hikes lead to operating performance beat:
Revenue
252.5 / 3.9
increased 34% YoY to INR12.6b (est. of INR12.4b), led by tonnage growth of
738 / 383
27% YoY to 58.7MT (est. of 56.8kMT) and realizations growth of 5.9% YoY
8/19/51
(-1.6% QoQ) to INR214.5k/ton (est. of INR219k). A strong recovery in the
932
non-auto segment continued with growth of 78.5% YoY, while the auto
54.3
CMP: INR728
TP: INR844 (+16%)
Financials & Valuations (INR b)
Y/E Mar
2018E 2019E
Net Sales
79.7
91.3
EBITDA
17.1
21.0
PAT
8.9
12.1
EPS (INR)
19.1
26.0
Gr. (%)
46.3
35.9
BV/Sh (INR)
102.4
122.1
RoE (%)
20.1
23.2
RoCE (%)
12.7
15.7
P/E (x)
38.1
28.0
P/BV (x)
7.1
6.0
2020E
105.1
25.3
n
15.7
33.7
29.7
148.3
25.0
18.2
21.6
4.9
Estimate change
TP change
Rating change
n
segment revenue grew ~14% YoY. Domestic/exports revenue grew ~26%
YoY/~56% YoY. EBITDA margin improved 160bp YoY/QoQ to 29.4% (est. of
28.6%), led by operating leverage. Adj. PAT grew 60.5% YoY (+16% QoQ) to
INR2b (est. of INR1.9b), further supported by higher other income.
Key highlights from earnings call:
a) US class 8 truck build is expected to
grow 10-12% (v/s current run-rate of 270-275k). b) BHFC is setting up a Light
Weighting Technology (LWT) facility in AP, which will focus on
aluminum/magnesium components catering to evolving emission norms and
EVs. c) Continued improvement in underlying demand across geographies
and segments to support both autos and non-autos. d) Have secured new
orders of USD40m across segments. e) Ramp-up at recent acquisition Walker
Forge Tenessee (US) with a revenue run-rate of ~USD35m (v/s ~USD27m at
the time of acquisition). f) Appointed Mr Krishnakumar Srinivasan (ex-
President-APAC, Eaton) to head new initiatives.
Valuation view:
A strong order book, coupled with a structural
improvement in business quality driven by a shift toward technology
intensive business, is expected to drive strong ~37% EPS CAGR over FY17-
20E. Valuations stand at 28x/21.6x FY19E/20E EPS. Maintain
Buy
with a TP
of ~INR844 (25x Mar20E consol. EPS).
FY18E
229,185
16.0
218.6
11.8
50,106
29.7
34.8
8.6
27.3
14,694
29.3
1,288
764
3,168
0
12,049
33.5
8,013
43.4
FY18 Variance
2QE
(%)
56,753
3.4
22.8
219.0
-2.1
13.6
12,430
1.2
39.5
35.0
0bp
8.6
-10bp
27.8
-70bp
3,560
3.8
28.6
70bp
260
40.8
165
31.3
800
-2.4
0
2,855
7.3
33.0
50bp
1,913
6.5
50.8
Quarterly Performance (Standalone)
(
INR Million)
Tonnage
Change (%)
Realization (INR '000/ton)
Change (%)
Net operating income
Change (%)
RM/Sales (%)
Staff Cost (% of Sales)
Other Exp. (% of Sales)
EBITDA
EBITDA Margins (%)
Non-Operating Income
Interest
Depreciation
EO Exp / (Inc)
PBT after EO items
Eff. Tax Rate (%)
Adj. PAT
Change (%)
E: MOSL Estimates
1Q
49,098
-5.6
184.2
-15.9
9,044
-20.6
34.4
10.1
28.5
2,444
27.0
256
170
740
0
1,791
31.8
1,221
-37.7
FY17
FY18
FY17
2Q
3Q
4Q
1Q
2Q
3QE
4QE
46,203 47,068 55,189 55,100 58,659 58,072 57,353 197,573
-15.3
-7.2
5.3
12.2
27.0
23.4
3.9
-5.8
192.8 200.5 204.0 217.9 214.5 216.1 226.2
195.6
-6.4
-4.0
5.7
18.3
5.9
7.8
10.9
-4.7
8,909 9,437 11,257 12,008 12,580 12,548 12,971 38,647
-20.7
-11.0
11.3
32.8
34.4
33.0
15.2
-10.2
34.4
32.6
35.1
35.0
35.0
35.3
33.7
34.2
10.1
9.6
9.2
8.9
8.5
8.6
8.5
9.7
27.6
30.2
27.3
28.3
27.1
27.3
26.6
28.3
2,477 2,606 3,200 3,333 3,694 3,625 4,041 10,726
27.8
27.6
28.4
27.8
29.4
28.9
31.2
27.8
309
208
222
259
366
340
322
995
189
183
185
185
217
200
162
728
726
739
744
774
781
800
813
2949
0
0
-380
0
0
0
0
-380
2,321 1,892 2,872 2,633 3,063 2,965 3,388
8,425
25.9
32.0
27.8
33.5
33.5
33.5
33.5
30.6
1,719 1,286 1,801 1,751 2,037 1,972 2,253
5,587
-0.2
-22.8
8.7
43.4
18.5
53.3
25.1
-16.9
9 November 2017
10

RESULTS
FLASH
United Breweries
BSE SENSEX
33,219
S&P CNX
10,303
08 November 2017
Results Flash | Sector: Consumer
CMP: INR1,138
n
TP: INR980
Buy
We will revisit our estimates
post earnings call/management
interaction.
Quarter characterized by multi-year-high double-digit volume growth
Conference Call Details
Date:
9 November
2017
Time:
04:00pm IST
Dial-in details:
+91-22-3025 7103
n
Financials & Valuations (INR b)
2017 2018E
Y/E Mar
Net Sales
47.6
51.6
EBITDA
6.7
7.0
NP
2.3
2.6
EPS (INR)
8.7
9.9
EPS Gr. (%) -23.0
13.9
BV/Sh. (INR) 88.3
96.6
RoE (%)
10.2
10.7
RoCE (%)
9.1
10.0
P/E (x)
131.1 115.1
P/BV (x)
12.9
11.8
2019E
60.3
8.6
3.7
14.0
41.5
108.6
13.6
12.9
81.3
10.5
n
th
n
n
n
n
n
United Breweries’ (UBBL) sales grew 23% YoY to INR12.8b (est. of INR11b) in
2QFY18. Volumes rose 11% YoY (est. of +1%), as against 5% growth for the
industry, implying another quarter of market share expansion. UBBL has now
gained share both in FY17 as well as 1HFY18. Management attributed strong
sales growth to volumes, price increases, a positive state and brand mix, and
beer exports that commenced from 1
st
April 2017.
As part of its parent results last week, Carlsberg had reported a decline in sales
(-1%), but an expansion in market share in its India operations. This means that
UBBL not only gained share at the cost of SABMiller, but also grew ahead of
Carlsberg, which has been the pace-setter in recent years.
In the north region, UBBL’s volumes grew strongly in Delhi, Uttar Pradesh and
Rajasthan. The company saw market share gains in all southern states. Growth
in TN was also off a low base, as UBBL had not received orders in 2QFY17.
Market share growth in east was led by West Bengal and Orissa. In west,
Mumbai and Goa reported healthy growth, while the rest of Maharashtra
continued to struggle because of the highway ban.
Gross margin contracted by only 10bp YoY to 54.1% in 2QFY18.
EBITDA margin expanded 570bp YoY to 17.4% in 2QFY18. Staff costs reduced
by 60bp YoY and other expenses by 520bp YoY, likely led by some operating
leverage. 2Q is usually a weak quarter for both sales and margins. EBITDA
margin of 17.4% in 2QFY18 therefore perhaps represents an all-time 2Q high
for the company. GST was actually expected to lead to deterioration in margins
– while the impact was expected to be far lower than earlier fears, margin
expansion has been a huge surprise. EBITDA grew 83.1% YoY to INR2.21b,
nearly 2x our estimate of INR1.14b.
PAT grew 247% YoY to INR938m (est. of INR297m).
We have a
Buy
rating on the stock. We will review our numbers after the
concall tomorrow.
FY18
2Q
3QE
12,764 11,070
23.1
8.0
10,545
9,802
2,219
1,268
83.1
-3.0
17.4
11.5
650
690
127
80
12
50
1,454
548
0
0
1,454
548
515
179
35.4
32.7
0
0
938
369
246.9
-28.1
7.4
3.3
FY18
2QE
11,045
7.0
9,906
1,138
-4
10.3
667
80
50
441
0
441
144
33
0.0
297
22.6
2.7
Standalone - Quarterly Earning Model
Y/E March
Net Sales
YoY Cha nge (%)
Tota l Expendi ture
EBITDA
YoY Cha nge (%)
Ma rgi ns (%)
Depreci a ti on
Interes t
Other Income
PBT before EO expense
Extra -Ord expens e
PBT
Ta x
Ra te (%)
Mi nori ty Interes t & Profi t/Los s of As s o.
Adj PAT
YoY Cha nge (%)
Ma rgi ns (%)
E: MOSL Es ti ma tes
1Q
15,642
7.5
12,733
2,909
17.1
18.6
637
148
136
2,260
0
2,260
790
34.9
0
1,471
20.4
9.4
FY17
2Q
3Q
10,368 10,250
-3.3
-6.6
9,156
8,942
1,212
1,308
-10.3
-27.3
11.7
12.8
702
698
141
153
8
330
376
787
0
0
376
787
106
274
28.1
34.8
0
0
271
513
-48.1
-28.0
2.6
5.0
4Q
11,127
-8.4
10,116
1,011
-21.3
9.1
833
144
43
76
0
76
9
11.7
0
67
-87.1
0.6
1Q
16,742
7.0
13,559
3,184
9.4
19.0
649
142
63
2,456
0
2,456
837
34.1
0
1,619
10.1
9.7
4QE
10,977
-1.3
10,688
289
-71.4
2.6
765
77
65
-489
0
-489
-182
37.2
0
-307
-556.5
-2.8
FY17
47,387
-2.1
40,947
6,440
-6.9
13.6
2,870
587
516
3,500
0
3,500
1,178
33.7
0
2,321
-22.1
4.9
FY18E
51,554
8.8
44,594
6,960
8.1
13.5
2,754
426
189
3,968
0
3,968
1,349
34.0
4
2,615
12.6
5.1
Variance
15.6%
94.9%
229.3%
215.9%
9 November 2017
11

8 November 2017
2QFY18 Results Update | Sector: Cement
Dalmia Bharat
Buy
BSE SENSEX
33,219
Bloomberg
Equity Shares (m)
M.Cap.(INR b)/(USD b)
52-Week Range (INR)
1, 6, 12 Rel. Per (%)
Avg Val, INRm
Free float (%)
S&P CNX
10,303
DBEL IN
In-line quarter; Net debt reduction program on track
88.8
n
Volume growth led by OCL:
Cement volumes grew 6% YoY to 3.64mt (est. of
264 / 3.9
3.69mt) in 2QFY18, led by volume growth in OCL operations. Pure cement
3085 / 1186
realization was INR4,945/t (-INR151 QoQ /+INR243 YoY), led by lower pricing
4/8/27
in south and east. Revenue thus stood at INR18.3b (-10% QoQ/+7% YoY).
339
n
Sequential decline in EBITDA due to cost push:
EBITDA/t declined 1% YoY
42.0
CMP: INR2,973 TP:INR3,517 (+18%)
Financials & Valuations (INR b)
2018E 2019E
Y/E Mar
Sales
82.9
93.8
EBITDA
20.8
23.2
NP
5.4
7.4
Adj EPS (INR)
60.8
83.7
EPS Gr. (%)
56.8
37.6
BV/Sh. (INR)
617
697
RoE (%)
10.3
12.7
RoCE (%)
9.1
10.3
P/E (x)
48.9
35.5
P/BV (x)
4.8
4.3
2020E
107.2
26.8
9.9
111.7
33.5
804
14.9
11.7
26.6
3.7
n
n
Estimate change
TP change
Rating change
(-13% QoQ) to INR1,213 in 2QFY18, as higher realization was offset by cost
push. Unitary cost/t increased 1% YoY due to higher power & fuel and raw
material cost (higher prices of slag), partially offset by lower other expenses
(-22% YoY). Hence, EBITDA rose 5% YoY to INR4.41b. Interest cost declined
14% YoY, as debt was reduced by INR5.1b in 1HFY18. PAT increased by 3.4x
to INR1.06b, as the tax rate was lower at 31% in 2QFY18 v/s 59% in 2QFY17.
Concall highlights:
(a) Petcoke consumption rate was at USD85/t for 2QFY18
v/s spot prices of USD105/t. (b) Kiln productivity increased by 9% in 2QFY18.
(c) Petcoke consumption at 76% for 2QFY18. (d) Lead distance reduced by
20km to 270km, and is expected to remain at these levels.
Valuation view:
We believe that net debt reduction of ~INR7.5b/INR9.65b in
FY17/1HFY18 will continue into FY19 and that net debt to EBITDA will reduce
below 1.5x in FY19 from 2.8x in FY17. Operating cash flow is likely to
improve strongly, led by margins improvement on the back of its cost-
efficiency program and realization improvement by way of higher proportion
of premium sales. OCL-DBL merger synergy benefits could further improve
cash flow for the company in FY19. We expect valuation multiple for Dalmia
Cement to catch up with large caps, given its improving balance sheet and
earnings CAGR of 43% over FY17-20. We value Dalmia Cement at 13.5x FY20
EV/EBITDA (~10% discount to peers due to ~50% exposure to the southern
market) and arrive at a TP of INR3,517.
FY17
4QE
4.75 15.29
4.4
19.5
5,084 4,843
5.9
-3.3
-0.3
24,149 74,044
10.5
15.5
6,023 19,019
24.9
25.7
1,535 6,027
1,805 8,900
728 2,988
3,412 7,080
0
-131
3,412 7,210
1,174 2,892
34.4
40.1
2,237 4,318
1,812 3,448
4.4 589.9
(INR Million)
FY18E
FY18
2QE Var (%)
16.30
3.69
-1
6.6
8.0
5,089 5,057
0
5.1
3.3
-2.0
82,926 18,677
-2
12.0
11.5
20,833 4,496
-2
25.1
24.1
6,165 1,560
7,796 2,000
3,100
700
9,973 1,636
-97
0
0
9,973 1,636
3,490
523
35.0
32.0
6,482 1,112 11
5,407 1,012 5
56.8 225.5
Quarterly Performance (Consolidated)
Y/E March
FY17
FY18
1Q
2Q
3Q
4Q
1Q
2Q
3QE
Sales Dispatches (m ton)
3.76
3.42
3.56
4.55
3.99
3.64
3.92
YoY Change (%)
21.7
20.0
20.3
17.3
6.1
6.4
10.0
Realization (INR/ton)
4,727 5,010 4,886 4,802 5,129 5,038 5,101
YoY Change (%)
-8.7
0.6
-2.2
-1.4
8.5
0.5
4.4
QoQ Change (%)
-3.0
6.0
-2.5
-1.7
6.8
-1.8
1.3
Net Sales
17,775 17,134 17,393 21,850 20,466 18,337 19,975
YoY Change (%)
11.1
20.8
17.6
15.6
15.1
7.0
14.8
EBITDA
5,084 4,207 4,211 5,517 5,566 4,414 4,830
Margins (%)
28.6
24.6
24.2
25.2
27.2
24.1
24.2
Depreciation
1,338 1,587 1,593 1,509 1,532 1,547 1,550
Interest
2,412 2,291 2,198 1,998 2,117 1,974 1,900
Other Income
766
796
712
715
700
922
750
PBT before EO Expense
2,100 1,125 1,131 2,724 2,617 1,814 2,130
Extra-Ord expense
0
0
0
-139
-267
33
0
PBT after EO Expense
2,100 1,125 1,131 2,863 2,885 1,781 2,130
Tax
911
662
624
704
889
551
852
Rate (%)
43.4
58.9
55.1
24.6
30.8
30.9
40.0
Reported PAT (pre minority)
1,189
463
507 2,159 1,996 1,230 1,278
PAT Adj for EO items
940
311
357 1,736 1,454 1,060 1,178
YoY Change (%)
78.3 149.8
19.2
83.2
54.7 240.8 230.1
9 November 2017
12

8 November 2017
2QFY18 Results Update | Sector: Consumer
GSK Consumer
Upgrade to Neutral
BSE SENSEX
33,219
Bloomberg
Equity Shares (m)
M.Cap.(INRb)/(USDb)
52-Week Range (INR)
1, 6, 12 Rel. Per (%)
Avg Val, INRm/ Vol m
Free float (%)
S&P CNX
10,303
SKB IN
42.1
237.5 / 3.7
5800 / 4650
8/-2/-22
112
27.5
CMP: INR5,467
TP: INR5,400 (-1%)
n
Market share continues to decline, schemes impact gross margins
Financials & Valuations (INR b)
Y/E Dec
2017 2018E 2019E
39.9
42.8
48.1
Net Sales
8.3
8.8
10.1
EBITDA
6.6
6.8
7.7
PAT
156.1 160.8 182.3
EPS (INR)
0.9
3.0
13.4
Gr. (%)
742.4 759.2 856.2
BV/Sh (INR)
22.2
21.4
22.6
RoE (%)
22.2
21.5
22.6
RoCE (%)
35.0
34.0
30.0
P/E (x)
7.4
7.2
6.4
P/BV (x)
n
n
n
Estimate change
TP change
Rating change
GSK Consumer (SKB) posted 3.2% YoY sales growth
(including operating
income) to INR11.2b. EBITDA grew 6.6% YoY to INR2.6b (our estimate:
INR2.3b), while adjusted PAT grew 4.7% YoY to INR1.9b (our estimate:
INR1.75b). Like-to-like GST-adjusted sales grew 4.8% YoY. Like-to-like domestic
sales grew 6% YoY while exports declined 26% YoY. Domestic volumes grew
2.5% YoY (on base of 3% decline in 2QFY17) and price increase was around 4%
(taken in 1QFY18; SKB has not taken price increase since then).
Gross margin shrank 130bp YoY to 64.7%.
High raw material costs along with
higher ad spend (up 50bp YoY to 12.3%) were set off by decrease in other
expenditure (down 210bp YoY to 17.3%) and lower staff costs (down 50bp YoY
to 13.6%). EBITDA margin expanded 70bp YoY to 23.4% in 2QFY18.
Concall highlights:
(1)
Management is working towards attaining double-digit
revenue growth.
(2)
Market share decline has been arrested sequentially, but
YoY as well as over March 2017, share decline continues.
Valuation and view:
SKB remains an inferior business relative to peers, with
category growth showing no signs of recovery to earlier levels. There are also
no indications of market share recovery. Volume growth remains moribund,
despite a weak base quarter after quarter for three years now. With a lower
proportion of rural sales compared to peers, the company does not have any
major tailwind going forward on volumes and earnings. EBITDA and PAT CAGR
of 13-14% over FY18-20E will be significantly inferior to peers and so will RoE of
~22%. We continue to value the core business at ~25% discount to the non-
alcoholic consumer peer valuations of 39.2x (which amounts to 30x) and add
cash per share, as cash earnings to PBT is over 20%. The stock has been a
significant underperformer, with flattish return over the past three years.
However, with the sector re-rating, of late, average consumer peer valuations
have gone up in the last few months, limiting downside. We therefore upgrade
from Sell to Neutral with a target price of INR5,400 (on September 2019E EPS).
(INR Million)
FY18
3Q
-17.0
8,604
-11.5
6,927
1,677
19.5
-9.5
171
6
559
2,059
695
33.8
1,364
-8.3
4Q
-1.0
11,019
2.3
8,848
2,171
19.7
1.5
177
9
710
2,695
936
34.7
1,759
8.4
1Q
0.0
9,853
4.4
8,190
1,664
16.9
-18.3
170
5
557
2,045
723
35.3
1,322
-17.7
2Q
2.5
11,153
3.2
8,540
2,614
23.4
6.6
177
6
550
2,981
1,057
35.5
1,924
4.7
3QE
12.0
9,894
15.0
7,867
2,027
20.5
20.9
172
7
531
2,379
833
35.0
1,547
13.4
FY17
FY18E
FY18
2QE
6.0
10,965
1.5
8,641
2,324
21.2
-5.2
170
7
549
2,697
944
35.0
1,753
-4.6
Var.
(%)
1.7%
Quarterly Performance
Y/E Mar
HFD Volume Growth (%)
Net Sales
YoY Cha nge (%)
Tota l Exp
EBITDA
Ma rgi ns (%)
YoY Cha nge (%)
Depreci a ti on
Interes t
Other Income
PBT
Ta x
Ra te (%)
Adj PAT
YoY Cha nge (%)
E: MOSL Estimates
1Q
-6.0
9,439
-5.2
7,404
2,035
21.6
-0.6
147
6
592
2,474
868
35.1
1,606
2.9
FY17
2Q
-3.0
10,803
-1.1
8,351
2,452
22.7
3.0
148
6
578
2,876
1,039
36.1
1,837
-0.1
4QE
5.0
-6.8
4.5
11,900 39,864 42,801
8.0
-3.6
7.4
9,431 31,530 34,028
2,468 8,335 8,773
20.7
20.9
20.5
13.7
-1.0
5.3
167
642
686
10
28
28
702 2,439 2,340
2,994 10,104 10,399
1,024 3,537 3,636
34.2
35.0
35.0
1,970 6,566 6,763
12.0
-4.5
3.0
12.5%
10.5%
9.8%
9 November 2017
13

8 November 2017
3QCY17 Results Update | Sector: Others
Castrol India
Buy
BSE SENSEX
33,219
Bloomberg
Equity Shares (m)
M.Cap.(INRb)/(USDb)
52-Week Range (INR)
1, 6, 12 Rel. Per (%)
Avg Val, INRm
Free float (%)
S&P CNX
10,303
CSTRL IN
495
195.1/2.9
454/352
5/-20/-30
347.0
49.0
CMP: INR394
n
TP: INR467(+18%)
EBITDA beat led by higher volumes and realization
CSTRL’s 3QCY17 revenue grew 13% YoY (declined 1% QoQ) to INR8.6b (our
estimate: INR8.4b), driven by (a) higher volumes at 49.1m liters (our estimate:
48.5m liters; +8% YoY, -3% QoQ), and (b) better realizations at INR175/liter
(our estimate: INR173/liter; +5% YoY, +3% QoQ).
n
Reported EBITDA of INR2.5b (+19% YoY, +21% QoQ) was significantly above our
estimate of INR2.2b, benefited by sequentially lower raw material cost. EBITDA
margin was 29.4% in 3QCY17 v/s 24.1% in 2QCY17 and 32.5% in 3QCY16.
n
PAT grew 27% YoY and 29% QoQ to INR1.8b (our estimate: INR1.5b), further
aided by higher other income at INR333m (our estimate: INR212m; +115% YoY,
+115% QoQ).
n
Volumes up 7.5% YoY:
CSTRL’s total volumes grew 7.5% YoY, led by double-
digit volume growth in PCMO segment (~45% volume share) and recovery in
CVO segment (~40% volume share).
n
Management has recommended issue of bonus shares by capitalization of free
reserves in the ratio of 1:1.
Valuation and view
n
CSTRL’s >80% payout policy, RoE/RoCE of ~100% and FCF to PAT conversion at
>80% reflect its superior balance sheet and high-quality cash flows, which
warrant higher valuation multiples, in our view.
n
The stock is trading at 29.6x (~10% discount to 3-year average) CY18E EPS of
INR13.3. Our fair value stands at INR467 (35x CY18E EPS), implying 18% upside.
Maintain
Buy.
CY16
2Q
3Q
9,679 7,617
5.2
-2.5
6,535 5,488
3,144 2,129
15.2
0.1
32.5
28.0
149
107
7
1
202
155
3,190 2,176
1,121
778
35
36
2,069 1,398
12.1
-2.4
21.4
18.4
CY17
2Q
3Q
8,704 8,614
-10.1
13.1
6,609 6,078
2,095 2,536
-33.4
19.1
24.1
29.4
118
111
1
2
155
333
2,131 2,756
752
974
35
35
1,379 1,782
-33.3
27.5
15.8
20.7
(INR Million)
CY16 CY17E CY17 Var (%)
3QE
33,608 34,423 8,366
2.3
2.4 10.2
23,655 25,143 6,180
9,953 9,280 2,186
12.8
-6.8
4.1
29.6
27.0 26.1
450
471
115
15
10
4
969
819
212
10,457 9,618 2,279
3,708 3,366
775
35
35
34
6,749 6,252 1,504
15.4
-7.4
7.6
20.1
18.2 18.0
3%
-2%
16%
Financials & Valuations (INR b)
Dec
2016 2017E 2018E
Net Sales
33.6
34.4
35.8
EBITDA
9.9
9.3
9.6
PAT
6.7
6.3
6.6
EPS (INR)
13.6
12.6
13.3
Gr. (%)
5.8
-7.0
5.5
BV/Sh (INR)
12.0
13.2
14.5
RoE (%)
115.0 100.3
96.1
RoCE (%)
115.2 100.4
96.3
P/E (x)
29.0
31.2
29.6
P/BV (x)
32.9
29.8
27.2
Estimate change
TP change
Rating change
Quarterly Performance
Y/E December
Net Sales
YoY Change (%)
Total Expenditure
EBITDA
YoY Change (%)
Margins (%)
Depreciation
Interest
Other Income
PBT
Tax
Rate (%)
PAT
YoY Change (%)
Margins (%)
E: MOSL Estimates
1Q
8,521
7.1
6,005
2,516
34.3
29.5
86
4
223
2,649
925
35
1,724
48.4
20.2
4Q
7,791
-1.2
5,627
2,164
3.4
27.8
108
3
389
2,442
884
36
1,558
10.7
20.0
1Q
8,822
3.5
6,189
2,633
4.7
29.8
123
3
185
2,692
902
34
1,790
3.8
20.3
4QE
8,283
6.3
6,267
2,016
-6.8
24.3
119
4
146
2,039
741
36
1,298
-16.7
15.7
-3%
-50%
57%
21%
26%
18%
9 November 2017
14

RESULTS
FLASH
8 November 2017
Results Flash | Sector: Financials - NBFC
Muthoot Finance
BSE SENSEX
33,219
Bloomberg
Equity Shares (m)
M.Cap. (INR b) / (USD b)
52-Week Range (INR)
1, 6, 12 Rel. Per (%)
12M Avg Val (INR m)
Free float (%)
Financials & Valuations (INR b)
Y/E March
NII
PPP
PAT
EPS (INR)
BV/Sh.(INR)
RoA on AUM %
RoE (%)
Div. Yld. (%)
P/E (x)
P/BV (x)
2018E
36.8
25.0
15.5
38.7
192.4
5.3
21.8
1.6
12.3
2.5
2019E
41.9
28.7
17.7
44.4
226.1
5.4
21.2
1.9
10.7
2.1
2020E
48.0
33.0
20.4
51.1
264.8
5.5
20.8
2.2
9.3
1.8
S&P CNX
10,303
MUTH IN
Strong quarter; Asset quality worsens
399.5
n
2QFY18 PAT grew 53% YoY (+29% QoQ) to INR4.5b (15% beat). Although
190/2.8
revenue came in 31% above estimate, it was largely offset by higher-than-
405 / 170
expected provisioning.
1/22/8
224
n
AUM was flat at INR276b. We note that AUM in east grew 15%/13%
YoY/QoQ to INR22.1b, while that in west, north and south remained
25.5
CMP: INR473
stagnant sequentially.
n
NII grew 52%/36% YoY/QoQ to INR11.5b, largely led by 440bp QoQ
expansion in NIM (calculated) to 17%. This was driven by a 380bp QoQ rise
in calculated yields to 24% and a 100bp decline in cost of funds to 8.8%.
Bank term loans now form 46% (v/s 42% in 2QFY17) of the borrowing mix.
n
We await clarity from management on strong yield performance in 2Q.
n
Branch rationalization and lower employee count led to a 900bp sequential
decline in CIR to 26.4%. Note that this is the second consecutive quarter of
reduction in employee count.
n
Asset quality deteriorated on a sequential basis, with the GNPL ratio almost
doubling to 4.56% (v/s 2.25% in 1QFY18). Provisions made in 2QFY18 were
higher than expected at INR1.2b v/s INR66m in 1QFY18. We await clarity
from management.
n
Average gold loan per branch has been trending upward since FY15 – now at
INR64m (v/s INR50m in 1QFY15).
Valuation view:
Given a stable regulatory regime, benign competition and
supportive gold prices, we expect a favorable outlook for gold financiers. Given
that significant portion of its operating costs is fixed, a growth recovery will
ensure optimum utilization of existing infrastructure, boosting return ratios.
Asset quality too remains stable and write-offs are minimal. However, given that
it is the largest gold finance player by far, it would be difficult for MUTH to
achieve strong growth. We await further details from the conference call on 9
th
November to make a change to our estimates.
9 November 2017
15

RESULTS
FLASH
8 November 2017
Results Flash | Sector: Capital Goods
Voltas
BSE SENSEX
33,219
S&P CNX
10,303
CMP: INR557
n
TP: INR470
sell
We will revisit our estimates
post earnings call/management
interaction.
Beat at operating level on higher-than-estimated UCP sales and margin
Sales grew 7% YoY to INR10.4b, in line with our estimate of INR10.8b
(consensus: INR10.9b). Sales were up 15% YoY (est. of +6%) in UCP segment
and 3% YoY (est. of +12%) in EMP segment. Note that 2QFY18 witnessed weak
restocking for the room aircon industry post GST-related destocking in June;
industry growth was at ~5% in the quarter (sales were up 11% for Lloyd, 5% for
Blue Star and 11% for Hitachi). VOLT has expanded its market share to 23% in
2QFY18 (v/s 22.2% in 1QFY18). Moreover, execution in EMP segment slowed
down, as customers renegotiated contracts under GST.
n
EBITDA increased 25% YoY to INR857m (est. of INR761m; consensus:
INR833m), with the margin at 8.3% (+120bp YoY) v/s our estimate of 7%
(consensus: 7.6%). Employee expenses declined 9% YoY to INR1.5b, while other
expenses fell 18% YoY to INR1b.
n
EBIT margin stood at 12.4% (+90bp YoY) in UCP segment and 5.4% (+530bp
YoY, +10bp QoQ) in EMP segment.
n
Other income stood at INR512m v/s our estimate of INR500m. Tax rate was
27% v/s our estimate of 35%.
n
PAT grew 22% YoY to INR954b v/s our estimate of INR714m (consensus:
INR880m).
n
Order book stood at INR50b; orders booked during the quarter were at
INR6.7b (+75% YoY). The focus on government projects has helped improved
order booking during the quarter.
Valuation view:
We will revisit our estimates post the earnings call. The stock
trades at 32x/28.5x FY18E/19E EPS. Maintain
Sell
with a TP of INR470.
(INR M)
FY17
FY18
FY17
FY18
2Q
3Q
4Q
9,672 11,805 20,351
-7.0
-6.7
9.7
687
890 2,219
6.4
58.0
22.7
7.1
7.5
10.9
63
60
56
33
22
58
658
597
386
0
0
-2
1,249 1,405 2,493
421
437
496
33.7
31.1
19.9
782
815 2,005
20.9
42.2
22.1
782
815 2,003
20.9
47.9
45.7
1Q
2Q
3QE
4QE
19,446 10,367 13,548 24,490 60,328 68,087
5.1
7.2
14.8
20.3
5.5
12.9
2,123
857
930 2,567 5,791 6,711
6.4
24.8
4.5
15.7
33.8
15.9
10.9
8.3
6.9
10.5
9.6
9.9
61
61
65
63
245
250
35
22
20
33
160
110
550
512
450
373 1,998 1,885
-20
0
0
0
11
0
2,596 1,287 1,295 2,843 7,395 8,236
727
343
389
931 2,089 2,388
28.0
26.6
30.0
32.7
28.2
29.0
1,879
954
887 1,863 5,114 5,798
17.7
22.0
8.7
-7.0
38.8
13.4
1,859
954
887 1,863 5,103 5,798
17.1
22.0
8.7
-7.0
42.6
13.6
FY17
Var.
2QE Vs Est
10,798
-4%
11.6
761
13%
10.7
7.0
65
35
500
-
1,161
11%
406
35.0
714
33%
2.5
714
33%
2.5
Conference Call Details
Date:
10 Nov 2017
Time:
3:00m IST
Dial-in details:
+91-22-3960 0894
th
Financials & Valuations (INR b)
2018E 2019E
Y/E Mar
Net Sales
68.1
75.9
EBITDA
6.7
7.4
NP
5.8
6.5
EPS (INR)
17.5
19.5
EPS Gr. (%)
13.4
11.5
BV/Sh. (INR)
112.9 127.3
RoE (%)
16.5
16.3
RoCE (%)
16.1
15.9
P/E (x)
31.8
28.5
P/BV (x)
4.9
4.4
2020E
87.0
8.5
7.4
22.3
14.2
143.8
16.5
16.1
25.0
3.9
Quarterly Performance (Cons.)
Y/E March
Sales
Change (%)
EBITDA
Change (%)
As of % Sales
Depreciation
Interest
Other Income
Extra-ordinary Items
PBT
Tax
Effective Tax Rate (%)
Reported PAT
Change (%)
Adj PAT
Change (%)
E: MOSL Estimates
1Q
18,500
18.7
1,995
52.0
10.8
66
48
357
-9
2,248
651
28.9
1,597
55.7
1,587
54.8
9 November 2017
16

8 November 2017
Results Update | Sector: Utilities
CESC
BSE SENSEX
33,371
Bloomberg
Equity Shares (m)
M.Cap.(INRb)/(USDb)
52-Week Range (INR)
1, 6, 12 Rel. Per (%)
Avg Val, INRm/ Vol m
Free float (%)
S&P CNX
10,350
CESC IN
133
130.4 / 2.0
1080 / 539
-9/-9/45
608
50.1
CMP: INR991
TP: INR1,360(+38%)
Buy
In-line results; Spencer’s sales weak, EBITDA positive
Demerger process on track; maintain Buy
n
Financials & Valuations (INR b)
Y/E Mar
FY17 FY18E FY19E
Net Sales
139.0 148.3 157.7
EBITDA
31.6
36.7
38.5
PAT
6.9
11.8
13.2
EPS (INR)
51.9
88.9
99.3
Gr. (%)
14.7
71.4
11.7
BV/Sh (INR)
797.4 874.3 961.6
RoE (%)
6.5
10.6
10.8
RoCE (%)
7.3
8.4
8.6
P/E (x)
19.0
11.1
9.9
P/BV (x)
1.2
1.1
1.0
n
n
Estimate change
TP change
Rating change
Demerger to unlock value; maintain Buy
CESC’s standalone PAT grew 2.1% YoY to INR2.47b, marginally below estimate.
T&D loss (provisional) declined 100bp YoY (30bp QoQ) to 10.8%. Sales grew 4%
YoY to 2.75BU. Realization was up 2.8% YoY to INR7.57/kWh. The tariff for
FY18 is pending regulatory approval, delaying cost and capex recovery.
However, this was offset by impressive reduction in T&D losses (drives
incentive income) and power exports.
Spencer – sales down, but EBITDA positive on efficiency gains:
Average sales
declined 5% while same-store sales declined 1% YoY, as it continues to face
GST-led disruption. The change in liquor license policy in AP and Telengana,
and renovations at a couple of larger format stores were additional drags.
EBITDA was, however, positive (negative margin of 1.3% in FY17) on various
cost initiatives. Store count and area were unchanged QoQ at 124 and
1,186ksf, respectively. Sales have recovered from October and licensing issue is
resolved in one state. The target is to achieve positive PAT in 4QFY18.
Dhariwal – operations stable:
Dhariwal (600MW) operated at PLF of 43.81%.
The capacity under PPA is operating as expected.
The NCLT-directed shareholder meeting for approval of the demerger is scheduled
on December 15, 2017. The demerger into four separate businesses would drive
value through unlocking the potential of the distribution and retail businesses.
Distribution business will get re-rated on reduced volatility in earnings and cost of
equity. Spencers too will command better valuation after expected turnaround in
FY18. CESC has already received exchange and SEBI approval for demerger. Listing
is likely sometime in March/April 2018. The SOTP value is INR1,360/share. Buy.
Quarterly Performance (Standalone) – INR million
Y/E March
Sales
Change (%)
EBITDA
Change (%)
As of % Sales
Depreciation
Interest
Other Income
Regulatory (inc)/exp
PBT
Tax
Effective Tax Rate (%)
Reported PAT
Adjusted PAT
Change (%)
1Q
20,120
18.1
5,110
32.4
25.4
960
1,150
260
620
2,640
900
34.1
1,740
1,740
14.5
FY17
2Q
3Q
20,160 16,200
13.8
5.3
5,910
3,150
34.9
5.7
29.3
19.4
990
980
1,160
1,080
320
300
600
-960
3,480
2,350
1,060
830
30.5
35.3
2,420
1,520
2,420
1,520
24.1
35.7
4Q
15,720
6.3
2,040
-57.1
13.0
1,160
1,090
590
-3,410
3,790
840
22.2
2,950
2,950
19.0
1Q
21,840
8.5
6,070
18.8
27.8
1,050
1,210
400
1,940
2,270
490
21.6
1,780
1,780
2.3
FY18
2Q
3QE
20,880 16,368
3.6
1.0
5,050
3,975
-14.6
26.2
24.2
24.3
1,080
1,028
1,260
1,197
350
275
-90
0
3,150
2,024
680
445
21.6
22.0
2,470
1,579
2,470
1,579
2.1
3.9
4QE
14,236
-9.4
4,513
121.2
31.7
1,134
1,299
322
-1,850
4,252
958
22.5
3,294
3,294
11.7
FY17
72,200
12.2
16,210
1.4
22.5
4,090
4,480
1,470
-3,150
12,260
2,380
19.4
9,880
8,630
22.1
FY18E
73,324
1.6
19,607
21.0
26.7
4,292
4,966
1,347
0
11,696
2,573
22.0
9,123
9,123
5.7
FY18
2QE
18,869
-6.4
5,253
-11.1
27.8
1,039
1,286
293
0
3,222
709
22.0
2,513
2,513
3.8
Var.
(%)
11
-4
4
-2
19
-2
-2
-2
9 November 2017
17

8 November 2017
Q2FY18 Results Update | Sector: Textiles
Arvind
BSE SENSEX
33,219
Bloomberg
Equity Shares (m)
M.Cap.(INRb)/(USDb)
52-Week Range (INR)
1, 6, 12 Rel. Per (%)
Avg Val, INRm
Free float (%)
S&P CNX
10,303
ARVND IN
Demerger of brands and retail business to create long-term value
258.2
n
GST transition, coupled with high cotton prices, impacts margins:
ARVIND’s
117.5 / 1.8
revenue grew 12% YoY to INR26.3b (est. of INR26.1b) in 2QFY18. Brands and
462 / 322
Retail grew 34% YoY to INR10.3b, while Textiles grew 1% YoY to INR14.4b.
3/-8/-18
645.7
EBITDA declined 9% YoY to INR2,123m (est. of INR2,506m), with the margin
57.1
contracting 190bp to 8.1% (est. of 9.6%) on account of higher raw material
CMP: INR414
TP: INR425(+3%)
Neutral
Financials & Valuations (INR b)
2017 2018E
Y/E Mar
Net Sales
92.4
105.2
EBITDA
9.4
9.1
PAT
3.2
2.7
EPS (INR)
12.4
10.5
Gr. (%)
1.2
-15.0
BV/Sh (INR)
138.1
145.0
RoE (%)
10.3
7.4
RoCE (%)
8.8
6.8
P/E (x)
30.9
36.3
P/BV (x)
2.8
2.6
2019E
121.2
11.5
4.3
16.5
56.5
156.7
10.9
8.8
23.2
2.4
n
n
Estimate change
TP change
Rating change
costs (+300bp to 48.7% of net sales). Adjusted PAT stood at INR632m (est. of
INR835m) v/s INR813m in 2QFY17.
Branded Apparel and Engineering businesses to demerge:
The board has
approved the demerger of (i) Branded Apparel from the parent company to
Arvind Fashions and (ii) Engineering undertaking to Anup Engineering.
Shareholders will be entitled for one equity share of Arvind Fashions for
every five shares of ARVIND, and for one equity share of Anup Engineering
for 27 shares of ARVIND. It is important to note that this is a mirror image
being created, as the number of shares for Arvind Fashions stands at 52m
v/s listed ARVIND at 258.4m shares. Hence, the ratio stands at one new
share of Arvind Fashion for five shares of ARVIND. We believe the demerger
is positive for minority shareholders over the medium-to-long term.
Valuation and view:
We cut FY18/FY19E EBITDA by 10%/8% and
consequently FY18E/FY19E PAT by 18%/12% to factor in lower margins in
Textiles and higher growth in Brands and Retail, which is a lower-margin
business compared to Textiles. While we have cut our margin estimate for
Textiles and value it at 6x FY19E EV/EBITDA, we have increased our multiple
on Brands and Retail to 24x FY19 EV/EBITDA, which we believe is where
Arvind Fashions would trade post its listing, given its strong unique
positioning, future ready portfolio and increasing size of scale. Maintain
Neutral
with a TP of INR425.
9 November 2017
18

RESULTS
FLASH
8 November 2017
Results Flash | Sector: Capital Goods
Thermax
BSE SENSEX
33,219
S&P CNX
10,303
CMP: INR970
n
TP: INR830
Neutral
We will revisit our estimates
post earnings call/management
interaction.
Beat at operating level; orders grow 8% YoY to INR12b
Sales grew 2% YoY to INR8.64b, lower than our estimate of INR9.3b. The miss
in sales was despite Thermax in 1QFY18 losing out on sales of a) INR800m on
GST uncertainty and b) INR350m on exports due to delays at JNPT port. We
were expecting some portion of these lost sales to be booked in 2QFY18.
Gross margin contracted 110bp YoY to 43.7%, likely led by higher RM costs.
EBITDA stood at INR861m (+11 % YoY), with the margin at 10% v/s our
estimate of 9%. Other expenses declined 11% YoY to INR1.8b.
Other income of INR219m was lower than our estimate of INR290m. Tax rate
stood at 36% v/s our estimate of 32% (2QFY17: 32.8%).
PAT stood at INR568m (-5% YoY) v/s our estimate of INR623m.
Subsidiary sales were at INR1.7b; breakeven at PAT level.
Orders stood at INR12b (+8% YoY) and order book at INR48.2b (+23% YoY).
Conference Call Details
Date:
9 Nov 2017
Time:
11:15am IST
Dial-in details:
+91-22-3938 1079
h
n
n
n
n
Financials & Valuations (INR b)
2018E 2019E
Y/E Mar
Net Sales
48.2
51.8
EBITDA
4.8
5.4
NP
3.4
3.8
EPS (INR)
30.1
33.4
EPS Gr. (%)
-2.3
11.0
BV/Sh. (INR)
247.8 272.7
RoE (%)
12.7
12.8
RoCE (%)
13.0
12.9
P/E (x)
30.5
27.5
P/BV (x)
3.7
3.4
2020E
56.7
5.9
4.1
36.3
8.6
299.7
12.7
12.7
25.3
3.1
n
n
Valuation and view:
We will revisit our estimates post the earnings call. The stock
trades at 30.5x/27.5x FY18E/19E EPS. Maintain
Neutral
with a TP of INR830.
Thermax Standalone: Quarterly
Y/E March
Sales
Change (%)
EBITDA
Change (%)
As of % Sales
Depreciation
Interest
Other Income
PBT
Tax
Effective Tax Rate (%)
Reported PAT
Change (%)
Adj PAT
Change (%)
E: MOSL Estimates
1Q
7,914
-22.2
637
-19.1
8.1
168
7
211
673
221
32.8
452
FY17
2Q
3Q
4Q
8,453 8,136 13,428
-21.9 -21.4
3.9
773
806 1,521
-14.7
0.0
22.6
9.1
9.9
11.3
166
157
163
7
6
17
289
206
321
888
850
335
292
283
502
32.8
33.3 150.0
597
566
-167
1Q
7,134
-9.9
429
-32.6
6.0
150
5
222
497
173
34.8
324
FY18
2Q
3Q
4Q
8,639 9,121 16,210
2.2
12.1
20.7
861
966 1,916
11.3
19.8
26.0
10.0
10.6
11.8
150
179
237
38
10
-17
219
180
147
892
957 1,843
323
306
530
36.2
32.0
28.8
568
651 1,313
14.9 (885.7)
651 1,313
14.9
13.1
FY17 FY18E
37,637 42,268
-15.6
12.3
3,738 4,167
-24.5
11.5
9.9
9.9
654
715
36
36
1,027
768
4,074 4,184
1,298 1,333
31.8
31.8
1,448 2,852
(65.4)
2,777
(33.6)
96.9
2,852
2.7
MOSL
2Q Est
9,303
6.8
814
5.3
8.7
179
9
290
916
293
32.0
623
4.4
623
4.4
(INR M)
Var.
Vs Est
-7.1%
5.8%
-2.7%
-8.7%
(19.0) (3.5) (11.1) (114.4)
452
597
566 1,161
(19.0) (3.3)
(8.3)
0.0
(28.3) (4.7)
324
568
(28.3) (4.7)
-8.7%
9 November 2017
19

8 November 2017
2QFY18 Results Update | Sector: Metals
Rain Industries
BSE SENSEX
33,219
Bloomberg
Equity Shares (m)
M.Cap.(INRb)/(USDb)
52-Week Range (INR)
1, 6, 12 Rel. Per (%)
Avg Val, INRm/ Vol m
Free float (%)
S&P CNX
10,303
RINDL IN
336
114.3 / 1.8
352 / 41
83/211/561
286
58.9
CMP: INR340
TP: INR492 (+45%)
Buy
CPC market tailwinds driving strong earnings growth
Raising earnings and target price; Maintaining Buy
Rain Industries (RAIN) reported very strong earnings growth, driven by structural
changes in market dynamics for its carbon business. Consolidated EBITDA increased
49% YoY to INR6.7b, beating our estimate of INR5b by a wide margin, due to both
stronger margins (USD118/t v/s est. of USD85) and volumes (475kt v/s est. of 425kt
CPC volumes) in the carbon business. Chemical division was affected by fire at one
of its plant in Europe, seasonally low demand and higher input prices. Despite
lower prices, margins in the cement business improved due to the benefit of waste
heat recovery and operational improvements. Adj. PAT rose 29% YoY to INR2.5b.
We believe earnings momentum will continue because:
n
Average realized price of CPC at USD337/t is still significantly lower than
USD500-600/t seen during 2010-11. At that time, the key driver of prices was
shortage of key input (GPC). On the other hand, the market is now facing
shortage of CPC, while the GPC market is not as tight. Further, RAIN has
invested in desulfurization plants and mixers, which allow it to use higher sulfur
GPC relative to competitors. Therefore, we believe CPC margins for RAIN will
settle at a higher level than the USD120/t achieved in 2011. We are raising
estimates for CPC volumes by 3%/8%/2% for CY17E/CY18E/CY19E.
n
Similarly, we expect CT Pitch margins to benefit from supply-side correction in
its key market and additional demand from aluminum production ramp-up in
North America and graphite industry. As the 200kt pet tar distillation expansion
project in Europe is on track, we are raising volumes by 9% to 700kt for CY19E.
n
We are also raising the estimates for carbon margins from USD100/t to
USD120/t. As a result, consolidated EBITDA has increased by 17/22/21% for
CY17E/CY18E/CY19E and target price to INR492/sh. (earlier INR362), based on
SOTP. Maintain
Buy.
INR million
CY16
2Q
3Q
4Q
25,315 22,400 23,831
-4
-17
1
4,441 4,536
4,082
17.5
20.2
17.1
1,513 1,430
1,440
862
855
927
322
159
53
2,388 2,410
1,767
162
-224
-933
2,550 2,185
834
987
466
626
38.7
21.3
75.1
1,563 1,719
208
-2
42
64
1,403 1,901
1,077
-12.3
45.7 -1,505.7
1Q
24,680
14
4,414
17.9
1,536
1,366
206
1,718
-670
1,048
400
38.2
647
55
1,263
331.5
CY17
CY16 CY17E
2Q
3Q
4QE
26,371 30,508 32,300 93,164 113,860
4
36
36
-9
22
4,678 6,738 7,302 15,056 23,132
17.7
22.1
22.6
16.2
20.3
1,483 1,463 1,483 5,867 5,964
1,295 1,335 1,175 3,461 5,171
475
256
242
704 1,179
2,375 4,195 4,887 6,432 13,175
0
0
0
-996
-670
2,375 4,195 4,887 5,436 12,505
819 1,662 1,496 1,648 4,377
34.5
39.6
30.6
30.3
35.0
1,556 2,534 3,390 3,788 8,128
41
78
40
69
213
1,515 2,456 3,351 4,715 8,585
8.0
29.2 211.1
46.8
82.1
v/s Est.
3QE
%
28,680
6
28
4,961
36
17.3
1,472
-1
1,111
20
225
13
2,603
61
0
2,603
61
762
118
29.3
1,841
38
40
93
1,801
36
3.3
Financials & Valuations (INR b)
Y/E Dec
2016 2017E 2018E
Sales
113.9 133.9 146.1
EBITDA
23.1
28.6
30.8
NP
8.6
13.1
14.5
Adj. EPS (INR)
25.5
38.9
43.0
EPS Gr(%)
165.2
52.3
10.7
BV/Sh. (INR)
112.7 149.2 189.9
RoE (%)
25.2
29.7
25.4
RoCE (%)
21.3
26.2
26.4
P/E (x)
13.3
8.7
7.9
P/BV
3.0
2.3
1.8
Estimate change
TP change
Rating change
Quarterly Performance (Consolidated)
Y/E December
Net Sales
Change (YoY %)
EBITDA
As % of Net Sales
Interest
Depreciation
Other Income
PBT (before EO Inc.)
EO Income(exp)
PBT (after EO Inc.)
Total Tax
% Tax
Reported PAT
Min. Int. & assc.
Adjusted PAT
Change (YoY %)
1Q
21,617
-15
1,997
9.2
1,484
817
171
-133
0
-133
-432
324.5
299
6
293
-23.9
9 November 2017
20

8 November 2017
2QFY18 Results Update | Sector: Infastructure
IRB Infra
BSE SENSEX
33,219
Bloomberg
Equity Shares (m)
M.Cap.(INRb)/(USDb)
52-Week Range (INR)
1, 6, 12 Rel. Per (%)
Avg Val, INRm
Free float (%)
S&P CNX
10,303
IRB IN
351.5
n
112.3 /1.7
272 / 178
9/-19/-15
532
42.6
CMP:INR237
TP:INR240 (+1)
Results impacted by weak BoT performance
Neutral
Financials & Valuations (INR b)
FY17 FY18E
Y/E March
Net Sales
58.5
58.8
EBITDA
30.5
29.0
NP
7.1
8.0
EPS (INR)
20.3
22.9
EPS Gr. (%)
11.8
12.5
BV/Sh. (INR)
152.9
171.0
RoE (%)
14.0
14.1
RoCE (%)
8.9
9.9
Payout (%)
23.6
21.0
Div. Yield
1.7
1.7
FY19E
n
64.1
31.6
8.2
23.2
1.4
189.4
12.9
11.2
n
20.7
1.7
Estimate change
TP change
Rating change
n
Operating performance below expectations:
IRB’s revenue declined 13%
YoY to INR11.2b, below our estimate of INR13.2b, due to weaker-than-
estimated BoT revenue (led by subdued traffic growth on account of GST
implementation). Operating profit stood at INR5.7b (-19.5% YoY), below our
estimate of INR6.8b. Operating margin shrunk 390bp YoY to 51% due to an
adverse revenue mix (higher contribution from the low-margin construction
business). Adj. profit of INR1.5b missed our estimate of INR1.9b.
BoT revenue impacted by GST:
Toll revenue from continuing projects grew
22% YoY to INR3.9b, supported by a toll hike of 18.5% at the Mumbai-Pune
Express Highway (INR2.1b, +23%). Excluding this, other projects reported
muted revenue growth. Traffic growth was impacted by GST rollout, but has
started picking up since September. Amritsar-Pathankot has been
transferred to IRB InvIT, and IRB booked a profit of INR1.0b on sale of that
asset.
Muted EPC revenue growth:
Due to seasonal weakness, EPC revenue grew
at a muted 3% YoY to INR7.5b. EPC EBIT margin improved 310bp YoY to
31.5% on account of lower contribution from the utility shifting segment,
where margins are weak. IRB has six projects under construction, of which
Solapur-Yedeshi has been almost completed and should commence
commercial operation from 3QFY18. Order book stands robust at INR81.9b;
the company incrementally expects order inflow from the upcoming
finalization of the HAM and ToT projects.
Valuation view:
We maintain
Neutral
on the stock, with a target price of
INR240, valuing the EPC business at INR114 (8x September 2019 EPS), BoT at
INR94 and INR25 for its stake in InvIT.
FY17
FY18
FY17E
FY18E
Mosl
2QFY18
13,169
-13.2
6,321
6,848
52.0
1,150
3,200
300
2,798
0
2,798
900
32.2
2
1,896
1,896
33.4
14.4
Var
-15
-16
Quarterly Performance (Consolidated)
Y/E March
Net Sales
YoY Change (%)
Total Expenditure
EBITDA
Margins (%)
Depreciation
Interest
Other Income
PBT before EO expense
Extra-Ord expense
PBT
Tax
Rate (%)
Min Int & P/Lof Asso. Cos.
Reported PAT
Adj PAT
YoY Change (%)
Margins (%)
1Q
2Q
3Q
4QE
1Q
2Q
3Q
4QE
15,173 12,906 14,109 16,271 18,169 11,227 13,743 15,635 58,459 58,774
36.8
12.3
5.8
5.9
19.7
-13.0
-2.6
-3.9
14.0
0.5
7,434 5,816 6,674 8,053 9,991 5,503 6,597 7,703 27,976 29,793
7,740 7,090 7,435 8,218 8,178 5,724 7,146 7,932 30,483 28,981
51.0
54.9
52.7
50.5
45.0
51.0
52.0
50.7
52.1
49.3
2,207 2,274 1,803 2,264 1,816 1,260 1,050
738
8,548 4,864
3,282 3,396 3,389 3,260 2,854 2,356 3,700 3,838 13,327 12,748
308
336
298
289
535
424
300
285
1,232 1,544
2,558 1,757 2,541 2,983 4,044 2,532 2,696 3,641 9,839 12,913
0
0
0
0
0
1,041
0
0
0
0
2,558 1,757 2,541 2,983 4,044 3,573 2,696 3,641 9,839 12,913
740
335
699
911
1,665 1,225 1,100
876
2,685 4,867
28.9
19.1
27.5
30.5
41.2
34.3
40.8
24.1
27.3
37.7
0
0
0
0
0
2
2
2
8
6
1,818 1,422 1,842 2,072 2,379 2,346 1,594 2,762 7,146 8,040
1,818 1,422 1,842 2,072 2,379 1,503 1,594 2,762 7,146 8,040
10.4
-4.6
8.6
37.1
30.8
5.7
-13.4
33.3
11.8
12.5
12.0
11.0
13.1
12.7
13.1
13.4
11.6
17.7
12.2
13.7
-10
28
24
-21
9 November 2017
21

RESULTS
FLASH
8 November 2017
Results Flash | Sector: Cement
JK Lakshmi Cement
BSE SENSEX
33,219
S&P CNX
10,303
CMP:INR439
TP: INR505 (15%)
Buy
We will revisit our estimates
post earnings call/management
interaction.
Conference Call Details
Date:
13 Nov 2017
Time:
04:00pm IST
Dial-in details:
+91 22 3938 1073
+91-22 3940 3977
th
Financials & Valuations (INR b)
2018E 2019E 2020E
Y/E Mar
33.1
37.3
42.4
Sales
4.5
6.0
7.2
EBITDA
1.1
1.9
2.7
NP
9.7
16.4
23.1
Adj EPS (INR)
125.9 141.2 163.1
BV/Sh (INR)
8.0
12.3
15.2
RoE (%)
7.6
8.8
11.0
RoCE (%)
12.0
7.1
5.1
Payout (%)
Valuations
3.5
3.1
2.7
P/BV (x)
15.2
10.9
9.0
EV/EBITDA (x)
86
88
83
EV/Ton (USD)
EBITDA beat led by higher-than-estimated realizations
n
Sales volume increased 10% YoY to 1.89mt (est. of 1.92mt) in 2QFY18, led by
growth in the eastern units.
n
Revenue grew 18% YoY to INR7.76b (est. of INR7.3b) due to better realization.
n
Realizations stood at INR4,110/ton (+4% QoQ, +8% YoY; est. of INR3,814),
possibly due to the change in commercial terms, as freight cost has also
increased 16% QoQ.
n
EBITDA grew 2% YoY to INR954m (est. of INR 688m), with the margin at 12.3%
(-1.07pp QoQ, -2pp YoY). EBITDA/t stood at INR505 (-7% YoY/-4% QoQ) due to
cost push.
n
Cost/t increased by 10% YoY and 5% QoQ due to an increase in power & fuel
cost/t and freight cost/t.
n
Tax rate was at 30% in 2QFY18 v/s -6.8% in 2QFY17. Hence, PAT stood at
INR132m (-47% YoY) v/s estimate of a loss of INR107m.
Key questions for management
n
Volume guidance for FY18, both for the industry and JKLC.
n
Expected pricing trend over the next few quarters.
n
Likely impact of higher power & fuel and freight costs.
n
Profitability guidance for eastern operations.
Valuation and view:
We will revisit our estimates post the earnings call. Based on
our current estimates, it trades at 11x/9x FY19/FY20E EV/EBITDA. Maintain
Buy
with a target price of INR505 (10x FY20 EV/EBITDA).
Quarterly performance
Y/E March
Sales Dispatches (m ton)
YoY Change (%)
Realization (INR/ton)
YoY Change (%)
QoQ Change (%)
Net Sales
YoY Change (%)
EBITDA
Margins (%)
Depreciation
Interest
Other Income
PBT before EO expense
Extra-Ord expense
PBT
Tax
Rate (%)
Adj PAT
YoY Change (%)
Margins (%)
1Q
2.12
27.9
3,673
2.9
7.7
7,772
31.6
1,175
15.1
412
463
104
404
0
404
118
29.1
286
-244.1
3.7
FY17
2Q
3Q
4Q
1.72
1.84
2.28
-1.7
4.0
6.0
3,816 3,645 3,531
3.3
-0.5
3.5
3.9
-4.5
-3.1
6,556 6,709 8,067
1.5
3.5
9.7
937
826
716
14.3
12.3
8.9
412
443
457
471
486
466
179
152
263
233
49
55
0
0
0
233
49
55
-16
-27
-152
-6.8
-54.5 -274.5
249
76
207
-545.5 -1,433.3 -19.8
3.8
1.1
2.6
1Q
2.29
8.0
3,944
7.4
11.7
9,011
15.9
1,203
13.4
439
492
102
374
0
374
91
24.4
283
-1.2
3.1
FY18
2Q
3QE
4QE
1.89
2.02
2.41
7.97
10.0
10.0
5.5
8.7
4,110 4,210 3,223
3,651
7.7
15.5
-8.7
2.2
4.2
2.4 -23.4
7,767 8,524 7,766 29,104
18.5
27.1
-3.7
11.1
954 1,790
600
3,654
12.3
21.0
7.7
12.6
447
440
456
1,724
489
450
416
1,887
169
100
57
698
188 1,000
-216
742
0
0
0
0
188 1,000
-216
742
56
200
-145
(77)
29.6
20.0
67.3
-10.4
132
800
-71
819
-46.9 953.1 -134.1 -1,694.8
1.7
9.4
-0.9
2.8
(INR Million)
FY17 FY18E
8.61
8.0
3,841
5.2
33,068
13.6
4,548
13.8
1,782
1,847
428
1,347
0
1,347
202
15.0
1,145
39.8
3.5
FY18
2QE Var (%)
1.92
-2
11.0
3,814
8
0.6
-3.3
7,320
6
11.7
688
39
9.4
440
471
100
-123
0
-123
-253
-16
12.8
-107
-143.0
-1.5
9 November 2017
22

RESULTS
FLASH
8 November 2017
Results Flash | Sector: Publishing
Navneet Education
BSE SENSEX
33,219
S&P CNX
10,303
CMP: INR171
n
TP: INR209 (+22%)
Buy
We will revisit our estimates
post earnings call/management
interaction.
Results below estimates, margins contract
NELI’s overall revenue grew 6.3% YoY to INR1,834m (est. of INR2,142m) in
2QFY18, as the stationery business grew by 10% YoY to INR645m and the
publications business by 8% YoY to INR1,180m.
EBITDA margin contracted 100bp YoY to 15.3% (est. of 20%) in 2QFY18. EBITDA
during the quarter remained flat at INR281m (est. of INR428m).
Margin contraction was led by a rise of 330bp YoY in raw material cost to 46%
of sales (est. of 40%) and a 160bp YoY rise in employee cost to 16.4% of sales
(est. of 15.2%).
Consequently, adj. PAT declined 10.5% YoY to INR166m (est. of INR278m).
Financials & Valuations (INR b)
2017 2018E
Y/E Mar
Sales
11.8
13.5
EBITDA
2.8
3.1
NP
1.7
2.0
Adj EPS (INR)
7.3
8.4
EPS Gr. (%)
61.9
15.5
BV/Sh (INR)
29.7
34.4
RoE (%)
26.7
26.3
RoCE (%)
23.9
22.0
Valuations
P/E (x)
P/BV (x)
EV/EBITDA (x)
n
2019E
15.7
3.7
2.4
10.4
23.6
40.4
27.9
24.4
n
n
23.4
5.8
14.7
20.3
5.0
13.2
Key questions for management
n
Export visibility in stationery business and new client addition
n
New series addition in Indiannica
n
Update on deferment of publication of text books in Maharashtra by education
16.4
board
4.2
10.6
Valuation view:
We will revisit our estimates post the earnings call. Based on our
current estimates, at CMP of INR171, the stock trades at 20x/16x P/E on
FY18E/FY19E EPS. Currently, we have a
Buy
rating on the stock.
9 November 2017
23

RESULTS
FLASH
8 November 2017
Results Flash | Sector: Capitals Goods
Va Tech Wabag
BSE SENSEX
33,219
S&P CNX
10,303
CMP: INR588
n
n
n
n
n
TP: INR800
Buy
We will revisit our estimates
post earnings call/management
interaction.
Marginally below estimates at operating level; order book at INR71b (+1%
YoY)
Sales stood at INR8.9b (+14% YoY) v/s our estimate of INR9.7b (consensus:
INR8.83b).
EBITDA stood at INR775m (+34% YoY), with the margin at 8.7% (+120bp YoY)
v/s our estimate of 8.4% (consensus: 7.9%).
Other income was INR2m v/s our estimate of INR26m.
PAT came in at INR334m (+39% YoY) v/s our estimate of INR396m (consensus:
INR310m).
Order book as of 2QFY18 was at INR71b (excluding INR8b of framework
contracts) and orders at ~INR5.8b (-20% YoY).
Wabag overseas sales were at INR3.8b (+17% YoY), EBITDA margin at 5.5%
(+330bp YoY) and PAT at INR19m.
Conference Call Details
Date:
9 Nov 2017
Time:
4:00m IST
Dial-in details:
+91-22-3960 0659
th
Financials & Valuations (INR b)
2018E 2019E
Y/E Mar
Net Sales
39.2
41.8
EBITDA
3.7
4.2
NP
1.9
2.2
EPS (INR)
34.8
39.9
EPS Gr. (%)
16.8
14.8
BV/Sh. (INR)
211.4 245.0
RoE (%)
17.7
17.5
RoCE (%)
16.5
16.3
P/E (x)
17.0
14.8
P/BV (x)
2.8
2.4
2020E
45.3
4.7
2.5
45.7
14.5
283.6
17.3
16.2
14.6
2.4
n
Valuation and view:
We will revisit our estimates post the earnings call. The stock
trades at 17x/14.8x FY18E/19E EPS. Maintain
Buy.
Quarterly Perf. (Cons.)
Y/E March
Sales
Change (%)
EBITDA
Change (%)
As of % Sales
Depreciation
Interest
Other Income
PBT
Tax
Effective Tax Rate (%)
Minority Int
Adj PAT
Change (%)
Extra-ordinary Items
Reported PAT
Change (%)
E: MOSL Estimates
1Q
5,803
27.6
275
-0.8
4.7
46
119
55
165
109
66.3
3.7
52
(155.7)
0.0
52
-155.5
2Q
7,776
31.3
580
24.7
7.5
47
109
19
443
186
42.0
16.7
240
106.7
-4.5
245
105.9
3Q
7,130
16.9
741
68.5
10.4
46
124
53
624
45
7.2
21.9
557
168.2
604.6
-48
167.2
FY17
4Q
11,317
33.3
1,317
16.9
11.6
52
161
3
1,108
326
29.5
24.1
757
16.2
0.0
757
15.8
1Q
6,686
15.2
418
52.2
6.3
45
133
20
259
160
61.7
15.6
84
61.5
0.0
84
61.5
2Q
8,865
14.0
775
33.5
8.7
45
143
2
590
220
37.4
35.2
334
39.0
0.0
334
39.0
3QE
9,282
30.2
938
26.5
10.1
52
145
28
769
292
38.0
2.7
474
(15.0)
0.0
474
-15.0
FY18
FY17 FY18E
4QE
14,338 32,079 39,171
26.7
27.9
22.1
1,602 2,966 3,733
21.7
27.3
25.9
11.2
9.2
9.5
66
191
208
154
526
575
61
112
111
1,443 2,362 3,061
480
667 1,152
33.3
28.2
37.7
(42.7)
70.5
10.9
1,006 1,625 1,897
32.8
83.1
16.8
0.0 600.1
0.0
1,006 1,024 1,897
32.8
11.3
85.2
FY18
2Q
9,668
24.4
810
40.9
8.4
52
140
26
644
245
38.0
2.7
396
68.0
0.0
396
68.0
(INR M)
Var.
Vs Est
-8.3%
-4.4%
-8.4%
-15.7%
-15.7%
9 November 2017
24

8 November 2017
Q2FY18 Results Update | Sector: Others
TeamLease Services
BSE SENSEX
33,219
Bloomberg
Equity Shares (m)
M.Cap.(INRb)/(USDb)
52-Week Range (INR)
1, 6, 12 Rel. Per (%)
Avg Val, INRm
Free float (%)
S&P CNX
10,303
TEAM IN
A
17.1
31.3 / 0.5
n
1,953 / 828
10/56/61
20.2
56.8
n
CMP: INR1,831
TP: INR2,300 (+26%)
Buy
clear reflection of business model strengths
Margin improvement, tax benefits boost PAT:
Revenue grew 21.2% YoY to
INR8.8b (4pp miss). Slowdown in hiring, led by an inward focus of customers
post GST, led to 18% YoY growth in general staffing (v/s 20% in the previous
quarter), which is also visible from the QoQ decline in headcount of ~2,000.
However, EBITDA margin expansion of 20bp YoY to 1.7% and a near-zero tax
rate drove 94% YoY growth in PAT to INR176m (21% beat).
Up on profitability, cash generation:
We deem scale-related margin
benefits and high cash generation to be the key positives of the staffing
business model. Margin expansion in 2Q was a function of [1] associate/core
employee ratio of 210 v/s 186 in the previous year, [2] rise in average mark-
up per employee per month to INR735 (+5% YoY) and [3] 3.2% contribution
of IT staffing v/s 0.7% in 2QFY17; further improvement here could result in a
sustained upward trajectory. In 1HFY18, TEAM generated INR420m of cash
from operations (152% of EBITDA) v/s INR289m in FY17 (65% of EBITDA).
Acquired 40% stake in Schoolguru:
TEAM acquired a 40% stake in
Schoolguru, an online content provider for students, valuing the entity at
INR430m. The acquisition would complement the training business of TEAM,
which includes NETAP, the Skills University and other training services. With
revenue of INR40m, the transaction implies a price of 11x; the entity is
currently not making any profits. With six recent transactions, the pace of
acquisitions has been encouraging.
Valuation view:
We value TEAM using DCF to arrive at a TP of INR2,300,
(26% upside); our TP is up 16% led by higher-than-expected tax benefits. At
37/28x FY18/19E earnings, valuations are rich; we expect a CAGR of
23/33/34% over FY18-20. Sustained superiority of financial performance
because of industry trends, business model and operational excellence
continue strengthening our positive long-term view on TEAM.
Buy.
FY18
2Q
3Q
4Q
8,756 9,382 10,784
21.2
15.2
32.0
8,605 9,215 10,606
151
167
178
1.7
1.8
1.7
20
12
12
3
0
0
44
66
66
173
220
232
-3
0
0
-1.5
0.0
0.0
176
220
232
176
220
232
94.4
91.5 -39.6
2.0
2.3
2.1
FY17E
30,418
21.4
29,976
442
1.5
43
11
224
612
-50
-8.2
663
663
167.3
2.2
FY18E
37,452
23.1
36,825
627
1.7
63
6
234
791
0
-0.1
792
792
19.4
2.1
(INR m)
Est. Var. (% /
2QFY18
bp)
9,121
-4.0
26.2
8,983
-4.2
137
10.2
1.5
12
68.3
0
669.1
70
-36.5
195
-11.3
49
-105.2
25.3
146
20.5
146
20.5
61.3
1.6
Financials & Valuations (INR b)
2017
2018E
Y/E Mar
30.4
37.5
Net Sales
0.4
0.6
EBITDA
0.7
0.8
PAT
38.8
49.2
EPS (INR)
167.6
26.7
Gr. (%)
222.9
272.0
BV/Sh (INR)
19.2
19.9
RoE (%)
19.0
19.8
RoCE (%)
47.2
37.2
P/E (x)
8.2
6.7
P/BV (x)
2019E
45.9
0.8
1.1
66.4
35.1
338.5
21.8
21.7
27.6
5.4
n
Estimate change
TP change
Rating change
n
Cons. - Quarterly Earning Model
Y/E March
Net Sales
YoY Change (%)
Total Expenditure
EBITDA
Margins (%)
Depreciation
Interest
Other Income
PBT
Tax
Rate (%)
Reported PAT
Adj PAT
YoY Change (%)
Margins (%)
E: MOSL Estimates
1Q
6,878
21.4
6,816
62
0.9
10
2
61
110
37
33.4
74
74
48.7
1.1
FY17
2Q
3Q
4Q
7,226 8,147 8,168
12.3
29.1
23.0
7,140 7,999 8,022
86
148
146
1.2
1.8
1.8
10
10
13
3
3
3
70
37
57
143
171
188
52
56
-196
36.7
32.7 -103.9
90
115
384
90
115
384
57.9 132.1 318.7
1.2
1.4
4.7
1Q
8,530
24.0
8,399
130
1.5
20
2
58
166
2
1.3
164
164
122.7
1.9
9 November 2017
25

September 2017 Results Preview | Sector: Logistics
Allcargo
Bloomberg
Equity Shares (m)
M. Cap. (INR b)/(USD b)
52-Week Range (INR)
1,6,12 Rel Perf. (%)
AGLL IN
245.7
42 / 1
207 / 150
2 / -11 / -19
n
n
CMP: INR169
n
TP: INR206 (+22%)
Buy
Financial snapshot (INR b)
Y/E March
2017 2018E 2019E 2020E
Sales
EBITDA
NP
EPS (INR)
EPS Growth (%)
BV/Share (INR)
RoE (%)
RoCE (%)
Payout (%)
Valuations
P/E (x)
P/BV (x)
EV/EBITDA (x)
Div. Yield (%)
17.4
2.3
9.8
1.2
16.6
2.1
9.5
1.2
13.3
1.9
7.6
1.5
12.5
1.7
6.6
1.6
55.7
4.6
2.4
9.8
-3.7
72.9
13.7
12.1
23.2
65.0
4.7
2.5
10.3
4.6
80.7
13.4
11.5
23.1
73.9
5.4
3.2
12.9
25.3
15.1
13.0
22.7
83.7
5.7
3.4
13.7
6.0
14.4
13.0
22.8
n
90.0 100.2
We expect AGLL to report EBITDA of INR1.1b (-13% YoY, +6% QoQ),
led by an improvement in the MTO segment and a subdued
performance at the CFS and P&E segments. We expect PAT of
INR626m (-4% YoY, -1% QoQ) in 2QFY18.
We estimate MTO volumes at 142k TEU (+12% YoY, +3% QoQ) and
CFS volumes at 83k TEU (+5% YoY, +5% QoQ).
We estimate ~7% EBITDA CAGR and ~12% PAT CAGR over FY17-20,
and expect the return ratios to improve from ~13% to ~17%, driven
by margin expansion and reduction in capex intensity.
The stock trades at 13.3x/12.5x FY19E/FY20E P/E and FY19E/FY20E
EV/EBITDA of 7.6x/6.6x. Maintain Buy.
Key issues to watch for
Ø
(a) Volume data and (b) set-up of logistics park in Jhajjar.
Consolidated - Quarterly Earning Model
Y/E March
Net Sales
YoY Change (%)
Total Expenditure
EBITDA
Margins (%)
Depreciation
Interest
Other Income
PBT before EO expense
Extra-Ord expense
PBT
Tax
Rate (%)
Reported PAT
Min. Interest & P& L of Asso. Cos.
Adj PAT
YoY Change (%)
Margins (%)
E: MOSL Estimates
1Q
13,989
-5.2
12,657
1,332
9.5
436
75
59
880
0
880
256
29.1
624
-14
624
-22.8
4.5
FY17
2Q
3Q
14,084
14,052
-3.1
6.0
12,824
13,059
1,261
993
9.0
7.1
434
407
75
78
80
246
832
754
10
63
822
691
178
211
21.7
30.6
643
480
1
12
651
523
5.2
-9.8
4.6
3.7
4Q
13,628
-1.6
12,572
1,056
7.7
386
96
149
724
0
724
131
18.1
593
-20
593
-7.4
4.3
1Q
14,834
6.0
13,805
1,030
6.9
399
83
159
707
0
707
76
10.8
630
-19
630
1.0
4.3
FY18
2QE
3QE
16,042
16,844
13.9
19.9
14,951
15,567
1,091
1,277
6.8
7.6
400
400
80
90
100
120
711
907
0
0
711
907
85
236
12.0
26.0
626
671
-5
-5
626
671
-3.9
28.3
3.9
4.0
4QE
17,266
26.7
15,993
1,274
7.4
425
89
121
881
0
881
308
35.0
573
-39
573
-3.4
3.3
(INR m)
FY17
FY18E
55,753
-0.9
51,112
4,641
8.3
1,662
324
534
3,189
73
3,117
776
24.9
2,340
-22
2,414
-3.7
4.3
64,987
16.6
60,315
4,671
7.2
1,624
342
500
3,206
0
3,206
705
22.0
2,500
-67
2,433
0.8
3.7
9 November 2017
26

September 2017 Results Preview | Sector: Automobiles
Amara Raja Batteries
Bloomberg
Equity Shares (m)
M. Cap. (INR b)/(USD b)
52-Week Range (INR)
1,6,12 Rel Perf. (%)
AMRJ IN
170.8
120 / 2
1075 / 695
-11 / -27 / -45
n
n
n
n
CMP: INR705
n
TP: INR854 (+21%)
Buy
Financial Snapshot (INR b)
Y/E March
2017 2018E 2019E 2020E
Sales
EBITDA
NP
EPS (INR)
EPS Gr. (%)
BV/Sh. (INR)
RoE (%)
RoCE (%)
Valuations
P/E (x)
P/BV (x)
EV/EBITDA (x)
EV/Sales (x)
25.2
4.7
14.1
2.3
27.7
4.1
14.9
1.9
21.5
3.5
11.5
1.6
16.5
3.0
8.8
1.3
53.2
8.5
4.8
28
(2.7)
152
20.3
19.4
61.6
8.0
4.4
26.6
(8.7)
173
15.8
15.0
73.0
10.1
5.6
32.9
28.8
200
17.7
16.9
85.6
12.7
7.3
43.0
30.4
235
19.8
18.9
We expect AMRJ’s revenue to grow 15% YoY (+3% QoQ) to
INR15.5b. AMRJ has taken price hike of ~1-1.5% in automotive
segments to pass on lead inflation costs.
Spot LME lead prices increased ~7.6% QoQ (+~19% YoY) in
2QFY17.
EBITDA margin is likely to contract 410bp YoY (+10bp QoQ) to
13%.
We expect PAT to decline 18.7% YoY to INR1.1b.
We are reducing EPS estimates of FY18E/FY19E by 9.4%/13.2% as
we factor in lead price inflation. The stock trades at 27.7x FY18E
and 21.5x FY19E EPS; Maintain
Buy.
Key issues to watch
Ø
Update on demand environment for OEMs, auto replacement and
industrial battery segments.
Ø
Update on entry into new segments like E-rickshaw, solar and motive
power.
Ø
Outlook for raw material cost trend, recent pricing action.
Ø
Update on capacity expansion plans across product segments.
Ø
Update on progress made on product development in lithium ion
battery space and plans thereof.
Quarterly Performance
Y/E March (INR m)
Net Sales
YoY Change (%)
RM Cost (% of sales)
Staff Cost (% of sales)
Other Exp (% of sales)
EBITDA
Margins (%)
Depreciation
Interest
Other Income
PBT
Rate (%)
Adj PAT
YoY Change (%)
E: MOSL Estimates
1Q
13,081
15.0
65.7
5.0
11.9
2,273
17.4
441
14
90
1,908
31.5
1,307
8.0
FY17
2Q
3Q
13,455
13,280
16.9
9.5
64.3
65.0
5.2
5.4
13.5
14.1
2,297
2,051
17.1
15.4
457
480
15
14
120
133
1,945
1,689
29.9
33.5
1,363
1,123
10.4
-17.9
4Q
13,445
17.4
68.0
5.2
13.0
1,844
13.7
499
15
151
1,480
33.0
992
-9.1
1Q
14,975
14.5
70.0
5.4
11.7
1,929
12.9
544
14
137
1,508
33.7
999
-23.6
FY18
2QE
3QE
15,474
15,538
15.0
17.0
70.0
69.5
5.2
5.1
11.8
12.5
2,006
1,997
13.0
12.9
550
550
14
12
175
190
1,617
1,625
31.5
31.5
1,108
1,113
-18.7
-0.9
FY17
4QE
15,626
16.2
68.7
5.2
12.8
2,084
13.3
598
12
198
1,672
31.4
1,147
15.7
53,172
15.1
65.6
4.7
13.9
8,499
16.0
1,912
58
492
7,022
31.9
4,785
-2.7
FY18E
61,612
15.9
69.5
4.2
11.6
8,016
13.0
2,242
51
700
6,422
32.0
4,367
-8.7
9 November 2017
27

September 2017 Results Preview | Sector: Healthcare
Aurobindo Pharma
Bloomberg
Equity Shares (m)
M. Cap. (INR b)/(USD b)
52-Week Range (INR)
1,6,12 Rel Perf. (%)
ARBP IN
585.9
435 / 7
895 / 504
0 / 4 / -26
n
CMP: INR742
n
Financial Snapshot (INR Billion)
y/e march
2017 2018E 2019E 2020E
Sales
EBITDA
NP
EPS (INR)
EPS Gro. (%)
BV/Sh. (INR)
RoE (%)
RoCE (%)
Valuations
P/E (x)
P/BV (x)
EV/EBITDA (x)
EV/Sales (x)
Dividend Yield (%)
18.9
4.6
13.4
3.1
0.3
16.5
3.7
11.1
2.7
0.3
14.9
3.0
9.9
2.4
0.3
14.1
2.5
8.8
2.1
0.3
150.9 166.8 185.9 205.0
34.3
23.0
39.3
13.5
27.6
19.0
40.9
26.3
44.9
14.3
24.8
19.7
44.6
29.3
50.0
11.3
22.1
18.5
48.2
30.8
52.5
5.1
19.1
16.6
n
n
160.0 202.3 249.8 299.8
We expect Aurobindo (ARBP) to post 14.4% YoY sales growth to
INR43.2b in 2QFY18, on the back of higher growth in the US
business.
We expect US business (~55% of formulation sales) to post robust
growth of 18% YoY in 2QFY18E, primarily on the back of recent
launch of gRenvela in July 2017. Europe and RoW sales are
expected to exhibit growth of 15% YoY, while API sales are
estimated to grow ~8% YoY in 2QFY18E.
EBITDA margin is likely to expand marginally by ~90bp to 25.5%
YoY (+ 260bp sequentially). Overall EBITDA is estimated to
increase by ~18.5% to INR11b. We expect adj. PAT at INR7.1b,
compared to INR6.1b in the corresponding quarter last year.
At CMP, ARBP trades at ~15x FY19E, at >15-20% discount to its
peers. We continue believing that ARBP is well poised to
outperform peers in the current circumstances, led by its strong
US pipeline, diversified product mix (top-25 products account for
~35% of sales) and no pending regulatory issues. ARBP remains
one of our top picks. in the sector, with a target price of INR850
@ 17x FY19E PER.
TP:INR850 (+15%)
Buy
Key issues to watch out
Ø
Debt reduction during the quarter.
Ø
Outlook on the US business (~35-40 launches expected over next 12
months).
Ø
Profitability of acquired Actavis business in Europe.
Y/E March
Quarterly Performance Consolidated
1Q
37,666
14.2
8,890
23.6
1,062
206
159
7,780
-70
7,851
2,008
25.6
-8
5,850
5,790
21.0
15.4
Net Sales
YoY Change (%)
EBITDA
Margins (%)
Depreciation
Interest
Other Income
PBT before EO expense
Extra-Ord expense
PBT
Tax
Rate (%)
Minority Interest
Reported PAT
Adj PAT
YoY Change (%)
Margins (%)
FY17
2Q
3Q
37,755
39,062
12.2
11.7
9,293
8,948
24.6
22.9
1,102
1,111
175
143
83
79
8,098
7,774
-202
-158
8,300
7,932
2,240
2,177
27.0
27.4
3
-31
6,057
5,785
5,913
5,640
21.8
7.4
15.7
14.4
4Q
36,417
-2.8
7,713
21.2
1,001
143
218
6,787
310
6,477
1,172
18.1
-19
5,325
5,560
-0.4
15.3
1Q
36,788
-2.3
8,417
22.9
1,312
169
221
7,157
77
7,080
1,910
27.0
-15
5,186
5,226
-9.7
14.2
FY18E
2QE
3QE
43,201
43,513
14.4
11.4
11,016
10,878
25.5
25.0
1,315
1,315
175
175
150
150
9,676
9,538
0
0
9,676
9,538
2,564
2,528
26.5
26.5
0
0
7,112
7,011
7,112
7,011
20.3
24.3
16.5
16.1
FY17
4QE
43,371
17.4
10,593
24.4
1,304
160
229
9,358
0
9,358
2,459
26.3
0
6,899
6,899
21.9
15.9
(INR Million)
FY18E
150,897
8.1
34,341
22.8
4,276
667
538
29,936
-621
30,557
7,596
24.9
-55
23,015
22,552
13.6
14.9
166,846
10.6
40,877
24.5
5,246
679
750
35,703
0
35,703
9,461
26.5
-55
26,296
26,296
14.3
15.8
9 November 2017
28

September 2017 Results Preview | Sector: Capital Goods
CG Power and Industrial
Bloomberg
Equity Shares (m)
M. Cap. (INR b)/(USD b)
52-Week Range (INR)
1,6,12 Rel Perf. (%)
CGPOWER IN
626.8
50 / 1
97 / 56
-5 / -5 / -10
CMP: INR81
n
n
TP: INR80 (-1%)
Neutral
Financial Snapshot (INR b)
Y/E March
2017 2018E 2019E 2020E
Net Sales
EBITDA
Adj. PAT
EPS(INR)
EPS Gr. (%)
BV/Sh. (INR)
RoE (%)
RoCE (%)
Payout (%)
Valuations
P/E (x)
P/BV (x)
EV/EBITDA (x)
Div Yield (%)
* Consolidated
27.1
1.2
11.5
0.8
24.0
1.2
11.1
0.3
19.9
1.1
10.1
0.4
16.0
1.0
8.8
0.5
61.2
4.7
-4.2
2.9
-18.6
65.6
4.2
6.8
-7.7
64.4
4.9
2.1
3.3
13.0
68.6
6.1
7.8
7.7
69.1
5.2
2.5
4.0
20.5
72.2
6.3
6.9
7.7
76.8
5.9
3.1
4.9
24.2
76.7
7.3
7.6
7.7
n
n
n
n
During the quarter, CG Power has accepted the binding offer for
sale of assets of its business in Hungary for an EV of EUR38m.
The management intends to monetize ~INR10b of non-core assets,
including additional land at Kanjurmarg, to lower standalone
business debt.
We expect consolidated revenue to grow 7% YoY to INR14.2b in
2QFY18.
Operating profit is expected to improve 37% YoY to INR1.1b, led by
better product mix. EBIDTA margin should improve 170bp YoY to
8.2%.
We estimate net profit at INR587m, as against INR469m in 2QFY17.
Maintain Neutral.
Key issues to watch
Ø
Lowering of debt in demerged business through asset sales.
Quarterly performance (Consolidated)
1Q
15,234
48.3
1,365
-1,100.1
9.0
381
304
155
0
835
150
18.0
2.4
682
682
(209.0)
FY17
2Q
3Q
13,233
12,441
-7.4
10.6
844
833
-34.8
-10.8
6.4
6.7
356
341
439
509
502
306
-573
-717
-22
-427
78
-117
-356.6
27.4
4.1
3.9
-104
-314
469
402
(6.0)
(25.6)
4Q
17,101
-7.6
1,181
-23.7
6.9
438
625
232
-4,816
-4,465
-31
0.7
6.3
-4,440
376
(64.4)
1Q
14,364
-5.7
451
-66.9
3.1
361
537
118
-379
-707
146
-20.6
7.0
-860
-481
(170.5)
FY18
2QE
3QE
14,174
16,107
7.1
29.5
1,159
1,164
37.3
39.7
8.2
7.2
338
338
361
390
220
238
-125
-135
554
538
88
88
15.9
16.3
3.6
3.4
462
447
587
582
25.3
44.8
4QE
19,783
15.7
2,118
79.3
10.7
315
157
305
139
2,089
73
3.5
6.3
2,010
1,871
397.7
(INR Million)
FY17
FY18E
61,198
9.4
4,702
9.3
1,500
1,880
687
2,009
166
8.3
15.7
1,827
1,827
(18.6)
64,429
5.3
4,892
4.0
1,352
1,446
880
2,974
394
13.3
15.7
2,564
2,564
40.3
Sales (Net)
Change (%)
EBITDA
Change (%)
As of % Sales (Adj.)
Depreciation
Interest
Other Income
EO Income/(Exp)
PBT
Tax
Effective Tax Rate (%)
Minority interest
Reported PAT
Adjusted PAT
Change (%)
9 November 2017
29

September 2017 Results Preview | Sector: Automobiles
Endurance Technologies
Bloomberg
Equity Shares (m)
M. Cap. (INR b)/(USD b)
52-Week Range (INR)
1,6,12 Rel Perf. (%)
ENDU IN
140.7
148 / 2
1075 / 518
4/30/-
n
n
n
n
n
CMP: INR1,055 TP: INR1,229(+16%)
n
Buy
Financial Snapshot (INR Billion)
Y/E March
2017 2018E 2019E 2020E
Sales
EBITDA
NP
Adj EPS (INR)
EPS Gr. (%)
BV/Sh. (INR)
RoE (%)
RoCE (%)
Valuations
P/E (x)
P/BV (x)
EV/EBITDA (x)
EV/Sales (x)
44.9
20.0
20.8
15.6
35.6
16.9
21.8
18.3
26.9
14.0
24.0
21.4
21.5
11.6
25.0
23.4
55.9
7.6
3.3
23.5
9.9
20.8
15.6
63.7
8.9
4.2
29.6
26.2
21.8
18.3
72.7
10.6
5.5
39.3
32.6
24.0
21.4
84.1
12.6
6.9
49.2
25.1
25.0
23.4
122.9 148.3 179.1 213.4
We expect 12.2% YoY (+4.8% QoQ) growth in consolidated
revenue to INR16.3b, led by strong performance in domestic and
exports subsidiary.
Consolidated EBITDA is expected to grow 12.4% YoY (+5.6% QoQ),
led by healthy growth in standalone performance.
EBITDA margin is likely to remain flat YoY and expand 11bp QoQ
to 13.9%.
We expect PAT to grow 21.2% YoY (+12.1% QoQ) to INR1.08b.
We upgrade FY18 and FY19 EPS by 1.2% and 3.6%, respectively.
The stock trades at 35.6x FY18E EPS and 26.9x FY19 EPS. Maintain
Buy.
Key issues to watch for
Ø
Update on capacity expansion plan at Chennai plant and investment
thereof.
Ø
Ø
Ø
Ø
Update on ramp-up of business with key customers like RE, HMSI and
Yamaha.
Supply contract of EV components with other OEMs (apart from
Porsche)
Update on new suspension products and ABS (recent tie-up with BWI).
EU business: level of ramp-up at new plant in Germany.
Consolidated - Quarterly
Y/E March
(INR Million)
Net Sales
YoY Change (%)
RM Cost (% of sales)
Staff Cost (% of sales)
Other Expenses (% of sales)
EBITDA
Margins (%)
Depreciation
Interest
Other Income
PBT
Eff. Tax Rate (%)
Adj. PAT
YoY Change (%)
1Q
14,402
13.3
58.4
9.8
18.9
1,865
13.0
684
104
89
1,166
24.5
880
15.2
FY17
2Q
3Q
14,482
13,203
7.5
2.4
57.8
57.8
8.9
10.5
19.4
18.3
2,008
1,769
13.9
13.4
699
741
81
88
54
73
1,281
1,014
30.3
26.7
893
743
14.8
13.6
4Q
13,803
4.8
57.4
9.9
18.9
1,898
13.8
781
49
119
1,186
29.6
835
3.3
1Q
15,503
7.6
59.0
9.5
17.6
2,136
13.8
742
57
60
1,397
30.9
965
9.7
FY18
2QE
3QE
16,250
15,680
12.2
18.8
59.9
58.5
9.0
9.6
17.3
17.8
2,256
2,202
13.9
14.0
760
790
57
57
95
110
1,534
1,465
29.5
30.1
1,082
1,024
21.2
37.8
4QE
16,246
17.7
58.3
9.5
17.8
2,326
14.3
825
56
120
1,565
30.0
1,095
31.1
FY17
55,880
6.8
57.7
9.8
19.0
7,555
13.5
2,905
322
319
4,646
28.9
3,303
9.9
FY18E
63,679
14.0
58.9
9.4
17.6
8,920
14.0
3,117
226
385
5,961
30.1
4,168
26.2
9 November 2017
30

September 2017 Results Preview | Sector: Logistics
Gateway Distriparks
Bloomberg
Equity Shares (m)
M. Cap. (INR b)/(USD b)
52-Week Range (INR)
1,6,12 Rel Perf. (%)
GDPL IN
108.6
26 / 0
292 / 209
10 / -11 / -20
CMP: INR241
n
n
TP: INR280 (+16%)
Buy
Financial Snapshot (INR Billion)
Y/E March
2017 2018E 2019E 2020E
Sales
EBITDA
NP
EPS (INR)
EPS Gr. (%)
BV/Sh (INR)
RoE (%)
RoCE (%)
Payout (%)
Valuations
P/E (x)
P/BV (x)
EV/EBITDA (x)
Div. Yield (%)
35.4
2.6
12.2
2.9
27.4
2.5
12.0
1.7
19.8
2.3
9.4
2.4
15.1
2.2
7.0
3.5
11.6
2.2
0.7
6.8
-40.2
93.6
7.3
10.0
120.7
12.0
2.2
1.0
8.8
29.1
9.2
9.7
54.0
14.3
2.8
1.3
12.2
38.7
12.1
13.5
56.9
17.3
3.7
1.7
15.9
30.7
15.0
18.0
62.1
n
n
We expect GDPL to report net sales of INR3b (+6% YoY, +14%
QoQ), led by higher volumes in Rail businesses.
We estimate EBITDA at INR513m (-12% YoY, +14% QoQ) and
EBITDA margin at 16.9%. We estimate adjusted PAT at INR181m
(+5% YoY, +36% QoQ).
The stock trades at 19.8x FY19E EPS of INR12.2 and 9.4x FY19E
EV/EBITDA.
GDPL remains a direct play on the upcoming dedicated freight
corridor project, which will multiply its asset turnover and
significantly improve profitability. Maintain Buy.
97.7 102.9 108.9
Key issues to watch for
Ø
Volume growth, realization and per TEU profitability.
Quarterly Performance
Y/E March
FY17
FY18
(Consolidated)
1Q*
2Q*
3Q*
4Q*
1Q*
2QE
3QE
Net Sales
2,782
2,857
2,876
3,077
2,661
3,035
3,089
YoY Change (%)
5.9
10.1
7.7
19.5
-4.4
6.2
7.4
Total Expenditure
2,227
2,276
2,289
2,554
2,211
2,522
2,493
EBITDA
555
581
587
523
450
513
595
Margins (%)
19.9
20.3
20.4
17.0
16.9
16.9
19.3
YoY Change (%)
-20
-9
-5
-8
-19
-12
1
Depreciation
195
194
192
189
202
212
212
Interest
51
88
50
61
24
71
70
Other Income
40
80
59
59
6
51
51
PBT
349
379
403
332
229
281
365
Tax
124
127
146
109
49
66
81
Rate (%)
35.6
33.6
36.2
32.8
21.5
23.6
22.3
PAT before minority / profit of assoc.
225
252
257
223
180
215
284
YoY Change (%)
13.0
-15.0
-11.9
-5.6
-20.1
-14.7
10.4
Margins (%)
8.1
8.8
8.9
7.3
6.8
7.1
9.2
Less: Minority/Add: Profit of Asso.
39
79
54
31
47
34
34
Reported PAT
186
173
203
192
133
181
250
Adj PAT
186
173
203
192
133
181
250
YoY Change (%)
-47.8
-43.5
-34.3
-27.5
-28.7
4.9
23.1
Margins (%)
6.7
6.0
7.1
6.2
5.0
6.0
8.1
E: MOSL Estimates, *Indicates addition of Rail and CFS details as provided and not actual consolidated number
4QE
3,194
3.8
2,526
668
20.9
28
218
-72
24
546
131
24.0
415
86.1
13.0
54
362
362
88.6
11.3
FY17
11,592
10.7
9,346
2,246
19.4
-11
770
251
238
1,463
506
34.6
957
-6.5
8.3
203
754
754
-31.2
6.5
(INR m)
FY18E
11,978
3.3
9,752
2,226
18.6
-1
844
93
132
1,422
328
23.1
1,094
14.3
9.1
168
926
926
22.8
7.7
9 November 2017
31

September 2017 Results Preview | Sector: Oil & Gas
HPCL
Bloomberg
Equity Shares (m)
M. Cap. (INR b)/(USD b)
52-Week Range (INR)
1,6,12 Rel Perf. (%)
HPCL IN
1525.5
665 / 10
493 / 269
-9 / 20 / 39
CMP: INR436
n
n
n
n
n
n
n
TP: INR585 (+34%)
Buy
Financial snapshot (INR b)
Y/E March
2017 2018E 2019E 2020E
Sales
EBITDA
Adj. PAT
Adj. EPS (INR)
EPS Gr. (%)
BV/Sh.(INR)
RoE (%)
RoCE (%)
Payout (%)
Valuations
P/E (x)
P/BV (x)
EV/EBITDA (x)
Div. Yield (%)
1,870
105.8
62.1
40.7
66.6
133.4
32.4
18.8
57.5
10.7
3.3
7.9
4.6
2,093 2,266 2,333
126.6 125.5 134.1
70.1 65.4 69.7
45.9 42.9 45.7
12.9 (6.7)
6.5
163.2 191.0 220.6
31.0 24.2 22.2
17.3 13.7 12.9
35.2 35.2 35.2
9.5
2.7
7.0
3.2
10.2
2.3
7.2
3.0
9.5
2.0
6.9
3.2
We expect OMCs’ (IOCL, BPCL and HPCL) core earnings to increase
YoY/QoQ, led by strong GRMs and inventory gains in 2QFY18.
We model nil subsidy sharing for OMCs; subsidy in 2QFY18 would
be entirely borne by the government.
We peg HPCL’s refinery throughput at 4.3mmt for 2QFY18 v/s
4.0mmt in 2QFY17 and 4.5mmt in 1QFY18.
We model GRM of USD9.0/bbl and inventory gains of INR20b for
HPCL in 2QFY18.
We expect HPCL to report adjusted EBITDA of INR33.4b (+79% YoY,
+4% QoQ) in 2QFY18.
We estimate PAT at INR31.8b (+354% YoY, +245% QoQ) for
2QFY18.
HPCL trades at 10.2x FY19E EPS of INR42.9 and 2.3x FY19E BV
(adjusted for investments), with ~5% dividend yield. Maintain Buy.
Key issues to watch for
Ø
GRM.
Ø
Impact of forex and inventory change.
Standalone - Quarterly Earning Model
Y/E March
Net Sales
YoY Change (%)
Total Expenditure
EBITDA
Margins (%)
Adj. EBITDA
Depreciation
Interest
Other Income
PBT
Tax
Rate (%)
Reported PAT
YoY Change (%)
Margins (%)
Key Assumptions
Refining throughput (mmt)
Core GRM (USD/bbl)
Marketing sales volume incl exports (mmt)
Marketing GM per litre (INR/litre)
E: MOSL Estimates; Adj. for inventory and one-off
1Q
447,793
-13.4
411,534
36,259
8.1
21,567
6,108
1,250
2,618
31,518
10,534
33.4
20,984
32.1
4.7
4.5
4.8
8.9
4.7
FY17
FY18
2Q
3Q
4Q
1Q
2QE
3QE
4QE
420,306 484,856 514,142 533,848 543,603 508,225 503,524 1,867,097 2,089,200
0.1
12.9
25.3
19.2
29.3
4.8
-2.1
5.1
11.9
408,416 455,903 486,388 518,405 491,116 479,637 476,932 1,762,241 1,966,090
11,890 28,953 27,754 15,443 52,487 28,588 26,592 104,856 123,110
2.8
6.0
5.4
2.9
9.7
5.6
5.3
5.6
5.9
18,593 18,398 28,203 32,164 33,364 28,588 26,592
86,761 120,707
6,160
6,336
6,749
6,671
6,700
7,858
7,858
25,353
29,087
1,164
530
2,268
1,430
1,506
1,506
1,506
5,212
5,949
6,188
1,959
5,153
6,540
3,507
3,507
3,507
15,918
17,061
10,755 24,046 23,890 13,883 47,787 22,730 20,734
90,208 105,134
3,741
8,143
5,702
4,636 15,928
7,576
6,911
28,120
35,050
34.8
33.9
23.9
33.4
33.3
33.3
33.3
31.2
33.3
7,013 15,903 18,188
9,247 31,860 15,154 13,823
62,088
70,085
-318.8
52.7
31.0
-55.9
354.3
-4.7
-24.0
68.0
12.9
1.7
3.3
3.5
1.7
5.9
3.0
2.7
3.3
3.4
4.0
4.2
8.0
3.5
4.7
3.9
9.3
3.9
4.6
8.5
8.9
4.0
4.5
8.8
9.3
3.2
4.3
9.0
9.2
5.9
4.3
7.1
9.2
4.0
4.3
6.1
9.2
4.0
17.8
5.4
35.1
4.0
17.5
7.7
36.8
4.3
(INR Million)
FY17
FY18E
9 November 2017
32

September 2017 Results Preview | Sector: Cement
India Cements
Bloomberg
Equity Shares (m)
M. Cap. (INR b)/(USD b)
52-Week Range (INR)
1,6,12 Rel Perf. (%)
ICEM IN
308.2
56 / 1
226 / 105
-1 / 7 / 4
CMP: INR182
TP: INR198 (9%)
Neutral
Financial Snapshot (INR Billion)
Y/E March
2017 2018E 2019E 2020E
Sales
50.8 55.1 62.2 72.8
EBITDA
8.6
9.1 10.6 13.2
NP
1.7
2.3
3.3
4.6
Adj. EPS (INR)
5.6
7.5 10.8 14.9
EPS Gr. (%)
BV/Sh (INR)
RoE (%)
RoCE (%)
Payout (%)
Valuations
P/E (x)
P/BV (x)
EV/EBITDA(x)
EV/Ton (USD)
31.3
33.6
44.1
37.2
165.8 172.2 181.9 195.6
3.4
4.4
6.1
7.9
5.1
5.8
6.7
7.8
20.7 15.5 10.7
7.8
32.4
1.1
9.9
81
24.2
1.1
9.2
79
16.8
1.0
7.6
76
12.3
0.9
5.7
71
n
India Cements’ volumes are expected decline 3% YoY, adjusted for
Trinetra volumes, to 2.68mt in 2QFY18 due to weak demand from
Tamil Nadu. We expect realizations to decline 3% QoQ to
INR4,706/ton due to weak pricing in key regions. Revenue is
estimated at INR12.6b (-3.4% YoY).
n
EBITDA is estimated at INR1.63b, and EBITDA margin is likely to
contract 1.4pp QoQ to 13%, translating into blended EBITDA/ton of
INR610 (-INR89 QoQ) due to lower realizations. PAT is expected to
be INR183m (v/s INR624m in 2QFY17).
n
The stock trades at P/E of 16.8x/12.3x on FY19E/FY20E, 7.6x/5.7x
FY19E/FY20E EV/EBITDA and FY19E/FY20E EV/ton of USD76/USD
71. Maintain Neutral.
Key issues to watch out for:
Ø
Visibility on AP demand recovery.
Ø
Demand, especially in south India, post demonetization.
Ø
Pricing outlook in south India.
Quarterly Performance (Standalone)
Y/E March
FY17
1Q
2Q
3Q
Sales Dispatches (m ton)*
2.31
2.46
2.71
YoY Change (%)
10
14
40
Realization (INR/ton)
5,173
5,259
4,633
YoY Change (%)
2.5
-5.6
-14.4
QoQ Change (%)
10.7
1.7
-11.9
Net Sales
12,025
13,075
12,556
YoY Change (%)
11.9
6.7
18.6
EBITDA
2,014
2,244
2,033
Margins (%)
16.7
17.2
16.2
Depreciation
511
521
644
Interest
825
876
931
Other Income
32
69
36
PBT before EO expense
710
917
495
Extra-Ord expense
0
0
0
PBT
710
917
495
Tax
271
293
189
Rate (%)
38.1
31.9
38.2
Reported PAT
440
624
306
Adj PAT
440
624
306
*India cement doesn’t include Trinetra volumes for 2QFY17
4Q
2.90
19
4,633
-0.9
0.0
13,436
17.1
1,900
14.1
639
820
17
458
0
458
115
25.1
343
343
1Q
2.66
15
4,857
-6.1
4.8
12,901
7.3
1,856
14.4
630
874
52
404
0
404
140
34.6
264
264
FY18
2QE
3QE
2.68
2.76
9
2
4,706
4,955
-10.5
7.0
-3.1
5.3
12,627
13,698
-3.4
9.1
1,636
2,280
13.0
16.6
630
630
810
793
49
49
245
906
0
0
245
906
61
227
25.0
25.0
183
680
183
680
(INR Million)
FY17E
FY18E
4QE
3.21
11
4,940
6.6
-0.3
15,865
18.1
3,361
21.2
627
1,026
46
1,754
0
1,754
619
35.3
1,136
1,136
11.00
27.3
4,589
-16.7
50,795
5.6
8,610
17.0
2,571
3,605
165
2,600
2,600
867
33.3
1,734
1,734
11.32
2.9
4,840
5.5
55,091
8.5
9,133
16.6
2,517
3,502
196
3,309
3,309
993
30.0
2,317
2,317
9 November 2017
33

September 2017 Results Preview | Sector: Oil & Gas
Indraprastha Gas
Bloomberg
Equity Shares (m)
M. Cap. (INR b)/(USD b)
52-Week Range (INR)
1,6,12 Rel Perf. (%)
IGL IN
140.0
201 / 3
1524 / 795
10 / 36 / 62
CMP: INR1,438 TP: INR1,295 (-10%)
n
n
n
n
n
n
Neutral
Financial Snapshot (INR b)
y/e march
2017 2018E 2019E 2020E
Sales
EBITDA
Adj. PAT
Adj. EPS (INR)
EPS Gr. (%)
BV/Sh.(INR)
RoE (%)
RoCE (%)
Payout (%)
Valuation
P/E (x)
P/BV (x)
EV/EBITDA (x)
Div. Yield (%)
32.7
6.9
20.3
0.6
29.0
5.8
17.2
0.7
26.3
5.0
15.3
0.8
22.9
4.3
13.2
0.9
38.1
9.6
6.2
44.0
46.9
21.0
19.8
18.2
45.5
11.4
6.9
49.6
12.7
21.7
20.6
20.2
50.9
12.6
7.7
54.8
10.5
20.4
19.5
20.1
57.1
14.1
8.8
62.7
14.4
20.0
19.3
20.7
We expect IGL to report volumes of 5.14mmscmd, and assume
EBITDA/scm at INR6 for 2QFY18.
We expect 2QFY18 CNG volumes at 3.88mmscmd (+12% YoY, +5%
QoQ) and PNG volumes at 1.26mmscmd (+14% YoY, +5% QoQ).
We expect IGL to report EBITDA of INR2.8b (+11% YoY, +3% QoQ)
for 2QFY18.
We expect IGL to report PAT of INR1.7b (+20% YoY, +8% QoQ)
We model total volumes of 5.2/5.7/6.4mmscmd and EBITDA/SCM at
INR6/SCM in FY18/FY19/FY20.
The stock trades at 20.4x FY19E EPS of INR50.9. Maintain Neutral.
209.0 246.9 288.8 336.2
Key issues to watch for
Ø
Increase in volumes.
Ø
EBITDA/SCM.
Quarterly performance
Y/E MARCH
Net Sales
Change (%)
EBITDA
EBITDA (Rs/scm)
% of Net Sales
% Change
Depreciation
Interest
Other Income
PBT before EO
EO
PBT after EO
Tax
Rate (%)
PAT
Adj. PAT
EPS (INR)
Gas Volumes (mmscmd)
CNG
PNG
Total
YoY Change (%)
CNG
PNG
Total
E: MOSL Estimates
1Q
8,970
-0.3
2,570
6.5
28.7
32.7
466
0
106.5
2,211
0
2,211
731
33.1
1,480
1,480
10.6
3.31
1.02
4.34
11.7
17.7
13.0
FY17
2Q
9,624
-0.3
2,575
6.1
26.8
37.0
483
0
251.4
2,344
-167
2,177
735
33.8
1,442
1,552
11.1
3.47
1.11
4.58
11.9
13.3
12.3
3Q
9,467
2.1
2,554
6.0
27.0
38.0
479
0
152.4
2,227
-83
2,144
696
32.5
1,448
1,504
10.7
3.48
1.13
4.61
13.2
20.1
14.8
4Q
10,019
13.1
2,422
5.6
24.2
36.2
244
12
208.8
2,375
-300
2,075
734
35.4
1,341
1,535
11.0
3.65
1.19
4.84
15.7
25.8
18.1
1Q
10,492
17.0
2,773
6.2
26.4
7.9
439
4
178.8
2,509
0
2,509
897
35.7
1,613
1,613
11.5
3.70
1.20
4.90
11.8
17.2
13.1
FY18E
2QE
3QE
11,360
11,438
18.0
20.8
2,849
2,862
6.0
6.0
25.1
25.0
10.6
12.1
465
470
0
0
245.0
280.0
2,629
2,672
0
0
2,629
2,672
894
908
34.0
34.0
1,735
1,763
1,735
1,763
12.4
12.6
3.88
1.26
5.14
12.0
13.5
12.4
3.90
1.28
5.18
12.0
13.5
12.4
(INR Million)
FY17
FY18E
4QE
12,354
23.3
3,033
6.0
24.5
25.2
512
0
305.1
2,826
0
2,826
961
34.0
1,865
1,865
13.3
4.25
1.34
5.59
16.4
13.1
15.6
38,081
3.5
10,121
6.1
26.6
35.9
1,671
12
719.1
9,157
-550
8,607
2,896
33.7
5,711
6,076
43.4
3.48
1.11
4.59
13.2
19.2
14.6
45,643
19.9
11,516
6.1
25.2
13.8
1,886
4
1,008.9
10,636
0
10,636
3,660
34.4
6,976
6,976
49.8
3.93
1.27
5.20
13.1
14.2
13.4
9 November 2017
34

September 2017 Results Preview | Sector: Media
Jagran Prakashan
Bloomberg
Equity Shares (m)
M. Cap. (INR b)/(USD b)
52-Week Range (INR)
1,6,12 Rel Perf. (%)
JAGP IN
326.9
58 / 1
212 / 163
1 / -9 / -25
CMP: INR177
n
n
n
n
n
n
TP: INR225 (+27%)
Buy
Financial Snapshot (INR Billion)
Y/E March
2017 2018E 2019E 2020E
Net Sales
EBITDA
Adj. NP
Adj. EPS (INR)
Adj.EPS Gr (%)
BV/Sh (INR)
RoE (%)
RoCE (%)
Div. Payout (%)
Valuations
P/E (x)
P/BV (x)
EV/EBITDA (x)
Div. Yield (%)
16.6
2.7
9.0
0.0
14.5
2.7
7.9
1.7
13.2
2.3
6.8
1.7
11.6
2.0
5.7
1.7
22.8
6.4
3.5
10.7
-11.5
65.9
18.5
15.9
0.0
24.6
7.0
4.0
12.2
14.2
65.4
18.6
17.1
28.1
26.5
7.6
4.4
13.4
9.6
75.4
19.0
17.5
25.6
28.6
8.4
5.0
15.2
13.8
87.2
18.7
17.5
22.5
We expect Print advertising revenue to remain flat YoY at
INR3.45b.
We expect circulation revenue to grow 5% YoY to INR1.11b.
We estimate Radio revenue at INR0.87b and EBITDA at INR0.24b.
Aggregate revenue is expect ed to grow to INR5.88b.
We estimate EBITDA at INR1.6b and EBITDA margin at 27.4%.
Adjusted earnings are expected at INR0.9b.
The stock trades at 14.5x FY18E and 13.2x FY19E EPS. Buy.
Key things to watch for
Ø
YoY Print ad growth (we expect to remain flat).
Ø
EBITDA margin (we expect 27.4%).
Quarterly Performance (Consolidated)
Y/E March
FY17
1Q
2Q
3Q
4Q
1Q
Total Revenue from Operations
5,644
4,590
5,005
5,620
5,913
YoY Change (%)
17.3
-11.6
-13.2
6.1
4.8
Total Expenditure
4,086
3,377
3,454
4,180
4,301
EBITDA
1,558
1,213
1,551
1,441
1,612
Margins (%)
27.6
26.4
31.0
25.6
27.3
Depreciation
302
195
208
351
328
Interest
102
89
50
81
72
Other Income
93
164
81
128
120
PBT before EO expense
1,248
1,094
1,373
1,137
1,333
Extra-Ord expense
0
0
0
0
0
PBT
1,248
1,094
1,373
1,137
1,333
Tax
407
339
482
327
446
Rate (%)
32.6
31.0
35.1
28.7
33.5
Minority Interest & P/L of Asso. Cos.
3
0
0
0
21
Reported PAT
838
754
891
811
865
Adj PAT
838
754
891
811
865
YoY Change (%)
-11.6
-6.4
-4.5
1.2
3.2
Note: Only 1Q and 4Q numbers are comparable as both are on a consolidated basis
FY18
2QE
3QE
5,913
6,242
28.8
24.7
5,009
5,042
904
1,200
15.3
19.2
338
338
79
79
194
194
681
977
0
0
681
977
462
522
67.8
53.5
0
0
219
455
219
455
-71.0
-49.0
(INR m)
FY17
FY18E
4QE
6,504
15.7
5,075
1,429
22.0
338
79
194
1,206
0
1,206
560
46.5
0
646
646
-20.4
20,860
-1.0
15,097
5,762
27.6
1,055
322
467
4,852
0
4,852
1,555
32.0
3
3,295
3,295
-7.5
24,572
17.8
19,428
5,144
20.9
1,342
308
704
4,197
0
4,197
1,991
47.4
21
2,185
2,185
-33.7
9 November 2017
35

September 2017 Results Preview | Sector: Metals
Jindal Steel & Power
Bloomberg
Equity Shares (m)
M. Cap. (INR b)/(USD b)
52-Week Range (INR)
1,6,12 Rel Perf. (%)
JSP IN
914.9
135 / 2
159 / 63
6 / 13 / 65
CMP: INR148
n
TP: 192 (+30%)
Buy
Financial Snapshot (INR Billion)
Y/E March
2017 2018E 2019E 2020E
Sales
EBITDA
Adj. PAT
Adj. EPS (INR)
EPS Gr (%)
BV/Sh. (INR)
RoE (%)
RoCE (%)
Payout (%)
Valuations
P/E (x)
P/BV
EV/EBITDA (x)
Div. Yield (%)
-7.1
0.4
12.7
0.0
-8.5
0.5
10.2
0.0
73.4
0.5
6.9
0.0
26.6
0.5
6.1
0.0
216.2 257.4 312.9 336.3
46.6
-19.1
-20.9
14.8
-7.9
1.0
0.0
59.1
-16.0
-17.4
79.1
1.8
2.0
83.3
5.1
5.5
-16.5 -111.5 175.4
-5.5
1.8
0.0
0.6
4.0
0.0
1.8
4.6
0.0
328.5 310.7 312.2 317.3
Standalone:
We estimate standalone EBITDA to decline 16% QoQ
to INR6.3b due to the transitory start-up cost of blast furnace
commissioned in 1Q. Steel sales volumes would increase 10%
QoQ to 891kt, despite being a seasonally weak quarter.
Realization is expected to be broadly flat due to weak realization
in the long product segment. Pellet sales remain strong, with
margins improving, but domestic coal prices are also higher. Ex-
transitory costs, we estimate margins would had been broadly flat
QoQ.
n
Jindal Power:
Jindal Power’s EBITDA is estimated to decline 34%
QoQ to INR3.1b, as higher spot realization benefit is offset by
lower generation (-22% QoQ to 2.5bu) and higher coal cost.
Generation is impacted, despite good demand, due to availability
of coal.
n
Oman:
We estimate EBITDA to increase 28% QoQ to INR2.7b on
benefit of higher realization and a limited increase in cost due to
favorable gas sourcing contract.
n
Consolidated EBITDA is estimated to decline 8% QoQ to INR12.4b.
Key issues to watch for:
Ø
Ramp-up of Angul.
Ø
Power demand growth.
(INR Million)
Quarterly Performance (Consolidated)
Y/E March
Net Sales
Change (YoY %)
Total Expenditure
EBITDA
Change (YoY %)
As % of Net Sales
Interest
Depreciation
Other Income
PBT (before EO item)
Extra-ordinary Income
PBT (after EO item)
Total Tax
% Tax
Reported PAT
MI - Loss/(Profit)
Associate
Adjusted PAT
Change (YoY %)
E: MOSL Estimates
1Q
46,962
-1.2
37,121
9,841
-3.3
21.0
8,529
9,171
312
-7,548
-6,257
-13,805
-1,410
10.2
-12,395
-1,560
14
-4,564
34.5
FY17
2Q
48,609
-3.6
40,125
8,484
-13.1
17.5
8,716
9,986
7
-10,211
0
-10,211
-2,739
26.8
-7,473
-2
11
-7,460
317.8
3Q
55,812
21.5
43,045
12,767
132.0
22.9
8,353
10,274
3
-5,856
0
-5,856
-1,306
22.3
-4,551
-458
18
-4,074
-38.7
4Q
64,861
27.7
49,340
15,521
73.1
23.9
8,642
10,059
90
-3,090
2,534
-556
428
-76.9
-984
-505
-16
-3,029
-37.4
1Q
59,364
26.4
45,837
13,527
37.5
22.8
9,006
9,622
0
-5,101
0
-5,101
-887
17.4
-4,214
-334
10
-3,871
-15.2
FY18
2QE
57,840
19.0
45,450
12,390
46.0
21.4
7,698
11,173
1
-6,480
0
-6,480
16
-0.2
-6,496
-23
100
-6,373
-14.6
3QE
66,882
19.8
50,817
16,066
25.8
24.0
7,622
11,873
1
-3,428
0
-3,428
17
-0.5
-3,445
-23
100
-3,322
-18.5
4QE
73,271
13.0
56,153
17,118
10.3
23.4
7,700
11,935
1
-2,516
0
-2,516
18
-0.7
-2,534
-23
100
-2,411
-20.4
FY17
216,243
11.1
169,631
46,613
35.5
21.6
34,240
39,490
411
-26,706
-3,723
-30,429
-5,027
16.5
-25,402
-2,524
27
-19,128
14.8
FY18E
257,357
19.0
198,256
59,100
26.8
23.0
32,026
44,603
4
-17,525
0
-17,525
-836
4.8
-16,689
-402
310
-15,977
-16.5
9 November 2017
36

September 2017 Results Preview | Consumer
Page Industries
Bloomberg
Equity Shares (m)
M. Cap. (INR b)/(USD b)
52-Week Range (INR)
1,6,12 Rel Perf. (%)
PAG IN
11.2
206 / 3
19560 / 12360
1 / 21 / 4
CMP: INR18,501 TP: INR21,310 (+15%)
n
n
n
n
Buy
Financial Snapshot (INR b)
Y/E March
2017 2018E 2019E 2020E
Sales
EBITDA
Adj. PAT
Adj. EPS (INR)
EPS Gr. %
FCF to PAT
BV/Sh.INR
RoE (%)
RoCE (%)
Payout (%)
Valuations
P/E (x)
EV/EBITDA (x)
77.5
50.0
62.8
39.7
46.4
29.7
36.4
23.4
21.3
4.1
2.7
15.0
0.7
40.0
40.4
43.7
26.2
5.2
3.3
23.4
0.7
39.6
40.4
50.0
32.3
6.9
4.4
35.2
0.7
43.1
44.7
55.0
39.8
8.7
5.7
27.6
0.8
45.1
47.6
60.0
We expect Page to report net sales of INR6.5b, up 20% YoY, led by
~15% volume growth.
We expect EBITDA margin to remain flat YoY at 20%.
PAT is likely to post 20.1% YoY growth to INR825m.
The stock trades at 46.4x FY19E EPS of INR398.4; maintain Buy.
238.7 294.7 398.4 508.4
596.9 744.2 923.5 1126.9
Key issues to watch for
Ø
Volume trends and management commentary on demand
environment.
Ø
Update on EBO growth prospects.
Quarterly Performance
Y/E MARCH
Net Sales
YoY Change (%)
EBITDA
Margins (%)
YoY Change
Depreciation
Interest
Other Income
PBT
Tax
Rate (%)
PAT
YoY Change (%)
E: MOSL Estimates
27%
1Q
5,686
26.7
1,092
19.2
8.8
59
39
59
1,053
373
35.5
679
8.5
25%
25%
FY17
2Q
3Q
5,378
5,283
15.3
19.2
1,075
991
20.0
18.8
6.3
19.6
60
62
40
45
62
20
1,037
904
350
275
33.8
30.4
687
629
14.0
20.9
23%
4Q
4,989
12.8
974
19.5
5.3
65
56
103
955
287
30.1
668
17.9
1Q
6,962
22.5
1,365
19.6
25.0
67
45
40
1,294
441
34.1
853
25.5
FY18
2QE
3QE
6,453
6,498
20.0
23.0
1,290
1,252
20.0
19.3
20.0
26.3
66
69
40
45
40
20
1,224
1,158
399
378
32.6
32.6
825
781
20.1
24.1
FY17
4QE
6,317
26.6
1,280
20.3
31.5
72
39
31
1,200
372
31.0
828
24.0
21,335
18.5
4,132
19.4
9.7
247
180
243
3,948
1,285
32.6
2,663
15.0
FY18E
26,230
22.9
5,187
19.8
25.5
273
169
131
4,876
1,590
32.6
3,287
23.4
9 November 2017
37

September 2017 Results Preview | Sector: Metals
SAIL
Bloomberg
Equity Shares (m)
M. Cap. (INR b)/(USD b)
52-Week Range (INR)
1,6,12 Rel Perf. (%)
SAIL IN
4130.4
223 / 3
69 / 45
-12 / -23 / -1
n
n
n
CMP: INR54
n
TP: INR30 (-46%)
Sell
Financial Snapshot (INR Billion)
Y/E March
2017 2018E 2019E 2020E
Sales
EBITDA
NP
Adj. EPS (INR)
EPS Gr(%)
BV/Sh. (INR)
RoE (%)
RoCE (%)
Payout (%)
Valuation
P/E (x)
P/BV
EV/EBITDA (x)
Div. Yield (%)
-9.1
0.6
127.5
-7.2
0.7
27.5
-13.4 141.0
0.7
14.2
0.7
9.0
448.8 525.7 599.3 677.9
5.3
-25.5
-6.2
-31.0
89.1
-6.7
-2.3
25.8
-32.0
-7.7
25.2
81.3
-9.1
-0.9
51.5
-17.3
-4.2
77.1
-5.3
1.8
82.2
1.6
0.4
77.5
0.5
5.6
SAIL’s EBITDA is estimated to increase to INR8.5b from a loss of
INR0.8b in 1QFY18 on higher flat steel production realization,
lower coking coal cost and operating leverage on higher volumes.
Volumes are estimated to increase 35% QoQ/14% YoY to 4mt, as
it pushes sales with production growth.
EBITDA per ton is estimated at INR2,86, increasing from loss of
INR277 QoQ.
PAT loss is estimated at INR6.6b.
-45.9 -109.5
Key issues to watch for:
Ø
Commissioning of Bhilai capacity and steel prices.
Quarterly Performance
Y/E March
(Standalone)
Sales (m tons)
Change (YoY %)
Realization (INR per ton)
Change (YoY %)
Net Sales
Change (%)
EBITDA
Change (YoY %)
EBITDA per ton (INR)
EBITDA per ton (USD)
Interest
Depreciation
Other Income
PBT (before EO Inc.)
EO Income(exp)
PBT (after EO Inc.)
Total Tax
% Tax
Reported PAT
Adjusted PAT
Change (YoY %)
E: MOSL Estimates
1Q
2.8
4.1
32,993
-6.6
92,381
-2.8
2,338
-386.2
835
12
5,941
6,002
893
-8,712
-542
-9,254
-3,899
42.1
-5,355
-5,042
56.8
FY17
2Q
3Q
3.6
3.3
31.4
13.8
31,182
34,237
-7.7
11.1
112,256 112,982
21.3
26.4
1,114
-428
-114.5
-96.9
310
-130
5
-2
6,028
6,108
6,659
6,699
682
688
-10,890
-12,547
-1,640
11
-12,531
-12,536
-5,215
-4,587
41.6
36.6
-7,316
-7,948
-6,358
-7,956
-18.0
-48.0
4Q
3.4
-8.6
36,827
22.1
126,905
11.6
-2,644
-76.5
-767
-11
7,202
7,439
3,094
-14,192
3
-14,188
-6,475
45.6
-7,713
-7,715
-37.3
1Q
3.0
8.1
38,242
15.9
115,796
25.3
-839
-135.9
-277
-4
5,879
6,947
893
-12,771
-101
-12,872
-4,859
37.7
-8,014
-7,951
57.7
FY18
2QE
3QE
4.1
3.8
13.9
15.2
33,798
34,056
8.4
-0.5
138,572 129,413
23.4
14.5
8,552
6,586
667.5 -1,640.1
2,086
1,733
32
26
7,372
7,610
8,565
8,953
551
549
-6,834
-9,429
-6,834
-205
3.0
-6,629
-6,629
4.3
-9,429
-283
3.0
-9,146
-9,146
15.0
4QE
4.0
16.4
34,314
-6.8
137,599
8.4
6,501
-345.9
1,621
24
7,840
9,335
546
-10,128
-10,128
-304
3.0
-9,824
-9,824
27.3
(INR Million)
FY17
13.1
8.6
33,814
4.7
444,524
13.8
380
-101.1
29
0
25,278
26,800
5,356
-46,341
-2,167
-48,509
-20,176
41.6
-28,332
-27,066
-29.8
FY18E
14.9
13.6
34,903
3.2
521,379
17.3
20,800
5,368.0
1,392
21
28,702
33,800
2,539
-39,163
-101
-39,264
-5,650
14.4
-33,613
-33,527
23.9
9 November 2017
38

September 2017 Results Preview | Sector: Diversified
SRF
Bloomberg
Equity Shares (m)
M. Cap. (INR b)/(USD b)
52-Week Range (INR)
1,6,12 Rel Perf. (%)
SRF IN
57.4
90 / 1
1970 / 1352
3 / -11 / -31
CMP: INR1,560 TP: INR1,751 (+12%)
n
n
n
n
Buy
Financial Snapshot (INR Billion)
Y/E March
2017 2018E 2019E 2020E
Sales
EBITDA
NP
EPS (INR)
EPS Gr. (%)
BV/Sh. (INR)
RoE (%)
RoCE (%)
Valuations
P/E (x)
P/BV (x)
EV/EBITDA (x)
EV/Sales (x)
18.2
2.9
11.2
2.2
19.4
2.6
10.5
1.9
15.1
2.3
8.4
1.6
11.4
2.0
6.8
1.4
48.2
9.7
4.9
85.9
12.8
16.6
17.7
55.3
10.1
4.6
-6.6
13.7
17.6
64.1
12.4
6.0
28.3
16.0
22.1
73.0
14.7
8.0
32.6
18.4
26.0
Exports business of ref gas remains strong due to higher HFC32
usage.
Global agri-chem environment is expected to ease only in
2HFY18, which will enable execution of the deferred order book.
We expect SRF’s revenue to increase 15.5% YoY to INR14b, and
EBITDA to rise 9% YoY to INR2,541m.
We expect EBITDA margin to shrink 100bp YoY to 18.1%, and
adjusted PAT to remain flat at INR1,147m.
Buy.
80.2 103.0 136.6
544.6 604.9 684.7 798.0
Key things to watch for
Ø
Growth in Chemicals segment (particularly Specialty Chemicals).
Ø
Margins in Technical Textiles and Packaging segments.
Consolidated - Quarterly Earning Model
Y/E March
Net Sales
YoY Change (%)
Total Expenditure
EBITDA
Margins (%)
Depreciation
Interest
Other Income
PBT before EO expense
Extra-Ord expense
PBT
Tax
Rate (%)
Reported PAT
Adj PAT
YoY Change (%)
Margins (%)
E: MOSL Estimates
1Q
12,994
6
10,032
2,962
22.8
696
281
62
2,047
0
2,047
501
24.5
1,546
1,546
37.5
11.9
FY17
2Q
3Q
12,154
12,055
5
10.0
9,827
9,742
2,326
2,313
19.1
19.2
735
709
242
269
70
64
1,419
1,400
-72
45
1,491
1,355
298
271
20.0
20.0
1,193
1,084
1,135
1,120
3.5
10.1
9.3
9.3
4Q
14,164
27.3
12,007
2,157
15.2
730
228
259
1,459
-185
1,644
352
21.4
1,292
1,147
7.0
8.1
1Q
13,884
7
11,793
2,091
15.1
758
271
203
1,266
0
1,266
228
18.0
1,038
1,038
-32.8
7.5
FY18
2QE
3QE
14,037
14,104
16
17.0
11,497
11,453
2,541
2,652
18.1
18.8
814
782
217
231
68
66
1,578
1,705
0
0
1,578
1,705
431
462
27.3
27.1
1,147
1,243
1,147
1,243
1.0
11.0
8.2
8.8
4QE
16,997
20.0
14,142
2,856
16.8
733
237
80
1,966
0
1,966
468
23.8
1,498
1,498
30.6
8.8
FY17
48,218
5.0
38,524
9,694
20.1
2,834
1,018
455
6,296
-276
6,572
1,422
21.6
5,150
4,934
14.4
10.2
FY18E
55,309
14.7
45,187
10,122
18.3
3,146
939
275
6,312
0
6,312
1,704
27.0
4,608
4,608
-6.6
8.3
9 November 2017
39

September 2017 Results Preview | Sector: Automobiles
TVS Motor Company
Bloomberg
Equity Shares (m)
M. Cap. (INR b)/(USD b)
52-Week Range (INR)
1,6,12 Rel Perf. (%)
TVSL IN
475.1
311 / 5
672 / 339
8 / 40 / 61
CMP: INR655
TP:INR719 (+10%)
Buy
Financial Snapshot (INR b)
Y/E March
2017 2018E 2019E 2020E
Sales
EBITDA
Adj. PAT
EPS (INR)
EPS Gr. (%)
BV/Sh (INR)
RoE (%)
RoCE (%)
Payout (%)
Valuations
P/E (x)
P/BV (x)
EV/EBITDA (x)
Div. Yield (%)
55.7
12.9
37.7
0.4
43.4
10.5
28.0
0.5
26.7
8.1
18.0
0.7
19.4
6.0
13.1
0.8
121.4 148.4 178.5 211.5
8.6
5.6
11.7
14.1
50.7
25.6
22.8
25.6
11.5
7.2
15.1
28.5
62.2
26.7
26.9
23.9
17.6
11.6
24.5
62.5
34.2
36.8
22.1
23.4
16.0
33.8
37.7
35.5
41.9
17.8
81.3 109.0
n
Volume increased 16.3% YoY (+18.3% QoQ) to 948.6k units.
Scooter and motorcycle volume increased by 43% and 10% YoY
respectively, 3W volumes increased by 24% YoY, while mopeds
volume declined by 2% YoY.
n
Net realization is likely to increase ~1.1% YoY (flat QoQ) to
INR42,488 per unit due to a favorable sales mix.
n
We estimate net sales to grow by ~17.6% YoY (+18.6% QoQ) to
~INR40.3b.
n
EBITDA margin is likely to recover to 8.6%, an increase of 50bp
YoY and 240bp QoQ, driven by benefit of operating leverage and
better product mix.
n
We expect PAT to increase ~24.5% YoY (+71% QoQ) to INR2.2b.
n
We have revised upward our FY18E/FY19E volume by 2.1%/2.6%.
Consequently, we have increased our FY18E/FY19E EPS by
4.8%/3.4%.
n
The stock trades at 43.4x FY18E and 26.7x FY19E EPS; Maintain
Buy.
Key issues to watch
Ø
Launch of product with BMW tie-up in domestic market, electric
scooter.
Ø
Response to Jupiter classic.
Ø
Impact on spare parts business post GST.
Ø
Update on key trends in exports market, outlook for exports.
S/A Quarterly Performance
Y/E March (INR m)
Volumes (units)
Growth (%)
Realization (INR/unit)
Growth (%)
Net Sales
Growth (%)
RM (% of sales)
Emp cost ( % of sales)
Other exp (% of sales)
TOTAL EXPENDITURE
EBITDA
EBITDA Margin(%)
Interest
Depreciation
Other Income
PBT after EO Exp
Tax rate (%)
Adjusted PAT
Growth (%)
E: MOSL Estimates
1Q
714,964
12.1
40,305
(0.1)
28,817
11.9
72.5
6.3
14.2
26,806
2,011
7.0
98
660
362
1616
24.5
1,220
21.9
FY17
2Q
3Q
815,562 718,562
20.2
2.4
42,014
41,519
0.5
0.7
34,265
29,834
20.8
3.0
72.3
72.0
5.8
6.4
13.8
14.2
31,498
27,649
2,767
2,185
8.1
7.3
94
115
724
720
392
348
2340
1698
24.2
21.9
1,774
1,327
33.4
10.4
4Q
673,572
2.0
42,230
(0.3)
28,445
1.7
75.1
6.1
13.1
26,830
1,615
5.7
132
775
632
1340
5.4
1,268
(6.8)
1Q
802,108
12.2
42,382
5.2
33,995
18.0
74.6
6.1
13.1
31,881
2,114
6.2
107
783
571
1794
27.8
1,295
6.1
FY18E
2QE
3QE
948,584 878,900
16.3
22.3
42,488
42,807
1.1
3.1
40,304
37,623
17.6
26.1
74.1
74.0
5.3
5.8
12.0
12.2
36,831
34,601
3,472
3,022
8.6
8.0
110
115
795
805
480
490
3047
2592
27.5
27.5
2,209
1,879
24.5
41.6
FY17
FY18E
4QE
838,705 2,923,139 3,468,297
24.5
9.1
18.6
43,450
41,515
42,777
2.9
0.1
3.0
36,442 121,353 148,363
28.1
9.3
22.3
73.6
73.0
74.1
6.3
6.1
5.9
12.2
13.8
12.4
33,552 112,782 136,865
2,890
8,571
11,498
7.9
7.1
7.8
118
440
450
820
2,878
3,204
505
1,734
2,046
2456
6,987
9890
27.2
20.1
27.5
1,787
5,581
7,170
41.0
14.1
28.5
9 November 2017
40

In conversation
1. ARVIND: Listing of demerged companies likely by July/August
2018; Sanjay Lalbhai, CMD
n
n
n
n
n
n
Regarding share ratio post the demerger, reason for it being low is because
there will be no cross holding left post the demerger. All of 90 percent of
company capital is being issued to shareholders.
Demerger will be a completely tax neutral transaction. Process is likely to be
completed in eight months and listing could happen by July/August 2018.
Demerger helps the specific companies to align their own objectives and have
the ability to raise resources independently.
Till now the cash flow generated by the textile business was nurturing budding
businesses. But now that these businesses have become independent, the free
cash flow generated by textile business will be reinvested in growth of textile
business only. Expect Rs 1500 crore to be invested in textile business in coming
three years.
On the margin outlook for Brand and Retail business, internal targets are to
reach double-digit margins by 2021. For this financial year margins should be
around 6 percent.
Currently, Brand & Retail business has a very strong balance sheet with a debt of
Rs 600 crore and it is unlikely that company would need to raise cash in the
near-term.
2. LUPIN: Sees marginal impact on earnings; resolution to take
12-15 MTHS; Ramesh Swaminathan, CFO & ED
n
n
n
n
n
n
n
Surprised by warning letter from US FDA for Goa & Pithampur units. Were in
fact lining up for establishment inspection report (EIR).
Would do whatever needs to be done. Would likely take 12-15 months to get
resolution for Goa & Pithampur units.
There have been two observations which have been commented upon but it is
not going to disrupt supplies and there is nothing on data integrity.
Would be a marginal impact on their earnings because most of the important
products that are to be launched are not from Goa and Pithampur units.
Confident that company would be able to reinvite USFDA in about six months'
time for reinspection.
Plant 1 and 3 of Pithampur are in the clear and so is their Aurangabad facility.
Margins for FY20 will not be impacted and maintain guidance for FY20.
However, as expected FY19 is going to be a lackluster year.
3. ADITYA BIRLA CAPITAL: Expect margin to remain in the range
of 4.4-4.5%; Ajay Srinivasan, CEO
n
n
n
n
Have a much diversified NBFC book and the growth in NBFC business has come
in across the spectrum.
Expect margin to remain in the range of 4.4-4.5 percent.
Should see some traction as company builds small and medium enterprise (SME)
and retail.
On bank recapitalization, too early to say if public sector undertaking (PSUs) will
increase competition. However, in a broader sense, PSB recapitalization will
benefit everyone.
41
9 November 2017

n
n
n
30-40 percent of borrowings come from banks. Therefore, should be a
beneficiary post the PSU bank recapitalization.
Have a good track record in terms of NPAs.
Housing finance a very exciting business. However, general ownership of
housing in India is very low.
4. VIP INDUSTRIES: Hope GST rate on luggage to come down to
18%; Dilip G Piramal, Chairman
n
n
n
n
Things might change a little bit because costs are going up considerably and
China becoming quite expensive.
Doing extremely well, all brands are doing well, products range is good.
September sales have been a bit higher than normal because of early Diwali.
Things are a bit uncertain. There is a great hope that the goods and services tax
(GST) rate would come down to 18 percent.
May not see similar kind of increase in margins going ahead.
5. CASTROL INDIA: Seeing strong signs of recovery in personal &
cv sales; Omer Dormen, MD
n
n
n
n
n
n
Personal mobility segment saw double-digit growth. However, industrial and
heavy duty and segment saw some pressure.
Saw a fair amount of challenges last year due to GST and demonetization.
Seeing strong signs of recovery now in both personal mobility as well strong
vehicle sales in the commercial vehicle (CV) sales but manufacturing sector
continues to face some headwinds.
Crude price between USD 60/bbl and USD 65/bbl a bit of a concern.
Saw a spike in Q2 in base oil prices and took a price increase in the first half.
Do not see any price increases in the pipeline.
9 November 2017
42

From the think tank
1. ECONOMIC SLOWDOWN: PARROTING THE STRUCTURAL
REFORMS MANTRA
n
Why did the economy slow down for five consecutive quarters? Was it structural
or cyclical? The government seemed in no mood to entertain any such question.
The finance ministry’s ‘State of the Economy’ (October 24) presentation focused
more on an impending “take-off”, implying thereby the slowdown was a
temporary dip due to structural policies such as demonetisation and the goods
and services tax (GST). The swagger was understandable—strength had finally
been mustered to bailout public sector banks by issuing capitalisation bonds. Let’s
hope normalcy soon restores, and these banks are ready to lend if and when
investors return to borrow! That is where most analysts would now focus—when
will lending resume? The economy is two-paced—few segments continued
healthily, their credit demand increasingly met by the bond market, non-bank
financial companies (NBFCs) and few leading private sector banks. Some of that
credit demand may return to public banks in the first round. But that would be
pure reallocation, a fight for the existing pie. From a macro perspective, we are
keen to know when net credit demand for the economy as whole will revive.
2. OUR CHANGING SAVING HABITS
n
The Indian economic model has been a bit of a paradox. India has sometimes
resembled the successful economies of East Asia in terms of high domestic
savings, close integration with the global economy and macroeconomic stability.
And it has sometimes resembled the volatile countries of Latin America in terms
of weak domestic savings, macroeconomic instability and growing oligarchic
power. This column had earlier argued that rising inequality could mean
successive governments would have strong incentives to boost fiscal spending in
a bid to buy social peace, taking India closer to the Latin American model. High
domestic savings are an important part of the story. The splendid investment
boom in the five years to 2008 was supported by a sharp rise in the domestic
savings rate. The revival in investment activity after 2010 led to a current
account crisis because domestic savings were relatively sluggish. In other words,
those magic moments of rapid economic growth plus macroeconomic stability
are possible only when the domestic savings rate is rising.
3. PM NARENDRA MODI IS TRYING SO HARD TO WOO
INVESTORS IN FOOD PROCESSING
n
Given the tens of thousand crore rupees famers lose each year due to waste in
fruits and vegetables, the wide disparity between mandi and retail prices and
the tremendous value addition that is possible—just look at the difference
between the price of tomatoes and ketchup—it is not surprising that prime
minister Narendra Modi is trying so hard to woo investors in food processing. If
most of the $10-billion of investment promises made during the mega food
festival inaugurated by Modi over the weekend are to fructify, it will be a big
boost to farmer incomes. But getting investors to move from the commitment
stage to actual investment will take a lot of policy change, not just on the central
government’s part but also from state governments. A relatively easy one, and it
9 November 2017
43

is not clear why that has been delayed as much as it has, is relaxing rules for FDI
in both multi-brand- as well as food-retail.
International
4. DO VALUATIONS REALLY MATTER?
n
The combined market value of Amazon, Alphabet, Microsoft and Intel stocks is
around $2.1 trillion—a little short of India’s gross domestic product (GDP). A
year ago, the market capitalization was around $1.55 trillion. That is a jump of
$565 billion—36%. In contrast, their earnings for the three months ending
September 2017 was higher by $3 billion over the third quarter of 2016.
Irrational exuberance is back with a vengeance. Central banks around the
world—principally China—can take credit. In the face of easy money, analyses
based on fundamentals are of little value. They do not matter. The investment
world is missing the child that called out the emperor’s nudity. But, one day, the
child in investors will wake up and usually, it is too late. A story in the South
China Morning Post published on 14 October 2017 gives us some clues as to
what has been driving the so-called global economic recovery that allegedly
underpins the rally in all risk assets around the world.
9 November 2017
44

Click excel icon
for detailed
valuation guide
Rs
Valuation snapshot
P/E (x)
P/B (x)
ROE (%)
FY17 FY18E FY17 FY18E FY17 FY18E FY19E
24.4
26.2
24.1
55.7
43.9
18.2
50.8
49.0
35.2
24.5
21.5
25.2
45.6
33.1
22.1
59.1
30.0
35.5
24.9
27.1
23.4
32.2
20.0
18.7
34.7
NM
37.7
42.8
12.1
20.8
30.2
27.1
NM
20.7
40.4
12.6
NM
30.4
1,041.3
20.1
118.5
55.4
47.3
28.2
27.5
21.1
58.4
37.3
17.4
36.4
15.3
26.7
22.4
22.0
39.8
38.4
18.1
37.6
38.9
19.6
25.1
19.8
19.7
24.8
28.6
21.9
46.5
26.3
30.1
20.5
79.0
20.4
26.6
22.5
20.2
27.4
18.9
31.6
31.1
16.2
17.1
25.5
17.0
NM
24.1
9.6
10.1
7.5
22.2
21.2
NM
23.0
38.8
32.8
21.2
21.4
16.6
48.1
33.9
14.3
27.4
14.3
4.5
5.7
5.4
8.2
7.2
2.9
15.8
9.4
3.6
3.4
7.2
3.2
2.8
6.9
2.6
13.7
5.1
2.4
2.5
2.1
2.2
5.4
2.3
1.3
4.8
0.7
4.9
4.5
1.2
3.2
3.5
1.1
0.9
0.8
0.6
1.2
0.3
1.1
1.5
0.5
1.0
10.6
5.6
3.0
4.6
2.5
17.5
6.9
4.2
4.3
2.7
4.0
5.0
4.9
7.2
6.5
2.5
11.9
7.8
3.1
3.1
6.3
2.9
2.5
6.0
2.3
11.2
4.5
2.2
2.1
2.0
1.8
4.8
2.4
1.2
4.3
0.7
4.4
3.2
1.1
2.8
3.1
1.0
0.9
0.8
0.5
1.1
0.3
1.0
1.4
0.6
1.0
6.2
4.5
2.6
3.9
2.2
14.3
6.3
3.7
3.8
2.3
20.3
23.1
25.3
16.2
15.8
16.9
37.1
20.8
10.6
13.9
35.7
14.2
6.4
20.3
9.8
25.6
17.1
6.9
10.8
9.5
9.9
18.3
10.9
7.2
15.3
-27.0
13.8
12.3
9.0
18.9
11.5
4.0
-6.7
4.2
1.4
10.1
-8.4
3.6
-0.2
2.7
0.9
21.6
15.1
12.0
18.0
14.4
32.5
18.9
25.5
12.4
19.1
15.8
23.8
23.3
19.3
17.8
14.8
36.1
21.8
16.8
12.5
33.7
13.5
10.8
20.5
11.0
26.5
17.2
7.6
11.5
2.6
9.6
18.8
8.8
6.3
16.9
4.0
14.8
12.4
6.7
17.3
12.1
6.1
-5.2
3.4
5.8
11.6
4.6
4.7
7.0
-4.7
4.3
20.2
15.3
13.2
19.6
14.1
32.8
19.3
27.6
14.9
17.4
17.7
27.0
25.3
22.9
20.5
17.3
36.4
24.0
18.4
13.7
31.1
14.3
11.5
23.0
27.4
35.6
22.6
11.6
11.8
8.2
10.0
20.4
10.5
6.9
19.0
8.0
16.5
13.7
12.6
19.5
14.1
12.4
3.0
6.1
7.3
12.7
5.4
7.1
11.4
2.1
8.1
20.4
19.3
15.4
19.6
15.3
32.8
18.6
30.7
18.9
17.2
Company
Automobiles
Amara Raja
Ashok Ley.
Bajaj Auto
Bharat Forge
Bosch
CEAT
Eicher Mot.
Endurance Tech.
Escorts
Exide Ind
Hero Moto
M&M
Mahindra CIE
Maruti Suzuki
Tata Motors
TVS Motor
Aggregate
Banks - Private
Axis Bank
DCB Bank
Equitas Hold.
Federal Bank
HDFC Bank
ICICI Bank
IDFC Bank
IndusInd
J&K Bank
Kotak Mah. Bk
RBL Bank
South Indian
Yes Bank
Aggregate
Banks - PSU
BOB
BOI
Canara
IDBI Bk
Indian Bk
OBC
PNB
SBI
Union Bk
Aggregate
NBFCs
Bajaj Fin.
Bharat Fin.
Capital First
Cholaman.Inv.&Fn
Dewan Hsg.
GRUH Fin.
HDFC
Indiabulls Hsg
L&T Fin Holdings
LIC Hsg Fin
Reco
Buy
Buy
Buy
Buy
Neutral
Buy
Buy
Buy
Sell
Buy
Neutral
Buy
Not Rated
Buy
Buy
Neutral
CMP
(INR)
683
119
3,190
728
20,782
1,702
31,121
1,152
702
199
3,632
1,367
244
8,230
439
694
TP
% Upside
EPS (INR)
(INR) Downside FY17 FY18E FY19E
854
145
3,753
726
22,781
2,029
36,487
1,229
688
254
3,819
1,585
-
9,466
562
764
25
22
18
0
10
19
17
7
-2
28
5
16
15
28
10
28.0
4.6
132.3
13.1
473.1
93.3
612.7
23.5
20.0
8.1
169.1
54.3
5.4
248.6
19.8
11.7
25.6
32.9
5.3
7.0
145.2 175.0
18.3
25.5
540.8 698.6
94.2 126.8
826.7 1,119.2
29.6
39.3
35.8
45.9
7.9
9.7
183.1 193.9
69.5
81.7
9.9
11.8
288.1 381.0
20.0
61.3
14.9
25.8
Neutral
Neutral
Buy
Buy
Buy
Buy
Neutral
Buy
Buy
Buy
Buy
Buy
Buy
545
174
137
113
1,826
306
56
1,666
78
1,011
509
30
304
470
197
209
146
2,150
355
56
2,000
100
1,179
665
36
382
-14
13
53
29
18
16
0
20
28
17
31
20
26
15.4
7.0
5.0
4.8
56.8
15.3
3.0
48.1
-31.3
26.8
11.9
2.5
14.6
18.1
8.5
1.7
5.5
68.7
13.6
2.8
60.9
4.1
32.1
16.4
1.9
17.8
29.9
10.5
5.7
6.6
84.7
17.0
3.2
78.6
8.7
41.6
23.0
3.8
23.3
Buy
Neutral
Neutral
Neutral
Buy
Neutral
Buy
Buy
Neutral
162
194
390
62
370
128
189
310
163
217
141
386
49
438
150
250
341
175
34
-27
-1
-20
18
18
32
10
8
6.0
-14.8
18.8
1.5
29.3
-31.6
6.2
0.3
8.1
9.5
-11.2
16.1
6.4
36.7
17.1
8.5
14.6
-13.5
20.8
6.6
30.3
8.6
44.0
21.4
13.5
26.8
6.0
Buy
Under Review
Buy
Buy
Buy
Neutral
Buy
Buy
Buy
Neutral
1,776
993
695
1,266
624
475
1,747
1,195
191
585
2,300
-
925
1,500
690
500
2,000
1,550
240
680
30
33
18
11
5
14
30
26
16
32.0
21.0
24.6
46.0
29.6
8.1
46.8
68.6
5.2
38.2
45.7
30.3
32.8
59.2
37.6
9.9
51.6
83.6
6.9
41.0
63.7
47.2
43.7
70.4
46.0
12.0
57.1
105.1
10.4
46.5
9 November 2017
45

Company
Manappuram
M&M Fin.
Muthoot Fin
PNB Housing
Repco Home
Shriram City Union
STF
Aggregate
Capital Goods
ABB
Bharat Elec.
BHEL
Blue Star
CG Cons. Elec.
CG Power & Indu.
Cummins
GE T&D
Havells
K E C Intl
L&T
Pennar Eng.
Siemens
Solar Ind
Suzlon Energy
Thermax
Va Tech Wab.
Voltas
Aggregate
Cement
Ambuja Cem.
ACC
Birla Corp.
Dalmia Bharat
Grasim Inds.
India Cem
J K Cements
JK Lakshmi Ce
Ramco Cem
Orient Cem
Prism Cem
Shree Cem
Ultratech
Aggregate
Consumer
Asian Paints
Britannia
Colgate
Dabur
Emami
Godrej Cons.
GSK Cons.
HUL
ITC
Jyothy Lab
Marico
Reco
Not Rated
Buy
Buy
Buy
Buy
Buy
Buy
CMP
(INR)
95
413
473
1,389
575
2,151
1,273
TP
% Upside
(INR) Downside
-
481
17
550
16
1,750
26
800
39
2,650
23
1,415
11
FY17
8.6
7.1
29.5
31.6
29.1
84.3
55.6
EPS (INR)
FY18E FY19E
9.2
9.7
14.2
19.1
38.7
44.4
52.5
66.5
33.7
38.4
115.6 145.3
80.6 106.2
P/E (x)
P/B (x)
ROE (%)
FY17 FY18E FY17 FY18E FY17 FY18E FY19E
11.0
10.4 2.4
2.2
24.0 22.3 21.4
58.3
29.2 3.6
3.4
6.4
11.9 14.8
16.0
12.2 2.9
2.5
19.4 21.8 21.2
43.9
26.4 4.2
3.7
13.8 15.0 16.7
19.8
17.1 3.2
2.7
17.4 17.1 16.7
25.5
18.6 2.8
2.5
11.7 14.3 15.9
22.9
15.8 2.6
2.3
11.7 15.1 17.4
31.2
25.2 5.0
4.3
16.0 17.1 17.9
66.8
28.4
67.2
51.9
49.0
21.0
33.3
71.1
52.6
26.4
28.8
14.3
68.9
51.1
24.4
31.5
19.7
35.9
36.0
56.0
49.4
42.1
76.7
18.5
31.2
30.4
63.1
25.7
NM
415.0
48.5
45.5
39.3
55.7
62.9
48.1
46.5
47.0
51.0
36.2
63.0
31.6
31.0
49.3
65.0
25.2
30.7
40.6
44.2
42.5
34.8
43.2
43.7
21.9
26.2
11.1
56.7
43.5
17.5
32.2
17.0
33.1
31.4
39.4
34.2
29.3
47.2
17.7
23.3
25.8
45.1
25.9
26.8
41.3
36.7
42.8
32.6
54.3
54.4
43.7
43.6
46.9
45.5
35.7
54.2
29.1
38.0
47.6
8.5
5.8
1.0
8.4
26.6
1.3
6.5
10.1
9.6
5.1
3.4
1.5
6.4
9.4
-1.4
4.3
3.2
5.6
4.0
2.8
3.9
2.8
5.3
1.9
1.1
4.1
3.7
4.5
3.5
6.0
8.4
5.0
3.7
14.8
20.6
21.8
12.3
16.1
12.4
7.6
41.2
7.1
5.8
17.2
7.5
4.5
1.0
7.9
19.5
1.3
6.1
8.8
8.5
4.3
3.1
1.3
5.6
8.0
-1.5
3.9
2.8
4.9
3.7
2.7
3.7
2.6
4.8
1.7
1.0
3.6
3.5
3.9
3.1
5.4
7.0
4.5
3.4
14.4
17.0
20.8
10.5
13.8
9.7
7.5
41.0
7.1
5.9
15.0
12.7
20.6
1.5
18.0
76.4
6.2
21.2
12.4
18.2
19.2
12.5
10.2
9.3
19.8
NM
14.3
16.8
18.0
11.2
5.1
7.9
7.1
7.2
10.8
3.4
14.4
6.1
19.0
-3.2
1.4
18.4
11.6
9.4
28.5
36.9
50.4
28.4
35.8
24.6
22.2
66.5
23.5
21.1
36.7
11.6
17.9
3.3
20.2
51.0
3.0
18.1
21.8
19.5
19.5
12.4
11.6
9.8
19.8
-8.8
12.7
17.6
15.8
11.7
7.0
11.1
9.2
10.7
10.0
4.4
14.8
8.0
16.0
12.3
13.7
20.8
11.1
10.4
26.9
34.3
48.7
26.0
31.7
23.8
21.1
75.9
24.4
15.5
33.6
14.6
18.1
3.3
27.8
49.6
3.7
22.2
22.6
21.2
20.2
13.8
12.6
13.8
20.9
-11.0
12.8
17.4
16.0
13.0
8.0
14.2
12.2
13.3
12.9
6.1
17.5
12.3
17.9
15.6
21.3
18.8
14.2
12.6
29.4
34.5
56.2
27.3
34.0
22.9
22.6
88.0
25.6
18.3
37.1
Sell
Buy
Sell
Neutral
Buy
Neutral
Buy
Neutral
Neutral
Neutral
Buy
Not Rated
Neutral
Neutral
Not Rated
Neutral
Buy
Sell
1,317
179
90
669
229
86
881
407
503
313
1,218
101
1,227
1,053
15
970
588
555
1,230
210
78
685
260
80
1,150
440
460
350
1,400
-
1,355
900
-
840
800
470
-7
17
-13
2
14
-7
31
8
-9
12
15
10
-15
-13
36
-15
19.7
6.3
1.3
12.9
4.7
4.1
26.5
5.7
9.6
11.9
42.3
7.1
17.8
20.6
0.6
30.8
29.8
15.5
20.2
7.1
2.9
16.5
5.2
2.0
25.3
9.4
11.5
14.3
46.5
9.1
21.7
24.2
0.9
30.1
34.6
16.8
28.7
8.0
3.0
24.4
6.5
2.5
35.0
11.2
14.3
17.6
56.6
11.2
33.4
30.0
1.0
33.4
39.8
19.1
Neutral
Neutral
Buy
Buy
Neutral
Neutral
Buy
Buy
Buy
Buy
Buy
Buy
Buy
274
1,784
1,201
2,973
1,252
175
1,024
439
702
169
113
18,629
4,375
314
1,797
1,150
3,473
1,276
198
1,196
485
853
205
128
22,084
4,906
15
1
-4
17
2
13
17
11
22
22
13
19
12
4.9
6.9
36.1 52.2
28.5 40.9
38.8 62.9
67.8 70.6
5.6
7.5
33.7 39.7
7.0
9.7
27.3 27.1
-1.6
6.3
0.3
2.7
384.4 507.1
96.1 102.2
8.4
70.9
58.9
88.3
101.2
10.8
54.4
16.4
35.1
9.1
5.0
547.8
147.1
Neutral
Buy
Buy
Buy
Buy
Neutral
Neutral
Buy
Neutral
Neutral
Neutral
1,171
4,638
1,021
337
1,247
963
5,648
1,237
265
348
310
1,280
5,165
1,328
395
1,435
1,015
5,400
1,440
280
365
340
9
11
30
17
15
5
-18
16
6
5
10
21.0 21.6
73.7 85.3
21.2 23.4
7.2
7.7
26.5 26.6
18.9 21.2
156.1 158.1
19.6 22.8
8.4
9.1
11.2
9.2
6.3
6.5
25.8
104.6
28.6
9.3
33.2
24.5
182.1
27.6
10.0
10.9
7.9
9 November 2017
46

Company
Nestle
Page Inds
Parag Milk
Pidilite Ind.
P&G Hygiene
Prabhat Dairy
United Brew
United Spirits
Aggregate
Healthcare
Alembic Phar
Alkem Lab
Ajanta Pharma
Aurobindo
Biocon
Cadila
Cipla
Divis Lab
Dr Reddy’s
Fortis Health
Glenmark
Granules
GSK Pharma
IPCA Labs
Jubilant Life
Lupin
Sanofi India
Shilpa Medicare
Strides Shasun
Sun Pharma
Syngene Intl
Torrent Pharma
Aggregate
Infrastructure
Ashoka Buildcon
IRB Infra
KNR Constructions
Sadbhav
Engineering
Aggregate
Logistics
Allcargo Logistics
Blue Dart
Concor
Gateway
Distriparks
Gati
Transport Corp.
Aggregate
Media
Dish TV
D B Corp
Den Net.
Ent.Network
Hind. Media
Reco
Neutral
Buy
Neutral
Neutral
Neutral
Not Rated
Buy
Neutral
CMP
(INR)
7,828
20,580
258
767
8,848
148
1,138
3,055
TP
% Upside
(INR) Downside
6,160
-21
21,310
4
275
7
865
13
9,200
4
-
980
-14
2,970
-3
FY17
118.0
238.7
3.6
16.7
132.9
3.5
8.7
26.7
EPS (INR)
FY18E FY19E
115.0 133.6
294.7 398.4
8.9
12.4
18.1
20.6
151.6 176.0
3.5
6.4
9.9
14.0
34.9
53.7
P/E (x)
FY17 FY18E
66.3
68.1
86.2
69.8
71.5
28.9
45.9
42.5
66.6
58.4
41.8
42.5
131.0 115.0
114.3 87.5
47.8
43.8
23.8
25.4
20.7
20.0
39.5
35.0
39.1
25.4
32.3
13.4
15.2
18.6
76.1
34.1
17.3
14.9
34.4
46.4
24.0
20.6
38.4
22.5
24.3
NM
11.7
22.1
28.8
20.6
23.7
26.5
22.6
17.5
66.1
28.4
29.4
31.3
38.7
63.3
15.7
16.8
59.2
33.0
14.5
22.4
32.0
30.8
18.6
35.7
31.0
24.8
28.1
127.5
10.5
20.7
22.1
17.4
17.0
31.3
31.3
28.9
7.5
13.4
26.1
74.3
17.2
NM
69.6
9.4
P/B (x)
ROE (%)
FY17 FY18E FY17 FY18E FY19E
25.0 23.3 39.0 35.5 38.1
34.5 27.7 40.0 39.6 43.1
3.3
3.0
6.0
10.8 13.3
11.9 9.7
28.2 25.2 23.5
41.7 34.6 39.3 64.9 62.8
2.1
2.0
5.2
4.9
8.5
12.9 11.8 10.2 10.7 13.6
22.9 15.9 21.3 18.2 20.9
13.2 12.3 27.5 28.1 29.3
5.1
5.4
6.7
4.9
5.0
7.3
4.0
5.0
3.2
1.4
3.8
3.4
11.0
2.8
2.9
2.8
5.9
5.7
2.6
3.5
7.8
4.8
4.1
2.6
1.5
4.2
3.3
2.3
2.4
17.6
3.7
2.6
2.0
2.6
3.8
16.4
4.3
2.0
4.5
1.5
4.4
4.7
5.4
3.9
4.7
6.1
3.6
5.2
3.1
1.2
3.1
2.4
13.0
2.6
2.5
2.6
5.5
4.8
2.3
3.4
6.3
4.3
3.7
2.4
1.4
3.5
2.9
2.0
2.2
13.4
3.5
2.5
1.7
2.2
3.5
13.4
3.6
2.1
4.2
1.3
23.0
23.4
36.7
27.6
12.3
23.0
10.2
22.0
9.7
11.3
24.7
21.1
14.5
8.6
18.0
20.9
17.1
14.4
10.8
18.1
22.2
23.8
16.9
-0.6
14.0
20.7
12.0
11.0
13.7
50.5
10.8
7.3
12.4
16.7
12.3
25.1
24.6
-19.1
6.7
18.2
19.9
19.0
26.4
24.8
7.2
23.5
12.1
16.3
8.2
2.1
19.6
17.7
22.0
8.2
18.4
12.0
17.1
17.0
12.9
9.6
22.5
18.3
13.2
1.9
14.0
18.4
13.8
11.7
13.4
48.6
11.5
8.8
19.4
17.8
13.5
19.9
22.8
-6.4
6.3
15.0
19.8
20.9
25.7
22.1
11.4
26.0
13.6
21.2
14.1
4.9
18.4
18.8
31.4
12.2
19.2
12.5
17.6
20.4
18.0
13.8
20.7
19.9
15.5
7.1
13.2
16.7
12.5
11.8
15.1
46.8
14.1
11.0
25.4
18.6
16.0
35.2
22.2
0.2
10.1
15.3
Neutral
Neutral
Buy
Buy
Neutral
Buy
Neutral
Neutral
Neutral
Buy
Neutral
Buy
Neutral
Neutral
Buy
Buy
Buy
Buy
Buy
Buy
Not Rated
Neutral
513
1,919
1,189
787
403
497
621
1,015
2,346
138
597
135
2,616
548
640
843
4,443
650
776
538
500
1,242
540
1,830
1,606
850
335
555
600
1,100
2,575
220
650
200
2,500
430
861
1,000
5,000
805
1,201
515
-
1,400
5
-5
35
8
-17
12
-3
8
10
59
9
49
-4
-22
35
19
13
24
55
-4
13
21.6 21.6
75.7 72.5
57.3 52.7
39.3 44.9
10.2
6.1
14.2 17.5
15.9 21.1
39.9 32.4
72.6 60.6
10.3
2.2
39.3 37.9
7.2
8.0
34.4 44.2
16.1 16.6
36.9 44.2
56.6 37.6
129.1 139.0
14.0 21.1
32.3 41.7
26.1 15.1
13.0 16.1
55.2 50.0
24.9
93.3
64.1
50.0
10.5
23.6
27.0
43.7
115.2
5.6
42.8
11.0
54.9
26.8
55.0
42.7
156.2
30.4
68.3
23.3
18.0
61.4
Buy
Neutral
Buy
Buy
231
237
264
316
260
240
295
385
13
1
12
22
-0.5
20.3
12.0
11.0
1.8
22.6
12.7
14.3
7.1
23.9
13.6
14.5
Buy
Not Rated
Neutral
Buy
Not Rated
Not Rated
174
4,069
1,337
244
119
281
213
-
1,496
277
-
-
22
12
14
9.8
10.3
102.5 129.9
38.0 42.7
6.8
8.4
16.9
8.4
15.9
21.0
12.9
163.2
55.2
11.0
23.9
25.9
17.7
39.7
35.2
35.9
14.3
16.6
30.9
73.6
18.6
NM
70.4
9.3
Buy
Buy
Neutral
Neutral
Buy
75
373
92
804
241
106
430
90
910
302
40
15
-2
13
25
1.0
20.0
-9.3
11.4
25.8
1.0
21.7
-2.9
11.6
25.6
2.4
25.4
0.1
20.1
30.2
9 November 2017
47

Company
HT Media
Jagran Prak.
Music Broadcast
PVR
Prime Focus
Siti Net.
Sun TV
Zee Ent.
Aggregate
Metals
Hindalco
Hind. Zinc
JSPL
JSW Steel
Nalco
NMDC
SAIL
Rain Industries
Vedanta
Tata Steel
Aggregate
Oil & Gas
BPCL
GAIL
Gujarat Gas
Gujarat St. Pet.
HPCL
IOC
IGL
MRPL
Oil India
ONGC
PLNG
Reliance Ind.
Aggregate
Retail
Jubilant Food
Titan Co.
Aggregate
Technology
Cyient
HCL Tech.
Hexaware
Infosys
KPIT Tech
L&T Infotech
Mindtree
Mphasis
NIIT Tech
Persistent Sys
Tata Elxsi
TCS
Tech Mah
Wipro
Zensar Tech
Reco
Neutral
Buy
Buy
Buy
Buy
Neutral
Neutral
Buy
CMP
(INR)
98
173
378
1,379
100
25
871
541
TP
% Upside
(INR) Downside
113
15
225
30
469
24
1,640
19
130
30
27
8
860
-1
630
16
FY17
7.4
10.7
6.4
20.5
1.2
-1.9
24.9
12.1
EPS (INR)
FY18E FY19E
10.4
11.9
12.2
13.4
9.0
14.2
27.1
43.0
3.0
5.9
-0.8
0.1
28.8
36.9
10.5
16.0
P/E (x)
P/B (x)
ROE (%)
FY17 FY18E FY17 FY18E FY17 FY18E FY19E
13.3
9.5
1.0
0.9
7.9
10.2 10.6
16.2
14.2 2.6
2.6
18.5 18.6 19.0
58.8
41.9 3.9
3.6
11.2
9.0
12.6
67.2
50.9 6.7
5.9
10.4 12.4 17.0
81.7
33.0 5.4
4.6
7.6
15.0 23.9
NM
NM
4.1
4.7 -29.4 -14.2
2.4
35.1
30.3 8.5
7.8
26.0 27.0 31.6
44.6
51.7 6.1
5.6
17.0 12.8 16.8
41.5
35.1 5.2
4.8
12.6 13.7 17.3
30.7
15.9
NM
17.7
23.4
12.8
NM
35.3
21.3
18.2
24.8
10.8
20.3
55.8
23.4
10.7
9.5
35.7
8.6
18.8
11.7
22.9
18.4
14.3
161.3
82.6
89.2
17.3
14.7
24.6
15.2
13.3
15.7
19.8
19.0
16.9
17.2
31.6
20.5
15.8
17.8
16.4
13.9
13.8
NM
12.9
19.4
9.7
NM
16.8
12.7
11.6
16.3
10.6
17.1
30.2
17.1
9.5
10.0
31.6
12.0
12.5
10.1
18.4
16.0
13.0
75.3
59.6
61.8
14.7
13.9
20.7
14.9
13.3
14.2
17.3
17.5
14.7
15.0
26.3
20.7
13.7
15.8
16.2
2.0
4.3
0.5
2.8
1.6
1.8
0.9
3.8
2.0
2.1
1.9
3.3
2.0
7.5
2.6
3.3
1.8
7.5
2.2
1.0
1.1
4.8
1.9
1.9
13.2
15.5
15.3
2.8
3.7
6.0
3.2
2.0
5.8
3.2
2.5
2.2
2.6
9.9
6.1
2.6
2.8
2.6
1.8
4.6
0.5
2.4
1.6
1.7
0.9
3.2
1.8
1.9
1.8
2.7
1.9
6.2
2.3
2.7
1.6
6.4
1.9
1.0
1.1
4.1
1.7
1.7
12.4
12.6
12.7
2.6
3.5
5.1
3.4
1.8
4.4
3.1
2.9
2.2
2.5
8.0
6.5
2.5
2.7
2.3
7.4
24.4
-7.9
17.3
7.2
12.8
-6.7
10.9
9.7
15.7
7.7
32.4
9.6
14.0
11.6
32.4
20.7
21.0
31.4
5.7
10.1
23.2
11.6
13.1
8.2
20.6
17.1
16.2
27.5
26.5
22.0
14.3
41.6
16.8
13.2
13.7
17.0
37.1
32.6
18.4
16.9
17.2
13.6
32.3
-5.5
19.8
8.3
15.5
-9.1
20.5
15.1
17.1
11.2
28.5
11.5
22.6
14.3
31.0
17.2
21.7
17.3
7.9
10.8
23.9
11.9
13.1
16.5
23.4
20.5
17.4
25.9
26.4
21.8
14.1
35.2
17.3
14.6
15.1
17.9
33.6
30.6
18.9
17.0
15.3
16.5
42.5
0.6
20.2
10.1
16.2
-5.3
23.4
23.8
16.6
15.4
25.2
12.5
27.3
14.1
24.2
16.9
20.4
16.5
8.8
12.5
25.5
12.3
13.5
20.9
25.5
23.9
18.3
25.6
23.4
22.5
14.5
29.6
20.4
17.3
16.4
20.8
32.4
33.5
18.2
16.7
18.4
Buy
Neutral
Buy
Buy
Neutral
Buy
Sell
Buy
Buy
Neutral
263
313
158
262
87
127
77
340
322
692
326
322
192
297
87
188
30
362
394
672
24
3
22
13
0
48
-61
6
22
-3
8.6
19.7
-20.9
14.8
3.7
10.0
-6.2
9.6
15.1
37.9
18.8
22.7
-17.4
20.3
4.5
13.1
-7.7
20.2
25.5
59.4
26.4
33.5
2.0
24.9
5.8
12.9
-4.2
28.2
44.4
65.2
Buy
Sell
Sell
Neutral
Buy
Buy
Neutral
Sell
Buy
Buy
Buy
Buy
520
458
896
206
435
397
1,568
127
363
192
260
888
644
376
721
180
585
554
1,295
112
340
231
275
1,005
24
-18
-20
-13
34
40
-17
-12
-6
20
6
13
48.3
22.6
16.1
8.8
40.7
41.9
44.0
14.8
19.3
16.4
11.4
48.3
49.2
26.8
29.7
12.1
45.9
39.5
49.6
10.7
29.1
19.0
14.1
55.5
52.0
31.4
44.1
13.3
42.9
43.6
54.8
11.6
34.1
22.8
18.0
64.0
Sell
Buy
1,614
746
1,270
850
-21
14
10.0
9.0
21.4
12.5
27.4
15.9
Buy
Neutral
Neutral
Buy
Neutral
Buy
Neutral
Neutral
Neutral
Buy
Buy
Neutral
Buy
Neutral
Buy
529
878
337
952
158
874
494
738
643
647
890
2,730
489
302
854
600
970
270
1,100
160
950
480
670
600
780
1,004
2,450
560
280
1,020
13
10
-20
16
1
9
-3
-9
-7
21
13
-10
15
-7
19
30.6 36.0
59.8 63.2
13.7 16.3
62.8 63.8
11.9 11.9
55.5 61.6
24.9 28.5
38.9 42.0
38.0 43.7
37.7 43.3
28.1 33.8
133.4 131.8
30.9 35.8
16.9 19.1
52.1 52.8
41.9
68.2
17.0
67.8
14.1
66.0
33.6
46.0
50.3
52.4
40.2
151.4
37.7
20.1
72.7
9 November 2017
48

Company
Reco
Aggregate
Telecom
Bharti Airtel
Buy
Bharti Infratel
Neutral
Idea Cellular
Buy
Tata Comm
Buy
Aggregate
Utiltites
Coal India
Buy
CESC
Buy
JSW Energy
Sell
NTPC
Buy
Power Grid
Buy
Tata Power
Sell
Aggregate
Others
Arvind
Neutral
Avenue
Sell
Supermarts
Bata India
Under Review
BSE
Neutral
Castrol India
Buy
Century Ply.
Neutral
Coromandel Intl Buy
Delta Corp
Buy
Dynamatic Tech Buy
Eveready Inds.
Buy
Interglobe
Neutral
Indo Count
Neutral
Info Edge
Buy
Inox Leisure
Sell
Jain Irrigation
Under Review
Just Dial
Neutral
Kaveri Seed
Buy
Kitex Garm.
Buy
Manpasand
Buy
MCX
Buy
Monsanto
Buy
Navneet Education Buy
Quess Corp
Buy
PI Inds.
Buy
Piramal Enterp.
Buy
SRF
Buy
S H Kelkar
Buy
Symphony
Sell
Team Lease Serv. Buy
Trident
Buy
TTK Prestige
Neutral
V-Guard
Neutral
Wonderla
Buy
CMP
(INR)
TP
% Upside
EPS (INR)
(INR) Downside FY17 FY18E FY19E
P/E (x)
P/B (x)
ROE (%)
FY17 FY18E FY17 FY18E FY17 FY18E FY19E
17.8
17.6 4.1
4.3
22.9 24.4 23.2
43.7
29.2
NM
67.9
47.6
19.3
19.1
21.2
14.7
15.0
11.2
16.5
33.4
143.5
57.4
23.9
29.0
34.0
30.2
86.5
30.9
26.5
27.3
8.5
76.4
75.4
18.3
26.4
28.2
16.9
67.4
39.4
28.5
23.4
80.0
24.3
36.5
19.3
37.2
65.0
47.2
13.8
49.8
61.4
55.5
131.9 2.9
25.7 5.2
NM
1.4
124.7 12.1
-408.3 3.1
16.4
11.1
20.2
13.1
12.0
11.4
13.9
32.0
91.9
49.4
21.6
31.2
30.1
20.8
46.7
18.5
25.0
18.7
12.4
50.6
31.3
13.3
25.0
15.7
14.2
44.0
37.0
23.3
20.3
28.9
27.1
25.3
20.7
35.4
43.8
50.1
11.0
47.7
49.0
32.5
7.3
1.2
1.3
1.5
2.2
1.9
2.4
3.0
17.9
7.5
2.0
32.9
9.2
5.1
6.7
4.3
8.6
12.0
2.6
7.4
4.4
1.6
3.5
3.7
4.6
4.2
3.7
8.0
5.8
10.8
6.8
3.1
3.0
4.8
24.1
8.2
1.7
9.0
14.6
5.1
2.9
5.2
1.9
13.1
3.3
7.0
1.1
1.3
1.4
1.9
1.7
2.2
2.8
15.7
6.7
2.0
29.8
7.6
4.4
4.5
3.5
7.0
6.9
2.1
6.6
3.9
1.5
3.2
3.9
3.7
4.0
3.7
7.2
5.0
4.5
5.7
2.8
2.7
4.4
21.2
7.1
1.5
8.2
11.9
4.5
6.8
16.2
-1.6
48.4
6.6
37.8
6.5
6.3
10.5
15.6
17.1
14.4
10.3
17.9
2.2
20.2
-25.6
10.1
-0.8
42.4
10.6
6.3
11.0
17.0
16.0
15.7
9.1
18.2
3.7
22.8
-32.6
30.0
1.3
47.7
10.8
5.0
11.9
17.4
14.6
16.8
12.0
22.9
15.8
8.0
96.1
29.6
23.4
12.9
24.3
30.1
43.0
18.3
13.7
16.2
14.8
13.7
27.4
27.6
13.4
15.9
34.5
27.9
15.0
22.9
15.3
16.0
15.2
54.5
19.5
16.1
20.7
28.8
17.5
495
433
99
677
680
440
105
780
37
2
7
15
11.3
14.9
-1.1
10.0
3.8
16.8
-15.5
5.4
6.5
19.2
-14.9
18.2
288
991
81
176
209
83
335
1,360
51
211
261
72
16
37
-37
20
25
-13
14.9
51.9
3.8
12.0
14.0
7.4
17.5
88.9
4.0
13.5
17.4
7.3
20.7
99.3
3.3
15.7
20.4
7.5
414
1,101
775
980
394
296
503
264
2,091
341
1,182
110
1,197
251
102
462
537
314
428
979
2,452
171
800
810
2,646
1,660
269
1,538
1,831
91
6,573
219
388
376
873
-
1,100
467
323
523
257
3,334
358
1,291
118
1,300
240
-
465
738
394
534
1,300
3,295
209
1,040
890
3,266
1,751
298
1,288
2,000
114
5,281
167
393
-9
-21
12
18
9
4
-3
59
5
9
7
9
-5
1
38
25
25
33
34
22
30
10
23
5
11
-16
9
25
-20
-24
1
12.4
7.7
13.5
41.0
13.6
8.7
16.6
3.1
67.6
12.9
43.2
13.0
15.7
3.3
5.5
17.5
19.1
18.6
6.3
24.8
86.2
7.3
10.0
33.4
72.6
85.9
7.2
23.7
38.8
6.6
132.1
3.6
7.0
12.9
12.0
15.7
45.3
12.6
9.8
24.1
5.7
112.9
13.6
63.2
8.9
23.6
8.0
7.6
18.5
34.1
22.1
9.7
26.5
105.0
8.4
27.7
29.9
104.6
80.2
7.6
35.1
36.6
8.3
137.8
4.5
11.9
18.6
17.5
19.4
46.1
13.3
12.9
29.0
8.0
166.7
16.3
75.4
10.8
26.2
12.0
10.0
21.1
41.0
26.2
15.3
43.4
126.6
10.4
29.1
35.6
149.7
103.0
9.9
42.9
56.0
10.4
176.1
6.0
16.0
13.9 14.4
8.3
9.3
115.0 100.3
31.1 27.7
17.5 22.5
8.1
12.1
15.1 20.7
37.7 30.8
51.0 46.8
34.8 18.6
10.2 13.7
5.9
12.5
8.6
11.7
14.8 13.4
13.6 23.3
29.8 28.6
7.3
8.2
10.2 10.0
31.5 32.5
26.7 26.3
19.0 21.9
32.8 23.0
9.0
11.7
16.6 13.7
13.7 12.9
43.3 51.6
19.2 15.2
13.0 14.5
19.5 18.0
27.4 26.9
9.5
14.8
9 November 2017
49

MOSL Universe stock performance
Company
Automobiles
Amara Raja
Ashok Ley.
Bajaj Auto
Bharat Forge
Bosch
CEAT
Eicher Mot.
Endurance Tech.
Escorts
Exide Ind
Hero Moto
M&M
Mahindra CIE
Maruti Suzuki
Tata Motors
TVS Motor
Banks - Private
Axis Bank
DCB Bank
Equitas Hold.
Federal Bank
HDFC Bank
ICICI Bank
IDFC Bank
IndusInd
J&K Bank
Kotak Mah. Bk
RBL Bank
South Indian
Yes Bank
Banks - PSU
BOB
BOI
Canara
IDBI Bk
Indian Bk
OBC
PNB
SBI
Union Bk
NBFCs
Bajaj Fin.
Bharat Fin.
Capital First
Cholaman.Inv.&Fn
Dewan Hsg.
GRUH Fin.
HDFC
Indiabulls Hsg
L&T Fin.Holdings
LIC Hsg Fin
Manappuram
M&M Fin.
Muthoot Fin
PNB Housing
1 Day (%)
0.2
-2.3
0.8
1.8
0.0
-0.8
-0.1
-2.8
-0.4
-1.2
-1.3
0.9
-0.4
-0.1
-2.9
-1.9
3.4
-4.7
-2.3
-0.7
0.1
-2.0
-0.6
1.0
-0.7
-0.1
-1.3
-1.6
-2.5
-1.6
-0.4
-0.3
-1.3
2.2
-5.9
-0.8
-2.3
-2.0
-1.4
0.8
-2.0
0.1
-1.4
-3.7
-1.0
0.1
-0.8
-2.7
-3.9
-2.7
0.8
-0.8
1M (%)
-3.0
-4.5
1.4
12.5
-1.2
-2.5
-1.3
4.7
0.7
-3.3
-1.9
5.0
1.5
4.0
3.4
5.3
8.0
-6.4
-11.3
-4.0
1.5
12.3
-2.2
-0.9
6.1
-2.5
-1.4
-4.6
-16.8
14.4
37.4
23.6
16.1
36.6
3.3
38.3
20.7
25.6
-7.5
2.4
-8.3
13.1
14.2
-9.4
0.4
-5.8
-3.4
-11.6
-5.9
-1.7
-4.1
-8.4
12M (%)
-32.5
30.0
11.3
71.3
-3.6
30.1
28.4
85.0
102.1
2.5
7.8
-1.3
25.4
45.4
-18.8
78.1
11.1
33.8
-19.7
46.3
45.6
18.8
-22.7
37.4
19.3
24.7
31.8
45.2
24.1
9.0
78.3
35.1
-11.2
71.6
9.9
34.6
22.6
25.6
80.5
20.4
0.7
14.2
98.8
45.6
25.8
51.8
83.7
6.5
-7.3
19.4
30.4
42.1
Company
Bharat Elec.
BHEL
Blue Star
CG Cons. Elec.
CG Power & Inds Sol.
Cummins
GE T&D
Havells
K E C Intl
L&T
Pennar Eng.
Siemens
Solar Ind
Suzlon Energy
Thermax
Va Tech Wab.
Voltas
Cement
Ambuja Cem.
ACC
Birla Corp.
Dalmia Bharat
Grasim Inds.
India Cem
J K Cements
JK Lakshmi Ce
Ramco Cem
Orient Cem
Prism Cem
Shree Cem
Ultratech
Consumer
Asian Paints
Britannia
Colgate
Dabur
Emami
Godrej Cons.
GSK Cons.
HUL
ITC
Jyothy Lab
Marico
Nestle
Page Inds
Parag Milk
Pidilite Ind.
P&G Hygiene
Prabhat Dairy
United Brew
United Spirits
Healthcare
Alembic Phar
Alkem Lab
Ajanta Pharma
Aurobindo
1 Day (%)
-0.7
-3.4
-1.0
0.0
-1.8
-0.7
-0.1
0.5
1.1
0.6
-1.5
-0.8
-0.7
-0.6
0.5
0.3
1.1
-0.9
-0.1
-0.8
-1.6
-0.1
0.3
0.1
0.6
-1.6
-2.8
2.4
-1.0
0.3
2.5
-0.3
-1.3
-0.7
0.2
-1.6
3.3
0.2
-0.1
3.7
-0.1
1.7
0.0
0.4
1.3
0.2
1.0
-0.9
-0.2
0.1
-1.0
-0.3
0.8
1M (%)
7.6
6.0
-16.2
2.8
6.8
-3.4
5.8
-1.2
1.8
6.6
-0.5
0.3
12.0
0.3
4.4
-0.3
5.1
-1.7
2.6
29.1
8.0
8.7
-4.7
5.4
11.4
-0.5
9.0
5.8
-0.7
11.5
1.0
6.5
-6.2
6.7
12.6
1.7
12.9
2.6
-0.2
-13.0
-1.4
6.6
8.4
-1.6
-4.0
2.1
11.2
32.8
29.4
2.2
4.1
0.8
5.7
12M (%)
49.5
-5.7
23.0
36.1
4.2
4.8
24.0
28.0
139.9
30.9
-42.3
9.3
53.0
5.7
13.5
25.6
55.3
12.1
18.6
55.1
47.0
64.8
12.8
12.2
-5.9
13.9
-1.1
11.1
9.6
10.5
10.8
43.5
4.3
13.3
6.9
25.7
-1.4
46.8
3.8
-2.7
18.8
21.3
29.1
-17.5
11.0
28.0
29.0
26.0
49.8
-21.7
20.3
-37.3
3.9
9 November 2017
50

Company
PFC
Repco Home
REC
STF
Shriram City Union
Capital Goods
ABB
1 Day (%)
0.8
-2.2
-0.3
-0.5
-0.9
-1.3
1M (%)
9.8
-9.6
6.9
21.0
3.3
-3.8
12M (%)
19.9
-20.3
32.4
20.7
-11.1
21.0
Company
Biocon
Cadila
Cipla
Divis Lab
Dr Reddy’s
Fortis Health
Glenmark
1 Day (%)
0.5
0.0
2.1
-0.1
-1.3
-1.4
-1.0
1M (%)
15.2
-0.7
6.1
17.6
-1.4
-11.6
-2.6
12M (%)
35.5
32.6
15.8
-18.3
-24.7
-18.8
-33.3
9 November 2017
51

MOSL Universe stock performance
Company
Granules
GSK Pharma
IPCA Labs
Jubilant Life
Lupin
Sanofi India
Shilpa Medicare
Strides Shasun
Sun Pharma
Syngene Intl
Torrent Pharma
Infrastructure
Ashoka Buildcon
IRB Infra.Devl.
KNR Construct.
Sadbhav Engg.
Logistics
Allcargo Logistics
Blue Dart
Concor
Gateway Distriparks
Gati
Transport Corp.
Media
Dish TV
D B Corp
Den Net.
Ent.Network
Hind. Media
HT Media
Jagran Prak.
Music Broadcast
PVR
Prime Focus
Siti Net.
Sun TV
Zee Ent.
Metals
Hindalco
Hind. Zinc
JSPL
JSW Steel
Nalco
NMDC
Rain Industries
SAIL
Vedanta
Tata Steel
Oil & Gas
BPCL
GAIL
Gujarat Gas
Gujarat St. Pet.
HPCL
IOC
IGL
1 Day (%)
-0.5
-0.9
0.1
-1.2
-2.1
-0.6
-1.2
-1.3
1.9
0.5
-2.1
-2.8
-1.0
1.4
2.2
0.7
-0.3
0.5
-3.8
-1.4
-2.0
-0.7
4.2
2.9
0.2
-0.1
-2.3
-0.7
-0.4
2.6
0.4
0.8
-0.4
0.5
-1.6
-1.6
-1.4
-0.8
-4.7
-2.2
5.8
-2.9
-3.9
-0.1
-0.4
-1.2
-1.7
-1.8
-2.1
-0.8
1.4
1M (%)
10.5
8.3
5.3
-3.7
-19.2
9.2
3.8
-7.4
1.4
2.1
-1.9
16.4
13.5
27.5
9.8
2.4
-0.7
0.6
4.1
7.8
4.4
5.6
-1.9
7.0
-1.6
-3.6
0.3
-3.4
-3.1
4.9
8.5
-1.6
11.2
3.4
4.8
-1.9
3.6
1.7
6.6
4.1
87.7
36.5
-1.2
0.1
6.3
1.2
-1.1
5.3
-2.1
-4.4
8.5
12M (%)
18.0
-3.8
-4.1
1.5
-44.2
3.9
12.2
-28.3
-15.3
-8.8
-5.5
47.5
5.0
86.6
15.1
-6.1
-20.1
21.4
-2.5
-10.5
51.0
-15.6
-2.4
18.1
6.5
-17.4
20.3
-8.1
7.3
29.9
-28.6
65.7
7.0
56.6
20.8
118.8
58.2
67.6
0.1
581.3
49.8
46.9
69.3
18.0
39.1
61.7
33.3
44.8
24.9
82.6
Company
Titan Co.
Technology
Cyient
HCL Tech.
Hexaware
Infosys
KPIT Tech
L&T Infotech
Mindtree
Mphasis
NIIT Tech
Persistent Sys
Tata Elxsi
TCS
Tech Mah
Wipro
Zensar Tech
Telecom
Bharti Airtel
Bharti Infratel
Idea Cellular
Tata Comm
Utiltites
Coal India
CESC
JSW Energy
NTPC
Power Grid
Tata Power
Others
Arvind
Avenue Super.
Bata India
BSE
Castrol India
Century Ply.
Coromandel Intl
Delta Corp
Dynamatic Tech
Eveready Inds.
Interglobe
Indo Count
Info Edge
Inox Leisure
Jain Irrigation
Just Dial
Kaveri Seed
Kitex Garm.
Manpasand
MCX
Monsanto
Navneet Educat.
PI Inds.
Piramal Enterp.
Quess Corp
SRF
1 Day (%)
-1.0
0.7
0.3
0.4
-0.4
0.3
6.8
1.8
3.5
0.4
-0.3
2.4
0.8
3.8
-0.2
1.0
-3.7
1.4
1.3
0.8
1.1
0.8
2.5
-1.3
0.5
0.2
-9.1
0.0
-1.0
-0.8
-4.4
0.3
-1.4
-5.9
-3.0
-3.0
-2.3
-1.1
-2.7
-2.4
-2.5
5.7
-2.7
-4.1
0.0
-1.5
-0.6
1.1
0.0
-2.3
-1.2
-0.5
1M (%)
24.9
3.9
-2.9
27.1
3.5
23.8
9.7
3.0
20.3
13.8
0.3
7.2
11.7
7.3
5.4
13.8
29.5
8.3
33.5
-4.3
4.2
-4.9
5.2
0.3
2.1
3.4
7.0
-0.5
4.6
0.1
9.1
14.7
9.5
24.1
-0.5
6.5
6.7
-0.1
12.9
9.8
3.2
14.2
0.4
41.8
-8.3
-7.9
1.6
4.3
8.0
-2.1
-4.0
5.3
12M (%)
101.2
15.3
8.7
65.4
-3.1
17.3
38.4
11.6
43.1
57.9
-2.2
43.6
19.6
7.8
33.2
-9.3
62.3
19.8
35.0
10.8
-9.1
65.6
30.4
14.2
18.1
11.7
2.2
67.3
-9.3
29.9
89.1
62.8
-36.4
33.9
27.6
-30.6
31.1
2.3
-0.7
17.2
32.9
9.6
21.8
-26.5
5.2
68.9
-5.6
57.6
40.2
-4.9
9 November 2017
52

Company
MRPL
Oil India
ONGC
PLNG
Reliance Ind.
Retail
Jubilant Food
1 Day (%)
-2.9
-2.7
-0.9
-1.1
-2.0
0.9
1M (%)
0.4
3.7
10.6
6.5
6.1
4.5
12M (%)
44.3
18.2
6.4
43.9
77.1
65.6
Company
S H Kelkar
Symphony
Team Lease Serv.
Trident
TTK Prestige
V-Guard
Wonderla
1 Day (%)
1.6
1.6
9.7
0.9
1.0
-0.3
1.4
1M (%)
2.0
17.5
14.4
-12.0
7.5
15.2
5.2
12M (%)
-12.0
20.0
81.9
54.7
10.6
46.2
4.0
9 November 2017
53

NOTES
9 November 2017
54

THEMATIC/STRATEGY RESEARCH GALLERY

REPORT GALLERY
RECENT INITIATING COVERAGE REPORTS
Rs

DIFFERENTIATED PRODUCT GALLERY

Disclosures:
The following Disclosures are being made in compliance with the SEBI Research Analyst Regulations 2014 (herein after referred to as the Regulations).
Motilal Oswal Securities Ltd. (MOSL) is a SEBI Registered Research Analyst having registration no. INH000000412. MOSL, the Research Entity (RE) as defined in the Regulations, is engaged in the business of providing Stock
broking services, Investment Advisory Services, Depository participant services & distribution of various financial products. MOSL is a subsidiary company of Motilal Oswal Financial Service Ltd. (MOFSL). MOFSL is a listed
public company, the details in respect of which are available on
www.motilaloswal.com.
MOSL is registered with the Securities & Exchange Board of India (SEBI) and is a registered Trading Member with National Stock
Exchange of India Ltd. (NSE) and Bombay Stock Exchange Limited (BSE), Metropolitan Stock Exchange Of India Ltd. (MSE) for its stock broking activities & is Depository participant with Central Depository Services Limited
(CDSL) & National Securities Depository Limited (NSDL) and is member of Association of Mutual Funds of India (AMFI) for distribution of financial products. Details of associate entities of Motilal Oswal Securities Limited are
available on the website at
http://onlinereports.motilaloswal.com/Dormant/documents/Associate%20Details.pdf
Pending Regulatory Enquiries against Motilal Oswal Securities Limited by SEBI:
SEBI pursuant to a complaint from client Shri C.R. Mohanraj alleging unauthorized trading, issued a letter dated 29th April 2014 to MOSL notifying appointment of an Adjudicating Officer as per SEBI regulations to hold
inquiry and adjudge violation of SEBI Regulations; MOSL requested SEBI to provide all documents, records, investigation report relied upon by SEBI which were referred in Show Cause Notice and also sought personal
hearing. The matter is currently pending.
MOSL, it’s associates, Research Analyst or their relative may have any financial interest in the subject company. MOSL and/or its associates and/or Research Analyst may have beneficial ownership of 1% or more securities in
the subject company at the end of the month immediately preceding the date of publication of the Research Report.
MOSL and its associate company(ies), their directors and Research Analyst and their relatives may; (a) from
time to time, have a long or short position in, act as principal in, and buy or sell the securities or derivatives thereof of companies mentioned herein. (b) be engaged in any other transaction involving such securities and earn
brokerage or other compensation or act as a market maker in the financial instruments of the company(ies) discussed herein or act as an advisor or lender/borrower to such company(ies) or may have any other potential
conflict of interests with respect to any recommendation and other related information and opinions.; however the same shall have no bearing whatsoever on the specific recommendations made by the analyst(s), as the
recommendations made by the analyst(s) are completely independent of the views of the associates of MOSL even though there might exist an inherent conflict of interest in some of the stocks mentioned in the research
report.
Research Analyst may have served as director/officer, etc. in the subject company in the last 12 month period. MOSL and/or its associates may have received any compensation from the subject company in the past
12 months.
In the last 12 months period ending on the last day of the month immediately preceding the date of publication of this research report, MOSL or any of its associates may have:
managed or co-managed public offering of securities from subject company of this research report,
received compensation for investment banking or merchant banking or brokerage services from subject company of this research report,
received compensation for products or services other than investment banking or merchant banking or brokerage services from the subject company of this research report.
Subject Company may have been a client of MOSL or its associates during twelve months preceding the date of distribution of the research report.
MOSL and it’s associates have not received any compensation or other benefits from the subject company or third party in connection with the research report. To enhance transparency, MOSL has incorporated a Disclosure
of Interest Statement in this document. This should, however, not be treated as endorsement of the views expressed in the report. MOSL and / or its affiliates do and seek to do business including investment banking with
companies covered in its research reports. As a result, the recipients of this report should be aware that MOSL may have a potential conflict of interest that may affect the objectivity of this report. Compensation of Research
Analysts is not based on any specific merchant banking, investment banking or brokerage service transactions.
Terms & Conditions:
This report has been prepared by MOSL and is meant for sole use by the recipient and not for circulation. The report and information contained herein is strictly confidential and may not be altered in any way, transmitted to,
copied or distributed, in part or in whole, to any other person or to the media or reproduced in any form, without prior written consent of MOSL. The report is based on the facts, figures and information that are considered
true, correct, reliable and accurate. The intent of this report is not recommendatory in nature. The information is obtained from publicly available media or other sources believed to be reliable. Such information has not
been independently verified and no guaranty, representation of warranty, express or implied, is made as to its accuracy, completeness or correctness. All such information and opinions are subject to change without notice.
The report is prepared solely for informational purpose and does not constitute an offer document or solicitation of offer to buy or sell or subscribe for securities or other financial instruments for the clients. Though
disseminated to all the customers simultaneously, not all customers may receive this report at the same time. MOSL will not treat recipients as customers by virtue of their receiving this report.
Analyst Certification
The views expressed in this research report accurately reflect the personal views of the analyst(s) about the subject securities or issues, and no part of the compensation of the research analyst(s) was, is, or will be directly or
indirectly related to the specific recommendations and views expressed by research analyst(s) in this report.
Disclosure of Interest Statement
Analyst ownership of the stock
Companies where there is interest
No
A graph of daily closing prices of securities is available at
www.nseindia.com, www.bseindia.com.
Research Analyst views on Subject Company may vary based on Fundamental research and Technical Research. Proprietary
trading desk of MOSL or its associates maintains arm’s length distance with Research Team as all the activities are segregated from MOSL research activity and therefore it can have an independent view with regards to
subject company for which Research Team have expressed their views.
Regional Disclosures (outside India)
This report is not directed or intended for distribution to or use by any person or entity resident in a state, country or any jurisdiction, where such distribution, publication, availability or use would be contrary to law,
regulation or which would subject MOSL & its group companies to registration or licensing requirements within such jurisdictions.
For Hong Kong:
This report is distributed in Hong Kong by Motilal Oswal capital Markets (Hong Kong) Private Limited, a licensed corporation (CE AYY-301) licensed and regulated by the Hong Kong Securities and Futures Commission (SFC)
pursuant to the Securities and Futures Ordinance (Chapter 571 of the Laws of Hong Kong) “SFO”. As per SEBI (Research Analyst Regulations) 2014 Motilal Oswal Securities (SEBI Reg No. INH000000412) has an agreement with
Motilal Oswal capital Markets (Hong Kong) Private Limited for distribution of research report in Hong Kong. This report is intended for distribution only to “Professional Investors” as defined in Part I of Schedule 1 to SFO. Any
investment or investment activity to which this document relates is only available to professional investor and will be engaged only with professional investors.” Nothing here is an offer or solicitation of these securities,
products and services in any jurisdiction where their offer or sale is not qualified or exempt from registration. The Indian Analyst(s) who compile this report is/are not located in Hong Kong & are not conducting Research
Analysis in Hong Kong.
For U.S.
Motilal Oswal Securities Limited (MOSL) is not a registered broker - dealer under the U.S. Securities Exchange Act of 1934, as amended (the"1934 act") and under applicable state laws in the United States. In addition MOSL is
not a registered investment adviser under the U.S. Investment Advisers Act of 1940, as amended (the "Advisers Act" and together with the 1934 Act, the "Acts), and under applicable state laws in the United States.
Accordingly, in the absence of specific exemption under the Acts, any brokerage and investment services provided by MOSL, including the products and services described herein are not available to or intended for U.S.
persons. This report is intended for distribution only to "Major Institutional Investors" as defined by Rule 15a-6(b)(4) of the Exchange Act and interpretations thereof by SEC (henceforth referred to as "major institutional
investors"). This document must not be acted on or relied on by persons who are not major institutional investors. Any investment or investment activity to which this document relates is only available to major institutional
investors and will be engaged in only with major institutional investors. In reliance on the exemption from registration provided by Rule 15a-6 of the U.S. Securities Exchange Act of 1934, as amended (the "Exchange Act") and
interpretations thereof by the U.S. Securities and Exchange Commission ("SEC") in order to conduct business with Institutional Investors based in the U.S., MOSL has entered into a chaperoning agreement with a U.S.
registered broker-dealer, Motilal Oswal Securities International Private Limited. ("MOSIPL"). Any business interaction pursuant to this report will have to be executed within the provisions of this chaperoning agreement.
The Research Analysts contributing to the report may not be registered /qualified as research analyst with FINRA. Such research analyst may not be associated persons of the U.S. registered broker-dealer, MOSIPL, and
therefore, may not be subject to NASD rule 2711 and NYSE Rule 472 restrictions on communication with a subject company, public appearances and trading securities held by a research analyst account.
For Singapore
Motilal Oswal Capital Markets Singapore Pte Limited is acting as an exempt financial advisor under section 23(1)(f) of the Financial Advisers Act(FAA) read with regulation 17(1)(d) of the Financial Advisors Regulations and is a
subsidiary of Motilal Oswal Securities Limited in India. This research is distributed in Singapore by Motilal Oswal Capital Markets Singapore Pte Limited and it is only directed in Singapore to accredited investors, as defined in
the Financial Advisers Regulations and the Securities and Futures Act (Chapter 289), as amended from time to time. In respect of any matter arising from or in connection with the research you could contact the following
representatives of Motilal Oswal Capital Markets Singapore Pte Limited:
Disclaimer:
The report and information contained herein is strictly confidential and meant solely for the selected recipient and may not be altered in any way, transmitted to, copied or distributed, in part or in whole, to any other person
or to the media or reproduced in any form, without prior written consent. This report and information herein is solely for informational purpose and may not be used or considered as an offer document or solicitation of
offer to buy or sell or subscribe for securities or other financial instruments. Nothing in this report constitutes investment, legal, accounting and tax advice or a representation that any investment or strategy is suitable or
appropriate to your specific circumstances. The securities discussed and opinions expressed in this report may not be suitable for all investors, who must make their own investment decisions, based on their own investment
objectives, financial positions and needs of specific recipient. This may not be taken in substitution for the exercise of independent judgment by any recipient. Each recipient of this document should make such investigations
as it deems necessary to arrive at an independent evaluation of an investment in the securities of companies referred to in this document (including the merits and risks involved), and should consult its own advisors to
determine the merits and risks of such an investment. The investment discussed or views expressed may not be suitable for all investors. Certain transactions -including those involving futures, options, another derivative
products as well as non-investment grade securities - involve substantial risk and are not suitable for all investors. No representation or warranty, express or implied, is made as to the accuracy, completeness or fairness of
the information and opinions contained in this document. The Disclosures of Interest Statement incorporated in this document is provided solely to enhance the transparency and should not be treated as endorsement of the
views expressed in the report. This information is subject to change without any prior notice. The Company reserves the right to make modifications and alternations to this statement as may be required from time to time
without any prior approval. MOSL, its associates, their directors and the employees may from time to time, effect or have effected an own account transaction in, or deal as principal or agent in or for the securities
mentioned in this document. They may perform or seek to perform investment banking or other services for, or soli