8 November 2017
Q2FY18 Results Update | Sector: Textiles
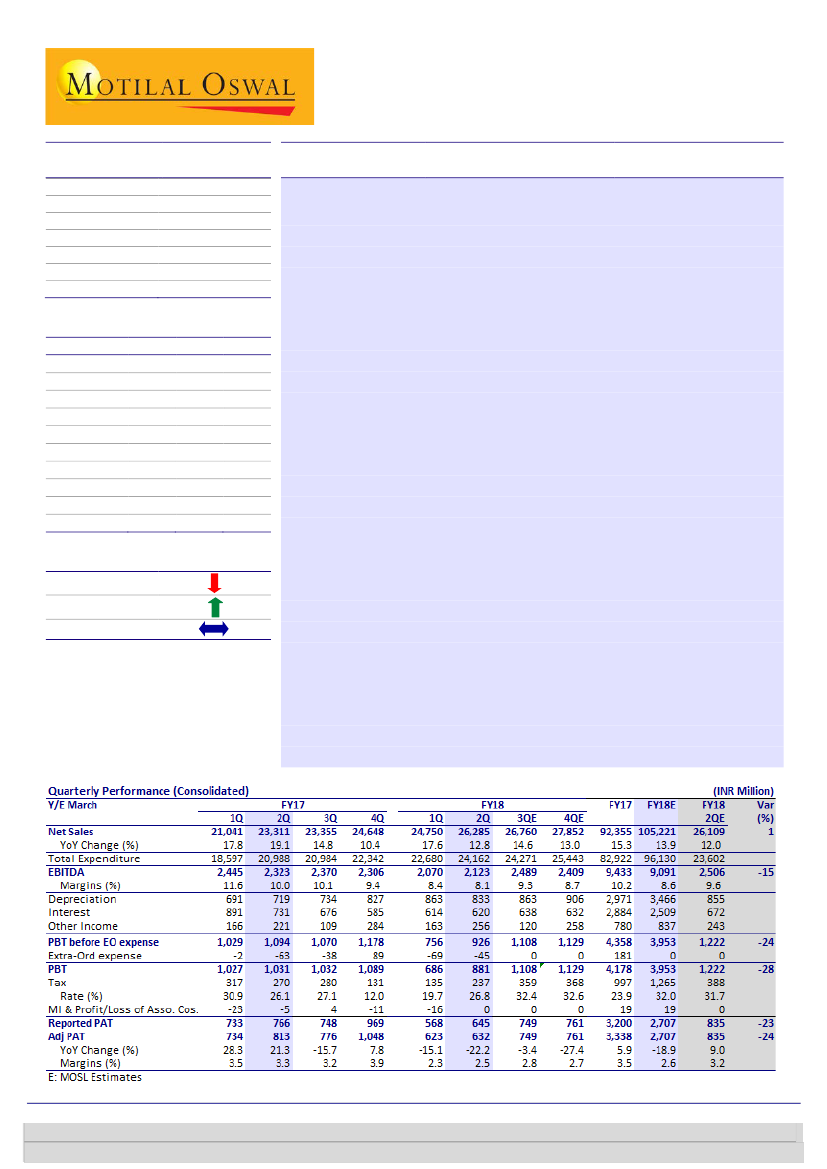
Arvind
Neutral
BSE SENSEX
33,219
Bloomberg
Equity Shares (m)
M.Cap.(INRb)/(USDb)
52-Week Range (INR)
1, 6, 12 Rel. Per (%)
Avg Val, INRm
Free float (%)
S&P CNX
10,303
ARVND IN
Demerger of brands and retail business to create long-term
258.2
117.5 / 1.8
value
462 / 322
GST transition, coupled with high cotton prices, impacts margins:
ARVIND’s
3/-8/-18
revenue grew 12% YoY to INR26.3b (est. of INR26.1b) in 2QFY18. Brands and
645.7
Retail grew 34% YoY to INR10.3b, while Textiles grew 1% YoY to INR14.4b.
57.1
CMP: INR414
TP: INR425(+3%)
Financials & Valuations (INR b)
2017 2018E
Y/E Mar
Net Sales
92.4
105.2
EBITDA
9.4
9.1
PAT
3.2
2.7
EPS (INR)
12.4
10.5
Gr. (%)
1.2
-15.0
BV/Sh (INR)
138.1
145.0
RoE (%)
10.3
7.4
RoCE (%)
8.8
6.8
P/E (x)
30.9
36.3
P/BV (x)
2.8
2.6
2019E
121.2
11.5
4.3
16.5
56.5
156.7
10.9
8.8
23.2
2.4
Estimate change
TP change
Rating change
EBITDA declined 9% YoY to INR2,123m (est. of INR2,506m), with the margin
contracting 190bp to 8.1% (est. of 9.6%) on account of higher raw material
costs (+300bp to 48.7% of net sales). Adjusted PAT stood at INR632m (est. of
INR835m) v/s INR813m in 2QFY17.
Branded Apparel and Engineering businesses to demerge:
The board has
approved the demerger of (i) Branded Apparel from the parent company to
Arvind Fashions and (ii) Engineering undertaking to Anup Engineering.
Shareholders will be entitled for one equity share of Arvind Fashions for
every five shares of ARVIND, and for one equity share of Anup Engineering
for 27 shares of ARVIND. It is important to note that this is a mirror image
being created, as the number of shares for Arvind Fashions stands at 52m
v/s listed ARVIND at 258.4m shares. Hence, the ratio stands at one new
share of Arvind Fashion for five shares of ARVIND. We believe the demerger
is positive for minority shareholders over the medium-to-long term.
Valuation and view:
We cut FY18/FY19E EBITDA by 10%/8% and
consequently FY18E/FY19E PAT by 18%/12% to factor in lower margins in
Textiles and higher growth in Brands and Retail, which is a lower-margin
business compared to Textiles. While we have cut our margin estimate for
Textiles and value it at 6x FY19E EV/EBITDA, we have increased our multiple
on Brands and Retail to 24x FY19 EV/EBITDA, which we believe is where
Arvind Fashions would trade post its listing, given its strong unique
positioning, future ready portfolio and increasing size of scale. Maintain
Neutral
with a TP of INR425.
Investors are advised to refer through important disclosures made at the last page of the Research Report.
Motilal Oswal research is available on www.motilaloswal.com/Institutional-Equities, Bloomberg, Thomson Reuters, Factset and S&P Capital.
Niket Shah – Research analyst
(Niket.Shah@MotilalOswal.com); +91 22 6129 1535
Aksh Vashishth – Research analyst
(Aksh.Vashishth@motilaloswal.com); +91 22 6129 1553

Arvind
Revenue in-line, miss on EBITDA and PAT
ARVIND reported revenue of INR26.3b (est. of INR26.1b) in 2QFY18, marking
YoY growth of 12.8%. Brands and Retail business grew 34% YoY to INR10.3b,
while Textiles grew 1% YoY to INR 14.4b.
EBITDA stood at INR2,123m (est. of INR2,506m), de-growing 9% YoY. EBITDA
margin contracted 190bp in 2QFY18 to 8.1% (est. of 9.6%) on account of higher
raw material costs (+300bp to 48.7% of net sales).
Adjusted PAT for 2QFY18 stood at INR632m (est. of INR835m) v/s INR813m in
2QFY17 on account of extraordinary expense of INR45m.
Cotton prices on an average increased by 14.7% YoY from INR102/kg in 2QFY17
to INR117/kg.
Fabric volumes declined by 4m mtrs in domestic markets on account of GST
implementation resulting in 1% margin erosion; however, garment volumes
increased 16% YoY.
Exhibit 1: Quarterly revenue trend
Revenues (INR m)
18
9
1
0
-2
19
Revenue growth (YoY)
15
10
18
13
Source: Company, MOSL
Exhibit 2: Quarterly EBITDA trend
EBITDA (INR m)
13
12
11
EBITDA Margins (%)
10
10
9
Exhibit 3: Quarterly PAT trend
PAT (INR m)
29
28
8
-37
-30
-17
PAT Growth (YoY)
21
8
-16
-15
-22
12
12
8
Source: Company, MOSL
8 November 2017
2

Arvind
Exhibit 4: Denim realizations to improve
Realisation (INR per metre)
164
169
177
179
184
184
186
193
199
Exhibit 5: Denim margins to sustain
25%
23%
Margins %
18% 19% 18% 18% 18%
17% 16% 16% 17%
12%
139
Source: Company, MOSL
Exhibit 6: Woven margins to sustain
Margins (%)
20% 20%
19% 19%
12%
18% 17%
17%
16% 16%
Exhibit 7: Woven’s now a larger segment than denims
Wovens revenues % of denim revenues
100.9
92.7 95.1
72.6 68.6
107.7
120.2
113.4
120.0 122.5
FY11 FY12 FY13 FY14 FY15 FY16 FY17 FY18E FY19E FY20E
Source: Company, MOSL
FY11 FY12 FY13 FY14 FY15 FY16 FY17 FY18E FY19E FY20E
Source: Company, MOSL
Exhibit 8: Garment realization improving steadily
Realisaiton (INR)
460
352
504
546
527
419
427
431
449
462
Exhibit 9: Garment margins to remain steady
Margins (%)
13% 13%
11%
12% 12% 12% 12% 12%
1%
2%
Source: Company, MOSL
8 November 2017
3

Arvind
Branded Apparel sails amid GST uncertainties
GST resulted in flattish growth in Textile, with a decline of 4m mtrs in domestic
market of fabric.
On the other hand, Branded Apparel business flourished with growth of 35%
YoY (15% growth adjusting for Tommy and CK revenue in both comparable
quarters).
Branded Apparel also witnessed significant margin expansion of 200bp, with LTL
growth of 20% in Unlimited and 3% overall.
Expansion in margin was despite of INR50m impact on EBITDA due to GST
implementation.
Valuation and view
We cut our FY18E/FY19E EBITDA by 10%/8%, and consequently FY18E/FY19E PAT by
18%/12% to factor in lower margins in Textiles and higher growth in Brands & Retail
business, which is a lower-margin business compared to Textiles. We believe the
demerger of Brands & Retail and Engineering business in two separate listed
companies highlights management’s commitment to create long-term shareholder
value. Also, this demerger will now help ARVIND to plough back its entire FCF back
into Textiles business to grow 10-12% v/s historical growth rates of 5% CAGR. While
we have cut our estimate on margins front for Textiles business and value it at 6x
FY19 EV/EBITDA, we have increased our multiple on Brands & Retail business from
20x FY19E EV/EBITDA to 25x FY19 EV/EBITDA, which we believe is where Arvind
Fashion would trade post its listing, given its strong unique positioning, future ready
portfolio and increasing size of scale going forward. Maintain
Neutral
at a TP of
INR425.
Exhibit 10: Key Operating metrics
FY13
Sales (INR m)
Denim
Wovens
Garment
Voils
Knits
Internal sale
Brands and Retail
Other revenues
Total revenues
Revenue Mix
Denim
Wovens
Garment
Voils
Knits
Internal sale
Brands and Retail
Other revenues
Total
15,430
14,310
5,040
2,690
1,500
-1770
14,050
4,125
53,405
FY14
18,900
17,970
6,720
3,260
2,070
-2,100
19,150
6,011
69,426
FY15
19,270
19,440
7,120
3,600
2,750
-2,410
23,610
9,174
79,627
FY16
18,660
20,090
8,800
3,250
3,020
-2,770
23,020
9,536
80,106
FY17
18,410
22,120
11,250
3,650
3,210
-3,000
28,980
11,595
92,355
FY18E
19,067
21,630
13,792
4,442
3,446
-3,300
37,977
12,755
105,221
FY19E
20,456
24,540
15,631
4,531
3,515
-3,630
46,584
14,030
121,241
FY20E
21,070
25,803
17,047
4,667
3,621
-3,993
56,575
16,134
136,629
28%
26%
9%
5%
3%
-3%
25%
7%
100%
26%
25%
9%
5%
3%
-3%
27%
8%
100%
23%
24%
9%
4%
3%
-3%
29%
11%
100%
22%
24%
11%
4%
4%
-3%
28%
11%
100%
19%
23%
12%
4%
3%
-3%
30%
12%
100%
17%
20%
12%
4%
3%
-3%
34%
11%
100%
16%
20%
12%
4%
3%
-3%
37%
11%
100%
15%
18%
12%
3%
3%
-3%
40%
11%
100%
Source: Company, MOSL
8 November 2017
4

Arvind
Financials and Valuations
Consolidated - Income Statement
Y/E March
Net Sales
Change (%)
EBITDA
Margin (%)
Depreciation
EBIT
Int. and Finance Charges
Other Income - Rec.
PBT bef. EO Exp.
EO Expense/(Income)
PBT after EO Exp.
Current Tax
Deferred Tax
Tax Rate (%)
Reported PAT
Less: Minority Interest
Net Profit
PAT Adj for EO items
Change (%)
Margin (%)
FY13
52,925
7.5
6,874
13.0
2,043
4,831
3,153
806
2,483
0
2,483
58
-56
0.1
2,481
3
2,484
2,484
12.8
4.7
FY14
68,621
29.7
9,340
13.6
2,252
7,088
3,545
694
4,237
164
4,073
163
385
13.4
3,525
13
3,539
3,681
48.2
5.4
FY15
78,514
14.4
10,129
12.9
2,124
8,005
3,946
932
4,991
543
4,448
1,060
12
24.1
3,377
35
3,411
3,824
3.9
4.9
FY16
80,106
2.0
9,511
11.9
2,405
7,106
3,586
821
4,341
-14
4,354
1,059
187
28.6
3,108
54
3,162
3,152
-17.6
3.9
FY17
92,355
15.3
9,433
10.2
2,971
6,463
2,884
780
4,358
181
4,178
1,350
-353
23.9
3,181
19
3,200
3,338
5.9
3.6
FY18E
105,221
13.9
9,091
8.6
3,445
5,646
2,509
837
3,974
0
3,974
1,272
0
32.0
2,702
19
2,721
2,721
-18.5
2.6
FY19E
121,241
15.2
11,518
9.5
3,662
7,856
2,520
901
6,236
0
6,236
1,996
0
32.0
4,241
19
4,260
4,260
56.5
3.5
(INR M)
FY20E
136,629
12.7
14,209
10.4
3,887
10,322
2,491
970
8,801
0
8,801
2,816
0
32.0
5,984
19
6,004
6,004
40.9
4.4
Consolidated - Balance Sheet
Y/E March
Equity Share Capital
Total Reserves
Net Worth
Minority Interest
Deferred Liabilities
Total Loans
Capital Employed
FY13
2,580
19,959
22,540
108
58
24,608
47,313
42,875
15,930
26,945
2,076
678
32,635
14,129
7,547
1,856
9,104
15,021
14,130
891
17,614
47,313
FY14
2,582
23,248
25,830
242
435
29,920
56,427
46,709
17,782
28,927
1,347
1,293
42,066
16,281
10,093
1,663
14,028
17,205
16,127
1,078
24,860
56,427
FY15
2,582
24,656
27,239
348
471
33,967
62,024
52,878
20,796
32,082
1,000
586
46,089
18,450
11,658
833
15,147
17,733
16,443
1,290
28,356
62,024
FY16
2,582
23,882
26,464
556
675
34,879
62,574
57,969
23,201
34,768
1,468
4,238
41,447
19,205
7,682
609
13,952
19,346
18,784
563
22,100
62,574
FY17
2,584
33,098
35,682
1,514
817
28,216
66,228
62,897
26,172
36,726
958
2,767
46,254
23,828
8,139
539
13,748
20,476
19,900
575
25,778
66,229
FY18E
2,584
34,886
37,470
1,514
817
28,816
68,617
67,097
29,616
37,481
1,052
2,767
51,403
27,544
8,937
268
14,655
24,086
23,453
633
27,317
68,617
FY19E
2,584
37,902
40,486
1,514
817
29,116
71,932
71,097
33,279
37,819
1,052
2,767
57,531
31,224
10,297
381
15,629
27,236
26,540
696
30,295
71,933
(INR M)
FY20E
2,584
42,350
44,934
1,514
817
28,816
76,080
75,597
37,166
38,431
1,052
2,767
64,489
35,137
11,978
698
16,676
30,658
29,892
766
33,830
76,081
Gross Block
Less: Accum. Deprn.
Net Fixed Assets
Capital WIP
Total Investments
Curr. Assets, Loans&Adv.
Inventory
Account Receivables
Cash and Bank Balance
Loans and Advances
Curr. Liability & Prov.
Account Payables
Provisions
Net Current Assets
Appl. of Funds
8 November 2017
5

Arvind
Financials and Valuations
Ratios
Y/E March
Basic (INR)
EPS
Cash EPS
BV/Share
DPS
Payout (%)
Valuation (x)
P/E
Cash P/E
P/BV
EV/Sales
EV/EBITDA
Dividend Yield (%)
Return Ratios (%)
RoE
RoCE
Working Capital Ratios
Asset Turnover (x)
Inventory (Days)
Debtor (Days)
Creditor (Days)
Leverage Ratio (x)
Debt/Equity
FY13
9.6
17.5
87.4
1.7
20.1
39.7
21.8
4.4
2.6
20.4
0.4
11.6
12.7
1.1
97.4
51
97
1.1
14.6
13.1
1.2
86.6
53
86
1.2
12.9
11.6
1.3
85.8
53
76
1.2
11.8
9.2
1.3
87.5
35
86
1.3
FY14
13.7
23.0
100.0
2.4
20.1
FY15
13.2
23.0
105.5
2.6
23.4
FY16
12.2
21.5
102.5
2.4
24.1
FY17
12.4
24.4
138.1
2.4
23.5
30.9
15.7
2.8
1.6
15.4
0.6
10.3
8.8
1.4
94.2
32
79
0.8
FY18E
10.5
23.9
145.0
3.0
34.5
36.3
16.0
2.6
1.4
16.1
0.8
7.4
6.8
1.5
95.5
31
81
0.8
FY19E
16.5
30.7
156.7
4.0
29.3
23.2
12.5
2.4
1.2
12.7
1.0
10.9
8.8
1.7
94.0
31
80
0.7
FY20E
23.2
38.3
173.9
5.0
26.0
16.5
10.0
2.2
1.1
10.2
1.3
14.1
10.7
1.8
93.9
32
80
0.6
Consolidated - Cash Flow Statement
Y/E March
NP/(Loss) Before Tax and EO Items
Depreciation
Interest & Finance Charges
Direct Taxes Paid
(Inc)/Dec in WC
CF from Operations
Others
CF from Operating incl EO
(inc)/dec in FA
Free Cash Flow
(Pur)/Sale of Investments
Others
CF from Investments
Issue of Shares
(Inc)/Dec in Debt
Interest Paid
Dividend Paid
Others
CF from Fin. Activity
Inc/Dec of Cash
Add: Beginning Balance
Closing Balance
FY13
2,483
2,043
3,153
620
-1,700
5,361
-461
4,900
-2,815
2,085
-281
-213
-3,308
0
3,253
-3,342
-298
-58
-445
1,147
709
1,856
FY14
4,073
2,252
3,312
1,078
-4,486
4,074
-191
3,883
-3,349
534
-706
-1,680
-5,734
10
5,311
-3,353
-496
188
1,660
-192
1,856
1,664
FY15
4,448
2,124
3,946
1,308
-3,142
6,067
-483
5,584
-5,386
198
-26
-462
-5,874
5
4,190
-3,976
-611
-148
-541
-830
1,664
833
FY16
5,165
2,559
3,811
1,225
-768
9,543
-593
8,950
-5,551
3,400
-70
644
-4,977
0
1,654
-3,801
-784
-1,267
-4,198
-225
833
609
FY17
4,358
2,971
2,884
997
-3,748
5,468
-181
5,288
-4,419
869
7,400
1,935
4,916
1
-6,663
-2,884
-747
19
-10,273
-69
609
539
FY18E
3,974
3,445
2,509
1,272
-1,810
6,847
0
6,847
-4,294
2,552
0
0
-4,294
0
600
-2,509
-933
19
-2,823
-271
539
268
FY19E
6,236
3,662
2,520
1,996
-2,864
7,559
0
7,559
-4,000
3,559
0
0
-4,000
0
300
-2,520
-1,244
19
-3,445
114
268
382
(INR M)
FY20E
8,801
3,887
2,491
2,816
-3,219
9,144
0
9,144
-4,500
4,644
0
0
-4,500
0
-300
-2,491
-1,555
19
-4,327
317
382
698
8 November 2017
6

Arvind
Corporate profile
Company description
Exhibit 1: Sensex rebased
Arvind Ltd, flagship of the Lalbhai group, is India’s
largest textile company. It is also the largest cotton
textile manufacturer, with an installed fabric
capacity of over 200mmtrs per annum. Company is
the preferred supplier to internationally renowned
brands like Polo, Armani Exchange, Diesel, and GAP
among others. It makes a strong statement among
international brands and retail business and has one
of the robust brand portfolios in India (28) along
with Megamart, the fastest growing value retail
chain.
Exhibit 2: Shareholding pattern (%)
Sep-17
Promoter
DII
FII
Others
42.9
14.1
26.6
16.4
Jun-17
42.9
13.8
25.4
17.9
Sep-16
43.8
16.2
22.5
17.5
Source: Capitaline
Source: MOSL/Bloomberg
Exhibit 3: Top holders
Holder Name
Life Insurance Corporation Of India
Kotak Select Focus Fund
Multiples Private Equity Fii I
Franklin Templeton Mutual Fund A/C
Franklin India Prima Plus
Nordea 1 Sicav - Emerging Stars Equity Fund
% Holding
3.3
1.9
1.9
1.9
1.9
Source: Capitaline
Note: FII Includes depository receipts
Exhibit 4: Top management
Name
Sanjay S Lalbhai
Kulin S Lalbhai
Punit Lalbhai
Jayesh K Shah
R V Bhimani
Designation
Chairman & Managing Director
Executive Director
Executive Director
Whole Time Director & CFO
Company Secretary
Exhibit 5: Directors
Name
Bakul H Dholakia
Nilesh D Shah
Samir Mehta
Name
Dileep C Choksi
Renuka Ramnath
Vallabh Bhanshali
Source: Capitaline
*Independent
Exhibit 6: Auditors
Name
Deloitte Haskins & Sells LLP
Hitesh Buch & Associates
Type
Statutory
Secretarial Audit
Exhibit 7: MOSL forecast v/s consensus
EPS
(INR)
FY18
FY19
FY20
MOSL
forecast
10.5
16.5
23.2
Consensus
forecast
14.5
20.7
25.9
Variation
(%)
-27.7
-20.2
-10.4
Source: Bloomberg
Source: Capitaline
8 November 2017
7

Disclosures:
The following Disclosures are being made in compliance with the SEBI Research Analyst Regulations 2014 (herein after referred to as the Regulations).
Motilal Oswal Securities Ltd. (MOSL) is a SEBI Registered Research Analyst having registration no. INH000000412. MOSL, the Research Entity (RE) as defined in the Regulations, is engaged in the business of providing Stock
broking services, Investment Advisory Services, Depository participant services & distribution of various financial products. MOSL is a subsidiary company of Motilal Oswal Financial Service Ltd. (MOFSL). MOFSL is a listed
public company, the details in respect of which are available on
www.motilaloswal.com.
MOSL is registered with the Securities & Exchange Board of India (SEBI) and is a registered Trading Member with National Stock
Exchange of India Ltd. (NSE) and Bombay Stock Exchange Limited (BSE), Metropolitan Stock Exchange Of India Ltd. (MSE) for its stock broking activities & is Depository participant with Central Depository Services Limited
(CDSL) & National Securities Depository Limited (NSDL) and is member of Association of Mutual Funds of India (AMFI) for distribution of financial products. Details of associate entities of Motilal Oswal Securities Limited are
available on the website at
http://onlinereports.motilaloswal.com/Dormant/documents/Associate%20Details.pdf
Pending Regulatory Enquiries against Motilal Oswal Securities Limited by SEBI:
SEBI pursuant to a complaint from client Shri C.R. Mohanraj alleging unauthorized trading, issued a letter dated 29th April 2014 to MOSL notifying appointment of an Adjudicating Officer as per SEBI regulations to hold
inquiry and adjudge violation of SEBI Regulations; MOSL requested SEBI to provide all documents, records, investigation report relied upon by SEBI which were referred in Show Cause Notice and also sought personal
hearing. The matter is currently pending.
MOSL, it’s associates, Research Analyst or their relative may have any financial interest in the subject company. MOSL and/or its associates and/or Research Analyst may have beneficial ownership of 1% or more securities in
the subject company at the end of the month immediately preceding the date of publication of the Research Report.
MOSL and its associate company(ies), their directors and Research Analyst and their relatives may; (a)
from time to time, have a long or short position in, act as principal in, and buy or sell the securities or derivatives thereof of companies mentioned herein. (b) be engaged in any other transaction involving such securities and
earn brokerage or other compensation or act as a market maker in the financial instruments of the company(ies) discussed herein or act as an advisor or lender/borrower to such company(ies) or may have any other
potential conflict of interests with respect to any recommendation and other related information and opinions.; however the same shall have no bearing whatsoever on the specific recommendations made by the analyst(s),
as the recommendations made by the analyst(s) are completely independent of the views of the associates of MOSL even though there might exist an inherent conflict of interest in some of the stocks mentioned in the
research report.
Research Analyst may have served as director/officer, etc. in the subject company in the last 12 month period. MOSL and/or its associates may have received any compensation from the subject company in
the past 12 months.
In the last 12 months period ending on the last day of the month immediately preceding the date of publication of this research report, MOSL or any of its associates may have:
a)
managed or co-managed public offering of securities from subject company of this research report,
b)
received compensation for investment banking or merchant banking or brokerage services from subject company of this research report,
c)
received compensation for products or services other than investment banking or merchant banking or brokerage services from the subject company of this research report.
d)
Subject Company may have been a client of MOSL or its associates during twelve months preceding the date of distribution of the research report.
MOSL and it’s associates have not received any compensation or other benefits from the subject company or third party in connection with the research report. To enhance transparency, MOSL has incorporated a Disclosure
of Interest Statement in this document. This should, however, not be treated as endorsement of the views expressed in the report. MOSL and / or its affiliates do and seek to do business including investment banking with
companies covered in its research reports. As a result, the recipients of this report should be aware that MOSL may have a potential conflict of interest that may affect the objectivity of this report. Compensation of Research
Analysts is not based on any specific merchant banking, investment banking or brokerage service transactions.
Terms & Conditions:
This report has been prepared by MOSL and is meant for sole use by the recipient and not for circulation. The report and information contained herein is strictly confidential and may not be altered in any way, transmitted to,
copied or distributed, in part or in whole, to any other person or to the media or reproduced in any form, without prior written consent of MOSL. The report is based on the facts, figures and information that are considered
true, correct, reliable and accurate. The intent of this report is not recommendatory in nature. The information is obtained from publicly available media or other sources believed to be reliable. Such information has not
been independently verified and no guaranty, representation of warranty, express or implied, is made as to its accuracy, completeness or correctness. All such information and opinions are subject to change without notice.
The report is prepared solely for informational purpose and does not constitute an offer document or solicitation of offer to buy or sell or subscribe for securities or other financial instruments for the clients. Though
disseminated to all the customers simultaneously, not all customers may receive this report at the same time. MOSL will not treat recipients as customers by virtue of their receiving this report.
Analyst Certification
The views expressed in this research report accurately reflect the personal views of the analyst(s) about the subject securities or issues, and no part of the compensation of the research analyst(s) was, is, or will be directly or
indirectly related to the specific recommendations and views expressed by research analyst(s) in this report.
Arvind
Disclosure of Interest Statement
Analyst ownership of the stock
Arvind
No
A graph of daily closing prices of securities is available at
www.nseindia.com, www.bseindia.com.
Research Analyst views on Subject Company may vary based on Fundamental research and Technical Research. Proprietary
trading desk of MOSL or its associates maintains arm’s length distance with Research Team as all the activities are segregated from MOSL research activity and therefore it can have an independent view with regards to
subject company for which Research Team have expressed their views.
Regional Disclosures (outside India)
This report is not directed or intended for distribution to or use by any person or entity resident in a state, country or any jurisdiction, where such distribution, publication, availability or use would be contrary to law,
regulation or which would subject MOSL & its group companies to registration or licensing requirements within such jurisdictions.
For Hong Kong:
This report is distributed in Hong Kong by Motilal Oswal capital Markets (Hong Kong) Private Limited, a licensed corporation (CE AYY-301) licensed and regulated by the Hong Kong Securities and Futures Commission (SFC)
pursuant to the Securities and Futures Ordinance (Chapter 571 of the Laws of Hong Kong) “SFO”. As per SEBI (Research Analyst Regulations) 2014 Motilal Oswal Securities (SEBI Reg No. INH000000412) has an agreement with
Motilal Oswal capital Markets (Hong Kong) Private Limited for distribution of research report in Hong Kong. This report is intended for distribution only to “Professional Investors” as defined in Part I of Schedule 1 to SFO. Any
investment or investment activity to which this document relates is only available to professional investor and will be engaged only with professional investors.” Nothing here is an offer or solicitation of these securities,
products and services in any jurisdiction where their offer or sale is not qualified or exempt from registration. The Indian Analyst(s) who compile this report is/are not located in Hong Kong & are not conducting Research
Analysis in Hong Kong.
For U.S.
Motilal Oswal Securities Limited (MOSL) is not a registered broker - dealer under the U.S. Securities Exchange Act of 1934, as amended (the"1934 act") and under applicable state laws in the United States. In addition MOSL is
not a registered investment adviser under the U.S. Investment Advisers Act of 1940, as amended (the "Advisers Act" and together with the 1934 Act, the "Acts), and under applicable state laws in the United States.
Accordingly, in the absence of specific exemption under the Acts, any brokerage and investment services provided by MOSL, including the products and services described herein are not available to or intended for U.S.
persons. This report is intended for distribution only to "Major Institutional Investors" as defined by Rule 15a-6(b)(4) of the Exchange Act and interpretations thereof by SEC (henceforth referred to as "major institutional
investors"). This document must not be acted on or relied on by persons who are not major institutional investors. Any investment or investment activity to which this document relates is only available to major institutional
investors and will be engaged in only with major institutional investors. In reliance on the exemption from registration provided by Rule 15a-6 of the U.S. Securities Exchange Act of 1934, as amended (the "Exchange Act") and
interpretations thereof by the U.S. Securities and Exchange Commission ("SEC") in order to conduct business with Institutional Investors based in the U.S., MOSL has entered into a chaperoning agreement with a U.S.
registered broker-dealer, Motilal Oswal Securities International Private Limited. ("MOSIPL"). Any business interaction pursuant to this report will have to be executed within the provisions of this chaperoning agreement.
The Research Analysts contributing to the report may not be registered /qualified as research analyst with FINRA. Such research analyst may not be associated persons of the U.S. registered broker-dealer, MOSIPL, and
therefore, may not be subject to NASD rule 2711 and NYSE Rule 472 restrictions on communication with a subject company, public appearances and trading securities held by a research analyst account.
For Singapore
Motilal Oswal Capital Markets Singapore Pte Limited is acting as an exempt financial advisor under section 23(1)(f) of the Financial Advisers Act(FAA) read with regulation 17(1)(d) of the Financial Advisors Regulations and is a
subsidiary of Motilal Oswal Securities Limited in India. This research is distributed in Singapore by Motilal Oswal Capital Markets Singapore Pte Limited and it is only directed in Singapore to accredited investors, as defined in
the Financial Advisers Regulations and the Securities and Futures Act (Chapter 289), as amended from time to time. In respect of any matter arising from or in connection with the research you could contact the following
representatives of Motilal Oswal Capital Markets Singapore Pte Limited:
Disclaimer:
The report and information contained herein is strictly confidential and meant solely for the selected recipient and may not be altered in any way, transmitted to, copied or distributed, in part or in whole, to any other person
or to the media or reproduced in any form, without prior written consent. This report and information herein is solely for informational purpose and may not be used or considered as an offer document or solicitation of
offer to buy or sell or subscribe for securities or other financial instruments. Nothing in this report constitutes investment, legal, accounting and tax advice or a representation that any investment or strategy is suitable or
appropriate to your specific circumstances. The securities discussed and opinions expressed in this report may not be suitable for all investors, who must make their own investment decisions, based on their own investment
objectives, financial positions and needs of specific recipient. This may not be taken in substitution for the exercise of independent judgment by any recipient. Each recipient of this document should make such investigations
as it deems necessary to arrive at an independent evaluation of an investment in the securities of companies referred to in this document (including the merits and risks involved), and should consult its own advisors to
determine the merits and risks of such an investment. The investment discussed or views expressed may not be suitable for all investors. Certain transactions -including those involving futures, options, another derivative
products as well as non-investment grade securities - involve substantial risk and are not suitable for all investors. No representation or warranty, express or implied, is made as to the accuracy, completeness or fairness of
the information and opinions contained in this document. The Disclosures of Interest Statement incorporated in this document is provided solely to enhance the transparency and should not be treated as endorsement of the
views expressed in the report. This information is subject to change without any prior notice. The Company reserves the right to make modifications and alternations to this statement as may be required from time to time
without any prior approval. MOSL, its associates, their directors and the employees may from time to time, effect or have effected an own account transaction in, or deal as principal or agent in or for the securities
mentioned in this document. They may perform or seek to perform investment banking or other services for, or solicit investment banking or other business from, any company referred to in this report. Each of these entities
functions as a separate, distinct and independent of each other. The recipient should take this into account before interpreting the document. This report has been prepared on the basis of information that is already
available in publicly accessible media or developed through analysis of MOSL. The views expressed are those of the analyst, and the Company may or may not subscribe to all the views expressed therein. This document is
being supplied to you solely for your information and may not be reproduced, redistributed or passed on, directly or indirectly, to any other person or published, copied, in whole or in part, for any purpose. This report is not
directed or intended for distribution to, or use by, any person or entity who is a citizen or resident of or located in any locality, state, country or other jurisdiction, where such distribution, publication, availability or use would
be contrary to law, regulation or which would subject MOSL to any registration or licensing requirement within such jurisdiction. The securities described herein may or may not be eligible for sale in all jurisdictions or to
certain category of investors. Persons in whose possession this document may come are required to inform themselves of and to observe such restriction. Neither the Firm, not its directors, employees, agents or
representatives shall be liable for any damages whether direct or indirect, incidental, special or consequential including lost revenue or lost profits that may arise from or in connection with the use of the information.
The
person accessing this information specifically agrees to exempt MOSL or any of its affiliates or employees from, any and all responsibility/liability arising from such misuse and agrees not to hold MOSL or any of its affiliates or
employees responsible for any such misuse and further agrees to hold MOSL or any of its affiliates or employees free and harmless from all losses, costs, damages, expenses that may be suffered by the person accessing this
information due to any errors and delays.
Registered Office Address: Motilal Oswal Tower, Rahimtullah Sayani Road, Opposite Parel ST Depot, Prabhadevi, Mumbai-400025; Tel No.: 022-3980 4263; www.motilaloswal.com. Correspondence Address: Palm Spring
Centre, 2nd Floor, Palm Court Complex, New Link Road, Malad (West), Mumbai- 400 064. Tel No: 022 3080 1000. Compliance Officer: Neeraj Agarwal, Email Id:
na@motilaloswal.com,
Contact No.:022-30801085.
Registration details of group entities.: MOSL: NSE (Cash): INB231041238; NSE (F&O): INF231041238; NSE (CD): INE231041238; BSE (Cash): INB011041257; BSE(F&O): INF011041257; BSE(CD); MSE(Cash): INB261041231;
MSE(F&O): INF261041231; MSE(CD): INE261041231; CDSL: IN-DP-16-2015; NSDL: IN-DP-NSDL-152-2000; Research Analyst: INH000000412. AMFI: ARN 17397. Investment Adviser: INA000007100. Motilal Oswal Asset
Management Company Ltd. (MOAMC): PMS (Registration No.: INP000000670) offers PMS and Mutual Funds products. Motilal Oswal Wealth Management Ltd. (MOWML): PMS (Registration No.: INP000004409) offers wealth
management solutions. *Motilal Oswal Securities Ltd. is a distributor of Mutual Funds, PMS, Fixed Deposit, Bond, NCDs, Insurance and IPO products. * Motilal Oswal Commodities Broker Pvt. Ltd. offers Commodities
Products. * Motilal Oswal Real Estate Investment Advisors II Pvt. Ltd. offers Real Estate products. * Motilal Oswal Private Equity Investment Advisors Pvt. Ltd. offers Private Equity products
8 November 2017
8