Alkem Laboratories
BSE SENSEX
33,315
Bloomberg
Equity Shares (m)
M.Cap.(INRb)/(USDb)
52-Week Range (INR)
1, 6, 12 Rel. Per (%)
Avg Val, INRm
Free float (%)
S&P CNX
10,322
ALKEM IN
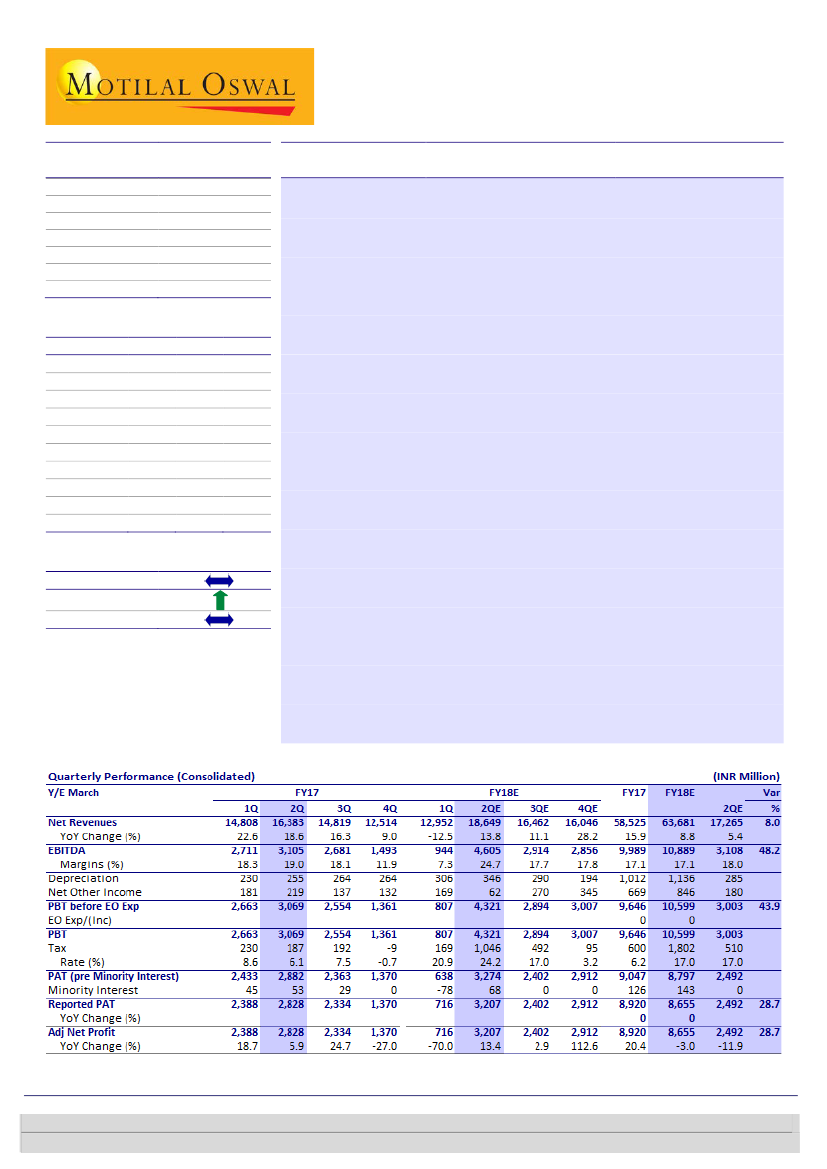
Strong numbers; operating leverage impact visible
120
Revenue increased ~14% YoY to INR18.6b (8% beat; adjusted for GST,
231.5 / 3.6
revenue growth stands at ~20%). EBITDA rose 48% YoY to INR4.6b (48%
2238 / 1535
beat), with the margin at ~24.7% (+570bp YoY and 1740bp QoQ), as other
0/-8/-3
expense declined ~500bp YoY (as % of sales). R&D expense stood at
87
INR901m (4.8% of sales). PAT increased ~13% YoY to INR3.2b (29% beat).
33.0
Strong domestic business growth; expect better growth in 2H:
Alkem’s
11 November 2017
2QFY18 Results Update | Sector: Healthcare
CMP: INR1,937 TP: INR1,950(+1%)
Neutral
Financials & Valuations (INR b)
2017
2018E
Y/E Mar
Net Sales
58.5
63.7
EBITDA
10.0
10.9
PAT
8.9
8.2
EPS (INR)
74.6
68.8
Gr. (%)
6.0
-7.7
BV/Sh (INR)
373.7
427.1
RoE (%)
21.9
17.2
RoCE (%)
20.1
16.0
P/E (x)
26.0
28.1
P/BV (x)
5.2
4.5
2019E
74.6
13.5
10.8
90.7
31.8
497.4
19.6
21.8
21.3
3.9
Estimate change
TP change
Rating change
domestic business grew robustly by 15% YoY to INR14.1b, led by channel
refilling post GST. The company is expanding its presence in the domestic
business via new product launches and expanding into new therapies. Alkem
maintained its guidance for mid-teens growth in FY18; with channel refilling
post GST, it is confident to achieve this target. Inventory levels are at ~30
days post GST, up from 17 days in 1QFY18; the company expects this to
improve, going forward.
Key launches to drive US business:
US sales came in at USD47.5m. We
expect ramp-up in the US business in the coming quarters, led by the
expected launch of 8-10 products in FY18. Also, 2H is expected to improve
on the back of seasonally strong quarter for Benzonatate and the launch of
Nexium/Prasugrel.
Key concall takeaways:
a) Price erosion is in single-digit for Alkem. b)
Company is entering OTC business and expects to break-even in 2-3 years. c)
Expects higher than market growth rate going ahead. d) Planning to file 12-
15 ANDAs in FY18. e) Expects in-licensing opportunities in (i) acute segment
in anti-infectives therapy and (ii) chronic in the diabetic segment.
Maintain Neutral:
We continue believing that Alkem is the best way to play
the domestic growth story (>70% of revenue and >85% of EBITDA came from
India in FY17). Having said that, at current valuations, the stock provides
limited room for upside. Our target price of INR1,950 for Alkem is based on
20x 1HFY20E PER (v/s INR1,830 @ 20x FY19E PER).
Investors are advised to refer through important disclosures made at the last page of the Research Report.
Motilal Oswal research is available on www.motilaloswal.com/Institutional-Equities, Bloomberg, Thomson Reuters, Factset and S&P Capital.
Kumar Saurabh-Research analyst
(Kumar.Saurabh@MotilalOswal.com); +91 22 6129 1519
Ankeet Pandya-Research analyst
(Ankeet.Pandya@MotilalOswal.com)

Alkem Laboratories
Key highlights from earnings call
India business (76% of sales)
Alkem’s India sales reported INR14.1b sales in 2QFY18, increasing 15% YoY.
Sharp recovery in domestic business post GST
Alkem’s domestic business saw robust growth in 2QFY18 on the back of channel
refilling post GST, as inventory levels increased to 30 days from ~17 days in
1QFY18. Company has entered the Urology therapy, which is an INR20b market.
Alkem exhibited robust growth in emerging therapies of Neuro/CNS, Cardiac,
Anti-Diabetic and Derma, thereby outperforming market growth. The company’s
established therapy areas of anti-infectives growth declined 18% (-13.5% market
growth), while growth in gastro was muted, although company has maintained
its leading position. In vitamins, growth was 8% v/s market growth of 0.4%.
Exhibit 1: Domestic business posted strong growth of 15% YoY
India sales (INR m)
32
23
22
18
Growth (%)
13
11
-20
15
Source: Company, MOSL
US business (16% of sales)
US sales saw flattish growth of 1% to INR3b, impacted by price erosion and currency
movement. US business is expected to improve going forward led by an increase in
the number of ANDA filings; ~50% of the portfolio yet to be approved and
commercialized. During the quarter, the company filed four ANDAs and received
three final approvals. Cumulatively, it has filed 95 ANDAs (including 38 para IV) and
received 43 approvals till date, including five tentative approvals and one NDA. The
company expects ~12-15 filings in FY18.
Exhibit 2: US business was flat in 2QFY18
US sales (INR m)
Growth (%)
24
19
18
12
30
9
0
1
Source: Company, MOSL
11 November 2017
2

Alkem Laboratories
Exhibit 3: Cumulative US ANDA filings
95
Exhibit 4: ~70% of pending ANDA’s are Para IVs
US Filings
Total ANDAs filed
Para IV (including FTFs)
NDAs
# Nos.
95
38
1
Source: Company, MOSL
52
37
6
Final Approval
Tentative
Approvals
Pending Total
Total
Source: Company, MOSL
Other international business (7% of sales)
Other international business grew 55% YoY to INR1.3b. Its key markets like Australia,
Chile and Kazakhstan recorded health growth. For other international markets,
growth was even high in constant currency.
Valuations
Over the last 10 years, Alkem has outperformed most of the Indian pharma
companies in the domestic market, driven by (i) consistent launches in acute
therapies like Anti Infective, Pain/Analgesic and Vitamins and (ii) growing its
presence in high-growth chronic therapies like CNS, Cardiac, Derma and Anti-
Diabetic. Alkem has also launched ~25 products in the US market and has 52
pending approvals. Although India business faces regulatory issues, impact of GST
and structural changes and pricing pressure in the US business, we expect revenue
CAGR of 14% and earnings CAGR of 12% FY17-20E.
We continue believing that Alkem is the best way to play the domestic growth story
(>70% of revenue and >85% of EBITDA came from India in FY17). Having said that, at
current valuations, the stock provides limited room for upside. Our target price of
INR1,950 for Alkem is based on 20x 1HFY20E PER (v/s INR1,830 @ 20x FY19E PER).
11 November 2017
3

Alkem Laboratories
Story in charts
Exhibit 5: Overall sales increased 14% YoY to INR18.6b in 2Q
Sales (INR b)
Exhibit 6: Operational efficiency led to increase in margin
EBITDA (INR b)
17.1 18.5 18.5
EBITDA margin (%)
24.7
17.3
14.5
13.6
18.3 19.0 18.1
11.9
7.3
13.8 12.7 11.5 14.8 16.4 14.8 12.5 13.0
9.9 9.1 12.1
18.6
1.7 1.3 2.1 2.6 2.4 1.6 2.7 3.1 2.7 1.5 0.9 4.6
Source: Company, MOSL
Exhibit 7: Gross margins improved due to product mix
Gross Profit (INR b)
60.7 60.3 60.1
57.1
62.5
Gross margin (%)
60.9 60.9
63.5 63.2
56.6
62.0
Exhibit 8: 2Q reported EPS stood at INR26.8/share
EPS (INR/sh)
58.3
5.8 5.2 7.3 8.3 7.7 7.2 9.0 10.0 9.4 7.9 7.3 11.6
13.5 10.9
16.8
22.3
15.8
7.2
20.0 23.7 19.5
26.8
11.5 6.0
Source: Company, MOSL
Exhibit 9: Revenues to exhibit 14% CAGR over FY17-20E
Revenue (INR b)
Exhibit 10: India sales to exhibit 15% CAGR over FY17-20E
India business (INR b)
16.9 20.2 25.0 31.3 37.9 50.5 58.5 63.7 74.6 85.7
14.8 17.5 20.5 23.6 28.3 36.5 42.2 47.2 54.8 63.5
Source: Company, MOSL
11 November 2017
4

Alkem Laboratories
Story in charts
Exhibit 11: US sales to be driven by new launches
US sales (INR m)
150.6
127.8
56.5
53.2 53.3
21.5 10.7 18.9 18.1
0.5
1.2
1.9
4.2
6.5
9.9
12.0 13.3 15.8 18.7
2.8
5.9
7.4
13.5
17.1
YoY Growth (%)
Exhibit 12: Increasing US sales contribution
% of sales
19.9 20.8 20.6 21.1 21.4
Source: Company, MOSL
Exhibit 13: R&D expense to be 5.5-6.5% of sales in FY18-20
R&D expense (INR m)
5.2%
As % of sales
6.0%
6.0%
6.5%
Exhibit 14: Better business mix to drive profitability
EBITDA (INR b)
17.0
18.6
14.5 13.1 14.4
EBITDA margin (%)
19.2
16.9 17.1 17.1 18.1
4.3%
5.0%
4.5%
4.3%
1082
1570
1696
2171
3043
3821
4478
5570
2.9
3.8
3.6
4.1
5.4
8.5
10.0 10.9 13.5 16.5
Source: Company, MOSL
Exhibit 15: Improving return ratios
RoE (%)
25.0
19.2
17.8
18.3
18.4
18.9
25.2
RoCE (%)
21.9
20.1
19.6
21.8
16.0
19.5
23.6
Exhibit 16: Earnings to grow at 12% CAGR over FY17-20E
EPS (INR/sh)
17.2
14.3
14.2
14.6
24.7 34.0 32.1 36.4 38.7 70.4 74.6 68.8 90.7 105.2
Source: Company, MOSL
11 November 2017
5

Alkem Laboratories
Financials and Valuations
Consolidated - Income Statement
Y/E March
Total Income from Operations
Change (%)
EBITDA
Margin (%)
Depreciation
EBIT
Int. and Finance Charges
Other Income
PBT bef. EO Exp.
EO Items
PBT after EO Exp.
Current Tax
Deferred Tax
Tax Rate (%)
Less: Mionrity Interest
Reported PAT
Adjusted PAT
Change (%)
Margin (%)
FY14
31,260
25.3
4,100
13.1
523
3,578
931
1,653
4,300
0
4,300
25
-79
-1.2
0
4,353
4,353
13.4
13.9
FY15
37,887
21.2
5,445
14.4
703
4,742
811
1,810
5,741
-574
5,167
85
457
10.5
0
4,625
5,139
18.1
13.6
FY16
50,479
33.2
8,533
16.9
933
7,599
712
2,397
9,284
0
9,284
1,762
0
19.0
114
7,409
8,419
63.8
16.7
FY17
58,525
15.9
9,990
17.1
1,012
8,978
452
1,120
9,646
0
9,646
600
0
6.2
126
8,920
8,920
6.0
15.2
FY18E
63,681
8.8
10,889
17.1
1,136
9,754
392
1,238
10,599
0
10,599
2,226
0
21.0
143
8,231
8,231
-7.7
12.9
FY19E
74,639
17.2
13,510
18.1
1,366
12,144
392
1,356
13,107
0
13,107
2,097
0
16.0
161
10,849
10,849
31.8
14.5
INR million
FY20E
85,693
14.8
16,453
19.2
1,592
14,861
392
1,886
16,355
0
16,355
3,598
0
22.0
182
12,574
12,574
15.9
14.7
Consolidated - Balance Sheet
Y/E March
Equity Share Capital
Total Reserves
Net Worth
Minority Interest
Deferred Tax Liabilities
Total Loans
Capital Employed
Net Fixed Assets
Goodwill on Consolidation
Capital WIP
Total Investments
Curr. Assets, Loans&Adv.
Inventory
Account Receivables
Cash and Bank Balance
Loans and Advances
Curr. Liability & Prov.
Account Payables
Other Current Liabilities
Provisions
Net Current Assets
Deferred Tax assets
Appl. of Funds
E: MOSL Estimates
FY14
120
25,730
25,850
0
781
11,284
37,915
9,797
1,903
0
5,880
25,414
6,203
3,669
2,063
13,478
5,251
3,057
1,267
926
20,163
172
37,915
0
FY15
239
29,752
29,991
857
1,256
13,059
45,162
11,429
3,421
0
4,808
33,008
7,842
5,271
7,908
11,987
7,796
4,619
1,667
1,510
25,212
292
45,162
0
FY16
239
36,681
36,920
950
10
5,876
43,756
10,310
4,185
1,724
5,086
28,878
9,094
5,675
7,809
6,300
11,589
5,805
3,908
1,877
17,288
5,162
43,756
0
FY17
239
44,437
44,676
1,152
5
6,539
52,373
13,945
4,026
2,993
5,530
32,225
12,060
7,136
3,993
9,036
13,308
7,414
3,628
2,266
18,917
6,963
52,373
0
FY18E
239
50,815
51,054
1,152
5
6,539
58,750
16,703
4,026
2,099
5,530
38,704
10,848
6,979
11,415
9,463
15,273
6,942
3,948
4,383
23,430
6,963
58,750
0
FY19E
239
59,221
59,460
1,152
5
6,539
67,156
18,516
4,026
1,920
5,530
48,328
12,561
8,180
21,407
6,180
18,126
8,039
4,627
5,460
30,202
6,963
67,156
0
INR million
FY20E
239
68,964
69,203
1,152
5
6,539
76,899
19,960
4,026
1,884
5,530
59,387
14,227
9,391
28,673
7,096
20,851
9,105
5,312
6,433
38,537
6,963
76,899
0
11 November 2017
6

Alkem Laboratories
Financials and Valuations
Ratios
Y/E March
Basic (INR)
EPS
Cash EPS
BV/Share
DPS
Payout (%)
Valuation (x)
P/E
Cash P/E
P/BV
EV/Sales
EV/EBITDA
Dividend Yield (%)
FCF per share
Return Ratios (%)
RoE
RoCE
RoIC
Working Capital Ratios
Asset Turnover (x)
Inventory (Days)
Debtor (Days)
Creditor (Days)
Leverage Ratio (x)
Debt/Equity
FY14
36.4
40.8
216
2.0
6.4
53.2
47.5
9.0
7.7
58.7
0.1
15.9
18.3
14.2
13.7
0.8
72
41
36
0.4
38.7
FY15
38.7
48.9
251
4.0
12.3
50.1
39.6
7.7
6.2
43.5
0.2
16.1
18.4
14.6
13.6
0.8
76
49
45
0.4
70.4
FY16
70.4
78.2
309
6.2
11.9
27.5
24.8
6.3
4.5
26.9
0.3
39.5
25.2
18.9
20.0
1.2
66
40
42
0.2
75.7
FY17
74.6
83.1
374
12.7
20.1
26.0
23.3
5.2
4.0
23.4
0.7
-22.1
21.9
20.1
24.4
1.1
75
45
46
0.1
72.5
FY18E
68.8
78.3
427
13.1
22.5
28.1
24.7
4.5
3.6
20.8
0.7
71.7
17.2
16.0
19.4
1.1
62
39
40
0.1
93.3
FY19E
90.7
102.2
497
17.2
22.5
21.3
19.0
3.9
2.9
16.0
0.9
97.3
19.6
21.8
26.2
1.1
61
39
39
0.1
FY20E
105.2
118.5
579
20.0
22.5
18.4
16.3
3.3
2.4
12.7
1.0
73.5
19.5
23.6
29.3
1.1
61
39
39
0.1
Consolidated - Cash Flow Statement
Y/E March
OP/(Loss) before Tax
Depreciation
Interest & Finance Charges
Direct Taxes Paid
(Inc)/Dec in WC
CF from Operations
Others
CF from Operating incl EO
(Inc)/Dec in FA
Free Cash Flow
(Pur)/Sale of Investments
Others
CF from Investments
Issue of Shares
Inc/(Dec) in Debt
Interest Paid
Dividend Paid
Others
CF from Fin. Activity
Inc/Dec of Cash
Opening Balance
Closing Balance
FY14
4,300
523
-555
-1,111
-364
2,793
107
2,900
-1,004
1,897
25
-3,814
-4,792
0
-4,732
-914
-319
-35
-6,000
-7,892
9,955
2,063
FY15
5,142
703
-1,196
-1,056
-963
2,630
652
3,281
-1,354
1,928
1,028
3,406
3,081
0
871
-793
-567
-29
-518
5,845
2,063
7,908
FY16
9,284
933
-599
-1,982
101
7,737
-478
7,258
-2,535
4,724
325
4,233
2,023
0
-6,714
-713
-1,845
0
-9,273
8
1,262
7,809
FY17
9,646
1,012
-592
-2,640
-3,639
3,788
-90
3,698
-6,344
-2,646
0
3,484
-2,859
0
1,134
-636
-863
0
-366
473
1,193
3,993
FY18E
10,599
1,136
-846
-2,226
2,909
11,572
0
11,572
-3,000
8,572
0
1,238
-1,762
0
0
-392
-1,853
-143
-2,388
7,422
1,666
11,415
FY19E
13,107
1,366
-963
-2,097
3,220
14,633
0
14,633
-3,000
11,633
0
1,356
-1,644
0
0
-392
-2,443
-161
-2,996
9,992
9,088
21,407
FY20E
16,355
1,592
-1,493
-3,598
-1,068
11,787
0
11,787
-3,000
8,787
0
1,886
-1,114
0
0
-392
-2,831
-182
-3,406
7,267
19,080
28,673
11 November 2017
7

Alkem Laboratories
Corporate profile
Company description
Established in 1973 and headquartered in Mumbai,
Alkem is a leading India pharmaceutical company
with global operations, engaged in the
development, manufacture and sale of
pharmaceutical and nutraceutical products. With a
portfolio of more than 700 brands in India, Alkem is
ranked fifth largest pharmaceutical company in
India in terms of domestic sales.
Source: MOSL/Bloomberg
Exhibit 1: Sensex rebased
Exhibit 2: Shareholding pattern (%)
Sep-17
Promoter
DII
FII
Others
67.0
2.3
4.1
26.6
Jun-17
67.0
2.4
4.2
26.4
Sep-16
66.9
3.3
3.7
26.1
Source: Capitaline
Exhibit 3: Top holders
Holder Name
Tushar Kumar - Shares held on behalf of
Prasid Uno Family Trust.
Rajesh Kumar
Rajeev Ranjan
Deepak Kumar Singh
Kishor Kumar Singh
% Holding
6.3
2.8
2.5
2.3
2.3
Source: Capitaline
Note: FII Includes depository receipts
Exhibit 4: Top management
Name
Basudeo N Singh
Samprada Singh
Dhananjay Kumar Singh.
SANDEEP SINGH
Balmiki Prasad Singh
Mritunjay Kumar Singh
Manish Narang
Designation
Executive Chairman
Chairman Emeritus
Joint
Managing
Director
Joint
Managing
Director
Executive Director
Executive Director
Company Secretary
Exhibit 5: Directors
Name
A K Purwar
Mangaldas Chhaganlal Shah
SANGEETA KAPILJIT SINGH
Name
Akhouri Maheshwar Prasad
Ranjal Laxmana Shenoy
SUDHA RAVI
*Independent
Source: Capitaline
Exhibit 6: Auditors
Name
BSR & Co LLP
Manish Ghia & Associates
Suresh D Shenoy
Type
Statutory
Secretarial Audit
Cost Auditor
Exhibit 7: MOSL forecast v/s consensus
EPS
(INR)
FY18
FY19
FY20
MOSL
forecast
68.8
90.7
105.2
Consensus
forecast
68.4
92.1
106.6
Variation (%)
0.6
-1.5
-1.3
Source: Bloomberg
Source: Capitaline
11 November 2017
8

Alkem Laboratories
NOTES
11 November 2017
9

Disclosures:
The following Disclosures are being made in compliance with the SEBI Research Analyst Regulations 2014 (herein after referred to as the Regulations).
Motilal Oswal Securities Ltd. (MOSL) is a SEBI Registered Research Analyst having registration no. INH000000412. MOSL, the Research Entity (RE) as defined in the Regulations, is engaged in the business of providing Stock
broking services, Investment Advisory Services, Depository participant services & distribution of various financial products. MOSL is a subsidiary company of Motilal Oswal Financial Service Ltd. (MOFSL). MOFSL is a listed
public company, the details in respect of which are available on
www.motilaloswal.com.
MOSL is registered with the Securities & Exchange Board of India (SEBI) and is a registered Trading Member with National Stock
Exchange of India Ltd. (NSE) and Bombay Stock Exchange Limited (BSE), Metropolitan Stock Exchange Of India Ltd. (MSE) for its stock broking activities & is Depository participant with Central Depository Services Limited
(CDSL) & National Securities Depository Limited (NSDL) and is member of Association of Mutual Funds of India (AMFI) for distribution of financial products. Details of associate entities of Motilal Oswal Securities Limited are
available on the website at
http://onlinereports.motilaloswal.com/Dormant/documents/Associate%20Details.pdf
Pending Regulatory Enquiries against Motilal Oswal Securities Limited by SEBI:
SEBI pursuant to a complaint from client Shri C.R. Mohanraj alleging unauthorized trading, issued a letter dated 29th April 2014 to MOSL notifying appointment of an Adjudicating Officer as per SEBI regulations to hold
inquiry and adjudge violation of SEBI Regulations; MOSL requested SEBI to provide all documents, records, investigation report relied upon by SEBI which were referred in Show Cause Notice and also sought personal
hearing. The matter is currently pending.
MOSL, it’s associates, Research Analyst or their relative may have any financial interest in the subject company. MOSL and/or its associates and/or Research Analyst may have beneficial ownership of 1% or more securities in
the subject company at the end of the month immediately preceding the date of publication of the Research Report.
MOSL and its associate company(ies), their directors and Research Analyst and their relatives may; (a)
from time to time, have a long or short position in, act as principal in, and buy or sell the securities or derivatives thereof of companies mentioned herein. (b) be engaged in any other transaction involving such securities and
earn brokerage or other compensation or act as a market maker in the financial instruments of the company(ies) discussed herein or act as an advisor or lender/borrower to such company(ies) or may have any other
potential conflict of interests with respect to any recommendation and other related information and opinions.; however the same shall have no bearing whatsoever on the specific recommendations made by the analyst(s),
as the recommendations made by the analyst(s) are completely independent of the views of the associates of MOSL even though there might exist an inherent conflict of interest in some of the stocks mentioned in the
research report.
Research Analyst may have served as director/officer, etc. in the subject company in the last 12 month period. MOSL and/or its associates may have received any compensation from the subject company in
the past 12 months.
In the last 12 months period ending on the last day of the month immediately preceding the date of publication of this research report, MOSL or any of its associates may have:
a)
managed or co-managed public offering of securities from subject company of this research report,
b)
received compensation for investment banking or merchant banking or brokerage services from subject company of this research report,
c)
received compensation for products or services other than investment banking or merchant banking or brokerage services from the subject company of this research report.
d)
Subject Company may have been a client of MOSL or its associates during twelve months preceding the date of distribution of the research report.
MOSL and it’s associates have not received any compensation or other benefits from the subject company or third party in connection with the research report. To enhance transparency, MOSL has incorporated a Disclosure
of Interest Statement in this document. This should, however, not be treated as endorsement of the views expressed in the report. MOSL and / or its affiliates do and seek to do business including investment banking with
companies covered in its research reports. As a result, the recipients of this report should be aware that MOSL may have a potential conflict of interest that may affect the objectivity of this report. Compensation of Research
Analysts is not based on any specific merchant banking, investment banking or brokerage service transactions.
Terms & Conditions:
This report has been prepared by MOSL and is meant for sole use by the recipient and not for circulation. The report and information contained herein is strictly confidential and may not be altered in any way, transmitted to,
copied or distributed, in part or in whole, to any other person or to the media or reproduced in any form, without prior written consent of MOSL. The report is based on the facts, figures and information that are considered
true, correct, reliable and accurate. The intent of this report is not recommendatory in nature. The information is obtained from publicly available media or other sources believed to be reliable. Such information has not
been independently verified and no guaranty, representation of warranty, express or implied, is made as to its accuracy, completeness or correctness. All such information and opinions are subject to change without notice.
The report is prepared solely for informational purpose and does not constitute an offer document or solicitation of offer to buy or sell or subscribe for securities or other financial instruments for the clients. Though
disseminated to all the customers simultaneously, not all customers may receive this report at the same time. MOSL will not treat recipients as customers by virtue of their receiving this report.
Analyst Certification
The views expressed in this research report accurately reflect the personal views of the analyst(s) about the subject securities or issues, and no part of the compensation of the research analyst(s) was, is, or will be directly or
indirectly related to the specific recommendations and views expressed by research analyst(s) in this report.
Alkem Laboratories
Disclosure of Interest Statement
Analyst ownership of the stock
Alkem Laboratories
No
A graph of daily closing prices of securities is available at
www.nseindia.com, www.bseindia.com.
Research Analyst views on Subject Company may vary based on Fundamental research and Technical Research. Proprietary
trading desk of MOSL or its associates maintains arm’s length distance with Research Team as all the activities are segregated from MOSL research activity and therefore it can have an independent view with regards to
subject company for which Research Team have expressed their views.
Regional Disclosures (outside India)
This report is not directed or intended for distribution to or use by any person or entity resident in a state, country or any jurisdiction, where such distribution, publication, availability or use would be contrary to law,
regulation or which would subject MOSL & its group companies to registration or licensing requirements within such jurisdictions.
For Hong Kong:
This report is distributed in Hong Kong by Motilal Oswal capital Markets (Hong Kong) Private Limited, a licensed corporation (CE AYY-301) licensed and regulated by the Hong Kong Securities and Futures Commission (SFC)
pursuant to the Securities and Futures Ordinance (Chapter 571 of the Laws of Hong Kong) “SFO”. As per SEBI (Research Analyst Regulations) 2014 Motilal Oswal Securities (SEBI Reg No. INH000000412) has an agreement with
Motilal Oswal capital Markets (Hong Kong) Private Limited for distribution of research report in Hong Kong. This report is intended for distribution only to “Professional Investors” as defined in Part I of Schedule 1 to SFO. Any
investment or investment activity to which this document relates is only available to professional investor and will be engaged only with professional investors.” Nothing here is an offer or solicitation of these securities,
products and services in any jurisdiction where their offer or sale is not qualified or exempt from registration. The Indian Analyst(s) who compile this report is/are not located in Hong Kong & are not conducting Research
Analysis in Hong Kong.
For U.S.
Motilal Oswal Securities Limited (MOSL) is not a registered broker - dealer under the U.S. Securities Exchange Act of 1934, as amended (the"1934 act") and under applicable state laws in the United States. In addition MOSL is
not a registered investment adviser under the U.S. Investment Advisers Act of 1940, as amended (the "Advisers Act" and together with the 1934 Act, the "Acts), and under applicable state laws in the United States.
Accordingly, in the absence of specific exemption under the Acts, any brokerage and investment services provided by MOSL, including the products and services described herein are not available to or intended for U.S.
persons. This report is intended for distribution only to "Major Institutional Investors" as defined by Rule 15a-6(b)(4) of the Exchange Act and interpretations thereof by SEC (henceforth referred to as "major institutional
investors"). This document must not be acted on or relied on by persons who are not major institutional investors. Any investment or investment activity to which this document relates is only available to major institutional
investors and will be engaged in only with major institutional investors. In reliance on the exemption from registration provided by Rule 15a-6 of the U.S. Securities Exchange Act of 1934, as amended (the "Exchange Act") and
interpretations thereof by the U.S. Securities and Exchange Commission ("SEC") in order to conduct business with Institutional Investors based in the U.S., MOSL has entered into a chaperoning agreement with a U.S.
registered broker-dealer, Motilal Oswal Securities International Private Limited. ("MOSIPL"). Any business interaction pursuant to this report will have to be executed within the provisions of this chaperoning agreement.
The Research Analysts contributing to the report may not be registered /qualified as research analyst with FINRA. Such research analyst may not be associated persons of the U.S. registered broker-dealer, MOSIPL, and
therefore, may not be subject to NASD rule 2711 and NYSE Rule 472 restrictions on communication with a subject company, public appearances and trading securities held by a research analyst account.
For Singapore
Motilal Oswal Capital Markets Singapore Pte Limited is acting as an exempt financial advisor under section 23(1)(f) of the Financial Advisers Act(FAA) read with regulation 17(1)(d) of the Financial Advisors Regulations and is a
subsidiary of Motilal Oswal Securities Limited in India. This research is distributed in Singapore by Motilal Oswal Capital Markets Singapore Pte Limited and it is only directed in Singapore to accredited investors, as defined in
the Financial Advisers Regulations and the Securities and Futures Act (Chapter 289), as amended from time to time. In respect of any matter arising from or in connection with the research you could contact the following
representatives of Motilal Oswal Capital Markets Singapore Pte Limited:
Disclaimer:
The report and information contained herein is strictly confidential and meant solely for the selected recipient and may not be altered in any way, transmitted to, copied or distributed, in part or in whole, to any other person
or to the media or reproduced in any form, without prior written consent. This report and information herein is solely for informational purpose and may not be used or considered as an offer document or solicitation of
offer to buy or sell or subscribe for securities or other financial instruments. Nothing in this report constitutes investment, legal, accounting and tax advice or a representation that any investment or strategy is suitable or
appropriate to your specific circumstances. The securities discussed and opinions expressed in this report may not be suitable for all investors, who must make their own investment decisions, based on their own investment
objectives, financial positions and needs of specific recipient. This may not be taken in substitution for the exercise of independent judgment by any recipient. Each recipient of this document should make such investigations
as it deems necessary to arrive at an independent evaluation of an investment in the securities of companies referred to in this document (including the merits and risks involved), and should consult its own advisors to
determine the merits and risks of such an investment. The investment discussed or views expressed may not be suitable for all investors. Certain transactions -including those involving futures, options, another derivative
products as well as non-investment grade securities - involve substantial risk and are not suitable for all investors. No representation or warranty, express or implied, is made as to the accuracy, completeness or fairness of
the information and opinions contained in this document. The Disclosures of Interest Statement incorporated in this document is provided solely to enhance the transparency and should not be treated as endorsement of the
views expressed in the report. This information is subject to change without any prior notice. The Company reserves the right to make modifications and alternations to this statement as may be required from time to time
without any prior approval. MOSL, its associates, their directors and the employees may from time to time, effect or have effected an own account transaction in, or deal as principal or agent in or for the securities
mentioned in this document. They may perform or seek to perform investment banking or other services for, or solicit investment banking or other business from, any company referred to in this report. Each of these entities
functions as a separate, distinct and independent of each other. The recipient should take this into account before interpreting the document. This report has been prepared on the basis of information that is already
available in publicly accessible media or developed through analysis of MOSL. The views expressed are those of the analyst, and the Company may or may not subscribe to all the views expressed therein. This document is
being supplied to you solely for your information and may not be reproduced, redistributed or passed on, directly or indirectly, to any other person or published, copied, in whole or in part, for any purpose. This report is not
directed or intended for distribution to, or use by, any person or entity who is a citizen or resident of or located in any locality, state, country or other jurisdiction, where such distribution, publication, availability or use would
be contrary to law, regulation or which would subject MOSL to any registration or licensing requirement within such jurisdiction. The securities described herein may or may not be eligible for sale in all jurisdictions or to
certain category of investors. Persons in whose possession this document may come are required to inform themselves of and to observe such restriction. Neither the Firm, not its directors, employees, agents or
representatives shall be liable for any damages whether direct or indirect, incidental, special or consequential including lost revenue or lost profits that may arise from or in connection with the use of the information.
The
person accessing this information specifically agrees to exempt MOSL or any of its affiliates or employees from, any and all responsibility/liability arising from such misuse and agrees not to hold MOSL or any of its affiliates or
employees responsible for any such misuse and further agrees to hold MOSL or any of its affiliates or employees free and harmless from all losses, costs, damages, expenses that may be suffered by the person accessing this
information due to any errors and delays.
Registered Office Address: Motilal Oswal Tower, Rahimtullah Sayani Road, Opposite Parel ST Depot, Prabhadevi, Mumbai-400025; Tel No.: 022-3980 4263; www.motilaloswal.com. Correspondence Address: Palm Spring
Centre, 2nd Floor, Palm Court Complex, New Link Road, Malad (West), Mumbai- 400 064. Tel No: 022 3080 1000. Compliance Officer: Neeraj Agarwal, Email Id:
na@motilaloswal.com,
Contact No.:022-30801085.
Registration details of group entities.: MOSL: NSE (Cash): INB231041238; NSE (F&O): INF231041238; NSE (CD): INE231041238; BSE (Cash): INB011041257; BSE(F&O): INF011041257; BSE(CD); MSE(Cash): INB261041231;
MSE(F&O): INF261041231; MSE(CD): INE261041231; CDSL: IN-DP-16-2015; NSDL: IN-DP-NSDL-152-2000; Research Analyst: INH000000412. AMFI: ARN 17397. Investment Adviser: INA000007100. Motilal Oswal Asset
Management Company Ltd. (MOAMC): PMS (Registration No.: INP000000670) offers PMS and Mutual Funds products. Motilal Oswal Wealth Management Ltd. (MOWML): PMS (Registration No.: INP000004409) offers wealth
management solutions. *Motilal Oswal Securities Ltd. is a distributor of Mutual Funds, PMS, Fixed Deposit, Bond, NCDs, Insurance and IPO products. * Motilal Oswal Commodities Broker Pvt. Ltd. offers Commodities
Products. * Motilal Oswal Real Estate Investment Advisors II Pvt. Ltd. offers Real Estate products. * Motilal Oswal Private Equity Investment Advisors Pvt. Ltd. offers Private Equity products
11 November 2017
10