Ipca Laboratories
BSE SENSEX
32,942
Bloomberg
Equity Shares (m)
M.Cap.(INRb)/(USDb)
52-Week Range (INR)
1, 6, 12 Rel. Per (%)
Avg Val, INRm
Free float (%)
S&P CNX
10,187
IPCA IN
Strong recovery in margins
126
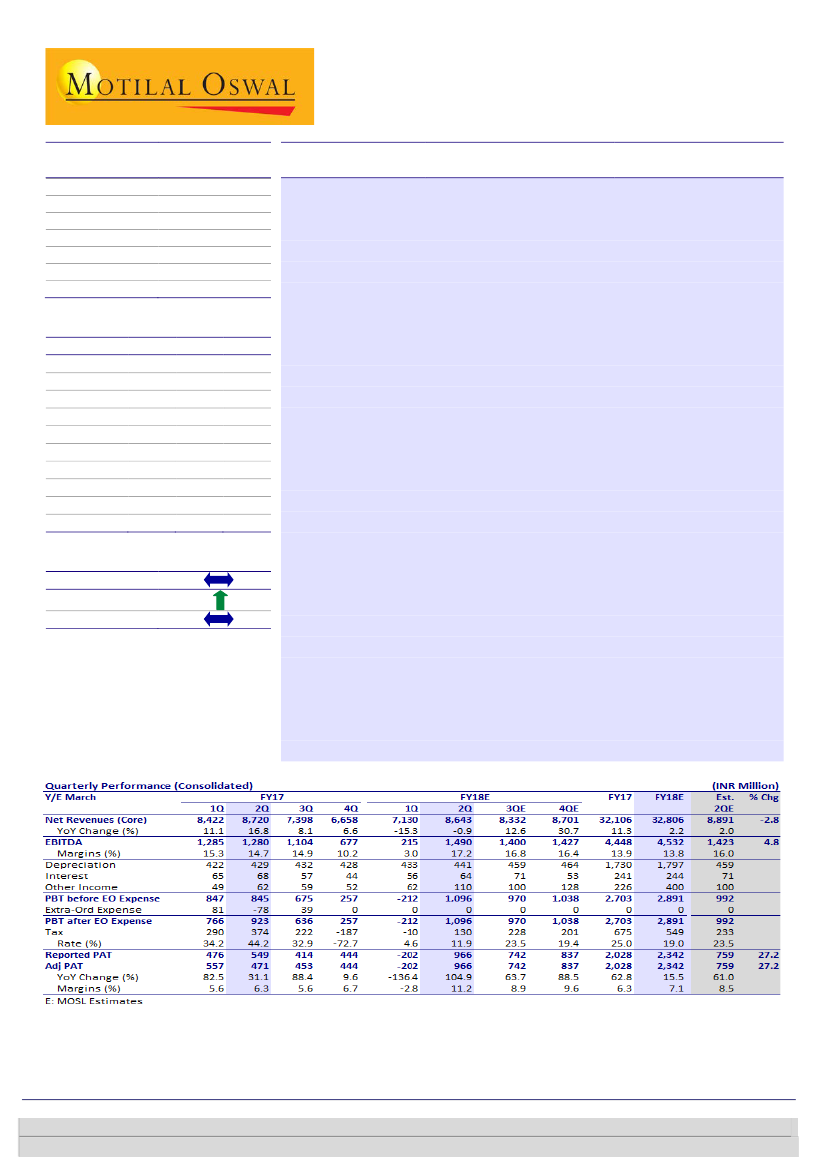
2QFY18 revenue was flat YoY at INR8.6b (~3% below est.). Domestic
67.6 / 1.0
business was up 3% YoY. Gross margin expanded to 65.9% from 62.5% in
656 / 400
2QFY17. EBITDA rose ~16% YoY to INR1.5b (+5% beat), with the margin
6/-9/-27
128
improving to 17.2% (+260bp YoY). EBITDA margin saw a negative impact of
53.9
~300bp from GST rollout. PAT rose 105% YoY to INR966m (+27% beat).
14 November 2017
2QFY18 Results Update | Sector: Healthcare
CMP: INR536
TP: INR550(+3%)
Neutral
Financials & Valuations (INR b)
2017 2018E
Y/E Mar
Net Sales
32.1
32.8
EBITDA
4.4
4.5
PAT
2.0
2.3
EPS (INR)
16.1
18.6
Gr. (%)
52.8
15.5
BV/Sh (INR)
194.6
210.3
RoE (%)
8.6
9.2
RoCE (%)
7.5
8.2
P/E (x)
33.3
28.9
P/BV (x)
2.8
2.5
2019E
37.0
6.0
3.4
26.5
43.1
232.9
12.0
10.5
20.2
2.3
Estimate change
TP change
Rating change
Domestic business (ex anti-malaria) delivers strong growth:
India
formulation sales grew 5% YoY to ~INR4.2b. According to management,
domestic branded business (ex anti-malaria) grew ~23-24% YoY. IPCA lost
~INR350-400m of sales v/s 2QFY17 due to lower Malaria-related sales.
Management expects growth to bounce back to low-to-mid-teens in coming
quarters, led by channel re-filling. International generic revenue fell ~18%
YoY, mainly on weak UK/flat US business. Institutional business reported
revenue of INR220m, as ~INR150 of sales got deferred to 3QFY18.
Pick-up in institutional business from CY18E:
IPCA announced that Global
Funds has selected the company as its panel supplier. At peak, institutional
biz revenue was ~INR4b. Adjusted for price deflation, peak business should
be ~INR2.5b (v/s IPCA’s current run-rate of ~INR1.2-1.3b). IPCA expects to
reach peak sales in FY19. Two more approvals in anti-malaria are expected
in FY19, which could add ~INR1.5b to top-line in two years.
Update on regulatory resolution:
IPCA has already invited USFDA for
Piparia/Pithampur plants inspection. Currently, >90% of ANDAs are linked to
API from Ratlam. IPCA plans to invite the USFDA for re-inspection at Ratlam
plant by CY17 end/CY18 beginning. We do not expect a pick-up in US
business in FY19 as resolution at these plants can take at least 6-12 months.
Resolution of regulatory issues is key:
Reiterate
Neutral
with a TP of INR550
@ 18x 1HFY20E PER (v/s INR430 @ 16x FY19E). We have increased our
target multiple on the back of the improved business outlook.
Investors are advised to refer through important disclosures made at the last page of the Research Report.
Motilal Oswal research is available on www.motilaloswal.com/Institutional-Equities, Bloomberg, Thomson Reuters, Factset and S&P Capital.
Kumar Saurabh-Research analyst
(Kumar.Saurabh@MotilalOswal.com); +91 22 6129 1519
Ankeet Pandya-Research analyst
(Ankeet.Pandya@MotilalOswal.com)

Ipca Laboratories
Operating metrics
Exhibit 1: Key operating metrics
2QFY15 3QFY15 4QFY15 1QFY16 2QFY16 3QFY16 4QFY16 1QFY17 2QFY17 3QFY17 4QFY17 1QFY18 2QFY18
Revenue Mix (%)
India
International formulation
API
Revenue Growth (%)
India
International formulation
API
Cost of sales (%)
Raw material
Staff cost
Other expenses
Tax Rate
Margins (%)
Gross Margins
EBITDA Margins
EBIT Margins
PAT margins
42.3
13.0
18.2
(7.1)
18.7
18.9
(28.0)
83.3
35.0
17.7
30.6
30.9
65.0
17.3
12.3
7.9
38.0
10.1
20.5
(9.9)
13.1
(26.1)
(19.6)
84.4
37.1
18.3
28.9
33.9
62.9
16.4
10.8
7.2
36.8
10.5
24.7
(15.8)
16.5
(32.0)
(9.7)
95.4
41.2
20.7
33.5
18.0
58.8
5.4
(3.9)
(2.4)
42.4
7.3
27.7
(19.1)
8.5
(52.5)
(15.8)
90.0
39.6
21.0
29.4
21.3
60.4
10.8
5.3
4.1
44.6
6.6
24.5
(5.0)
0.1
(51.8)
28.0
90.1
38.1
20.1
31.8
20.9
61.9
11.3
6.4
4.9
45.7
8.9
21.4
(8.2)
10.7
(18.9)
(3.8)
88.2
37.2
22.0
29.0
40.3
62.8
13.0
6.6
3.6
40.8
12.1
18.7
(1.7)
9.0
13.1
(25.6)
91.6
35.6
24.3
31.8
(62.7)
64.4
10.2
4.0
6.6
42.6
8.8
24.5
11.1
11.6
32.7
(1.9)
86.9
38.1
21.8
26.9
34.2
61.9
15.3
10.5
6.8
47.4
8.7
21.6
15.9
23.2
52.9
2.5
87.2
37.5
20.6
29.1
44.2
62.5
14.7
10.0
5.5
45.9
7.9
22.2
8.4
8.7
(3.3)
12.1
86.1
33.2
22.0
30.9
32.9
66.8
14.9
9.2
6.2
42.3
12.7
23.5
6.8
10.9
12.2
34.7
89.8
34.8
23.8
31.2
(72.7)
65.2
10.2
3.7
6.7
42.0
33.6
24.4
(15.8)
(16.9)
(14.2)
(16.0)
97.0
37.5
24.5
34.9
23.0
62.5
3.0
(3.1)
(2.3)
49.8
27.5
22.7
(0.0)
5.0
(11.3)
5.0
82.8
34.1
21.7
27.0
11.9
65.9
17.2
12.1
11.2
Source: Company; MOSL
Valuation and view
USFDA import alert (on Ratlam, Pithampur, Piparia) and subsequent stoppage of US
sales (except for few exempted products) have led to sharp stock correction in the
last 18 months. IPCA is trading at 16x FY20E EPS, which is at a discount to its 10-year
average trading history.
Reiterate
Neutral
with TP of INR550 @ 18x 1HFY20E PER (v/s INR430 @ 16x FY19E).
We have increased our target multiple on the back of the improved business
outlook
.
Key catalysts to drive stock’s performance over the medium term are:
Higher-than-expected recovery in US sales, led by sharp price hikes in key
products (Hydroxychloroquine sulfate, Propranolol).
Rebound in Institutional business (anti-malarial tender), which accounted for
only 4% of sales in FY17 v/s 14% in FY14.
Improvement in domestic business growth trajectory, with a focus on new
therapy introductions in the chronic segments.
Key risks to our investment thesis
Lack of clearance by other regulators would impact the exports business outlook
(~50% of sales).
Further addition of drugs in DPCO coverage could hurt domestic business.
Weakness in emerging market currencies could impair growth prospects.
14 November 2017
2

Ipca Laboratories
Exhibit 2: P/E
80.0
60.0
40.0
P/E (x)
Min (x)
Avg (x)
+1SD
Max (x)
-1SD
Exhibit 3: P/B
5.6
P/B (x)
Min (x)
Avg (x)
+1SD
Max (x)
-1SD
5.1
3.9
61.7
40.4
24.0
3.9
3.0
2.2
2.1
1.0
2.4
20.0
0.0
7.6
4.0
23.6
0.5
Source: Company; MOSL
14 November 2017
3

Ipca Laboratories
Story in charts
Exhibit 4: Revenues remained flat during the quarter YoY
Sales (INR b)
-1
YoY Growth (%)
17
11
8
7
-15
Exhibit 5: Domestic sales recovered post GST
Domestic formulations (INR b)
YoY Growth (%)
23
8
0
11
9
12
9
11
-17
3.3 2.8 2.3 3.2 3.3 3.1 2.5 3.6 4.0 3.4 2.8 3.0 4.2
5
-8
-11
-4
-16 -19
-8
-1
19
13 16
7.8 7.4 6.3 7.6 7.5 6.8 6.2 8.4 8.7 7.4 6.7 7.1 8.6
Source: Company, MOSL
Exhibit 6: International formulation biz declined 11% YoY
Export formulations (INR b)
22
3
-16 -20
2.4
-36
3.1 3.1
-42
2.2
2.3 2.2
-26 -27
16
YoY Growth (%)
6
-10 -14 -11
Exhibit 7: API business improved QoQ
APIs (INR b)
28
1.4
-28
-4
-26
-2
YoY Growth (%)
35
2
12
-16
5
-20
-10
-16
2.5 2.7 2.6 2.3 2.2 2.4 2.3
1.5 1.5 2.1 1.8 1.4 1.1 2.0 1.8 1.6 1.5 1.7 1.9
Source: Company, MOSL
Exhibit 8: EBITDA margin improved YoY and QoQ
EBITDA (INR b)
17 16
5
EBITDA Margin (%)
17
3
Exhibit 9: Total sales to exhibit 12% CAGR from FY17-20E
Formulation (INR b)
API (INR b)
15 15 15
11 11 13 10
10
1.3 1.2 0.3 0.8 0.8 0.9 0.6 1.3 1.3 1.1 0.7 0.2 1.5
5
14
6
17
7
8
8
7
9
10
11
12
20
24
23
20
22
23
26
31
FY11 FY12 FY13 FY14 FY15 FY16 FY17 FY18E FY19E FY20E
Source: Company, MOSL
14 November 2017
4

Ipca Laboratories
Exhibit 10: Domestic revenues to improve FY19 onwards
16.5
DF Revenues (INR b)
16.6
16.4
10.4
6.7
8.0
4
5
6
8
5
3
4
5
Growth (%)
15.3
14.0
15.0
19.8
21.8 22.2
Exhibit 11: Slow recovery in EBITDA margins
EBITDA (INR b)
EBITDA Margin (%)
24.7
16.8
11.8
16.3 16.7
7
8.2
13.9 13.8
6
7
8
9
10
11
12
14
15
17
20
FY11 FY12 FY13 FY14 FY15 FY16 FY17 FY18E FY19E FY20E
Source: Company, MOSL
FY11 FY12 FY13 FY14 FY15 FY16 FY17 FY18E FY19E FY20E
Source: Company, MOSL
Exhibit 12: Gross margins v/s EBITDA margins
Gross Margin (%)
59.1 61.3 61.0
EBITDA Margin (%)
Exhibit 13: EPS to exhibit 27% CAGR from FY17-20E
Core EPS (INR/ share)
65.4 63.2 63.3 65.4 65.5 66.0 66.0
24.7
19.8 21.8 22.2
16.8
16.3 16.7
11.8 13.9 13.8
21
22
26
38
20
11
16
19
27
33
FY11 FY12 FY13 FY14 FY15 FY16 FY17 FY18E FY19E FY20E
Source: Company, MOSL
FY11 FY12 FY13 FY14 FY15 FY16 FY17 FY18E FY19E FY20E
Source: Company, MOSL
14 November 2017
5

Ipca Laboratories
Financials and Valuations
Income Statement
Y/E Mar
Net Sales
Change (%)
EBITDA
EBITDA Margin (%)
Depreciation
EBIT
Interest
Other Income
Extraordinary items
PBT
Tax
Tax Rate (%)
Min. Int. & Assoc. Share
Reported PAT
Adjusted PAT
Change (%)
2013
28,131
19.3
6,232
22.2
867
5,365
334
-488
0
4,543
1,299
28.6
8
3,236
3,236
16.8
2013
252
15,285
15,538
5,234
1,304
22,075
15,791
4,748
11,042
1,292
90
14,545
7,410
4,178
582
2,374
4,894
4,351
544
9,651
22,075
2014
32,818
16.7
8,106
24.7
1,031
7,074
269
-500
0
6,306
1,524
24.2
-3
4,785
4,785
47.9
2014
252
19,344
19,597
4,379
1,471
25,447
19,321
5,785
13,536
1,649
92
16,827
8,476
4,495
763
3,093
6,656
5,950
706
10,171
25,447
2015
31,418
-4.3
5,291
16.8
1,796
3,495
284
358
42
3,611
1,019
28.2
49
2,542
2,501
-47.7
2015
252
21,832
22,084
8,286
1,743
32,113
25,463
7,459
18,004
2,672
162
17,285
9,266
3,530
1,248
3,242
6,011
5,471
540
11,275
32,113
2016
28,850
-8.2
3,417
11.8
1,722
1,695
316
169
-395
1,153
186
16.1
35
933
1,328
-46.9
2016
252
22,340
22,592
6,691
1,565
30,848
22,121
1,628
20,493
936
258
17,230
8,374
4,459
1,755
2,641
8,069
7,245
824
9,160
30,848
2017
32,106
11.3
4,448
13.9
1,730
2,718
241
226
0
2,703
675
25.0
83
1,945
1,945
46.5
2017
252
24,300
24,553
5,290
1,705
31,548
23,508
3,350
20,158
621
1,358
17,458
8,822
5,002
359
3,276
8,047
7,141
906
9,410
31,548
2018E
32,806
2.2
4,532
13.8
1,797
2,735
244
400
0
2,891
549
19.0
0
2,342
2,342
20.4
2018E
252
26,291
26,543
5,556
1,763
33,862
26,008
5,147
20,861
621
1,358
17,286
8,625
4,721
944
2,996
6,264
5,629
636
11,022
33,862
(INR Million)
2019E
37,027
12.9
6,025
16.3
1,875
4,150
257
430
0
4,323
973
22.5
0
3,350
3,350
43.1
2019E
252
29,138
29,391
5,862
1,871
37,124
28,508
7,022
21,486
621
1,358
20,729
9,735
5,329
2,284
3,382
7,071
6,353
717
13,658
37,124
2020E
42,889
15.8
7,145
16.7
1,962
5,182
272
430
0
5,341
1,228
23.0
0
4,112
4,112
22.7
2020E
252
32,634
32,886
6,214
2,031
41,131
31,008
8,984
22,024
621
1,358
25,318
11,276
6,172
3,953
3,917
8,190
7,359
831
17,128
41,131
Balance Sheet
Y/E Mar
Share Capital
Reserves
Net Worth
Debt
Deferred Tax
Total Capital Employed
Gross Fixed Assets
Less: Acc Depreciation
Net Fixed Assets
Capital WIP
Investments
Current Assets
Inventory
Debtors
Cash & Bank
Loans & Adv, Others
Curr Liabs & Provns
Curr. Liabilities
Provisions
Net Current Assets
Total Assets
(INR Million)
14 November 2017
6

Ipca Laboratories
Financials and Valuations
Ratios
Y/E Mar
Basic (INR)
EPS
Cash EPS
Book Value
DPS
Payout (incl. Div. Tax.)
Valuation(x)
P/E
Price / Book Value
EV/Sales
EV/EBITDA
Dividend Yield (%)
Profitability Ratios (%)
RoE
RoCE
RoIC
Turnover Ratios (%)
Asset Turnover (x)
Debtors (No. of Days)
Inventory (No. of Days)
Creditors (No. of Days)
Leverage Ratios (%)
Net Debt/Equity (x)
2013
25.6
32.5
123.1
4.7
18.1
20.9
4.4
2.6
11.6
0.9
23.0
18.0
20.4
1.8
54
96
83
0.3
2013
6,232
-488
-1,119
-927
0
3,698
-2,752
946
251
0
-2,501
0
-93
-334
-309
-736
461
122
582
2014
37.9
46.1
155.3
5.9
15.4
14.1
3.5
2.7
11.0
1.1
27.2
22.3
24.9
1.7
50
94
100
0.2
2014
8,106
-500
-339
-1,357
0
5,910
-3,887
2,023
-1
0
-3,888
0
-854
-269
-718
-1,841
180
582
763
2015
19.8
34.4
175.0
1.2
5.9
27.0
3.1
2.9
17.5
0.2
12.0
10.1
9.8
1.2
41
108
87
0.3
2015
5,291
358
-619
-747
42
4,324
-7,166
-2,842
-70
0
-7,236
0
3,906
-284
-224
3,398
486
763
1,248
2016
10.5
21.0
179.0
0.0
0.0
50.9
3.0
2.7
15.1
0.0
5.9
5.5
5.3
1.3
56
106
117
0.2
2016
3,417
169
2,622
-364
-395
5,449
5,079
10,527
-96
0
4,982
0
-1,594
-316
-8,013
-9,923
508
1,248
1,756
2017
16.1
29.8
194.6
2.3
14.4
33.3
2.8
2.3
11.9
0.4
8.6
7.5
7.1
1.4
56
100
108
0.2
2017
4,448
226
-1,647
-535
0
2,491
-1,072
1,420
-1,100
0
-2,172
0
-1,401
-241
-75
-1,717
-1,397
1,755
358
2018E
18.6
32.8
210.3
2.8
15.0
28.9
2.5
2.3
11.9
0.5
9.2
8.2
7.4
1.3
52
96
81
0.2
2018E
4,532
400
-1,026
-491
0
3,415
-2,500
915
0
0
-2,500
0
266
-244
-351
-329
586
359
944
2019E
26.5
41.4
232.9
4.0
15.0
20.2
2.3
0.0
0.0
0.7
12.0
10.5
10.1
1.3
52
96
83
0.1
2019E
6,025
430
-1,297
-865
0
4,293
-2,500
1,793
0
0
-2,500
0
306
-257
-503
-454
1,339
944
2,284
2020E
32.6
48.1
260.6
4.9
15.0
16.4
2.1
0.0
0.0
0.9
13.2
11.6
11.7
1.4
52
96
83
0.1
2020E
7,145
430
-1,800
-1,068
0
4,706
-2,500
2,206
0
0
-2,500
0
352
-272
-617
-537
1,670
2,284
3,953
Cash Flow Statement
Y/E Mar
Adjusted EBITDA
Non cash opr. exp (inc)
(Inc)/Dec in Wkg. Cap.
Tax Paid
Other operating activities
CF from Op. Activity
(Inc)/Dec in FA & CWIP
Free cash flows
(Pur)/Sale of Invt
Others
CF from Inv. Activity
Inc/(Dec) in Net Worth
Inc / (Dec) in Debt
Interest Paid
Divd Paid (incl Tax) & Others
CF from Fin. Activity
Inc/(Dec) in Cash
Add: Opening Balance
Closing Balance
(INR Million)
14 November 2017
7

Ipca Laboratories
Corporate profile
Company description
Established in 1949, IPCA Labs is one of India's
better managed mid-sized pharma companies. It
has presence in (1) domestic branded formulations,
(2) global branded and generic formulations, and (3)
global APIs (active pharmaceutical ingredients).
IPCA's core business strategy is to leverage its
strength in manufacturing API to develop vertically
integrated and highly competitive formulations.
Most of the company's formulations are backed by
its own APIs.
Exhibit 1: Sensex rebased
Source: MOSL/Bloomberg
Exhibit 2: Shareholding pattern (%)
Sep-17
Promoter
DII
FII
Others
46.1
25.0
13.8
15.1
Jun-17
46.1
22.1
16.4
15.3
Sep-16
46.0
22.3
15.6
16.1
Source: Capitaline
Exhibit 3: Top holders
Holder Name
ICICI Prudential
HDFC Trustee Company Ltd.
DSP Blackrock
Lavender Investments Limited
Franklin Templeton Mutual Fund
% Holding
7.8
5.6
4.1
4.0
2.5
Source: Capitaline
Note: FII Includes depository receipts
Exhibit 4: Top management
Name
Premchand Godha
A K Jain
Harish P Kamath
Designation
Chairman & Managing
Director
Joint
Managing
Director
Company Secretary
Exhibit 5: Directors
Name
Anand T Kusre
Dev Parkash Yadava
Pranay Godha
Ramakanta Panda
Name
Babulal Jain
Manisha Premnath
Prashant Godha
*Independent
Source: Capitaline
Exhibit 6: Auditors
Name
ABK & Associates
Natvarlal Vepari & Company
Parikh & Associates
Type
Cost Auditor
Statutory
Secretarial Audit
Exhibit 7: MOSL forecast v/s consensus
EPS
(INR)
FY18
FY19
FY20
MOSL
forecast
18.6
26.5
32.6
Consensus
forecast
16.2
24.5
33.7
Variation (%)
14.9
8.0
-3.3
Source: Bloomberg
Source: Capitaline
14 November 2017
8

Ipca Laboratories
NOTES
14 November 2017
9

Disclosures:
The following Disclosures are being made in compliance with the SEBI Research Analyst Regulations 2014 (herein after referred to as the Regulations).
Motilal Oswal Securities Ltd. (MOSL) is a SEBI Registered Research Analyst having registration no. INH000000412. MOSL, the Research Entity (RE) as defined in the Regulations, is engaged in the business of providing Stock
broking services, Investment Advisory Services, Depository participant services & distribution of various financial products. MOSL is a subsidiary company of Motilal Oswal Financial Service Ltd. (MOFSL). MOFSL is a listed
public company, the details in respect of which are available on
www.motilaloswal.com.
MOSL is registered with the Securities & Exchange Board of India (SEBI) and is a registered Trading Member with National Stock
Exchange of India Ltd. (NSE) and Bombay Stock Exchange Limited (BSE), Metropolitan Stock Exchange Of India Ltd. (MSE) for its stock broking activities & is Depository participant with Central Depository Services Limited
(CDSL) & National Securities Depository Limited (NSDL) and is member of Association of Mutual Funds of India (AMFI) for distribution of financial products. Details of associate entities of Motilal Oswal Securities Limited are
available on the website at
http://onlinereports.motilaloswal.com/Dormant/documents/Associate%20Details.pdf
Pending Regulatory Enquiries against Motilal Oswal Securities Limited by SEBI:
SEBI pursuant to a complaint from client Shri C.R. Mohanraj alleging unauthorized trading, issued a letter dated 29th April 2014 to MOSL notifying appointment of an Adjudicating Officer as per SEBI regulations to hold
inquiry and adjudge violation of SEBI Regulations; MOSL requested SEBI to provide all documents, records, investigation report relied upon by SEBI which were referred in Show Cause Notice and also sought personal
hearing. The matter is currently pending.
MOSL, it’s associates, Research Analyst or their relative may have any financial interest in the subject company. MOSL and/or its associates and/or Research Analyst may have beneficial ownership of 1% or more securities in
the subject company at the end of the month immediately preceding the date of publication of the Research Report.
MOSL and its associate company(ies), their directors and Research Analyst and their relatives may; (a)
from time to time, have a long or short position in, act as principal in, and buy or sell the securities or derivatives thereof of companies mentioned herein. (b) be engaged in any other transaction involving such securities and
earn brokerage or other compensation or act as a market maker in the financial instruments of the company(ies) discussed herein or act as an advisor or lender/borrower to such company(ies) or may have any other
potential conflict of interests with respect to any recommendation and other related information and opinions.; however the same shall have no bearing whatsoever on the specific recommendations made by the analyst(s),
as the recommendations made by the analyst(s) are completely independent of the views of the associates of MOSL even though there might exist an inherent conflict of interest in some of the stocks mentioned in the
research report.
Research Analyst may have served as director/officer, etc. in the subject company in the last 12 month period. MOSL and/or its associates may have received any compensation from the subject company in
the past 12 months.
In the last 12 months period ending on the last day of the month immediately preceding the date of publication of this research report, MOSL or any of its associates may have:
a)
managed or co-managed public offering of securities from subject company of this research report,
b)
received compensation for investment banking or merchant banking or brokerage services from subject company of this research report,
c)
received compensation for products or services other than investment banking or merchant banking or brokerage services from the subject company of this research report.
d)
Subject Company may have been a client of MOSL or its associates during twelve months preceding the date of distribution of the research report.
MOSL and it’s associates have not received any compensation or other benefits from the subject company or third party in connection with the research report. To enhance transparency, MOSL has incorporated a Disclosure
of Interest Statement in this document. This should, however, not be treated as endorsement of the views expressed in the report. MOSL and / or its affiliates do and seek to do business including investment banking with
companies covered in its research reports. As a result, the recipients of this report should be aware that MOSL may have a potential conflict of interest that may affect the objectivity of this report. Compensation of Research
Analysts is not based on any specific merchant banking, investment banking or brokerage service transactions.
Terms & Conditions:
This report has been prepared by MOSL and is meant for sole use by the recipient and not for circulation. The report and information contained herein is strictly confidential and may not be altered in any way, transmitted to,
copied or distributed, in part or in whole, to any other person or to the media or reproduced in any form, without prior written consent of MOSL. The report is based on the facts, figures and information that are considered
true, correct, reliable and accurate. The intent of this report is not recommendatory in nature. The information is obtained from publicly available media or other sources believed to be reliable. Such information has not
been independently verified and no guaranty, representation of warranty, express or implied, is made as to its accuracy, completeness or correctness. All such information and opinions are subject to change without notice.
The report is prepared solely for informational purpose and does not constitute an offer document or solicitation of offer to buy or sell or subscribe for securities or other financial instruments for the clients. Though
disseminated to all the customers simultaneously, not all customers may receive this report at the same time. MOSL will not treat recipients as customers by virtue of their receiving this report.
Analyst Certification
The views expressed in this research report accurately reflect the personal views of the analyst(s) about the subject securities or issues, and no part of the compensation of the research analyst(s) was, is, or will be directly or
indirectly related to the specific recommendations and views expressed by research analyst(s) in this report.
Ipca Laboratories
Disclosure of Interest Statement
Analyst ownership of the stock
Ipca Laboratories
No
A graph of daily closing prices of securities is available at
www.nseindia.com, www.bseindia.com.
Research Analyst views on Subject Company may vary based on Fundamental research and Technical Research. Proprietary
trading desk of MOSL or its associates maintains arm’s length distance with Research Team as all the activities are segregated from MOSL research activity and therefore it can have an independent view with regards to
subject company for which Research Team have expressed their views.
Regional Disclosures (outside India)
This report is not directed or intended for distribution to or use by any person or entity resident in a state, country or any jurisdiction, where such distribution, publication, availability or use would be contrary to law,
regulation or which would subject MOSL & its group companies to registration or licensing requirements within such jurisdictions.
For Hong Kong:
This report is distributed in Hong Kong by Motilal Oswal capital Markets (Hong Kong) Private Limited, a licensed corporation (CE AYY-301) licensed and regulated by the Hong Kong Securities and Futures Commission (SFC)
pursuant to the Securities and Futures Ordinance (Chapter 571 of the Laws of Hong Kong) “SFO”. As per SEBI (Research Analyst Regulations) 2014 Motilal Oswal Securities (SEBI Reg No. INH000000412) has an agreement with
Motilal Oswal capital Markets (Hong Kong) Private Limited for distribution of research report in Hong Kong. This report is intended for distribution only to “Professional Investors” as defined in Part I of Schedule 1 to SFO. Any
investment or investment activity to which this document relates is only available to professional investor and will be engaged only with professional investors.” Nothing here is an offer or solicitation of these securities,
products and services in any jurisdiction where their offer or sale is not qualified or exempt from registration. The Indian Analyst(s) who compile this report is/are not located in Hong Kong & are not conducting Research
Analysis in Hong Kong.
For U.S.
Motilal Oswal Securities Limited (MOSL) is not a registered broker - dealer under the U.S. Securities Exchange Act of 1934, as amended (the"1934 act") and under applicable state laws in the United States. In addition MOSL is
not a registered investment adviser under the U.S. Investment Advisers Act of 1940, as amended (the "Advisers Act" and together with the 1934 Act, the "Acts), and under applicable state laws in the United States.
Accordingly, in the absence of specific exemption under the Acts, any brokerage and investment services provided by MOSL, including the products and services described herein are not available to or intended for U.S.
persons. This report is intended for distribution only to "Major Institutional Investors" as defined by Rule 15a-6(b)(4) of the Exchange Act and interpretations thereof by SEC (henceforth referred to as "major institutional
investors"). This document must not be acted on or relied on by persons who are not major institutional investors. Any investment or investment activity to which this document relates is only available to major institutional
investors and will be engaged in only with major institutional investors. In reliance on the exemption from registration provided by Rule 15a-6 of the U.S. Securities Exchange Act of 1934, as amended (the "Exchange Act") and
interpretations thereof by the U.S. Securities and Exchange Commission ("SEC") in order to conduct business with Institutional Investors based in the U.S., MOSL has entered into a chaperoning agreement with a U.S.
registered broker-dealer, Motilal Oswal Securities International Private Limited. ("MOSIPL"). Any business interaction pursuant to this report will have to be executed within the provisions of this chaperoning agreement.
The Research Analysts contributing to the report may not be registered /qualified as research analyst with FINRA. Such research analyst may not be associated persons of the U.S. registered broker-dealer, MOSIPL, and
therefore, may not be subject to NASD rule 2711 and NYSE Rule 472 restrictions on communication with a subject company, public appearances and trading securities held by a research analyst account.
For Singapore
Motilal Oswal Capital Markets Singapore Pte Limited is acting as an exempt financial advisor under section 23(1)(f) of the Financial Advisers Act(FAA) read with regulation 17(1)(d) of the Financial Advisors Regulations and is a
subsidiary of Motilal Oswal Securities Limited in India. This research is distributed in Singapore by Motilal Oswal Capital Markets Singapore Pte Limited and it is only directed in Singapore to accredited investors, as defined in
the Financial Advisers Regulations and the Securities and Futures Act (Chapter 289), as amended from time to time. In respect of any matter arising from or in connection with the research you could contact the following
representatives of Motilal Oswal Capital Markets Singapore Pte Limited:
Disclaimer:
The report and information contained herein is strictly confidential and meant solely for the selected recipient and may not be altered in any way, transmitted to, copied or distributed, in part or in whole, to any other person
or to the media or reproduced in any form, without prior written consent. This report and information herein is solely for informational purpose and may not be used or considered as an offer document or solicitation of
offer to buy or sell or subscribe for securities or other financial instruments. Nothing in this report constitutes investment, legal, accounting and tax advice or a representation that any investment or strategy is suitable or
appropriate to your specific circumstances. The securities discussed and opinions expressed in this report may not be suitable for all investors, who must make their own investment decisions, based on their own investment
objectives, financial positions and needs of specific recipient. This may not be taken in substitution for the exercise of independent judgment by any recipient. Each recipient of this document should make such investigations
as it deems necessary to arrive at an independent evaluation of an investment in the securities of companies referred to in this document (including the merits and risks involved), and should consult its own advisors to
determine the merits and risks of such an investment. The investment discussed or views expressed may not be suitable for all investors. Certain transactions -including those involving futures, options, another derivative
products as well as non-investment grade securities - involve substantial risk and are not suitable for all investors. No representation or warranty, express or implied, is made as to the accuracy, completeness or fairness of
the information and opinions contained in this document. The Disclosures of Interest Statement incorporated in this document is provided solely to enhance the transparency and should not be treated as endorsement of the
views expressed in the report. This information is subject to change without any prior notice. The Company reserves the right to make modifications and alternations to this statement as may be required from time to time
without any prior approval. MOSL, its associates, their directors and the employees may from time to time, effect or have effected an own account transaction in, or deal as principal or agent in or for the securities
mentioned in this document. They may perform or seek to perform investment banking or other services for, or solicit investment banking or other business from, any company referred to in this report. Each of these entities
functions as a separate, distinct and independent of each other. The recipient should take this into account before interpreting the document. This report has been prepared on the basis of information that is already
available in publicly accessible media or developed through analysis of MOSL. The views expressed are those of the analyst, and the Company may or may not subscribe to all the views expressed therein. This document is
being supplied to you solely for your information and may not be reproduced, redistributed or passed on, directly or indirectly, to any other person or published, copied, in whole or in part, for any purpose. This report is not
directed or intended for distribution to, or use by, any person or entity who is a citizen or resident of or located in any locality, state, country or other jurisdiction, where such distribution, publication, availability or use would
be contrary to law, regulation or which would subject MOSL to any registration or licensing requirement within such jurisdiction. The securities described herein may or may not be eligible for sale in all jurisdictions or to
certain category of investors. Persons in whose possession this document may come are required to inform themselves of and to observe such restriction. Neither the Firm, not its directors, employees, agents or
representatives shall be liable for any damages whether direct or indirect, incidental, special or consequential including lost revenue or lost profits that may arise from or in connection with the use of the information.
The
person accessing this information specifically agrees to exempt MOSL or any of its affiliates or employees from, any and all responsibility/liability arising from such misuse and agrees not to hold MOSL or any of its affiliates or
employees responsible for any such misuse and further agrees to hold MOSL or any of its affiliates or employees free and harmless from all losses, costs, damages, expenses that may be suffered by the person accessing this
information due to any errors and delays.
Registered Office Address: Motilal Oswal Tower, Rahimtullah Sayani Road, Opposite Parel ST Depot, Prabhadevi, Mumbai-400025; Tel No.: 022-3980 4263; www.motilaloswal.com. Correspondence Address: Palm Spring
Centre, 2nd Floor, Palm Court Complex, New Link Road, Malad (West), Mumbai- 400 064. Tel No: 022 3080 1000. Compliance Officer: Neeraj Agarwal, Email Id:
na@motilaloswal.com,
Contact No.:022-30801085.
Registration details of group entities.: MOSL: NSE (Cash): INB231041238; NSE (F&O): INF231041238; NSE (CD): INE231041238; BSE (Cash): INB011041257; BSE(F&O): INF011041257; BSE(CD); MSE(Cash): INB261041231;
MSE(F&O): INF261041231; MSE(CD): INE261041231; CDSL: IN-DP-16-2015; NSDL: IN-DP-NSDL-152-2000; Research Analyst: INH000000412. AMFI: ARN 17397. Investment Adviser: INA000007100. Motilal Oswal Asset
Management Company Ltd. (MOAMC): PMS (Registration No.: INP000000670) offers PMS and Mutual Funds products. Motilal Oswal Wealth Management Ltd. (MOWML): PMS (Registration No.: INP000004409) offers wealth
management solutions. *Motilal Oswal Securities Ltd. is a distributor of Mutual Funds, PMS, Fixed Deposit, Bond, NCDs, Insurance and IPO products. * Motilal Oswal Commodities Broker Pvt. Ltd. offers Commodities
Products. * Motilal Oswal Real Estate Investment Advisors II Pvt. Ltd. offers Real Estate products. * Motilal Oswal Private Equity Investment Advisors Pvt. Ltd. offers Private Equity products
14 November 2017
10