20 November 2017
Market snapshot
Equities - India
Close
Chg .%
Sensex
33,343
0.7
Nifty-50
10,284
0.7
Nifty-M 100
19,643
1.0
Equities-Global
Close
Chg .%
S&P 500
2,579
-0.3
Nasdaq
6,783
-0.2
FTSE 100
7,381
-0.1
DAX
12,994
-0.4
Hang Seng
11,609
0.6
Nikkei 225
22,397
0.2
Commodities
Close
Chg .%
Brent (US$/Bbl)
62
2.1
Gold ($/OZ)
1,294
1.2
Cu (US$/MT)
6,744
0.6
Almn (US$/MT)
2,087
0.1
Currency
Close
Chg .%
USD/INR
65.0
-0.5
USD/EUR
1.2
0.2
USD/JPY
112.1
-0.8
YIELD (%)
Close
1MChg
10 Yrs G-Sec
7.0
0.0
10 Yrs AAA Corp
7.8
0.0
Flows (USD b)
17-Nov
MTD
FIIs
0.2
2.4
DIIs
0.2
0.9
Volumes (INRb)
17-Nov
MTD*
Cash
415
409
F&O
5,338
6,860
Note: YTD is calendar year, *Avg
YTD.%
25.2
25.6
36.9
YTD.%
15.2
26.0
3.3
13.2
23.6
17.2
YTD.%
12.5
12.3
22.1
22.4
YTD.%
-4.3
12.1
-4.2
YTDchg
0.5
0.2
YTD
7.9
12.3
YTD*
305
5,611
Today’s top research idea
HDFC Standard Life
(Initiating Coverage):
Another 'compounder'
Quality franchise; attractive valuations
HDFC SL has reported strong growth trends, which has enabled it to
consistently rank among India’s top three private insurers. It has steadily
improved the share of high-margin protection products to 26.4% as at Sep-17,
which has helped it to deliver best-in-class new business margins.
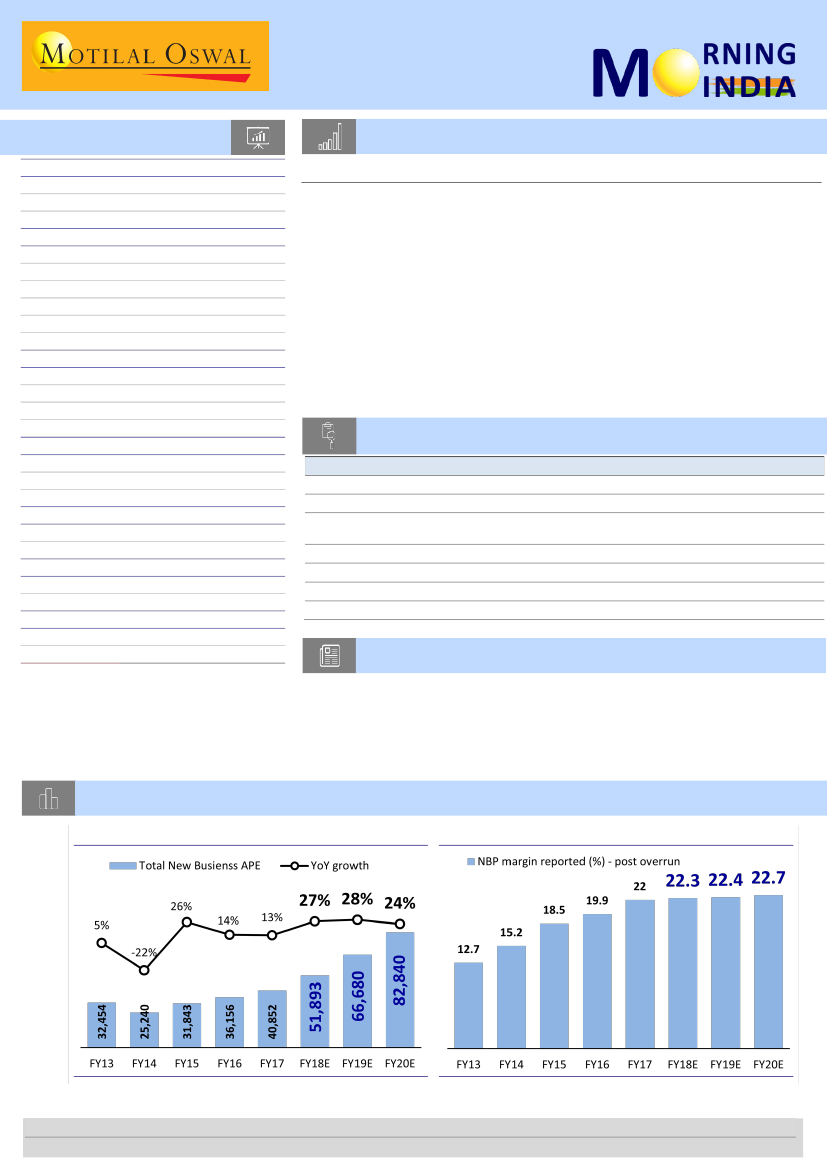
We estimate the company to deliver 25% CAGR in new business APE over FY17-
20E, aided by its increasing bancassurance tie-ups, improvement in agency
channel and higher direct sales.
We estimate HDFCSL to deliver average RoEV of ~19% over FY17-20E, while
new business margins are likely to improve further to 23%. We value HDFCSL at
3.5x Mar-20E EV at INR370/sh (implied new business multiple of 28x).
Research covered
Cos/Sector
HDFC Standard Life
Strides Shasun
Cement (Petcoke Ban
Update)
EcoScope
EcoScope
Healthcare
Cement
Key Highlights
Another 'compounder'; Quality franchise; attractive valuations
Divestment to focus on profitable businesses
Environment ministry prohibits usage of petcoke in U.P, Rajasthan &
Haryana
Fears of fiscal deficit slippage are exaggerated
Moody’s upgrades India to highest sovereign rating post liberalization
IPM – early signs of revival
Prices largely flattish; Hikes likely in south markets
Piping hot news
India up one place on Per Capita GDP terms to 126, Qatar No 1: IMF report
India has moved up one position to 126th in terms of per capita GDP of
countries while Qatar remains the world’s richest on this parameter, as per
IMF data. The data, which forms part of the latest World Economic Outlook
report of the International Monetary Fund (IMF),…
Chart of the Day: HDFC Standard Life – Another 'compounder'; Quality franchise; attractive valuations
Trend in APE premium and growth
Trend in new business margin
Research Team (Gautam.Duggad@MotilalOswal.com)
Motilal Oswal research is available on www.motilaloswal.com/Institutional-Equities, Bloomberg, Thomson Reuters, Factset and S&P Capital.
Investors are advised to refer through important disclosures made at the last page of the Research Report.

In the news today
Kindly click on textbox for the detailed news link
1
FPIs inflow in equities at $2-
billion in November so far
Foreign investors have pumped in
a whopping over USD 2 billion in
the Indian equity markets this
month so far, enthused by
government’s announcement of
recapitalising PSU banks,
improvement in global sentiment
and stable currency…
2
After consumer products and other daily-use items, the government is
now looking to reduce goods and services tax (GST) on consumer durables
like washing machines and refrigerators from the current level of 28% as
part of the next round of rationalisation. While the move is expected to
help push demand in the sector, amid repeated complaints of a slowdown
and excess capacity, the exercise will also be aimed at women and will
reduce their daily workload by making such white goods cheaper, said a
senior government official, who did not wish to be quoted…
Government looks to cut GST on white goods
3
Indian Oil Corp opens India's
first electric charging station in
Nagpur
In a major step in spreading the
use of green energy, India's first
electric vehicle (EV) charging
station was started here on
Sunday by Indian Oil, according to
the state-run oil marketing
company. Indian Oil has partnered
with cab aggregator Ola to set up
the charging station at an IOC
petrol pump here…
4
India's NHPC could bid for
Nepal's $2.5 billion power
project pulled from China
Indian power company NHPC Ltd
could bid for a $2.5 billion
hydropower project in Nepal, its
chairman told Reuters, after
Kathmandu cancelled a deal with
China Gezhouba Group Corp.
China and India jostle for influence
over infrastructure projects in
Nepal…
5
The government is considering
banning import of pet coke — a
cheap but polluting fuel widely
used by cement, paper, brick kiln,
chemicals and textile industries —
to cut industrial pollution that’s
contributing to hazy skies. The
Supreme Court has already
forbidden the use of this fuel in
the National Capital Region as
intense smog over Delhi earlier
this month prompted a series of
measures including advancing of
BS-VI fuel introduction in Delhi…
Centre may ban import of pet
coke to curb pollution
6
Lower taxes and higher public
expenditure could widen budget
deficit in 2017-18, but steps taken
by the government to broaden the
tax base and improve spending
efficiency would help in narrowing
it going forward, U.S.-based rating
agency Moody’s said…
7
CPSEs dividends: Companies to
shell out as much as 25 pct
more than budgeted Rs 67,529
crore
Budget deficit may rise in
FY18, but will improve in years
ahead: Moody’s
Central public sector undertakings
(CPSEs), which are giving an
unprecedentedly high level of
support to public capex for the
second year in a row, will
nevertheless shell out dividends at
least 25% higher than the
budgeted Rs 67,529 crore in FY18,
officials said…
20 November 2017
2

Initiating Coverage | Sector: Financials – Life Insurance
HDFC Standard Life Insurance
BSE Sensex
33,107
S&P CNX
10,215
CMP: INR290
TP: INR370 (+28%)
Buy
Another 'compounder'
Quality franchise; attractive valuations
HDFC Standard Life (HDFCSL) is one of India’s top three private sector life insurers and
offers a wide range of insurance products. It has strengthened its position in a highly
competitive industry and has a well-diversified business mix. HDFCSL has strong return
ratios (FY17 RoEV at 21%) and the highest new business margin (22% for FY17) among the
major private insurers, backed by its balanced product mix (47% ULIPs, 26% PAR, 27%
Non-Participating business in FY17), strong distribution network and lower operating
cost. HDFCSL has made significant investments in building its digital platform, which has
enabled it to improve customer satisfaction and attract new business. We estimate HDFC
SL to deliver RoEV of ~19% over FY17-20E and value it on 3.5x Mar-20E EV at INR370 per
share, which implies an upside of 28% from the issue price. Initiate coverage with BUY.
Stock info
Equity Shares (m)
MCap (INR b)
MCap (USD b)
Financial snapshot (INRb)
Y/E MARCH
FY18E FY19E
Net Premium
231.2 282.5
Total Income
331.7 398.3
Opex
27.5 33.7
Op. profit
292.5 350.6
Surplus/Deficit
10.9 12.7
PAT
9.5 10.8
New bus gr. %*
30
28
Renewal
11.9 16.9
Prem.gr. (%)
P/EV (X)
3.9
3.3
P/EPS(x)
61.5 54.0
*Un-weighted
Shareholding pattern (%)
Nov-17
Promoter
Others
2,009
582.6
8.9
FY20E
349.6
492.5
41.5
434.0
15.7
13.5
26
21.5
2.8
43.1
%
81.0
19.0
New business premium to grow at 25% CAGR over FY17-20E:
HDFC SL has
reported strong growth trends, which has enabled it to consistently rank
among India’s top three private insurers. We expect the company to deliver
25% CAGR in new business APE over FY17-20. This will be aided by aided by its
increasing bancassurance tie-ups, improvement in agency channel and higher
direct sales.
Diversified product mix, improving operating metrics to keep margins
buoyant:
HDFC SL has a balanced product mix between participating, non-
participating and ULIP products. It has steadily improved the share of high-
margin protection products to 26.4% as at Sep-17, which has helped it deliver
higher new business margins. Its diversified product portfolio and continued
improvement in operating metrics (persistency, productivity) will keep
margins/return ratios buoyant.
Strong distribution network; cost ratios to remain best-in-class:
HDFCSL
continues to benefit from the strong distribution network of its bancassurance
partners and has increased its bancassurance partner count to 125. This will
help widen its reach and support premium growth. HDFCSL maintains strong
control on cost ratios, aided by rising proportion of direct/online sales and
multiple technology initiatives.
Valuation:
We expect HDFC SL to further improve its new business margin to
23% by FY20E, while operating RoEV/RoEV should sustain at 21%/19%
respectively over FY17-20E. We value HDFC SL at 3.5x Mar-20E EV at INR370
per share (new business multiple of 28x), which implies an upside of 28% from
the issue price. HDFC SL’s strong new business margins, healthy return ratios
and stronger growth potential will enable it to trade at a premium to other
insurers. Initiate coverage with
BUY.
NBP
margin
19.9%
22.0%
22.3%
22.4%
22.7%
EVOP as
% of IEV
20.9%
21.0%
21.5%
21.3%
21.1%
RoEV
16.1%
21.1%
19.9%
19.0%
18.8%
RoE
28.5%
25.5%
22.7%
22.2%
23.8%
Dividend
9.0%
11.0%
12.5%
15.0%
17.5%
EV
102.3
123.9
148.5
176.8
210.0
P/EV
5.7
4.7
3.9
3.3
2.8
EPS
4.1
4.5
4.7
5.4
6.7
P/EPS P/AUM
70.7
64.9
61.5
54.0
43.1
78.5%
63.5%
52.9%
44.0%
36.3%
Exhibit 1: HDFC Life: Key financials
Net
Surplus
Premiums /Deficit
FY16
161.8
9.6
FY17
192.7
9.5
FY18E
231.2
10.9
FY19E
282.5
12.7
FY20E
349.6
15.7
INRb
PAT
8.2
8.9
9.5
10.8
13.5
VNB
7.4
9.1
11.4
14.8
18.3
20 November 2017
3

Exhibit 2: Snapshot of major insurers
HDFC Life
FY16
FY17
Profit and Loss matrix (INR m)
Operating Profit
Surplus / Deficit
PAT (Shareholder's a/c)
Premium (INR m) & growth (%)
New business prem – wrp
Total premium – unwtd
Market share
New business growth – wrp
Total prem growth – unwtd
New business mix – wrp (%)
Participating
Non-participating
ULIPs
Operating ratios (%)
Investment yield (%)
Commissions / GWP
Total expense ratio
Solvency margin
Persistency ratios (%)
13th Month
25th Month
49th Month
61st Month
Valuation ratios and other data points
NBP margin (%)
RoE (%)
RoIC (%)
Total AUMs, INRb
RoEV (%)
Operating RoEV (%)
Dividend (%)
Dividend payout ratio (%)
EPS, INR
Embedded Value, INRb
P/E (x)
P/EV(x)
P/AUM
VIF as a % of EV
154,644
9,597
8,183
36,156
64,872
4.7%
13.5%
18.1%
26.8%
20.5%
52.8%
2.5%
4.3%
15.8%
198.4%
79.0%
67.0%
63.0%
50.0%
19.9%
28.5%
37.8%
742
16.1%
20.9%
9.0%
26.4%
4.1
102.3
70.7
5.7
79%
68%
273,421
9,476
8,921
40,852
86,964
5.0%
13.0%
34.1%
25.9%
27.4%
46.7%
12.6%
4.1%
16.3%
191.6%
81.0%
73.0%
58.0%
57.0%
22.0%
25.5%
41.0%
917
21.1%
21.0%
11.0%
29.6%
4.5
123.9
64.9
4.7
64%
67%
ICICI Life
FY16
FY17
177,018
14,124
16,505
51,085
67,658
4.9%
9.9%
26.9%
11.4%
13.6%
75.1%
1.2%
3.2%
13.1%
320.0%
82.4%
71.2%
62.2%
46.0%
8.0%
31.2%
34.3%
1,039
0.8%
15.3%
84.0%
87.7%
11.5
139.4
33.0
3.9
52%
60%
340,640
11,527
16,822
64,862
77,604
4.5%
27.0%
14.7%
11.7%
13.6%
74.8%
13.0%
3.4%
13.9%
3.4%
85.7%
73.9%
59.3%
56.2%
10.1%
28.7%
34.8%
1,229
16.1%
16.5%
73.5%
39.5%
11.7
161.8
32.4
3.4
44%
58%
Max India
FY16
FY17
83,708
4,632
4,391
21,627
28,817
2.1%
8.7%
12.0%
62.6%
13.0%
24.4%
4.2%
8.9%
22.5%
343.0%
78.8%
66.6%
55.6%
42.7%
17.9%
21.5%
22.1%
364
6.9%
17.0%
136.6%
100.0%
11.5
56.2
48.1
3.8
41%
63%
115,546
-1,721
6,599
27,485
36,664
2.1%
27.1%
27.2%
61.4%
13.7%
24.9%
9.1%
8.7%
23.4%
309.0%
80.4%
70.4%
54.9%
53.0%
18.8%
29.1%
33.2%
444
16.6%
19.9%
52.5%
25.5%
17.3
67.4
32.0
3.2
34%
62%
SBI Life
FY16
FY17
169,482
6,642
8,610
48,781
71,066
5.1%
37.4%
28.5%
27.7%
28.7%
43.6%
4.6%
4.5%
13.7%
212.0%
80.0%
72.1%
77.2%
50.6%
16.0%
19.6%
86.1%
798
NA
19.0%
12.0%
16.8%
8.6
130.0
75.5
5.0
81%
NA
277,959
6,543
9,547
66,009
101,439
5.8%
35.3%
42.7%
22.9%
29.3%
47.8%
10.2%
3.7%
11.6%
204.0%
80.6%
73.0%
65.0%
68.1%
15.4%
18.6%
95.5%
977
21.4%
23.0%
15.0%
18.9%
9.5
165.4
68.1
3.9
67%
58%
Source: Company, MOSL
20 November 2017
4

Strides Shasun
BSE SENSEX
33,343
S&P CNX
10,284
20 November 2017
Update
| Sector:
Healthcare
CMP: INR787
TP: INR1,214(+54%)
Buy
Divestment to focus on profitable businesses
We believe that sale of domestic formulation business at 2.7x EV/FY17 sales is
not only at good multiple but would also enable Strides Shasun (STR) to focus on
Stock Info
Bloomberg
Equity Shares (m)
52-Week Range (INR)
1, 6, 12 Rel. Per (%)
M.Cap. (INR b)
M.Cap. (USD b)
Avg Val ( INRm)/Vol m
Free float (%)
US and Australia’s regulated market and Africa business in emerging market. The
STR IN
89.5
1,259/754
-13/-30/-50
70.4
1.1
423.2 / 0.4
68.9
deal also enables STR to reduce financial leverage, thereby improving
profitability.
Financials Snapshot (INR b)
Y/E Mar
2017 2018E 2019E
Net Sales
34.8
40.4
49.4
EBITDA
6.4
7.8
10.4
PAT
2.9
3.7
6.2
EPS (INR)
32.3
41.8
69.2
Gr. (%)
77.6
29.5
65.5
BV/Sh (INR)
303.1 342.5 411.6
RoE (%)
10.8
12.9
18.3
RoCE (%)
8.3
9.3
12.0
P/E (x)
24.4
18.8
11.4
P/BV (x)
2.6
2.3
1.9
Shareholding pattern (%)
As On
Sep-17 Jun-17 Sep-16
Promoter
31.1
31.1
31.1
DII
16.5
15.5
12.6
FII
33.6
33.9
35.3
Others
18.8
19.5
21.0
FII Includes depository receipts
Stock Performance (1-year)
Strides Shasun
Sensex - Rebased
1,400
1,225
1,050
875
700
Transaction details:
Strides Shasun (STR) has entered into definitive
agreement with Eris Lifesciences for sale of domestic branded
formulation business for cash consideration of INR5b. In this transaction,
STR would divest portfolio of 130+ brands along-with employees
forming part of the domestic branded business. STR would retain global
rights of these products. The transaction is subject to customary closing
conditions and both companies intend to close the transaction by 30
November 2017.
Deal to improve operating margin and reduce financial leverage:
STR,
over past two years had spent ~INR2.5b to acquire brands from J&J, Sun
Pharma and Medispan. The sale of these brands was INR1.8b in FY17,
implying EV/sales of 2.7x, which is decent as this business has been
EBITDA neutral for STR. Thus, sale of this business would reduce revenue
for STR and improve EBITDA margin. Repayment of debt of INR4b would
reduce annual interest outgo to the tune of INR350m, thereby improving
profitability as well.
Change in estimates and view:
We tweak our estimates to incorporate
sales of business and use of proceeds to repay debt. Accordingly, we
marginally raise our EPS estimate to INR47.4/INR74.8/INR92.1 for
FY18E/FY19E/FY20E and raise our price target to INR1,214 (SOTP basis).
We continue to like STR on the back of robust ANDA pipeline, consistent
compliance, outperforming industry in Australia market and lower net
debt to equity ratio. Re-ieterate Buy
20 November 2017
5

Sector Update | 20 November 2017
Cement
Environment ministry prohibits usage of petcoke in U.P,
Rajasthan & Haryana
Supreme court suggests petcoke ban on all India basis
Petcoke ban update
Event:
Ministry of Environment, forests and climate change has issued direction
under section 5 of the environment act 1986 to states of U.P, Haryana and
Rajasthan to prohibit usage of petcoke and furnace oil with immediate effect
until further orders. In regards to the above Chairman of Central Pollution
Control Board has issued a direction to prohibit the usage of petcoke and
furnace oil by any industry within states of U.P, Haryana and Rajasthan with
immediate effect.
Supreme Court has requested all the other state governments to consider taking
similar measures of prohibiting usage of petcoke in order to control pollution
and the case on this subject will be listed on 4th of December 2017.
Impact on profitability of cement companies:
We estimate that prohibition of
usage of petcoke in states of Rajasthan, U.P and Haryana will result in higher
fuel cost for cement companies operating out of these states as alternate fuel of
imported coal is 15-20% costlier than petcoke cost on per kcal basis. We have
not calculated the impact of shift of petcoke to imported coal on power cost as
the proportion of petcoke used in power plants is not exactly known as also split
grinding units typically depend on grid power for electricity and is unlikely to
have any meaningful impact.
We estimate the impact of shift of 100% petcoke to imported coal to result in
increase in fuel cost/t by INR94/t for Rajasthan, U.P and Haryana cement
manufacturing companies. The realization hike which would be required to
initiate to offset the impact of increase in cost would be INR6-7/bag. We
highlight with the recent sand mining ban in Rajasthan, this may be a slightly
difficult proposition in the short term.
We have given below that in case of an event the cost push in not passed on to
end consumer, the likely impact in company’s EBITDA adjusted for petcoke
consumption and mix of volume produced in Rajasthan, Haryana and U.P. We
estimate that JK Lakshmi, JK cement and Shree cement are likely to see impact
of 8%/6%/5% respectively on overall EBITDA due to the impact of cost push. The
other risk which the industry has highlighted is the increase in cost of imported
coal due to higher demand. While our analysis suggests that the additional
demand for imported coal will increase by ~7-8mt which is not likely to push the
prices of imported coal substantially. However if petcoke ban is levied across the
country, additional demand for imported coal could push up the prices of
imported coal.
20 November 2017
6

Impact on company’s financials due to petcoke ban in 3 states of U.P/Rajasthan and Haryana
Company
Shree Cement
ACC
Ambuja Cement
JK Cement
JK Lakshmi
Birla Corp
Ultratech Cement
India Cement
% of overall volume
produced in 3 states
77%
10%
11%
75%
75%
34%
21%
11%
% of petcoke
consumption
100%
65%
65%
85%
80%
90%
75%
80%
Increase in fuel cost/t
adj. for volume in 3
states and % of
petcoke consumption
73
6
7
60
57
29
15
8
Company FY19
EBITDA/t
1,339
752
972
1,012
688
862
1,345
867
% impact in EBITDA
5%
1%
1%
6%
8%
3%
1%
1%
20 November 2017
7

E
CO
S
COPE
Fears of fiscal deficit slippage are exaggerated
Combined analysis of center and 16 states discards such fears
17 November 2017
The Economy Observer
One of the serious contentions today, which has afflicted the analysis of the monthly accounts of the central
government, is if the center has appropriately distributed the tax collection with states (especially collection under
integrated GST, IGST). Based on the adjustments made to address this issue, conclusions are reached, which could be
highly misleading, in our view. To address this, we have performed a combined analysis of the monthly accounts of the
center and selected 16 states (which account for ~80% of total spending by all states) to assess the likelihood of the
government witnessing a shortfall in taxes, and thus fiscal deficit, in FY18.
We believe there are two benefits of this analysis. (1) It helps to assess the overall tax receipts of the general
government (center + 16 states) by removing the uncertainty involved in analyzing monthly data of the central
government in terms of its appropriate distribution of taxes to states. (2) It gives us clarity on the likelihood of the
general government breaching its fiscal deficit target for FY18.
Our analysis of the combined tax receipts of the center and the 16 states up to September 2017 reveals:
1.
States’ finances confirm weakness in tax receipts…: During the first two months of GST implementation (although
GST became effective from July 2017, the taxes pertaining to July were collected in August 2017), the tax receipts of
the 16 states grew only 2.3% YoY, as against 17.6% growth in the corresponding period last year and three-year
average of 11.1%. Only four states – Maharashtra (MH), Odisha (OR), Punjab (PB) and Rajasthan (RJ) – witnessed
higher growth in August-September 2017 compared to the past years.
2.
…however, overall tax receipts in FY18 could over-shoot the budget estimates (BEs) for the first time in seven years:
The combined tax receipts of the general government, however, grew 15% YoY in August-September 2017, marking
the fastest pace compared to the corresponding period of the last six years (when it averaged ~11%). In fact, growth
of 16.6% YoY in the combined taxes in 1HFY18 was the highest if we compare it to the corresponding periods of the
last five years. Since tax receipts (like spending) grow faster in the second half in comparison to the first half, we
estimate that the total tax receipts of the general government could over-shoot the BEs by
at least
INR410b –
INR27.57t v/s BE of INR27.16t. Even if we adjust the estimates of tax collection in 2HFY18 for the loss in taxes due
to the recent changes in GST rates (~INR75b for the remaining FY18) and a cut in excise duty on fuel products
(~INR130b), tax collection would be higher by
at least
INR200b.
3.
Fears of fiscal slippages are exaggerated: Higher-than-budgeted tax receipts would offset the majority of the
expected shortfall in the non-tax receipts (to the tune of INR300b due to lower dividends from the RBI), which
implies that the total receipts of the general government in FY18 would be closer to the BEs. Consequently, not only
the government will not be required to cut spending, but also it is unlikely to breach its FY18 fiscal deficit target.
20 November 2017
8

E
CO
S
COPE
Moody’s upgrades India to highest sovereign rating post liberalization
Further upgrades from Moody’s unlikely, but other agencies could follow suit
17 November 2017
The Economy Observer
Moody's upgraded India's sovereign credit rating to Baa2 from Baa3, the highest rating that the country has received
from the global ratings agency post liberalization. Outlook on the rating is also changed to stable from positive.
Notably, Moody's has upgraded India's rating after nearly 14 years (last in January 2004).
The ratings agency attributed the upgrade to a host of economic and institutional reforms (such as GST, better
monetary policy framework, bank recapitalization, demonetization and DBT), which are expected to drive a gradual
improvement in India’s fiscal metrics. India’s real GDP growth is also expected to improve from 6.7% in FY18 to 7.5% in
FY19, and then remain high in the ensuing years.
Although the upgrade has no impact on the country’s fundamentals, it is a sentiment booster and largely reflects the
governments’ past and ongoing actions.
Moody’s clarified that further upgrades will depend on a
material
improvement in fiscal metrics, along with a
strong
and durable recovery
of the investment cycle. On the contrary, a material deterioration in fiscal metrics/health of the
banking system could prompt a downgrade. Overall, we do not expect any further rating change from Moody’s in the
near future; however, an upgrade from other rating agencies (Standard & Poor’s and Fitch) is long due, in our view.
Moody’s – one of the three major global ratings agencies – upgraded the
Government of India’s local and foreign currency issuer ratings by one notch to Baa2
from Baa3. The outlook on the rating was also changed to stable from positive. The
global ratings agency has upgraded India’s rating after nearly 14 years (last in
January 2004; Exhibit 1). This is India’s highest credit rating by Moody’s post
liberalization.
Reasons for the upgrade
Moody’s took note of the Indian government’s wide range of economic and
institutional reforms, such as the GST (would promote productivity by removing
barriers to inter-state trade), improvement in the monetary policy framework,
measures to address the overhang of non-performing loans (NPL) in the banking
system, demonetization, and Aadhar and the Direct Benefit Transfer (DBT) system
for targeted delivery of benefits. The rating agency expects India’s GDP growth to
accelerate to 7.5% in FY19 from 6.7% in FY18; it sees “similarly robust levels” of
growth in the ensuing years. Moody’s also highlighted that India has stronger long-
term growth potential than most other Baa-rated sovereigns.
Exhibit 1: Movements in India’s ratings by three major rating agencies
BB+
BB
BB+
Standard & Poor's (S&P)
Rating
Date
7-Dec-92
2-Feb-05
Fitch
Rating
BB+
BB
BB+
(Highest)
(Lowest)
Date
8-Mar-00
21-Nov-01
21-Jan-04
1-Aug-06
Rating
Ba2
(Lowest)
Ba1
Baa3
Baa2
Moody's
Date
28-Jul-99
3-Feb-03
22-Jan-04
16-Nov-17
(Highest)
Source: Bloomberg, MOSL
(Lowest)
22-Oct-98
30-Jan-07
BBB-
(Highest)
BBB-
The table doesn’t include change in ratings’ outlook
20 November 2017
9

Sector Update | 20 November 2017
Healthcare
Performance of top
companies: October 2017)
Company
IPM
Sun Pharma
Abbott India
Cipla
Zydus Cadila
Mankind
Alkem
Lupin
GSK Pharma
Pfizer
Glenmark
Pharma
Sanofi
Dr Reddy Labs
Torrent Pharma
Alembic Pharma
Ipca Labs
Natco
Ajanta Pharma
Merck
Biocon
MAT
gr (%)
6.0
7.5
8.5
2.5
10.6
7.8
3.2
7.6
6.1
(3.2)
10.2
10.4
2.7
9.4
(1.2)
(2.0)
(9.8)
9.4
6.6
12.1
Oct-
17
(%)
6.5
5.6
8.9
8.0
2.9
21.1
13.2
2.0
23.7
(8.9)
8.6
4.6
1.3
9.8
0.6
(11.6)
22.7
10.6
0.6
11.0
IPM – Early signs of revival
GSK Pharma, Natco and Mankind witness highest growth
Indian pharmaceutical market's (IPM) secondary sales grew at a healthy rate in
October, led by strong volume growth. Price growth, however, witnessed a
downtrend in the month. IPM grew by 6.5% YoY in October 2017 and 3.8% YoY
over August-October 2017.
After declining 0.3% YoY over May-July 2017, industry volumes grew by 3% over
August-October 2017. Growth in new products came down to 2.6% YoY over
August-October 2017, from a high of 7.4% YoY in the year-ago period. Prices
declined 1.8% YoY in the recent quarter, after increasing marginally by 0.6% in
May-July 2017. We believe the negative impact from GST is now behind, and
expect a gradual recovery over the coming months.
Moving annual total (MAT) growth for October stood at 6.0%, as against -6.2%
YoY in September.
GSK Pharma (+23.7%) posted robust growth for October, followed by Natco
(+22.7%) and Mankind (+21.1%). More than 50% of the companies posted high-
single-digit to high-double-digit growth in the month.
IPCA’ secondary sales continued to decline (-11.6%) in October, followed by
Pfizer (-6.8%).
Vaccines (1.9% of IPM) saw significant growth of 23.5% in October, followed by
Derma (+13.5%; 6.3% of IPM) and Anti-diabetic (+11.4%; 9.1% of IPM). 60% of
the therapies grew in high-single-digit to double-digit. Anti-infectives (13.8% of
IPM) grew marginally by 1.6% v/s a decline of 2.4% in the previous month. All
therapies reported growth in October. However, Anti-Neoplastic (+3.1%), Pain
(+3.7%), Gynecological (+4%) and Vitamins (+4.8%) underperformed the IPM.
In value terms, secondary sales of DPCO-listed products increased by 3.3% YoY
and of non-DPCO products by 7.1% YoY.
FDC-banned drugs (+10.3% in October; ~2.4% of IPM in value terms) continued
to grow for the second consecutive month, while non-banned drugs grew by
7.2% YoY. Secondary sales for Indian companies increased 6.6% YoY, while those
of MNC companies grew by 6.3% YoY.
Vaccines, Derma and Anti-diabetic lead among therapies
DPCO v/s non-DPCO market (October-17)
FDC ban impact (October-17)
Exhibit 3: Although industry witnessed volume growth, price growth continued to decline
Volume Growth (%)
13.4
9.5
3.9
3.5
2.1
3M-Jul 16
1.7
3M-Oct 16
7.4
4.3
10
5.1
3.6
1.3
3M-Jan 17
7.8
3.4
3.3
1.1
3M-Apr 17
3.2
0.6 2.9
-0.3
3M-Jul 17
3.8
3
2.6
-1.8
3M-Oct 17
Source: AIOCD, MOSL
Price Growth (%)
New Product Growth (%)
Total Growth (%)
20 November 2017
10

Sector Update | 17 November 2017
Cement
Average national price declines ~1%
MoM in mid-November-17 (prices in
INR/bag)
National Average Prices
Prices largely flattish
Hikes likely in south markets
Cement prices declined marginally by 1% MoM in the first half of November 2017 due
to price weakness in the south market.
Prices in south are likely to be hiked by INR15-20/bag next week to compensate for
the correction over the last three months.
Prices in north are likely to be flattish until mid-December due to reduced construction
activity in the NCR region (as per NGT ruling) and the sand mining ban in Rajasthan.
Cement demand for October was healthy in north, with growth coming from the IHB
segment. Demand in south declined by ~1% YoY due to weakness in Tamil Nadu, partly
offset by strong demand from AP/Telangana.
Cement prices correct marginally at all-India average level
All-India cement prices were marginally lower by 1% MoM for the first half of
November due to a 3% MoM price correction in south, driven by lower prices in
AP/Telangana. Cement prices in north/west/east/central were largely flattish MoM,
with selected regions like Mumbai and Ahmadabad witnessing price volatility in the
first week of November.
Prices likely to be increased in south
Cement prices in south have declined by 3% MoM in November (down 13% from the
peak in April 2017) due to demand weakness. Our channel checks suggest that
cement prices are likely to be increased by INR15-20/bag in AP/Telangana and by
INR5-10/bag in Karnataka. However, prices in Tamil Nadu may remain unchanged,
with monsoon keeping demand muted.
North may not see price increase until mid-December
Cement prices in north are unlikely to improve meaningfully (contrary to our earlier
expectations), as demand has remained weak due to reduced construction activity
in NCR region, as per orders of NGT. Additionally, the recent order by the Supreme
Court on sand mining ban in Rajasthan could impact volumes. However, there could
be cost push in form of higher fuel prices, as usage of petcoke has been banned in
Uttar Pradesh, Rajasthan and Haryana. This will further increase power & fuel cost/t
for the companies.
Demand continues to be stable
Cement demand in October was stable in north (up ~4-5% YoY on higher demand
from the IHB segment), Gujarat (up 4-5% YoY after a sustained decline for the past
few months) and east (up MoM with the end of festival season). South demand
declined by 2% YoY, as demand improvement in AP/Telangana to the extent of 18%
YoY was largely offset by ~26% decline in Tamil Nadu. Demand remained weak in
the central region due to the sand mining ban.
20 November 2017
11

In conversation
1. HDFC: Rating upgrade was long overdue; Deepak Parekh,
Chairman
Rating agencies have not been fair to India, the upgrade was long overdue.
Reforms have been transformational and big bang and not incremental. Reforms
have been well executed by the governmnet and so on these grounds the
upgrades should have come much earlier.
Going forward maybe the next upgrades could come quicker.
Regarding higher oil prices on India, there is a lot of uncertainty in the OPEC
countries.
With reserves at USD 400 billion, India is better prepared and could be able to
manage if the oil price went to levels of USD 70-75 per barrel but if they go upto
USD 100/bbl and above it would be a killer for India.
Government is using the housing sector to pump-prime the economy.
Under the MIG-I category, the carpet area of the houses has been enhanced
from 90 sq metres to 120 sq metres, while under the MIG-II segment, it has
been increased to 150 sq metres from the current 110 sq metres. Housing
would definitely be the engine for growth because it impacts other sectors like
cement, steel, labour, building material etc. So, it basically kicks starts the
economy.
This government has been the first to give a maximum thrust to housing.
2. HPCL: Upgrade to help reduce interest rate cost by 30-50bps;
MK Surana, CMD
Company has got foreign exchange borrowing at USD 1.6 billion and has capex
plans at around USD 10 billion.
Upgrades may help in reducing borrowing cost. Expectations are that it may
help to the extent of around 30-50 basis points (bps) on the interest rate.
If rupee continues to strengthen, the crude cost may reduce.
3. WESTLIFE: Withdrawal of input tax credit increased our costs;
Amit Jatia, Vice-Chairman
Welcome government’s move to bring down GST from 18 percent to 5 percent.
For the organised players, the real cost is not 5 percent - the government while
bringing 5 percent down, took away the benefit of input tax credit.
The input tax credit which was available to company for the last 20 years has
now been taken away which added cost.
4. CIPLA: See limited competition for Pulmicort; expect 3-4 more
approvals by fy18-end; Umang Vohra, MD & Global CEO
Pulmicort approval is limited in nature. There is an IP situation around
Pulmicort, which will get resolved sometime in 2018 and so, there could be
further competition coming in as well.
It is a product candidate which is of Form Fill Seal (FFS) solution – actually a
suspension product and difficult to make. Not many facilities in the world that
make it and so think the competition is limited.
20 November 2017
12

Competition could be doing close to USD 15-20 million in terms of revenues and
so they would also roughly be in that range.
Company would continue supplying it to Sandos, as contract manufacturer for
the drug.
Post the Q2 numbers, the company had guided for a steady stream of limited
competition drugs in the US.
Not all of them would be limited competition but till the end of FY18 expect to
get another 3 or 4 more approvals, and possibly more after that.
Trajectory is to grow 10 percent quarter on quarter. Have now bottomed out
and are beginning to see growth in US.
Regarding pricing pressure in the US impacting their portfolio, percentage
impact is similar to all the others players, which is around 10-15 percent price
erosion. However, only difference is that since other players’ base is smaller,
they do not see the same dollar absolute hits.
For past 3-5 quarters have been trying to balance the erosion with whatever
approvals company is getting. The trajectory will move up once the limited
drugs start.
The US remains the largest market in the world and look at it as an attractive
opportunity.
20 November 2017
13

From the think tank
1. Moody’s thumbs up for pm Modi’s longer-term reforms
The timing of Moody’s ratings upgrade, the first in 13 years, is ironic since it
comes at a time when, while still good, India’s fundamentals don’t look as solid as
they did, say, a year ago. While the government was hopeful of getting an
upgrade at that point, rating agency S&P refused to oblige, and there are doubts
as to whether India will be able to accelerate growth fast enough. But even while
it is likely the government will slip on its fiscal commitments this year, Moody’s
seems to have, rightly, shifted its focus from just traditional deficit- and debt-
based indicators and, instead, looked at the big reforms undertaken in the last
few years. Indeed, the Moody’s statement says, at 68% of GDP, India’s
consolidated fiscal deficit is significantly higher than the Baa median of 44%, and
that it expects India’s debt-to-GDP ratio to rise about one percentage point due to
the slowing of nominal GDP as well as the implementation of GST. If the rating
agency has upped its rating despite this, it is because the various reforms will,
over time, change India in a fundamental manner and, once GDP grows faster
again, the debt- and deficit numbers will look better
2. Mukesh Ambani’s online approach may outsmart Amazon
Amazon.com Inc. had better watch out. The $200 billion e-commerce market
Morgan Stanley is forecasting for India by 2027 just got a new contender—with
a very different plan. Energy tycoon Mukesh Ambani has already disrupted the
country’s telecom industry. His next big foray may be online retail. But India’s
richest man may not create a marketplace of his own. According to an Economic
Times report, Ambani’s Reliance Industries Ltd wants to leverage its Jio wireless
service and hand out digital coupons, which customers can then use to get
discounts at their neighbourhood stores. Why is this a smart move? There are
clues in Morgan Stanley’s research. India has 432 million internet users, but only
60 million online shoppers. The e-commerce industry, including online food
delivery, is just $15 billion a year, or 40% less than Alibaba Group Holding Ltd.’s
Singles’ Day sales in China
3. Narrow banking is an idea whose time has come
The most heartening takeaway from last week’s public sector bank executive
jamboree was the discussion around differentiated lending structures. The
ThinkShop (earlier editions were called Gyan Sangams) suggested that large banks
focus on corporate lending, while smaller lenders focus on retail loans or specific
geographies. It is a good start. One of the key things the three credit crises in the
Indian banking system over the past three decades have taught us is how little
progress has been made to improve the impaired credit culture of state-owned
banks. Taking differentiated lending to its logical end, the time has come to
consider converting the worst performers among state-owned lenders to narrow
banks, which won’t lend at all.
20 November 2017
14

International
4. Asian cities should be focal points for climate action
The global response to climate change has so far been focused entirely on
nation states. Until the Paris Agreement and the recently concluded Kigali
Agreement, the inability of nation states to broker any agreement resulted in
inadequate positive action. This is amply borne out by the increase in both the
duration and frequency of extreme climatic events. It is only now that the
emphasis of the climate change debate is shifting to cities, particularly mega
cities. Cities cover less than 2% of the earth’s surface, but consume 78% of its
energy. According to the International Energy Agency’s World Energy Outlook
(2008), urban areas account for over 71% of energy-related global greenhouse
gases (GHGs), particularly carbon dioxide (CO2) emissions, mainly through
concentrated and increased energy consumption by transport and industry, and
biomass use. This figure is expected to rise to 76% by 2030.
20 November 2017
15

Click excel icon
for detailed
valuation guide
Rs
Valuation snapshot
P/E (x)
P/B (x)
ROE (%)
FY17 FY18E FY17 FY18E FY17 FY18E FY19E
28.5
25.4
24.3
53.3
40.1
19.0
50.0
51.0
34.8
24.7
21.5
26.1
44.5
33.5
21.3
60.3
29.4
35.3
25.6
27.9
23.4
32.2
21.3
18.3
33.9
NM
38.2
43.0
12.3
21.0
30.1
30.7
NM
20.7
38.9
14.1
NM
30.6
1,134.3
21.1
124.2
NA
55.8
46.1
28.2
27.8
21.5
62.2
36.3
77.0
17.3
28.3
25.8
22.1
36.4
41.5
21.5
37.6
43.4
19.4
25.4
19.9
18.9
24.2
29.0
17.1
47.5
24.8
29.5
21.0
81.4
20.3
26.6
23.9
19.8
26.8
18.1
31.9
31.3
16.5
17.2
25.4
10.2
65.4
24.1
9.2
11.2
7.5
22.4
23.1
NM
21.7
53.3
39.1
32.0
21.2
21.6
16.9
51.3
33.0
73.1
14.2
5.3
5.5
5.5
7.9
6.6
3.0
15.6
9.7
3.5
3.4
7.2
3.3
2.8
7.0
2.5
14.0
5.0
2.4
2.6
2.1
2.2
5.4
2.4
1.3
4.7
0.7
4.9
4.5
1.2
3.3
3.5
1.2
0.9
0.8
0.5
1.4
0.4
1.1
1.6
0.5
1.1
NA
10.7
5.5
3.0
4.6
2.5
18.6
6.7
NA
4.2
4.6
5.0
4.9
6.8
6.0
2.7
11.8
8.2
3.0
3.2
6.3
3.0
2.5
6.1
2.2
11.4
4.4
2.0
2.1
2.1
1.8
4.8
2.5
1.2
4.2
0.7
4.4
3.2
1.1
2.8
3.0
1.1
1.0
0.8
0.5
1.3
0.3
1.0
1.5
0.6
1.0
5.1
6.3
4.4
2.6
3.9
2.3
15.3
6.1
NA
3.7
20.3
23.1
25.3
16.2
15.8
16.9
37.1
20.8
10.6
13.9
35.7
14.2
6.4
20.3
9.8
25.6
17.1
6.9
10.8
9.5
9.9
18.3
10.9
7.2
15.3
-27.0
13.8
12.3
9.0
18.9
11.5
4.0
-6.7
4.2
1.4
10.1
-8.4
3.6
-0.2
2.7
0.9
0.0
21.6
15.1
12.0
18.0
14.4
32.5
18.9
25.5
25.5
17.3
20.4
23.3
20.1
15.2
13.0
35.7
20.5
16.8
12.5
33.7
14.5
10.8
20.5
13.4
26.5
17.7
7.3
11.5
2.6
9.6
18.8
8.8
6.3
16.9
4.0
14.8
12.4
6.7
17.3
11.9
6.4
1.5
3.4
5.8
11.6
4.6
4.7
7.0
-4.7
4.7
12.5
20.2
15.3
13.2
19.6
14.1
32.8
19.3
22.7
27.6
18.1
25.2
25.3
23.2
18.1
16.2
35.0
22.8
18.4
13.7
31.1
14.6
11.5
23.0
28.3
35.6
22.7
10.8
11.8
8.2
10.0
20.4
10.5
6.9
19.0
8.0
16.5
13.7
12.6
19.5
13.9
9.4
4.3
6.1
7.3
12.7
5.4
7.1
11.4
2.1
7.8
12.3
20.4
19.3
15.4
19.6
15.3
32.8
18.6
22.2
30.7
Company
Automobiles
Amara Raja
Ashok Ley.
Bajaj Auto
Bharat Forge
Bosch
CEAT
Eicher Mot.
Endurance Tech.
Escorts
Exide Ind
Hero Moto
M&M
Mahindra CIE
Maruti Suzuki
Tata Motors
TVS Motor
Aggregate
Banks - Private
Axis Bank
DCB Bank
Equitas Hold.
Federal Bank
HDFC Bank
ICICI Bank
IDFC Bank
IndusInd
J&K Bank
Kotak Mah. Bk
RBL Bank
South Indian
Yes Bank
Aggregate
Banks - PSU
BOB
BOI
Canara
IDBI Bk
Indian Bk
OBC
PNB
SBI
Union Bk
Aggregate
NBFCs
Aditya Birla Cap
Bajaj Fin.
Bharat Fin.
Capital First
Cholaman.Inv.&Fn
Dewan Hsg.
GRUH Fin.
HDFC
HDFC Stand. Life
Indiabulls Hsg
Reco
Buy
Buy
Buy
Buy
Neutral
Buy
Buy
Buy
Sell
Buy
Neutral
Buy
Not Rated
Buy
Buy
Neutral
CMP
(INR)
799
116
3,212
697
18,985
1,777
30,638
1,198
694
201
3,635
1,417
238
8,341
421
709
TP
% Upside
EPS (INR)
(INR) Downside FY17 FY18E FY19E
856
134
3,753
844
19,965
2,116
34,722
1,334
688
254
3,819
1,607
-
9,466
575
764
7
16
17
21
5
19
13
11
-1
26
5
13
13
36
8
28.0
4.6
132.3
13.1
473.1
93.3
612.7
23.5
20.0
8.1
169.1
54.3
5.4
248.6
19.8
11.7
28.3
34.2
4.5
6.2
145.2 175.0
19.1
26.0
457.8 603.0
82.5 116.9
814.7 1,062.7
27.6
36.7
35.8
45.9
7.9
9.7
183.1 193.9
75.0
85.7
9.9
11.8
288.1 381.0
24.6
64.8
14.9
25.8
Buy
Neutral
Buy
Buy
Buy
Buy
Neutral
Buy
Buy
Buy
Buy
Buy
Buy
542
179
141
113
1,827
325
55
1,631
75
1,024
511
31
306
680
197
209
146
2,150
355
56
2,000
100
1,179
665
36
382
25
10
48
30
18
9
2
23
33
15
30
18
25
15.4
7.0
5.0
4.8
56.8
15.3
3.0
48.1
-31.3
26.8
11.9
2.5
14.6
18.4
8.5
1.7
5.5
68.7
13.6
2.8
60.9
4.1
32.1
16.4
1.9
17.8
30.8
10.5
5.7
6.6
84.7
17.0
3.2
78.6
8.7
41.6
23.0
3.8
23.3
Buy
Neutral
Neutral
Neutral
Buy
Neutral
Buy
Buy
Neutral
184
208
388
60
413
128
191
337
170
201
201
386
49
438
150
250
415
175
10
-3
-1
-17
6
17
31
23
3
6.0
-14.8
18.8
1.5
29.3
-31.6
6.2
0.3
8.1
17.9
3.2
16.1
6.4
36.7
17.1
8.5
14.6
-13.5
22.6
9.2
30.3
8.6
44.0
21.4
13.5
26.8
6.0
Buy
Buy
Under Review
Buy
Buy
Buy
Neutral
Buy
Buy
Buy
198
1,787
968
695
1,276
635
506
1,701
344
1,189
231
2,300
-
925
1,500
690
500
2,000
370
1,550
17
29
33
18
9
-1
18
7
30
0.0
32.0
21.0
24.6
46.0
29.6
8.1
46.8
4.5
68.6
3.7
45.7
30.3
32.8
59.2
37.6
9.9
51.6
4.7
83.6
5.4
63.7
47.2
43.7
70.4
46.0
12.0
57.1
5.4
105.1
20 November 2017
16

Company
L&T Fin Holdings
LIC Hsg Fin
Manappuram
M&M Fin.
Muthoot Fin
PNB Housing
Repco Home
Shriram City Union
STF
Aggregate
Capital Goods
ABB
Bharat Elec.
BHEL
Blue Star
CG Cons. Elec.
CG Power & Indu.
Cummins
GE T&D
Havells
K E C Intl
L&T
Pennar Eng.
Siemens
Solar Ind
Suzlon Energy
Thermax
Va Tech Wab.
Voltas
Aggregate
Cement
Ambuja Cem.
ACC
Birla Corp.
Dalmia Bharat
Grasim Inds.
India Cem
J K Cements
JK Lakshmi Ce
Ramco Cem
Orient Cem
Prism Cem
Shree Cem
Ultratech
Aggregate
Consumer
Asian Paints
Britannia
Colgate
Dabur
Emami
Godrej Cons.
GSK Cons.
HUL
ITC
Reco
Buy
Neutral
Not Rated
Buy
Neutral
Buy
Buy
Buy
Buy
CMP
(INR)
190
605
103
438
457
1,372
622
2,021
1,301
TP
% Upside
(INR) Downside
240
26
680
12
-
481
10
550
20
1,750
28
800
29
2,650
31
1,415
9
FY17
5.2
38.2
8.6
7.1
29.5
31.6
29.1
84.3
55.6
EPS (INR)
FY18E FY19E
6.9
10.4
41.0
46.5
9.2
9.7
14.2
19.1
42.6
42.0
52.5
66.5
36.0
41.9
115.6 145.3
80.6 106.2
P/E (x)
P/B (x)
ROE (%)
FY17 FY18E FY17 FY18E FY17 FY18E FY19E
36.3
27.3 4.3
3.8
12.4 14.9 18.9
15.8
14.7 2.8
2.4
19.1 17.4 17.2
11.9
11.2 2.6
2.4
24.0 22.3 21.4
61.8
30.9 3.8
3.6
6.4
11.9 14.8
15.5
10.7 2.8
2.3
19.4 23.8 19.9
43.4
26.1 4.2
3.7
13.8 15.0 16.7
21.3
17.3 3.4
2.9
17.4 18.0 17.6
24.0
17.5 2.6
2.4
11.7 14.3 15.9
23.4
16.1 2.6
2.3
11.7 15.1 17.4
32.6
26.0 5.2
4.5
16.1 17.2 17.9
69.7
28.4
65.5
54.0
52.1
20.2
32.3
71.6
53.1
24.7
28.9
14.3
66.9
56.1
21.7
33.1
18.2
39.5
35.9
56.2
48.9
39.3
79.2
17.3
31.4
32.1
61.5
26.6
NM
416.9
47.6
44.5
38.3
55.7
64.3
49.0
46.4
48.2
50.0
38.5
65.1
30.7
67.9
25.2
29.9
42.2
47.0
57.6
33.8
43.6
44.1
20.5
24.9
11.1
55.0
44.1
15.6
34.2
15.8
34.8
30.5
39.5
33.8
34.9
50.5
14.3
30.2
22.7
35.3
26.8
26.2
41.5
37.6
41.8
30.8
54.3
56.0
44.5
43.5
48.1
44.6
37.4
56.0
28.3
8.9
5.8
1.0
8.8
28.3
1.2
6.3
10.2
9.7
4.7
3.4
1.5
6.2
10.3
-1.3
4.5
3.0
6.1
4.0
2.8
3.8
2.6
5.5
1.7
1.1
4.3
3.6
4.6
3.4
6.0
8.3
4.9
3.6
14.8
21.1
22.2
12.2
16.5
12.1
8.1
42.6
6.9
7.8
4.5
1.0
8.3
20.8
1.2
5.9
8.9
8.6
4.0
3.1
1.3
5.4
8.7
-1.4
4.1
2.6
5.4
3.6
2.7
3.7
2.5
5.0
1.6
1.0
3.7
3.3
4.0
3.1
5.4
6.9
4.4
3.3
14.4
17.4
21.1
10.5
14.1
9.5
7.9
42.4
6.9
12.7
20.6
1.5
18.0
76.4
6.2
21.2
12.4
18.2
19.2
12.5
10.2
9.3
19.8
NM
14.3
16.9
18.0
11.2
5.1
7.9
7.1
7.2
10.8
3.4
14.4
6.1
19.0
-3.2
1.4
18.4
11.6
9.4
28.5
36.9
50.4
28.4
35.8
24.6
22.2
66.5
23.5
11.6
17.9
3.3
20.2
51.0
2.1
18.1
21.8
19.5
19.5
13.1
11.6
9.8
21.4
-8.8
12.6
17.5
16.5
11.9
7.0
11.1
7.3
10.3
11.5
3.5
17.5
9.9
16.0
12.3
13.7
20.0
11.1
10.7
26.9
34.0
48.7
26.0
31.7
23.8
21.4
75.9
24.4
14.6
18.1
3.3
27.8
49.6
3.3
22.2
22.6
21.2
20.2
14.0
12.6
13.8
21.5
-11.0
13.2
16.4
16.3
13.0
8.0
14.2
12.0
12.7
14.5
6.0
19.2
13.9
17.9
15.6
21.3
17.4
14.2
12.9
29.4
35.2
56.2
27.3
34.0
22.9
22.6
88.0
25.6
Sell
Buy
Sell
Neutral
Buy
Neutral
Buy
Neutral
Neutral
Neutral
Buy
Not Rated
Neutral
Neutral
Not Rated
Neutral
Buy
Neutral
1,374
179
88
695
244
83
855
411
508
292
1,221
101
1,192
1,156
14
1,021
545
610
1,230
210
78
685
260
90
1,150
440
460
350
1,450
-
1,355
1,120
-
930
745
550
-10
17
-11
-1
7
8
34
7
-9
20
19
14
-3
-9
37
-10
19.7
6.3
1.3
12.9
4.7
4.1
26.5
5.7
9.6
11.9
42.3
7.1
17.8
20.6
0.6
30.8
29.9
15.5
20.2
7.1
2.9
16.5
5.2
1.4
25.3
9.4
11.5
14.3
49.0
9.1
21.7
26.2
0.9
29.9
34.5
17.5
28.7
8.0
3.0
24.4
6.5
2.3
35.0
11.2
14.3
17.6
57.5
11.2
33.4
31.3
1.0
34.4
37.2
19.6
Neutral
Neutral
Buy
Buy
Neutral
Neutral
Buy
Buy
Buy
Buy
Buy
Buy
Buy
274
1,766
1,122
3,070
1,175
177
1,083
428
726
165
114
18,300
4,277
314
1,797
1,435
3,517
1,302
188
1,324
512
853
205
128
21,852
4,906
14
2
28
15
11
6
22
20
17
25
12
19
15
4.9
6.9
36.1 52.2
28.5 32.2
38.8 60.8
67.8 81.9
5.6
5.8
33.7 47.8
7.0
12.1
27.3 27.1
-1.6
6.3
0.3
2.7
384.4 486.2
96.1 102.2
8.4
70.9
56.7
83.7
116.8
10.5
61.8
19.1
35.1
9.1
5.0
499.3
147.1
Neutral
Buy
Buy
Buy
Buy
Neutral
Neutral
Buy
Neutral
1,171
4,736
1,040
337
1,279
944
6,009
1,279
258
1,280
5,845
1,328
395
1,435
1,015
5,400
1,440
280
9
23
28
17
12
7
-10
13
9
21.0 21.6
73.7 84.5
21.2 23.4
7.2
7.7
26.5 26.6
18.9 21.2
156.1 160.8
19.6 22.8
8.4
9.1
25.8
106.9
28.6
9.3
33.2
24.5
182.3
27.6
10.0
20 November 2017
17

Company
Jyothy Lab
Marico
Nestle
Page Inds
Parag Milk
Pidilite Ind.
P&G Hygiene
Prabhat Dairy
United Brew
United Spirits
Aggregate
Healthcare
Alembic Phar
Alkem Lab
Ajanta Pharma
Aurobindo
Biocon
Cadila
Cipla
Divis Lab
Dr Reddy’s
Fortis Health
Glenmark
Granules
GSK Pharma
IPCA Labs
Jubilant Life
Lupin
Sanofi India
Shilpa Medicare
Strides Shasun
Sun Pharma
Syngene Intl
Torrent Pharma
Aggregate
Infrastructure
Ashoka Buildcon
IRB Infra
KNR Constructions
Sadbhav
Engineering
Aggregate
Logistics
Allcargo Logistics
Blue Dart
Concor
Gateway
Distriparks
Gati
Transport Corp.
Aggregate
Media
Dish TV
D B Corp
Den Net.
Reco
Neutral
Neutral
Neutral
Buy
Neutral
Buy
Neutral
Not Rated
Buy
Neutral
CMP
(INR)
335
306
7,689
23,535
234
835
9,100
154
1,107
3,188
TP
% Upside
(INR) Downside
365
9
340
11
7,750
1
25,580
9
275
17
975
17
9,267
2
-
1,320
19
2,970
-7
FY17
11.2
6.3
123.7
238.7
3.6
16.7
132.9
3.5
8.7
26.7
EPS (INR)
FY18E FY19E
9.2
10.9
6.5
7.9
128.4 149.0
296.6 413.1
8.9
12.4
17.2
20.8
151.5 176.7
3.5
6.4
14.7
18.0
34.9
53.7
P/E (x)
FY17 FY18E
29.8
36.5
48.8
47.1
62.2
59.9
98.6
79.3
65.0
26.3
49.9
48.5
68.5
60.1
43.7
44.4
127.5 75.5
119.2 91.3
48.0
43.7
23.8
26.4
22.2
18.0
38.7
31.4
38.3
25.5
32.0
12.6
14.9
17.0
73.1
32.9
18.3
14.6
34.7
44.3
24.4
19.8
39.5
22.8
23.4
NM
11.5
22.4
29.1
19.8
23.7
28.6
24.1
15.9
64.7
25.5
28.9
31.4
38.4
69.0
15.4
15.4
56.8
28.5
15.3
22.1
32.3
34.3
18.9
36.0
31.9
25.2
27.4
116.9
10.2
20.1
22.3
16.5
15.4
31.5
31.5
29.4
8.3
13.6
25.5
75.1
16.9
NM
P/B (x)
ROE (%)
FY17 FY18E FY17 FY18E FY19E
5.6
5.7
21.1 15.5 18.3
17.0 14.8 36.7 33.6 37.1
24.6 22.3 40.9 39.0 40.9
39.4 31.6 40.0 39.8 44.4
3.0
2.7
6.0
10.8 13.3
12.9 10.7 28.2 24.1 23.9
42.9 35.6 39.3 64.8 62.9
2.2
2.1
5.2
4.9
8.5
12.5 11.0 10.2 15.5 16.5
23.9 16.6 21.3 18.2 20.9
13.2 12.3 27.6 28.2 29.5
5.1
5.3
7.2
4.4
4.9
6.6
3.9
5.0
3.1
1.2
3.7
3.1
10.6
2.7
3.1
2.8
5.9
5.4
2.6
3.4
8.0
4.9
3.9
2.4
1.5
4.2
3.3
2.2
2.3
17.7
3.7
2.8
2.1
2.6
3.7
16.6
4.2
2.0
4.4
4.6
5.7
3.5
4.6
5.5
3.5
5.2
3.0
1.0
3.0
2.2
12.5
2.5
2.6
2.5
5.5
4.7
2.3
3.2
6.5
4.4
3.5
2.2
1.4
3.5
2.9
1.9
2.1
13.5
3.5
2.7
1.9
2.2
3.5
13.6
3.5
2.1
23.0
21.9
36.7
27.6
12.3
23.0
10.2
22.0
9.7
10.0
24.7
21.1
14.5
8.6
18.0
20.9
17.1
14.4
10.8
18.1
22.2
23.8
16.8
-0.6
14.0
20.7
12.0
11.0
13.7
50.5
10.8
7.3
12.4
16.7
12.3
25.1
24.6
-19.1
19.9
17.2
26.4
24.6
7.2
23.4
12.1
16.3
8.2
1.6
19.6
17.7
22.0
9.2
18.4
12.0
17.1
14.7
12.9
9.2
22.5
18.3
12.9
1.9
14.1
19.1
13.8
11.8
14.1
48.6
11.5
9.2
19.4
17.8
13.6
19.9
22.8
-6.4
19.8
19.6
25.7
22.3
11.4
26.1
13.6
21.2
14.1
3.9
18.4
18.8
31.4
12.0
19.2
12.5
17.6
20.5
18.0
13.7
20.7
19.9
15.4
7.0
12.9
17.0
12.5
11.6
15.4
46.8
14.1
11.7
25.4
18.6
16.1
35.2
22.2
0.2
Neutral
Neutral
Buy
Buy
Neutral
Buy
Neutral
Neutral
Neutral
Buy
Neutral
Buy
Neutral
Neutral
Buy
Buy
Buy
Buy
Buy
Buy
Not Rated
Neutral
514
1,967
1,272
708
394
446
609
1,018
2,325
130
584
123
2,511
529
676
829
4,485
621
788
517
515
1,258
540
1,950
1,606
900
335
555
600
1,100
2,575
185
650
200
2,500
550
861
1,000
5,000
797
1,201
610
-
1,400
5
-1
26
27
-15
24
-1
8
11
42
11
63
0
4
27
21
11
28
52
18
11
21.6 21.6
74.6 68.8
57.3 52.7
39.3 44.6
10.2
6.1
14.2 17.5
15.9 21.1
39.9 32.4
72.6 60.6
10.3
1.9
39.3 37.9
7.2
8.0
34.4 44.2
16.1 18.6
36.9 44.2
56.6 37.6
129.1 139.0
14.0 18.1
32.3 41.7
26.1 14.4
13.0 16.1
55.2 50.0
24.9
90.7
64.1
50.3
10.5
23.7
27.0
43.7
115.2
4.9
42.8
11.0
54.9
26.5
55.0
42.7
156.2
29.9
68.3
22.9
18.0
61.4
Buy
Neutral
Buy
Buy
211
233
268
319
260
240
295
385
23
3
10
21
-0.5
20.3
12.0
11.0
1.8
22.9
13.3
14.3
7.1
23.2
14.1
14.5
Buy
Not Rated
Neutral
Buy
Not Rated
Not Rated
168
4,097
1,344
258
131
287
215
-
1,496
282
-
-
28
11
9
9.8
10.9
102.5 129.9
38.0 42.7
6.8
8.4
16.9
8.8
15.9
21.0
13.3
163.2
55.2
11.6
23.9
25.9
17.1
40.0
35.4
37.9
15.7
16.9
30.5
74.4
18.4
NM
Buy
Buy
Neutral
76
368
92
106
430
90
39
17
-2
1.0
20.0
-9.3
1.0
21.7
-2.9
2.4
25.4
0.1
20 November 2017
18

Company
Ent.Network
Hind. Media
HT Media
Jagran Prak.
Music Broadcast
PVR
Prime Focus
Siti Net.
Sun TV
Zee Ent.
Aggregate
Metals
Hindalco
Hind. Zinc
JSPL
JSW Steel
Nalco
NMDC
SAIL
Rain Industries
Vedanta
Tata Steel
Aggregate
Oil & Gas
BPCL
GAIL
Gujarat Gas
Gujarat St. Pet.
HPCL
IOC
IGL
MRPL
Oil India
ONGC
PLNG
Reliance Ind.
Aggregate
Retail
Jubilant Food
Titan Co.
Aggregate
Technology
Cyient
HCL Tech.
Hexaware
Infosys
KPIT Tech
L&T Infotech
Mindtree
Mphasis
NIIT Tech
Persistent Sys
Tata Elxsi
TCS
Tech Mah
Reco
Neutral
Buy
Neutral
Buy
Buy
Buy
Buy
Neutral
Buy
Buy
CMP
(INR)
791
240
96
162
365
1,408
99
25
842
536
TP
% Upside
(INR) Downside
910
15
302
26
113
17
225
39
469
29
1,640
16
130
31
27
8
1,005
19
630
18
FY17
11.4
25.8
7.4
10.7
6.4
20.5
1.2
-1.9
24.9
12.1
EPS (INR)
FY18E FY19E
11.6
20.1
25.6
30.2
10.4
11.9
11.3
13.4
9.0
14.2
27.1
43.0
3.1
6.1
-0.8
0.1
28.1
35.7
10.5
16.0
P/E (x)
P/B (x)
ROE (%)
FY17 FY18E FY17 FY18E FY17 FY18E FY19E
69.2
68.4 4.4
4.2
6.7
6.3
10.1
9.3
9.4
1.5
1.3
18.2 15.0 15.3
13.0
9.3
1.0
0.9
7.9
10.2 10.6
15.1
14.3 2.5
2.5
18.5 17.3 19.3
56.8
40.4 3.8
3.5
11.2
9.0
12.6
68.6
52.0 6.8
6.1
10.4 12.4 17.0
81.1
32.2 5.3
4.6
7.6
15.3 24.8
NM
NM
4.1
4.7 -29.4 -14.2
2.4
33.9
30.0 8.2
7.6
26.0 26.4 30.7
44.2
51.2 6.0
5.5
17.0 12.8 16.8
41.0
35.2 5.1
4.8
12.6 13.5 17.2
30.2
15.8
NM
18.0
22.0
12.5
NM
34.3
20.3
18.5
25.4
10.4
19.7
52.7
23.6
10.2
9.4
34.3
8.2
18.3
10.8
22.4
18.8
13.8
176.0
87.1
92.3
17.8
14.0
24.2
15.5
13.9
17.4
20.7
18.2
16.9
17.1
31.7
20.3
15.7
13.7
13.7
NM
13.1
17.5
9.4
NM
12.9
12.0
11.8
15.0
11.7
15.8
28.5
17.1
11.4
10.0
30.4
13.2
11.8
9.4
17.0
16.0
12.8
82.2
62.9
64.0
15.1
13.3
20.3
15.2
14.0
15.7
18.0
16.9
14.7
14.9
26.4
20.6
13.6
2.0
4.3
0.5
2.8
1.5
1.8
0.8
3.7
1.9
2.1
1.8
3.2
2.0
7.1
2.6
3.1
1.8
7.2
2.1
1.0
1.0
4.7
2.0
1.8
14.4
16.4
15.8
2.9
3.5
5.9
3.2
2.1
6.4
3.4
2.4
2.2
2.6
9.9
6.0
2.6
1.8
4.6
0.5
2.4
1.5
1.6
0.9
2.9
1.8
1.9
1.7
2.7
1.8
5.9
2.3
2.6
1.6
6.1
1.9
0.9
1.0
3.9
1.8
1.7
13.6
13.3
13.1
2.6
3.3
5.0
3.5
1.8
4.9
3.3
2.8
2.2
2.5
8.0
6.5
2.5
7.4
24.4
-7.9
17.3
7.2
12.8
-9.9
10.9
9.7
15.7
7.0
32.4
9.6
14.0
11.6
32.4
20.7
21.0
31.4
5.7
10.1
23.2
11.6
13.1
8.2
20.6
17.1
16.2
27.5
26.5
22.0
14.3
41.6
16.8
13.2
13.7
17.0
37.1
32.6
18.4
13.6
32.3
-4.7
19.8
8.6
15.7
-6.9
25.2
15.1
17.1
11.4
25.2
12.0
22.6
14.4
25.1
17.2
21.7
15.1
8.0
10.8
25.2
12.1
12.9
16.5
23.4
20.5
17.4
25.9
26.4
21.8
14.1
35.2
17.3
14.6
15.1
17.9
33.6
30.6
18.9
16.5
42.5
0.1
20.2
10.1
16.3
-4.9
29.7
23.8
16.6
15.3
25.8
12.6
27.3
14.0
25.0
16.9
20.4
16.7
10.4
12.5
23.7
12.0
13.5
20.9
25.5
23.9
18.3
25.6
23.4
22.5
14.5
29.6
20.4
17.3
16.4
20.8
32.4
33.5
18.2
Buy
Neutral
Buy
Buy
Neutral
Buy
Sell
Buy
Buy
Neutral
259
311
165
267
82
125
79
330
307
701
326
322
209
297
87
187
43
492
394
672
26
4
27
11
6
50
-45
49
28
-4
8.6
19.7
-20.9
14.8
3.7
10.0
-10.1
9.6
15.1
37.9
18.8
22.7
-15.1
20.3
4.7
13.3
-6.4
25.5
25.5
59.4
26.4
33.5
0.5
24.9
5.8
12.7
-4.3
38.9
44.4
65.2
Buy
Sell
Sell
Neutral
Buy
Buy
Neutral
Sell
Buy
Buy
Buy
Buy
504
445
846
208
415
395
302
122
353
178
255
910
643
378
721
184
579
554
301
110
418
231
312
1,077
27
-15
-15
-11
40
40
0
-10
18
30
22
18
48.3
22.6
16.1
8.8
40.7
41.9
8.8
14.8
19.3
16.4
11.4
48.3
43.1
28.1
29.7
12.1
36.4
39.5
9.9
9.2
29.8
19.0
15.0
56.7
52.1
31.9
44.1
13.2
42.8
43.6
11.0
11.5
40.5
22.8
16.7
62.1
Sell
Buy
1,761
786
1,270
850
-28
8
10.0
9.0
21.4
12.5
27.4
15.9
Buy
Neutral
Neutral
Buy
Neutral
Buy
Neutral
Neutral
Neutral
Buy
Buy
Neutral
Buy
544
840
331
971
166
964
515
709
641
646
893
2,710
485
600
970
270
1,100
160
950
480
670
600
780
1,004
2,450
560
10
16
-18
13
-4
-1
-7
-6
-6
21
12
-10
15
30.6 36.0
59.8 63.2
13.7 16.3
62.8 63.8
11.9 11.9
55.5 61.6
24.9 28.5
38.9 42.0
38.0 43.7
37.7 43.3
28.1 33.8
133.4 131.8
30.9 35.8
41.9
68.2
17.0
67.8
14.1
66.0
33.6
46.0
50.3
52.4
40.2
151.4
37.7
20 November 2017
19

Company
Reco
Wipro
Neutral
Zensar Tech
Buy
Aggregate
Telecom
Bharti Airtel
Buy
Bharti Infratel
Neutral
Idea Cellular
Buy
Tata Comm
Buy
Aggregate
Utiltites
Coal India
Buy
CESC
Buy
JSW Energy
Sell
NTPC
Buy
Power Grid
Buy
Tata Power
Sell
Aggregate
Others
Arvind
Neutral
Avenue
Sell
Supermarts
Bata India
Under Review
BSE
Neutral
Castrol India
Buy
Century Ply.
Neutral
Coromandel Intl Buy
Delta Corp
Buy
Dynamatic Tech Buy
Eveready Inds.
Buy
Interglobe
Neutral
Indo Count
Neutral
Info Edge
Buy
Inox Leisure
Sell
Jain Irrigation
Under Review
Just Dial
Neutral
Kaveri Seed
Buy
Kitex Garm.
Buy
Manpasand
Buy
MCX
Buy
Monsanto
Buy
Navneet Education Buy
Quess Corp
Buy
PI Inds.
Buy
Piramal Enterp.
Buy
SRF
Buy
S H Kelkar
Buy
Symphony
Sell
Team Lease Serv. Buy
Trident
Buy
TTK Prestige
Neutral
V-Guard
Neutral
Wonderla
Buy
CMP
(INR)
295
873
TP
% Upside
EPS (INR)
(INR) Downside FY17 FY18E FY19E
280
-5
16.9 19.1
20.1
1,020
17
52.1 52.8
72.7
P/E (x)
P/B (x)
ROE (%)
FY17 FY18E FY17 FY18E FY17 FY18E FY19E
17.4
15.4 2.8
2.7
16.9 17.0 16.7
16.8
16.5 2.7
2.4
17.2 15.3 18.4
18.0
17.8 4.1
4.3
22.9 24.4 23.2
43.6
25.6
NM
70.3
45.1
18.3
19.4
21.0
14.8
14.9
12.0
16.1
34.1
144.4
55.6
23.5
29.1
33.9
30.5
84.3
30.5
30.9
27.0
9.8
75.3
83.7
19.0
31.6
27.9
16.4
63.9
38.2
28.8
21.6
81.9
24.7
35.9
20.6
35.4
66.4
46.9
13.3
50.5
62.5
52.7
131.5 2.9
22.6 4.5
NM
1.4
129.1 12.6
-310.1 3.0
15.6
11.3
20.0
13.2
12.0
12.2
13.6
40.1
92.4
46.2
21.2
31.3
29.9
21.0
45.5
18.2
27.8
18.4
15.9
49.9
34.7
13.9
29.9
15.6
13.8
40.8
35.8
23.7
18.7
29.6
27.5
24.9
23.1
38.8
44.7
42.3
10.6
48.3
49.9
30.9
6.9
1.3
1.3
1.5
2.2
2.0
2.3
3.1
18.0
7.3
1.9
33.0
9.2
5.1
6.5
4.2
10.0
11.8
3.0
7.2
4.9
1.6
4.2
3.6
4.4
4.0
3.6
8.1
5.3
11.1
7.0
3.0
3.3
4.6
24.6
8.2
1.6
9.1
14.9
4.8
2.9
4.6
1.8
13.6
3.1
6.6
1.1
1.2
1.4
1.9
1.9
2.1
2.9
15.8
6.5
2.0
29.9
7.6
4.4
4.3
3.4
8.0
6.8
2.5
6.5
4.3
1.6
3.8
3.8
3.6
3.7
3.6
7.3
4.6
4.6
5.8
2.8
2.9
4.2
21.7
6.8
1.5
8.3
12.2
4.3
6.8
16.2
-1.6
48.4
6.6
37.8
6.5
6.3
10.5
15.6
17.1
14.4
10.3
17.9
2.2
20.2
-26.6
10.1
-1.0
42.4
10.6
6.3
11.0
17.0
16.0
15.7
7.4
18.2
3.7
22.8
-41.4
30.0
0.2
47.7
10.8
5.0
11.9
17.4
14.6
16.8
10.9
22.9
16.3
8.0
96.1
29.6
23.4
12.9
24.3
31.5
43.0
18.5
13.7
16.2
14.8
13.7
27.4
27.6
13.5
15.9
34.5
27.9
15.0
22.9
15.3
16.3
15.1
54.5
22.2
16.1
20.7
28.8
17.5
494
380
95
701
680
440
110
780
38
16
16
11
11.3
14.9
-1.1
10.0
3.8
16.8
-16.1
5.4
6.5
19.2
-18.0
18.2
273
1,005
81
177
209
89
335
1,360
51
211
261
72
23
35
-37
19
25
-19
14.9
51.9
3.8
12.0
14.0
7.4
17.5
88.9
4.0
13.4
17.4
7.3
20.7
99.3
3.3
15.7
20.4
7.5
422
1,108
751
962
396
294
507
258
2,060
398
1,165
128
1,180
279
106
552
532
305
405
948
2,486
158
819
824
2,605
1,773
256
1,570
1,821
88
6,663
223
369
425
873
-
1,100
467
323
523
257
3,334
400
1,291
128
1,300
240
-
465
738
394
492
1,300
3,295
209
1,040
890
3,266
1,992
301
1,288
2,300
114
5,281
167
393
1
-21
14
18
10
3
0
62
1
11
0
10
-14
-16
39
29
21
37
33
32
27
8
25
12
17
-18
26
30
-21
-25
7
12.4
7.7
13.5
41.0
13.6
8.7
16.6
3.1
67.6
12.9
43.2
13.0
15.7
3.3
5.5
17.5
19.1
18.6
6.3
24.8
86.2
7.3
10.0
33.4
72.6
85.9
7.2
23.7
38.8
6.6
132.1
3.6
7.0
10.5
12.0
16.3
45.3
12.6
9.8
24.1
5.7
112.9
14.3
63.2
8.0
23.6
8.0
7.6
18.5
34.1
22.1
9.9
26.5
105.0
8.4
27.7
29.9
104.6
76.7
6.6
35.1
43.0
8.3
137.8
4.5
11.9
16.5
17.5
20.1
46.1
13.3
12.9
29.0
8.0
166.7
17.4
75.4
10.7
26.2
12.0
10.0
21.1
41.0
26.2
15.4
43.4
126.6
10.4
29.1
35.6
149.7
104.9
9.7
42.9
66.4
10.4
176.1
6.0
16.0
13.9 14.9
8.3
9.3
115.0 100.3
31.1 27.7
17.5 22.5
8.1
12.1
15.1 20.7
37.7 32.1
51.0 46.8
34.8 17.0
10.2 13.7
5.9
12.5
8.6
11.7
14.8 13.4
13.6 23.3
29.8 28.6
7.3
8.4
10.2 10.0
31.5 32.5
26.7 26.3
19.0 21.9
32.8 23.0
9.0
11.7
16.6 13.2
13.7 11.3
43.3 51.6
19.2 17.6
13.0 14.5
19.5 18.0
27.4 26.9
9.5
14.8
20 November 2017
20

MOSL Universe stock performance
Company
Automobiles
Amara Raja
Ashok Ley.
Bajaj Auto
Bharat Forge
Bosch
CEAT
Eicher Mot.
Endurance Tech.
Escorts
Exide Ind
Hero Moto
M&M
Mahindra CIE
Maruti Suzuki
Tata Motors
TVS Motor
Banks - Private
Axis Bank
DCB Bank
Equitas Hold.
Federal Bank
HDFC Bank
ICICI Bank
IDFC Bank
IndusInd
J&K Bank
Kotak Mah. Bk
RBL Bank
South Indian
Yes Bank
Banks - PSU
BOB
BOI
Canara
IDBI Bk
Indian Bk
OBC
PNB
SBI
Union Bk
NBFCs
Aditya Birla Cap
Bajaj Fin.
Bharat Fin.
Capital First
Cholaman.Inv.&Fn
Dewan Hsg.
GRUH Fin.
HDFC
HDFC Stand. Life
Indiabulls Hsg
L&T Fin.Holdings
LIC Hsg Fin
Manappuram
M&M Fin.
1 Day (%)
0.8
1.4
0.1
-0.2
-1.5
0.2
0.5
0.7
0.1
1.6
-0.7
0.1
0.1
2.1
1.9
0.5
-0.1
2.8
1.8
0.3
1.2
1.9
1.5
1.7
0.2
0.7
0.8
0.5
1.6
0.6
0.2
1.1
0.3
0.1
-1.2
0.7
1.2
-1.7
-0.4
1.5
1.2
1.0
-1.8
1.9
0.6
2.2
18.7
0.9
1.8
3.7
-0.8
0.0
1M (%)
15.2
-9.6
-1.6
9.8
-13.7
2.2
-3.7
7.8
-4.5
-3.4
-4.1
3.1
2.0
6.3
-2.4
2.8
5.6
-2.9
-9.4
-10.6
-1.3
18.7
-4.2
-4.5
1.2
-5.1
-2.0
-4.8
-17.9
32.0
51.0
25.8
12.9
51.9
11.4
41.8
34.3
33.3
8.5
-4.3
-5.4
-8.7
12.8
7.7
-0.1
-3.3
-10.3
-7.8
-9.7
-0.3
1.1
12M (%)
-14.1
46.7
26.2
55.0
-0.4
44.9
45.7
118.2
132.2
13.1
26.3
16.2
33.9
69.1
-10.8
95.7
14.2
68.8
-9.8
53.9
48.6
33.6
-23.4
48.3
26.4
32.0
49.0
50.9
30.5
5.1
73.5
23.4
-15.1
67.1
4.9
29.2
21.5
14.0
Company
Bharat Elec.
BHEL
Blue Star
CG Cons. Elec.
CG Power & Inds Sol.
Cummins
GE T&D
Havells
K E C Intl
L&T
Pennar Eng.
Siemens
Solar Ind
Suzlon Energy
Thermax
Va Tech Wab.
Voltas
Cement
Ambuja Cem.
ACC
Birla Corp.
Dalmia Bharat
Grasim Inds.
India Cem
J K Cements
JK Lakshmi Ce
Ramco Cem
Orient Cem
Prism Cem
Shree Cem
Ultratech
Consumer
Asian Paints
Britannia
Colgate
Dabur
Emami
Godrej Cons.
GSK Cons.
HUL
ITC
Jyothy Lab
Marico
Nestle
Page Inds
Parag Milk
Pidilite Ind.
P&G Hygiene
Prabhat Dairy
United Brew
United Spirits
Healthcare
Alembic Phar
Alkem Lab
Ajanta Pharma
Aurobindo
1 Day (%)
-0.6
0.0
-0.5
0.6
3.2
0.2
3.5
1.9
-1.7
0.3
-2.5
1.3
2.5
2.2
-1.1
0.2
-0.6
-0.2
-1.2
0.2
2.0
1.4
2.5
1.3
-1.5
1.9
2.2
0.2
2.3
0.0
-0.8
0.0
0.2
-0.8
-0.5
1.4
-0.4
0.2
1.0
1.6
0.7
0.4
-2.5
-1.4
2.0
2.7
3.0
-1.4
2.5
-0.8
-0.1
4.0
-0.8
1M (%)
4.8
4.2
-12.9
14.8
4.8
-4.3
8.3
-7.1
-2.2
6.3
1.5
-2.6
17.2
-11.6
3.9
-8.8
13.4
-2.4
-1.5
12.0
13.5
3.7
-2.8
12.9
8.6
4.8
4.2
3.0
-1.6
4.6
-2.0
2.5
-0.3
5.3
11.8
-2.6
21.3
-0.1
-3.6
-13.5
-4.7
4.4
23.3
-12.5
3.7
5.4
2.8
33.3
27.9
3.0
7.7
6.1
-7.3
12M (%)
49.9
-1.5
51.6
60.8
14.6
9.4
20.9
54.9
112.7
33.6
-31.5
7.0
70.8
-5.3
21.1
12.2
101.7
41.3
35.5
67.9
100.6
71.4
57.3
45.4
18.5
30.8
24.2
36.9
35.5
28.2
27.5
61.4
12.3
21.7
17.7
34.7
20.7
57.4
10.8
-3.5
23.1
29.1
79.5
-11.1
35.5
39.3
55.4
29.6
69.0
-15.7
21.8
-29.2
-0.7
105.4
40.2
31.0
27.7
175.7
73.4
36.1
77.7
122.7
19.5
31.5
59.4
20 November 2017
21

Company
Muthoot Fin
PNB Housing
PFC
Repco Home
REC
STF
Shriram City Union
Capital Goods
ABB
1 Day (%)
-0.1
2.9
0.8
0.2
3.2
6.0
1.9
0.6
1M (%)
-8.4
-8.3
-1.5
-3.5
3.6
17.5
-4.7
2.3
12M (%)
45.1
69.5
4.7
10.6
24.1
54.0
12.4
30.7
Company
Biocon
Cadila
Cipla
Divis Lab
Dr Reddy’s
Fortis Health
Glenmark
1 Day (%)
2.9
0.8
2.6
1.3
-0.4
-0.8
0.5
1M (%)
2.3
-10.2
-3.6
15.3
-2.4
-13.1
-4.4
12M (%)
34.2
20.8
11.7
-12.6
-27.5
-19.4
-33.8
20 November 2017
22

MOSL Universe stock performance
Company
Granules
GSK Pharma
IPCA Labs
Jubilant Life
Lupin
Sanofi India
Shilpa Medicare
Strides Shasun
Sun Pharma
Syngene Intl
Torrent Pharma
Infrastructure
Ashoka Buildcon
IRB Infra.Devl.
KNR Construct.
Sadbhav Engg.
Logistics
Allcargo Logistics
Blue Dart
Concor
Gateway Distriparks
Gati
Transport Corp.
Media
Dish TV
D B Corp
Den Net.
Ent.Network
Hind. Media
HT Media
Jagran Prak.
Music Broadcast
PVR
Prime Focus
Siti Net.
Sun TV
Zee Ent.
Metals
Hindalco
Hind. Zinc
JSPL
JSW Steel
Nalco
NMDC
Rain Industries
SAIL
Vedanta
Tata Steel
Oil & Gas
BPCL
GAIL
Gujarat Gas
Gujarat St. Pet.
HPCL
IOC
IGL
1 Day (%)
1.4
-0.9
0.1
9.5
0.0
0.6
0.8
2.7
1.7
1.6
-0.9
4.2
1.4
2.6
1.4
1.8
3.2
1.4
2.8
9.8
5.6
-0.4
0.5
-1.4
1.8
-0.4
-1.0
-1.5
-1.4
1.3
0.2
-1.0
-0.3
-0.7
1.4
3.0
-0.5
3.0
0.7
0.7
-5.0
1.9
1.8
2.1
1.1
-0.7
-1.1
0.2
0.6
0.7
0.8
1M (%)
-13.7
2.8
6.8
5.3
-22.2
6.5
-5.4
-10.6
-5.5
4.1
-5.3
13.9
12.1
24.5
14.0
2.3
-1.1
0.4
7.5
13.0
0.6
5.8
-0.1
9.3
0.3
-2.0
-6.0
-6.3
-5.4
1.5
-7.3
1.4
3.2
8.2
-6.3
-4.9
1.8
2.6
-7.9
1.0
51.8
33.1
-8.1
-1.6
-1.7
1.7
-7.8
5.0
-11.8
-4.6
0.6
12M (%)
19.8
-6.5
-0.7
12.0
-41.3
7.2
12.5
-23.3
-22.9
-2.0
-0.2
40.0
23.8
79.6
14.0
-1.2
-11.7
33.8
9.6
9.3
65.8
-16.4
-2.1
25.7
12.4
-11.6
31.8
-7.4
22.6
41.4
-28.0
75.9
16.5
53.7
23.9
142.4
60.9
64.7
6.6
620.0
57.7
43.5
78.5
19.0
36.3
63.3
38.1
40.3
34.6
79.5
Company
Titan Co.
Technology
Cyient
HCL Tech.
Hexaware
Infosys
KPIT Tech
L&T Infotech
Mindtree
Mphasis
NIIT Tech
Persistent Sys
Tata Elxsi
TCS
Tech Mah
Wipro
Zensar Tech
Telecom
Bharti Airtel
Bharti Infratel
Idea Cellular
Tata Comm
Utiltites
Coal India
CESC
JSW Energy
NTPC
Power Grid
Tata Power
Others
Arvind
Avenue Super.
Bata India
BSE
Castrol India
Century Ply.
Coromandel Intl
Delta Corp
Dynamatic Tech
Eveready Inds.
Interglobe
Indo Count
Info Edge
Inox Leisure
Jain Irrigation
Just Dial
Kaveri Seed
Kitex Garm.
Manpasand
MCX
Monsanto
Navneet Educat.
PI Inds.
Piramal Enterp.
Quess Corp
SRF
1 Day (%)
2.0
-1.0
-1.3
-1.5
-1.8
-1.3
0.8
0.9
-0.3
0.4
0.5
-0.3
-1.3
-2.7
-1.0
-0.2
0.7
-1.2
-0.7
1.0
1.5
0.3
0.1
0.4
0.0
5.0
-0.2
-0.4
1.2
-0.6
0.5
0.2
-1.7
-0.7
1.9
7.0
0.0
2.9
0.8
2.0
-0.1
5.3
2.9
1.2
-0.4
1.8
0.1
2.0
-1.3
1.1
0.4
1.8
1M (%)
25.8
-1.6
-8.8
17.9
4.2
28.9
19.2
2.3
8.3
1.1
-1.5
5.3
4.4
2.8
1.8
14.9
5.9
-20.5
5.8
-3.3
-5.9
-3.2
-2.0
0.9
1.8
9.0
8.5
-9.1
-4.4
-1.1
4.5
4.7
5.4
15.3
-1.8
20.2
5.1
11.8
6.0
20.1
10.8
34.2
-6.5
40.5
-9.5
-16.0
1.4
-7.1
4.3
-5.8
-0.9
3.2
12M (%)
148.8
16.0
10.5
72.4
4.5
28.7
58.6
16.7
43.4
59.2
6.4
67.1
26.5
10.0
34.1
-11.1
66.5
6.0
36.0
16.3
-10.9
69.6
41.4
17.0
8.1
27.0
22.4
76.3
-1.1
65.4
110.5
129.4
-30.3
73.7
35.7
-9.4
35.1
19.2
19.4
39.4
39.8
11.0
19.3
-27.5
10.0
46.8
2.2
82.8
37.8
21.3
20 November 2017
23

Company
MRPL
Oil India
ONGC
PLNG
Reliance Ind.
Retail
Jubilant Food
1 Day (%)
0.7
1.0
-1.0
1.0
0.8
-0.7
1M (%)
-5.5
2.3
3.7
-2.1
4.1
11.4
12M (%)
40.4
15.4
-2.5
46.8
85.4
97.1
Company
S H Kelkar
Symphony
Team Lease Serv.
Trident
TTK Prestige
V-Guard
Wonderla
1 Day (%)
0.2
0.6
-1.5
0.7
-0.4
0.2
0.5
1M (%)
-7.9
9.6
15.8
-13.3
8.9
18.7
0.6
12M (%)
-11.3
31.2
107.7
73.0
26.9
75.1
9.0
20 November 2017
24

THEMATIC/STRATEGY RESEARCH GALLERY

REPORT GALLERY
RECENT INITIATING COVERAGE REPORTS
Rs

DIFFERENTIATED PRODUCT GALLERY

Disclosures:
The following Disclosures are being made in compliance with the SEBI Research Analyst Regulations 2014 (herein after referred to as the Regulations).
Motilal Oswal Securities Ltd. (MOSL) is a SEBI Registered Research Analyst having registration no. INH000000412. MOSL, the Research Entity (RE) as defined in the Regulations, is engaged in the business of providing Stock
broking services, Investment Advisory Services, Depository participant services & distribution of various financial products. MOSL is a subsidiary company of Motilal Oswal Financial Service Ltd. (MOFSL). MOFSL is a listed
public company, the details in respect of which are available on
www.motilaloswal.com.
MOSL is registered with the Securities & Exchange Board of India (SEBI) and is a registered Trading Member with National Stock
Exchange of India Ltd. (NSE) and Bombay Stock Exchange Limited (BSE), Metropolitan Stock Exchange Of India Ltd. (MSE) for its stock broking activities & is Depository participant with Central Depository Services Limited
(CDSL) & National Securities Depository Limited (NSDL) and is member of Association of Mutual Funds of India (AMFI) for distribution of financial products. Details of associate entities of Motilal Oswal Securities Limited are
available on the website at
http://onlinereports.motilaloswal.com/Dormant/documents/Associate%20Details.pdf
Pending Regulatory Enquiries against Motilal Oswal Securities Limited by SEBI:
SEBI pursuant to a complaint from client Shri C.R. Mohanraj alleging unauthorized trading, issued a letter dated 29th April 2014 to MOSL notifying appointment of an Adjudicating Officer as per SEBI regulations to hold
inquiry and adjudge violation of SEBI Regulations; MOSL requested SEBI to provide all documents, records, investigation report relied upon by SEBI which were referred in Show Cause Notice and also sought personal
hearing. The matter is currently pending.
MOSL, it’s associates, Research Analyst or their relative may have any financial interest in the subject company. MOSL and/or its associates and/or Research Analyst may have beneficial ownership of 1% or more securities in
the subject company at the end of the month immediately preceding the date of publication of the Research Report.
MOSL and its associate company(ies), their directors and Research Analyst and their relatives may; (a) from
time to time, have a long or short position in, act as principal in, and buy or sell the securities or derivatives thereof of companies mentioned herein. (b) be engaged in any other transaction involving such securities and earn
brokerage or other compensation or act as a market maker in the financial instruments of the company(ies) discussed herein or act as an advisor or lender/borrower to such company(ies) or may have any other potential
conflict of interests with respect to any recommendation and other related information and opinions.; however the same shall have no bearing whatsoever on the specific recommendations made by the analyst(s), as the
recommendations made by the analyst(s) are completely independent of the views of the associates of MOSL even though there might exist an inherent conflict of interest in some of the stocks mentioned in the research
report.
Research Analyst may have served as director/officer, etc. in the subject company in the last 12 month period. MOSL and/or its associates may have received any compensation from the subject company in the past
12 months.
In the last 12 months period ending on the last day of the month immediately preceding the date of publication of this research report, MOSL or any of its associates may have:
managed or co-managed public offering of securities from subject company of this research report,
received compensation for investment banking or merchant banking or brokerage services from subject company of this research report,
received compensation for products or services other than investment banking or merchant banking or brokerage services from the subject company of this research report.
Subject Company may have been a client of MOSL or its associates during twelve months preceding the date of distribution of the research report.
MOSL and it’s associates have not received any compensation or other benefits from the subject company or third party in connection with the research report. To enhance transparency, MOSL has incorporated a Disclosure
of Interest Statement in this document. This should, however, not be treated as endorsement of the views expressed in the report. MOSL and / or its affiliates do and seek to do business including investment banking with
companies covered in its research reports. As a result, the recipients of this report should be aware that MOSL may have a potential conflict of interest that may affect the objectivity of this report. Compensation of Research
Analysts is not based on any specific merchant banking, investment banking or brokerage service transactions.
Terms & Conditions:
This report has been prepared by MOSL and is meant for sole use by the recipient and not for circulation. The report and information contained herein is strictly confidential and may not be altered in any way, transmitted to,
copied or distributed, in part or in whole, to any other person or to the media or reproduced in any form, without prior written consent of MOSL. The report is based on the facts, figures and information that are considered
true, correct, reliable and accurate. The intent of this report is not recommendatory in nature. The information is obtained from publicly available media or other sources believed to be reliable. Such information has not
been independently verified and no guaranty, representation of warranty, express or implied, is made as to its accuracy, completeness or correctness. All such information and opinions are subject to change without notice.
The report is prepared solely for informational purpose and does not constitute an offer document or solicitation of offer to buy or sell or subscribe for securities or other financial instruments for the clients. Though
disseminated to all the customers simultaneously, not all customers may receive this report at the same time. MOSL will not treat recipients as customers by virtue of their receiving this report.
Analyst Certification
The views expressed in this research report accurately reflect the personal views of the analyst(s) about the subject securities or issues, and no part of the compensation of the research analyst(s) was, is, or will be directly or
indirectly related to the specific recommendations and views expressed by research analyst(s) in this report.
Disclosure of Interest Statement
Analyst ownership of the stock
Companies where there is interest
No
A graph of daily closing prices of securities is available at
www.nseindia.com, www.bseindia.com.
Research Analyst views on Subject Company may vary based on Fundamental research and Technical Research. Proprietary
trading desk of MOSL or its associates maintains arm’s length distance with Research Team as all the activities are segregated from MOSL research activity and therefore it can have an independent view with regards to
subject company for which Research Team have expressed their views.
Regional Disclosures (outside India)
This report is not directed or intended for distribution to or use by any person or entity resident in a state, country or any jurisdiction, where such distribution, publication, availability or use would be contrary to law,
regulation or which would subject MOSL & its group companies to registration or licensing requirements within such jurisdictions.
For Hong Kong:
This report is distributed in Hong Kong by Motilal Oswal capital Markets (Hong Kong) Private Limited, a licensed corporation (CE AYY-301) licensed and regulated by the Hong Kong Securities and Futures Commission (SFC)
pursuant to the Securities and Futures Ordinance (Chapter 571 of the Laws of Hong Kong) “SFO”. As per SEBI (Research Analyst Regulations) 2014 Motilal Oswal Securities (SEBI Reg No. INH000000412) has an agreement with
Motilal Oswal capital Markets (Hong Kong) Private Limited for distribution of research report in Hong Kong. This report is intended for distribution only to “Professional Investors” as defined in Part I of Schedule 1 to SFO. Any
investment or investment activity to which this document relates is only available to professional investor and will be engaged only with professional investors.” Nothing here is an offer or solicitation of these securities,
products and services in any jurisdiction where their offer or sale is not qualified or exempt from registration. The Indian Analyst(s) who compile this report is/are not located in Hong Kong & are not conducting Research
Analysis in Hong Kong.
For U.S.
Motilal Oswal Securities Limited (MOSL) is not a registered broker - dealer under the U.S. Securities Exchange Act of 1934, as amended (the"1934 act") and under applicable state laws in the United States. In addition MOSL is
not a registered investment adviser under the U.S. Investment Advisers Act of 1940, as amended (the "Advisers Act" and together with the 1934 Act, the "Acts), and under applicable state laws in the United States.
Accordingly, in the absence of specific exemption under the Acts, any brokerage and investment services provided by MOSL, including the products and services described herein are not available to or intended for U.S.
persons. This report is intended for distribution only to "Major Institutional Investors" as defined by Rule 15a-6(b)(4) of the Exchange Act and interpretations thereof by SEC (henceforth referred to as "major institutional
investors"). This document must not be acted on or relied on by persons who are not major institutional investors. Any investment or investment activity to which this document relates is only available to major institutional
investors and will be engaged in only with major institutional investors. In reliance on the exemption from registration provided by Rule 15a-6 of the U.S. Securities Exchange Act of 1934, as amended (the "Exchange Act") and
interpretations thereof by the U.S. Securities and Exchange Commission ("SEC") in order to conduct business with Institutional Investors based in the U.S., MOSL has entered into a chaperoning agreement with a U.S.
registered broker-dealer, Motilal Oswal Securities International Private Limited. ("MOSIPL"). Any business interaction pursuant to this report will have to be executed within the provisions of this chaperoning agreement.
The Research Analysts contributing to the report may not be registered /qualified as research analyst with FINRA. Such research analyst may not be associated persons of the U.S. registered broker-dealer, MOSIPL, and
therefore, may not be subject to NASD rule 2711 and NYSE Rule 472 restrictions on communication with a subject company, public appearances and trading securities held by a research analyst account.
For Singapore
Motilal Oswal Capital Markets Singapore Pte Limited is acting as an exempt financial advisor under section 23(1)(f) of the Financial Advisers Act(FAA) read with regulation 17(1)(d) of the Financial Advisors Regulations and is a
subsidiary of Motilal Oswal Securities Limited in India. This research is distributed in Singapore by Motilal Oswal Capital Markets Singapore Pte Limited and it is only directed in Singapore to accredited investors, as defined in
the Financial Advisers Regulations and the Securities and Futures Act (Chapter 289), as amended from time to time. In respect of any matter arising from or in connection with the research you could contact the following
representatives of Motilal Oswal Capital Markets Singapore Pte Limited:
Disclaimer:
The report and information contained herein is strictly confidential and meant solely for the selected recipient and may not be altered in any way, transmitted to, copied or distributed, in part or in whole, to any other person
or to the media or reproduced in any form, without prior written consent. This report and information herein is solely for informational purpose and may not be used or considered as an offer document or solicitation of
offer to buy or sell or subscribe for securities or other financial instruments. Nothing in this report constitutes investment, legal, accounting and tax advice or a representation that any investment or strategy is suitable or
appropriate to your specific circumstances. The securities discussed and opinions expressed in this report may not be suitable for all investors, who must make their own investment decisions, based on their own investment
objectives, financial positions and needs of specific recipient. This may not be taken in substitution for the exercise of independent judgment by any recipient. Each recipient of this document should make such investigations
as it deems necessary to arrive at an independent evaluation of an investment in the securities of companies referred to in this document (including the merits and risks involved), and should consult its own advisors to
determine the merits and risks of such an investment. The investment discussed or views expressed may not be suitable for all investors. Certain transactions -including those involving futures, options, another derivative
products as well as non-investment grade securities - involve substantial risk and are not suitable for all investors. No representation or warranty, express or implied, is made as to the accuracy, completeness or fairness of
the information and opinions contained in this document. The Disclosures of Interest Statement incorporated in this document is provided solely to enhance the transparency and should not be treated as endorsement of the
views expressed in the report. This information is subject to change without any prior notice. The Company reserves the right to make modifications and alternations to this statement as may be required from time to time
without any prior approval. MOSL, its associates, their directors and the employees may from time to time, effect or have effected an own account transaction in, or deal as principal or agent in or for the securities
mentioned in this document. They may perform or seek to perform investment banking or other services for, or solicit investment banking or other business from, any company referred to in this report. Each of these entities
functions as a separate, distinct and independent of each other. The recipient should take this into account before interpreting the document. This report has been prepared on the basis of information that is already
available in publicly accessible media or developed through analysis of MOSL. The views expressed are those of the analyst, and the Company may or may not subscribe to all the views expressed therein. This document is
being supplied to you solely for your information and may not be reproduced, redistributed or passed on, directly or indirectly, to any other person or published, copied, in whole or in part, for any purpose. This report is not
directed or intended for distribution to, or use by, any person or entity who is a citizen or resident of or located in any locality, state, country or other jurisdiction, where such distribution, publication, availability or use would
be contrary to law, regulation or which would subject MOSL to any registration or licensing requirement within such jurisdiction. The securities described herein may or may not be eligible for sale in all jurisdictions or to
certain category of investors. Persons in whose possession this document may come are required to inform themselves of and to observe such restriction. Neither the Firm, not its directors, employees, agents or
representatives shall be liable for any damages whether direct or indirect, incidental, special or consequential including lost revenue or lost profits that may arise from or in connection with the use of the information.
The
person accessing this information specifically agrees to exempt MOSL or any of its affiliates or employees from, any and all responsibility/liability arising from such misuse and agrees not to hold MOSL or any of its affiliates or
employees responsible for any such misuse and further agrees to hold MOSL or any of its affiliates or employees free and harmless from all losses, costs, damages, expenses that may be suffered by the person accessing this
information due to any errors and delays.
Registered Office Address: Motilal Oswal Tower, Rahimtullah Sayani Road, Opposite Parel ST Depot, Prabhadevi, Mumbai-400025; Tel No.: 022-3980 4263; www.motilaloswal.com. Correspondence Address: Palm Spring
Centre, 2nd Floor, Palm Court Complex, New Link Road, Malad (West), Mumbai- 400 064. Tel No: 022 3080 1000. Compliance Officer: Neeraj Agarwal, Email Id:
na@motilaloswal.com,
Contact No.:022-30801085.
Registration details of group entities.: MOSL: NSE (Cash): INB231041238; NSE (F&O): INF231041238; NSE (CD): INE231041238; BSE (Cash): INB011041257; BSE(F&O): INF011041257; BSE(CD); MSE(Cash): INB261041231;
MSE(F&O): INF261041231; MSE(CD): INE261041231; CDSL: IN-DP-16-2015; NSDL: IN-DP-NSDL-152-2000; Research Analyst: INH000000412. AMFI: ARN 17397. Investment Adviser: INA000007100. Motilal Oswal Asset
Management Company Ltd. (MOAMC): PMS (Registration No.: INP000000670) offers PMS and Mutual Funds products. Motilal Oswal Wealth Management Ltd. (MOWML): PMS (Registration No.: INP000004409) offers wealth
management solutions. *Motilal Oswal Securities Ltd. is a distributor of Mutual Funds, PMS, Fixed Deposit, Bond, NCDs, Insurance and IPO products. * Motilal Oswal Commodities Broker Pvt. Ltd. offers Commodities
Products. * Motilal Oswal Real Estate Investment Advisors II Pvt. Ltd. offers Real Estate products. * Motilal Oswal Private Equity Investment Advisors Pvt. Ltd. offers Private Equity products
13 December 2016
27