24 November 2017
Market snapshot
Equities - India
Close
Chg .%
Sensex
33,588
0.1
Nifty-50
10,349
0.1
Nifty-M 100
19,884
0.3
Equities-Global
Close
Chg .%
S&P 500
2,597
0.0
Nasdaq
6,867
0.0
FTSE 100
7,417
0.0
DAX
13,009
0.0
Hang Seng
11,737
-1.9
Nikkei 225
22,523
0.0
Commodities
Close
Chg .%
Brent (US$/Bbl)
63
0.2
Gold ($/OZ)
1,291
-0.1
Cu (US$/MT)
6,937
0.2
Almn (US$/MT)
2,097
0.4
Currency
Close
Chg .%
USD/INR
64.6
-0.5
USD/EUR
1.2
0.2
USD/JPY
111.2
0.0
YIELD (%)
Close
1MChg
10 Yrs G-Sec
7.0
0.0
10 Yrs AAA Corp
7.8
0.0
Flows (USD b)
23-Nov
MTD
FIIs
0.0
2.3
DIIs
0.0
1.1
Volumes (INRb)
23-Nov
MTD*
Cash
341
394
F&O
11,340
6,813
Note: YTD is calendar year, *Avg
YTD.%
26.1
26.4
38.6
YTD.%
16.0
27.6
3.8
13.3
24.9
17.8
YTD.%
14.2
12.1
25.6
23.1
YTD.%
-4.9
12.7
-4.9
YTDchg
0.5
0.2
YTD
7.8
12.5
YTD*
306
5,630
Today’s top research idea
Bajaj Auto: Back on recovery path
Volume growth coupled with improving mix to drive margin expansion
Domestic 3W:
Strong medium-term visibility as regulatory changes in key
states (where BJAUT enjoys over 90% share) are opening-up incremental
opportunity of ~142k passenger 3W (v/s 240k sales in FY17).
Exports:
Stability in key markets, ramp-up in new markets drive recovery,
exports grew by 9.4% YTDFY18, avg. volumes of 135.3k/month (v/s avg
117.6k/month in FY17).
Domestic motorcycle:
Recovery driven by plugging portfolio gaps, recent
launch of ES variants in Economy and Pulsar 160NS in Premium.
KTM/Husqvarna contract manufacturing volumes could multiply by 3x in a few
years, Triumph would enable entry in mid-capacity cruiser segment (250-
750cc).
Improvement in market/ product mix could lead to EBITDA margin expansion of
~340bp to 22% by FY19 (v/s est. of 20.6%).
Broad-based recovery to drive ~16% EPS CAGR over FY17-20.
Buy
with TP of
~INR4,197.
Research covered
Cos/Sector
Bajaj Auto
Bata India
Monsanto India
Key Highlights
Back on recovery path
Premiumization to support margin expansion
Results below estimates
Piping hot news
President clears stricter version of Insolvency and Bankruptcy Code
President Ram Nath Kovind gave his assent to an ordinance amending the
Insolvency and Bankruptcy Code (IBC) on Thursday, barring errant promoters
of defaulting companies from regaining control of their assets being sold
under the bankruptcy process…
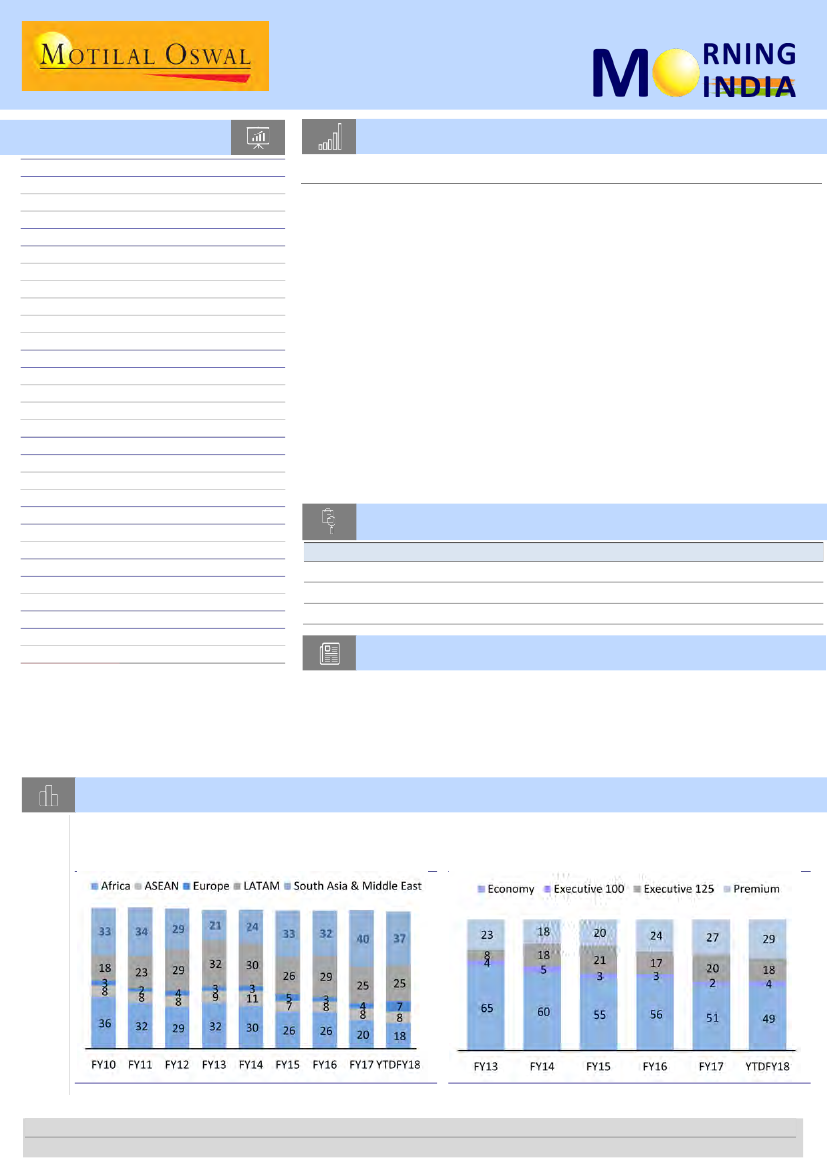
Chart of the Day: Bajaj Auto – Back on recovery path
Africa’s contribution to motorcycle exports from India
reduces significantly over the years, as LATAM and
SA/ME share increases
Export mix shifts in favor of premium products
Research Team (Gautam.Duggad@MotilalOswal.com)
Motilal Oswal research is available on www.motilaloswal.com/Institutional-Equities, Bloomberg, Thomson Reuters, Factset and S&P Capital.
Investors are advised to refer through important disclosures made at the last page of the Research Report.

In the news today
Kindly click on textbox for the detailed news link
1
After Moody’s, will Standard
and Poor’s raise India’s rating?
Decision today
Global rating agency Standard &
Poor’s (S&P) will announce the
outcome of its sovereign rating
review for India on Friday, exactly
a week after Moody’s raised its
rating for the country by a notch to
Baa2 from the lowest investment-
grade ranking of Baa3…
2
Despite efforts by the RBI to keep them down, India’s benchmark bond
yields on Thursday yet again spiked above the psychological 7 per cent
mark. Stock market traders are keenly watching bond yields to take any
further call. On Monday the RBI cancelled its open market operations
(OMO) of selling bonds worth ₹10,000 crore after yields touched a 14-
month high of 7.06 per cent last week post Moody’s upgrade of the
country’s sovereign credit rating. The yields crashed to 6.88 per cent after
the RBI move but the euphoria was short-lived. By Thursday, the bond
yield rose 2.03 per cent in just three trading sessions to touch a high of
7.02 per cent…
At 7%, bond yield puts market on edge
3
US oil prices near 2-year high
on pipeline shutdown, falling
inventories
US oil prices remained near two-
year highs on Thursday as the
shutdown of the Keystone
pipeline and a drawdown in fuel
inventories pointed to a tightening
market, despite rising output. US
West Texas Intermediate (WTI)
crude futures were at $57.95 a
barrel at 0143 GMT,…
4
To ensure that the transfer of
State-owned oil major HPCL’s
promoter stake does not attract
any anti-competitive norms, the
government has exempted the
merger of oil and gas PSUs from
the purview of competition
watchdog CCI…
Oil, gas PSU mergers exempt
from CCI approval
5
The Tata Nano is soon to be
launched in an electric avatar
sporting a new label Neo. Some
see this is as the first move
towards phasing out the brand
Nano, which has failed to excite
the Indian car buyer nearly a
decade after its launch. As for the
new avatar of the Nano, Tata
Motors, its originator, has little
role to play in it. Tata Motors will
supply the body shells of the Nano
and Coimbatore-based Jayem
Automotives will add the
powertrain and electric motor for
the Neo. Sources said the first 400
Neos were being made for a
leading taxi aggregator and would
be handed over to the company
shortly …
2
Tata Motors ties up with
Jayem Auto to launch electric
car Neo
6
Govt imposes $850/tonne MEP
on onion to boost local
supplies
The government today imposed a
minimum export price (MEP) of
$850 per tonne on onion to
increase domestic supplies and
check rising prices. MEP is the
minimum rate below which
exports are not allowed. Onion
MEP was scrapped in December
2015…
7
Star Health Insurance stake
sale draws interest from
PremjiInvest, Temasek, 10
others
Star Health and Allied Insurance
Co. Ltd has received as many as 12
bids from interested parties,
including financial as well as
strategic investors, to acquire the
business from private equity
investors, two people aware of
the development said…
24 November 2017

Update | Sector: Automobiles
Bajaj Auto
BSE Sensex
33,478
S&P CNX
10,327
CMP: INR3,262
TP: INR4,197(+29%)
Buy
Back on recovery path
Stock Info
Bloomberg
Equity Shares (m)
52-Week Range (INR)
1, 6, 12 Rel. Per (%)
M.Cap. (INR b)
M.Cap. (USD b)
Avg Val, INRm
Free float (%)
Volume growth coupled with improving mix to drive margin expansion
BJAUT IN
289
3344 / 2555
-2/8/-3
943.9
14.5
826.4
50.7
Regulatory changes driving medium-term visibility in three-wheelers
Regulatory changes in key states where BJAUT enjoys over 90% share are
opening up an incremental opportunity of ~142k passenger 3Ws (v/s sales
of 240k in FY17).
Average monthly volumes in FY18YTD have improved to ~24.7k (v/s
~21.1k/month in FY17). Strong domestic demand coupled with recovery in
3W exports is leading to capacity constraints for BJAUT in the 3W business.
Plugging portfolio gaps leading to recovery in domestic motorcycle volumes
With over 60% of economy segment customers preferring electric start (ES),
the recent launch of ES variants has led to recovery in this segment. Average
volumes have improved to ~82.9k/month in FY18YTD v/s ~69.7k in FY17.
Also, there are initial signs of recovery in the premium segment with
Pulsar
160 NS,
though sustenance of these volumes is key.
BJAUT is addressing product issues in V series, and launching new variants in
Avenger
and a new brand in the 125cc commuter segment by 4QFY18.
Stability in key markets, ramp-up in new markets driving revival in exports
Motorcycle exports to Nigeria have rebound to 23k-26k in the last two
months from recent lows of 8k (in April 2017). Increasing share of new/
nascent markets, which now constitute 16% of exports, would dilute
dependency on Africa and improve export mix.
Exports have grown 9.4% in FY18YTD, with average monthly volumes at
135.3k (v/s 117.6k in FY17). Recovery is visible in both 2Ws (+8.3%) and 3Ws
(+15.4%). We estimate ~14% exports CAGR over the next three years.
Exciting opportunity from KTM, Husqvarna, Triumph alliance
Husqvarna leveraging on Bajaj-KTM alliance for global market could multiply
KTM/Husqvarna contract manufacturing volumes by 3x in a few years.
Partnership with Triumph would enable BJAUT to enter the mid-capacity
cruiser segment (250-750cc), which is ~1.5m motorcycles annually.
With the KTM-Husqvarna-Triumph alliance, BJAUT would further strengthen
its foothold in the domestic premium segment and substantially improve
the competitive position of these brands in global markets.
Improvement in market/ product mix could lead to EBITDA margin expansion
of ~340bp by FY19 to 22% against our estimate 20.6%.
Valuation and view:
Valuations at 17.4x FY19E and 15x FY20E consolidated EPS
are attractive. We shift our valuation methodology from SOTP-based to valuing
at consolidated earnings while maintaining our earnings estimates. We value
BJAUT at INR4,197 (20x December 2019E consolidated EPS). Maintain
Buy.
Financial Snapshot (INR b)
Y/E Mar
2018E 2019E 2020E
Sales
246
282
322
EBITDA
46.6 58.0 67.2
Consol NP
45.0 54.4 62.8
Cons. EPS (INR)
155
188
217
EPS Gr. (%)
10.2 20.9 15.6
BV/Sh. (INR)
656
743
847
RoE (%)
25.0 26.8 27.3
RoCE (%)
22.7 24.6 34.5
P/E (x)
21.0 17.4 15.0
P/BV (x)
5.0
4.4
3.9
Shareholding pattern (%)
As On
Sep-17 Jun-17 Sep-16
Promoter
49.3
49.3
49.3
DII
9.1
8.3
8.2
FII
17
17.5
17.8
Others
24.7
24.9
24.7
FII Includes depository receipts
Stock Performance (1-year)
24 November 2017
3

23 November 2017
Update
| Sector:
Consumer
Bata India
BSE Sensex
33,478
S&P CNX
10,327
CMP: INR748
TP: INR578(-23%)
Downgrade to Sell
Premiumization to support margin expansion
Stock Info
Bloomberg
Equity Shares (m)
52-Week Range (INR)
1, 6, 12 Rel. Per (%)
M.Cap. (INR b)
M.Cap. (USD b)
Avg Val, INRm
Free float (%)
However, SSS growth muted; downgrade to Sell on rich valuations
BATA IN
129
833 / 400
-9/33/49
100.7
1.5
381
47.0
Financials Snapshot (INR b)
2017 2018E 2019E
Y/E Mar
Net Sales
24.7
26.4
29.3
EBITDA
2.8
3.2
3.8
PAT
1.7
2.0
2.5
EPS (INR)
13.5
15.9
19.3
Gr. (%)
6.8
17.8
21.0
BV/Sh (INR)
103.0 115.3 130.4
RoE (%)
13.9
14.6
15.7
RoCE (%)
14.1
14.7
15.8
P/E (x)
55.4
47.1
38.9
P/BV (x)
7.3
6.5
5.7
Shareholding pattern (%)
Sep-17 Jun-17 Sep-16
As On
Promoter
53.0
53.0
53.0
DII
22.8
24.7
21.8
FII
8.7
6.0
5.8
Others
15.6
16.4
19.5
FII Includes depository receipts
Stock Performance (1-year)
Bata India
Sensex - Rebased
850
700
550
400
Hiccups in wholesale business
:
The transition to GST has had an industry-wide
impact, with destocking at the wholesale level. BATA too witnessed subdued
offtake in 1HFY18 on account of non-compliant wholesalers, which resulted in
a ~12% YoY decline in wholesale business in 1HFY18. However, the retail
business grew ~9% YoY and since retail contributes over 80% of overall
revenue, BATA managed to post an overall growth of 6% YoY in 1HFY18.
Growth was also aided by an early festive season. With GST netted off from the
topline, we expect similar growth of 6% YoY in 2HFY18.
Betting high on premiumization of products
:
Lately, BATA’s focus has been on
premiumizing its products, with new launches in its AW17 collection (Hush
Puppies, Naturalizer, European Collection, Power International Range, North
Star). It has also forayed into collections of casual, daily-wear, sports and
outdoor sub-categories for the 10-14 year age group. The intent is to expand
average realization through premiumization and increase the revenue
contribution of premium products from 30% to ~45% in FY18. However, with
subdued growth in 1HFY18, we expect the ramping up of premium products’
contribution to get pushed to FY19, with marginal margin expansion of ~70bp
in FY18 to 12% and 100bp thereafter to 13% in FY19.
Going aggressive on store expansion
:
BATA has opened 50 franchisee stores
so far in FY18 and expects to open another 300 in the next three years
primarily in tier-II and tier-III cities. It also has aggressive plans to expand its
retail base by opening ~100 new
Bata
stores in FY18 – it has already opened 29
new stores in 2QFY18 and 67 stores in 1HFY18, and is well on track to achieve
its annual target. However, the company has been underperforming on same-
store sales (SSS) growth – in 2QFY18, it posted SSS growth of ~4%, pulling down
the SSS growth for 1HFY18 to ~6%.
Valuation and view
:
Considering subdued revenue growth in 1HFY18, we cut
our revenue estimates by 4% for FY18 and by 6% for FY19. We keep our
earnings estimates unchanged. We expect revenue CAGR of 9% and PAT CAGR
of 19% over FY17-19. The stock trades at 47x FY18E and 39x FY19E EPS; we
believe price largely captures the valuation. Our target price of INR578 (30x
FY19E EPS) implies 23% downside. We hence
downgrade to Sell
on rich
valuations.
24 November 2017
4

RESULTS
FLASH
BSE Sensex
33,478
S&P CNX
10,327
Monsanto India
Buy
23 November 2017
Update | Sector: Agriculture
CMP: INR2,495
TP: INR3,293(+32%)
Results below estimates
We will revisit our estimates
post earnings call/management
interaction.
Financials & Valuations (INR b)
2017 2018E 2019E
Y/E Mar
Sales
6.4
7.3
8.4
EBITDA
1.6
1.9
2.2
NP
1.5
1.8
2.2
EPS (INR)
86.2 105.0 126.6
EPS Gr. (%)
43.3
21.9
20.6
BV/Sh (INR)
306.8 339.7 394.1
RoE (%)
31.5
32.5
34.5
RoCE (%)
31.8
32.5
34.5
Payout (%)
84.5
68.8
57.0
Valuations
P/E (x)
29.0
23.8
19.7
P/BV (x)
8.1
7.3
6.3
EV/EBITDA (x)
27.4
22.9
18.8
Div Yield (%)
2.4
2.4
2.4
MCHM reported overall revenue of INR960m (est INR1,109m) in 2QFY18
marking a YoY de-growth of 6.1%.
EBITDA during the quarter stood at INR-118m (est. INR31m) as against INR42m
in 2QFY17. Margins stood at -12.3% (est. 2.8%) vs 4.1% in 2QFY17. Significant
rise of 1220bp in raw material cost (59.2% in 2QFY18 v/s 47% in 2QFY17) led to
the decline in EBITDA margins.
Employee expenses too witnessed a significant rise of 740bp to 16.6% YoY.
Consequently, adjusted PAT stood at INR-64m in 2QFY18 (est. INR55m) as
compared to INR28m in 2QFY17.
Valuation and view:
We will revisit our estimates post interaction with
management. Based on our current estimates, at CMP of INR2,495, the stock
trades at 24x/20x PE on FY18/FY19 EPS estimates. Currently, we have stock rating
Buy and will update post earnings call.
24 November 2017
5

In conversation
1. SBI LIFE: Don't see change in tax structure impact long-term
growth of insurance cos; Arijit Basu, MD & CEO
Even if there is a increase in the tax rate, over the long-term it won't impact the
fortunes of insurance companies.
All insurance companies will eventually adjust to any change in the tax
structure. Committee has been given six months to submit their proposal to the
Finance Ministry. So too early to comment on the impact.
One will also have to see how it will be implemented --- the time frame and
whether it will be one-time transition or happen over period of time.
Whatever decision the government takes is not necessarily in interest of the
companies but will be in interest of the policy holders. The government will also
consider the view of the companies if they are unable to give the best deal to
the consumers before taking final decision on this.
2. DIXON TECHNOLOGIES: Capacity utilisation in mobile segment
should improve by q4; Atul Lall, MD
Had huge issue of destocking pre GST but things back to normal now.
Order book continues to be healthy, current run rate of performance is
sustainable.
Have seen some increase in prices of LED televisions and washing machine due
to GST.
Have added some new clients this quarter.
Saw topline growth at 30-35 percent CAGR over the last 5 years.
Lighting and consumer electronics are the main driver to company's growth.
By Q4, capacity utilisation in mobile segment should improve.
3. MAX LIFE: Biz in good shape; talk of increase in tax rate to
corp tax rate premature; Rajesh Sud, MD & CEO
Talks still premature. No draft by the tax authorities so far to increase tax rates.
23 percent of new customers in H1FY18 came in protection plans.
Protection products have better underwriting and therefore aid margins.
Margins for each company depends on their product mix, cost of distribution etc
- a combination of many factors.
For company, the blended margins were at 18 percent. ULIP products would be
slightly lower and protection products would be higher and mix of that is upto
18 percent.
Company a strong performing franchise with consistent performance. Business
in good shape with healthy capital and profits. Would continue to build on this.
Always looking for growth opportunities in terms of partnerships with banks
under open architecture. Company already has strong partnership with banks
like Axis Bank, Lakshmi Vilas Bank and Yes Bank and other small urban co-
operative banks.
Would look at any likeminded opportunities going forward, whether through
banks or acquisitions. However, would not take away focus on organic growth.
Currently ULIP comprises 35 percent of their product while some peers have it
at 75 percent levels.
24 November 2017
6

4. THOMAS COOK: No intention to sell further stake in quess
corp; Madhavan Menon, Chairman & MD
No intention to sell further stake in Quess Corp.
Tourist season picking up and forward bookings have seen a significant growth.
Restricted floor price to Rs 800 because wanted to honour Quess' qualified
institutional placement (QIP) investors.
Originally invested in Quess Corp at Rs 132 per share.
24 November 2017
7

From the think tank
1. A transformation of corporate governance
The preface to the Kotak Committee report on corporate governance refers to the
need to move from the monarchial model to the custodial model—two styles of
running a company. The latter would translate to protecting the minority and
instilling a greater sense of accountability for majority shareholders managing the
business affairs. The Kotak Committee report lays emphasis on enhanced
accountability. This includes capping the number of directorships, minimum
attendance of board meetings and specified skill profile of independent directors.
Even the existing Section 134 of the Companies Act, 2013 specifically charts out a
long list of conditions to be implemented by the board, including compliance with
sub-section 3p with respect to performance evaluation of all directors, including
committees of the board.
2. Yield determinants of state development loans
It is a common parlance that yield on state development loans (SDLs) trade at a
premium to G-sec yields. This difference in yield attracts a lot of debate across
research analysts and market participants and the common refrain is that such a
yield differential could possibly be attributed to the fiscal marksmanship of
individual states. We however believe otherwise and our results show such
spread is a by-product of typical market idiosyncrasies/microstructure. The
importance of market microstructure (trading mechanisms, price formation,
depth and liquidity) in various segments of financial markets and its implications
for policymaking has been a much less explored area in the Indian context (apart
from a 2009 paper Money Market Microstructure And Monetary Policy: The
Indian Experience by Michael Patra and others).
3. Death of customer service in India
As I entered the business world in the late 1980s, there were some business
axioms that I heard and read several times over: “The customer is always right”,
“the existing customer is more valuable than a new customer”, “negative news
from the customers travels much further and faster than good news”, and so on.
The famous Bill Bernbach’s “You’re not Alice?” advertisement for American Airlines
about airline staff who were so caring that travellers married them epitomized the
behaviour of an airline staff then. But in recent times, the focus on customer care
as a core business strategy seems to have lost its importance. Very few service
providers have a loyalty programme. Filing a customer complaint has been made
not just difficult, but almost impossible. The opportunity to speak to a customer
service representative is now a rarity. Twitter and Facebook pages respond with
only canned replies.
24 November 2017
8

International
4. The Platform Economy
Hardly a day goes by without another article, conference, or research initiative
devoted to the future of work. The robots are coming, or they’re not coming as
fast as we think; when they do come, they’ll put everyone out of work, or they’ll
create as many jobs as they destroy. Thus the conversation goes. But what if,
instead of trying to predict the future, we look at realities that exist today for
billions of people? Some 80% of the global population lives in emerging
economies – defined by informal markets and fluid employment structures. The
SHIFT: Commission on Work, Workers, and Technology invited groups in five
cities across the United States to imagine four scenarios along two axes of
change – more or less work, and more jobs or more tasks. Participants were
divided as to the amount of future work, but almost all foresaw the continuing
disaggregation of jobs into tasks in both low- and high-end work, from driving to
lawyering. That is the reality in emerging economies today.
24 November 2017
9

Click excel icon
for detailed
valuation guide
Rs
Valuation snapshot
P/E (x)
P/B (x)
ROE (%)
FY17 FY18E FY17 FY18E FY17 FY18E FY19E
28.1
25.2
24.7
53.5
40.1
19.4
50.0
50.8
34.5
25.2
21.8
26.1
45.5
34.1
21.5
62.6
30.0
35.4
26.3
28.7
23.4
32.5
20.9
18.2
34.2
NM
38.0
42.7
12.5
21.4
30.6
29.7
NM
21.0
40.4
14.1
NM
30.0
1,125.9
20.6
124.6
NA
55.1
46.1
28.5
27.7
20.9
61.7
36.4
83.6
16.9
27.8
25.5
22.5
36.6
41.5
22.0
37.6
43.2
19.2
25.9
20.1
18.9
24.7
29.4
17.3
49.3
25.3
29.6
21.6
83.7
20.4
26.9
23.5
19.7
27.0
18.0
31.9
31.1
16.8
17.5
25.7
9.9
63.7
24.4
9.6
11.2
7.6
21.9
22.9
NM
21.8
54.5
38.6
32.0
21.4
21.5
16.5
50.9
33.0
79.3
13.9
5.2
5.5
5.5
7.9
6.6
3.0
15.6
9.7
3.5
3.5
7.3
3.3
2.8
7.1
2.5
14.5
5.1
2.4
2.7
2.2
2.2
5.5
2.4
1.3
4.8
0.7
4.9
4.5
1.2
3.3
3.5
1.2
0.9
0.8
0.6
1.4
0.4
1.0
1.6
0.5
1.1
NA
10.5
5.5
3.0
4.6
2.5
18.5
6.7
NA
4.1
4.5
5.0
5.0
6.8
6.0
2.7
11.8
8.1
3.0
3.2
6.3
3.0
2.5
6.2
2.2
11.9
4.5
2.0
2.2
2.1
1.8
4.8
2.5
1.2
4.2
0.7
4.4
3.2
1.2
2.8
3.1
1.1
1.0
0.8
0.5
1.3
0.3
1.0
1.5
0.6
1.0
5.2
6.2
4.4
2.7
3.9
2.2
15.2
6.1
NA
3.6
20.3
23.1
25.3
16.2
15.8
16.9
37.1
20.8
10.6
13.9
35.7
14.2
6.4
20.3
9.8
25.6
17.1
6.9
10.8
9.5
9.9
18.3
10.9
7.2
15.3
-27.0
13.8
12.3
9.0
18.9
11.5
4.0
-6.7
4.2
1.4
10.1
-8.4
3.6
-0.2
2.7
0.9
0.0
21.6
15.1
12.0
18.0
14.4
32.5
18.9
25.5
25.5
17.3
20.4
23.3
20.1
15.2
13.0
35.7
20.5
16.8
12.5
33.7
14.5
10.8
20.5
13.4
26.5
17.7
7.3
11.5
2.6
9.6
18.8
8.8
6.3
16.9
4.0
14.8
12.4
6.7
17.3
11.9
6.4
1.5
3.4
5.8
11.6
4.6
4.7
7.0
-4.7
4.6
12.5
20.2
15.3
13.2
19.6
14.1
32.8
19.3
22.7
27.6
18.1
25.2
25.3
23.2
18.1
16.2
35.0
22.8
18.4
13.7
31.1
14.6
11.5
23.0
28.3
35.6
22.7
10.8
11.8
8.2
10.0
20.4
10.5
6.9
19.0
8.0
16.5
13.7
12.6
19.5
13.9
9.4
4.3
6.1
7.3
12.7
5.4
7.1
11.4
2.1
7.7
12.3
20.4
19.3
15.4
19.6
15.3
32.8
18.6
22.2
30.7
Company
Automobiles
Amara Raja
Ashok Ley.
Bajaj Auto
Bharat Forge
Bosch
CEAT
Eicher Mot.
Endurance Tech.
Escorts
Exide Ind
Hero Moto
M&M
Mahindra CIE
Maruti Suzuki
Tata Motors
TVS Motor
Aggregate
Banks - Private
Axis Bank
DCB Bank
Equitas Hold.
Federal Bank
HDFC Bank
ICICI Bank
IDFC Bank
IndusInd
J&K Bank
Kotak Mah. Bk
RBL Bank
South Indian
Yes Bank
Aggregate
Banks - PSU
BOB
BOI
Canara
IDBI Bk
Indian Bk
OBC
PNB
SBI
Union Bk
Aggregate
NBFCs
Aditya Birla Cap
Bajaj Fin.
Bharat Fin.
Capital First
Cholaman.Inv.&Fn
Dewan Hsg.
GRUH Fin.
HDFC
HDFC Stand. Life
Indiabulls Hsg
Reco
Buy
Buy
Buy
Buy
Neutral
Buy
Buy
Buy
Sell
Buy
Neutral
Buy
Not Rated
Buy
Buy
Neutral
CMP
(INR)
787
115
3,262
700
18,991
1,811
30,636
1,193
688
205
3,679
1,420
244
8,482
426
736
TP
% Upside
EPS (INR)
(INR) Downside FY17 FY18E FY19E
856
134
3,753
844
19,965
2,116
34,722
1,334
688
254
3,819
1,658
-
9,466
575
764
9
17
15
21
5
17
13
12
0
24
4
17
12
35
4
28.0
4.6
132.3
13.1
473.1
93.3
612.7
23.5
20.0
8.1
169.1
54.3
5.4
248.6
19.8
11.7
28.3
34.2
4.5
6.2
145.2 175.0
19.1
26.0
457.8 603.0
82.5 116.9
814.7 1,062.7
27.6
36.7
35.8
45.9
7.9
9.7
183.1 193.9
75.0
85.7
9.9
11.8
288.1 381.0
24.6
64.8
14.9
25.8
Buy
Neutral
Buy
Buy
Buy
Buy
Neutral
Buy
Buy
Buy
Buy
Buy
Buy
544
184
145
113
1,847
319
55
1,642
75
1,021
508
31
312
680
197
209
146
2,150
355
56
2,000
100
1,179
665
36
382
25
7
44
29
16
11
2
22
34
15
31
15
22
15.4
7.0
5.0
4.8
56.8
15.3
3.0
48.1
-31.3
26.8
11.9
2.5
14.6
18.4
8.5
1.7
5.5
68.7
13.6
2.8
60.9
4.1
32.1
16.4
1.9
17.8
30.8
10.5
5.7
6.6
84.7
17.0
3.2
78.6
8.7
41.6
23.0
3.8
23.3
Buy
Neutral
Neutral
Neutral
Buy
Neutral
Buy
Buy
Neutral
178
202
394
62
412
129
187
335
167
201
201
386
49
438
150
250
415
175
13
-1
-2
-20
6
16
34
24
5
6.0
-14.8
18.8
1.5
29.3
-31.6
6.2
0.3
8.1
17.9
3.2
16.1
6.4
36.7
17.1
8.5
14.6
-13.5
22.6
9.2
30.3
8.6
44.0
21.4
13.5
26.8
6.0
Buy
Buy
Under Review
Buy
Buy
Buy
Neutral
Buy
Buy
Buy
202
1,764
968
701
1,272
620
502
1,703
374
1,162
231
2,300
-
925
1,500
690
500
2,000
370
1,550
14
30
32
18
11
0
17
-1
33
0.0
32.0
21.0
24.6
46.0
29.6
8.1
46.8
4.5
68.6
3.7
45.7
30.3
32.8
59.2
37.6
9.9
51.6
4.7
83.6
5.4
63.7
47.2
43.7
70.4
46.0
12.0
57.1
5.4
105.1
24 November 2017
10

Company
L&T Fin Holdings
LIC Hsg Fin
Manappuram
M&M Fin.
Muthoot Fin
PNB Housing
Repco Home
Shriram City Union
STF
Aggregate
Capital Goods
ABB
Bharat Elec.
BHEL
Blue Star
CG Cons. Elec.
CG Power & Indu.
Cummins
GE T&D
Havells
K E C Intl
L&T
Pennar Eng.
Siemens
Solar Ind
Suzlon Energy
Thermax
Va Tech Wab.
Voltas
Aggregate
Cement
Ambuja Cem.
ACC
Birla Corp.
Dalmia Bharat
Grasim Inds.
India Cem
J K Cements
JK Lakshmi Ce
Ramco Cem
Orient Cem
Prism Cem
Shree Cem
Ultratech
Aggregate
Consumer
Asian Paints
Britannia
Colgate
Dabur
Emami
Godrej Cons.
GSK Cons.
HUL
ITC
Reco
Buy
Neutral
Not Rated
Buy
Neutral
Buy
Buy
Buy
Buy
CMP
(INR)
180
602
102
438
454
1,382
621
1,993
1,233
TP
% Upside
(INR) Downside
240
33
680
13
-
500
14
550
21
1,750
27
800
29
2,650
33
1,500
22
FY17
5.2
38.2
8.6
7.1
29.5
31.6
29.1
84.3
22.2
EPS (INR)
FY18E FY19E
6.9
10.4
41.0
46.5
9.2
9.7
14.2
19.1
42.6
42.0
52.5
66.5
36.0
41.9
115.6 145.3
15.5
11.8
P/E (x)
P/B (x)
ROE (%)
FY17 FY18E FY17 FY18E FY17 FY18E FY19E
34.4
25.9 4.1
3.6
12.4 14.9 18.9
15.8
14.7 2.7
2.4
19.1 17.4 17.2
11.8
11.1 2.6
2.4
24.0 22.3 21.4
61.8
30.9 3.8
3.6
6.4
11.9 14.8
15.4
10.6 2.8
2.3
19.4 23.8 19.9
43.7
26.3 4.2
3.7
13.8 15.0 16.7
21.3
17.3 3.4
2.9
17.4 18.0 17.6
23.6
17.2 2.6
2.3
11.7 14.3 15.9
55.6
79.7 2.5
2.2
11.7 15.1 17.4
33.9
27.1 5.5
4.7
16.1 17.2 17.9
71.7
29.6
69.3
52.7
52.9
21.1
32.3
75.9
53.0
26.0
28.8
14.6
66.8
57.0
21.5
33.8
18.5
40.4
36.3
54.2
47.4
38.4
77.9
17.8
31.2
29.6
56.8
26.1
NM
419.6
44.8
43.6
37.6
55.2
64.8
49.3
46.9
47.1
50.5
38.8
64.6
30.7
69.7
26.3
31.7
41.2
47.7
60.0
33.8
46.2
44.0
21.5
24.8
11.4
55.0
44.8
15.5
34.9
16.1
35.6
30.8
38.2
32.8
34.1
49.7
14.7
30.0
20.9
32.6
26.2
26.0
41.7
35.4
41.0
30.2
53.8
56.5
44.8
43.9
47.0
45.1
37.6
55.6
28.3
9.1
6.1
1.1
8.6
28.8
1.3
6.3
10.8
9.7
5.0
3.4
1.5
6.2
10.5
-1.2
4.6
3.0
6.2
4.1
2.7
3.7
2.6
5.4
1.8
1.1
4.0
3.4
4.5
3.4
6.0
7.8
4.8
3.5
14.7
21.2
22.4
12.4
16.2
12.3
8.2
42.3
6.9
8.1
4.7
1.0
8.1
21.1
1.3
5.9
9.4
8.6
4.2
3.1
1.3
5.4
8.8
-1.4
4.2
2.6
5.5
3.7
2.6
3.5
2.4
4.9
1.6
1.0
3.4
3.1
3.9
3.0
5.4
6.5
4.3
3.2
14.3
17.6
21.3
10.6
13.8
9.6
8.0
42.1
6.9
12.7
20.6
1.5
18.0
76.4
6.2
21.2
12.4
18.2
19.2
12.5
10.2
9.3
19.8
NM
14.3
16.9
18.0
11.2
5.1
7.9
7.1
7.2
10.8
3.4
14.4
6.1
19.0
-3.2
1.4
18.4
11.6
9.4
28.5
36.9
50.4
28.4
35.8
24.6
22.2
66.5
23.5
11.6
17.9
3.3
20.2
51.0
2.1
18.1
21.8
19.5
19.5
13.1
11.6
9.8
21.4
-8.8
12.6
17.5
16.5
11.9
7.0
11.1
7.3
10.3
11.5
3.5
17.5
9.9
16.0
12.3
13.7
20.0
11.1
10.7
26.9
34.0
48.7
26.0
31.7
23.8
21.4
75.9
24.4
14.6
18.1
3.3
27.8
49.6
3.3
22.2
22.6
21.2
20.2
14.0
12.6
13.8
21.5
-11.0
13.2
16.4
16.3
13.0
8.0
14.2
12.0
12.7
14.5
6.0
19.2
13.9
17.9
15.6
21.3
17.4
14.2
12.9
29.4
35.2
56.2
27.3
34.0
22.9
22.6
88.0
25.6
Sell
Buy
Sell
Neutral
Buy
Neutral
Buy
Neutral
Neutral
Neutral
Buy
Not Rated
Neutral
Neutral
Not Rated
Neutral
Buy
Neutral
1,412
187
93
678
248
87
857
435
507
308
1,216
103
1,190
1,175
14
1,043
555
624
1,230
210
78
685
260
90
1,150
440
570
350
1,450
-
1,355
1,120
-
930
745
550
-13
13
-16
1
5
4
34
1
12
14
19
14
-5
-11
34
-12
19.7
6.3
1.3
12.9
4.7
4.1
26.5
5.7
9.6
11.9
42.3
7.1
17.8
20.6
0.6
30.8
29.9
15.5
20.2
7.1
2.9
16.5
5.2
1.4
25.3
9.4
11.5
14.3
49.0
9.1
21.7
26.2
0.9
29.9
34.5
17.5
28.7
8.0
3.0
24.4
6.5
2.3
35.0
11.2
14.3
17.6
57.5
11.2
33.4
31.3
1.0
34.4
37.2
19.6
Neutral
Neutral
Buy
Buy
Neutral
Neutral
Buy
Buy
Buy
Buy
Buy
Buy
Buy
265
1,712
1,097
3,019
1,207
176
998
396
711
163
115
17,203
4,192
314
1,797
1,435
3,517
1,302
188
1,324
512
853
205
128
21,852
4,906
19
5
31
17
8
7
33
29
20
25
12
27
17
4.9
6.9
36.1 52.2
28.5 32.2
38.8 60.8
67.8 81.9
5.6
5.8
33.7 47.8
7.0
12.1
27.3 27.1
-1.6
6.3
0.3
2.7
384.4 486.2
96.1 102.2
8.4
70.9
56.7
83.7
116.8
10.5
61.8
19.1
35.1
9.1
5.0
499.3
147.1
Neutral
Buy
Buy
Buy
Buy
Neutral
Neutral
Buy
Neutral
1,161
4,774
1,048
340
1,250
954
6,053
1,269
258
1,280
5,845
1,328
410
1,435
1,015
5,400
1,500
280
10
22
27
21
15
6
-11
18
8
21.0 21.6
73.7 84.5
21.2 23.4
7.2
7.7
26.5 26.6
18.9 21.2
156.1 160.8
19.6 22.8
8.4
9.1
25.8
106.9
28.6
9.3
33.2
24.5
182.3
27.6
10.0
24 November 2017
11

Company
Jyothy Lab
Marico
Nestle
Page Inds
Parag Milk
Pidilite Ind.
P&G Hygiene
Prabhat Dairy
United Brew
United Spirits
Aggregate
Healthcare
Alembic Phar
Alkem Lab
Ajanta Pharma
Aurobindo
Biocon
Cadila
Cipla
Divis Lab
Dr Reddy’s
Fortis Health
Glenmark
Granules
GSK Pharma
IPCA Labs
Jubilant Life
Lupin
Sanofi India
Shilpa Medicare
Strides Shasun
Sun Pharma
Syngene Intl
Torrent Pharma
Aggregate
Infrastructure
Ashoka Buildcon
IRB Infra
KNR Constructions
Sadbhav
Engineering
Aggregate
Logistics
Allcargo Logistics
Blue Dart
Concor
Gateway
Distriparks
Gati
Transport Corp.
Aggregate
Media
Dish TV
D B Corp
Den Net.
Reco
Neutral
Neutral
Neutral
Buy
Neutral
Buy
Neutral
Not Rated
Buy
Neutral
CMP
(INR)
376
304
7,625
22,276
241
844
9,164
159
1,083
3,265
TP
% Upside
(INR) Downside
365
-3
340
12
7,750
2
25,580
15
275
14
975
16
9,267
1
-
1,320
22
2,970
-9
FY17
11.2
6.3
123.7
238.7
3.6
16.7
132.9
3.5
8.7
26.7
EPS (INR)
FY18E FY19E
9.2
10.9
6.5
7.9
128.4 149.0
296.6 413.1
8.9
12.4
17.2
20.8
151.5 176.7
3.5
6.4
14.7
18.0
34.9
53.7
P/E (x)
FY17 FY18E
33.5
41.0
48.4
46.8
61.7
59.4
93.3
75.1
66.8
27.0
50.4
49.0
68.9
60.5
45.1
45.8
124.8 73.9
122.1 93.5
48.2
43.9
23.8
26.5
23.1
17.7
40.5
31.2
38.8
25.9
31.8
12.8
15.1
17.1
72.9
33.5
17.5
14.6
34.5
47.4
25.5
20.8
39.8
23.2
23.9
NM
11.3
23.1
32.9
21.0
23.8
28.7
25.1
15.6
67.7
25.4
29.3
32.0
38.1
70.2
15.7
15.4
56.7
29.0
14.6
22.0
32.0
36.7
19.7
37.9
32.1
25.6
28.0
130.8
10.0
20.7
25.2
17.6
15.6
32.0
31.4
30.0
8.4
14.0
26.3
77.8
16.7
NM
P/B (x)
ROE (%)
FY17 FY18E FY17 FY18E FY19E
6.3
6.4
21.1 15.5 18.3
16.9 14.7 36.7 33.6 37.1
24.4 22.1 40.9 39.0 40.9
37.3 29.9 40.0 39.8 44.4
3.1
2.8
6.0
10.8 13.3
13.1 10.8 28.2 24.1 23.9
43.2 35.8 39.3 64.8 62.9
2.3
2.2
5.2
4.9
8.5
12.3 10.7 10.2 15.5 16.5
24.5 17.0 21.3 18.2 20.9
13.3 12.4 27.6 28.2 29.5
5.1
5.3
7.5
4.3
5.1
6.5
4.0
5.1
3.1
1.2
3.7
3.1
10.6
2.8
2.9
2.8
5.9
5.8
2.7
3.6
8.0
5.0
4.0
2.6
1.5
4.3
3.7
2.3
2.3
18.0
3.7
2.8
2.2
2.7
3.9
17.2
4.2
1.9
4.4
4.6
6.0
3.4
4.9
5.5
3.5
5.3
3.0
1.1
3.1
2.2
12.5
2.6
2.5
2.5
5.5
5.1
2.4
3.4
6.6
4.4
3.6
2.4
1.3
3.6
3.3
2.1
2.1
13.7
3.5
2.7
1.9
2.3
3.6
14.1
3.5
2.0
23.0
21.9
36.7
27.6
12.3
23.0
10.2
22.0
9.7
10.0
24.7
21.1
14.5
8.6
18.0
20.9
17.1
14.4
10.8
18.1
22.2
23.8
16.8
-0.6
14.0
20.7
12.0
11.0
13.7
50.5
10.8
7.3
12.4
16.7
12.3
25.1
24.6
-19.1
19.9
17.2
26.4
24.6
7.2
23.4
12.1
16.3
8.2
1.6
19.6
17.7
22.0
9.2
18.4
12.0
17.1
14.7
12.9
9.2
22.5
18.3
12.9
1.9
14.1
19.1
13.8
11.8
14.1
48.6
11.5
9.2
19.4
17.8
13.6
19.9
22.8
-6.4
19.8
19.6
25.7
22.3
11.4
26.1
13.6
21.2
14.1
3.9
18.4
18.8
31.4
12.0
19.2
12.5
17.6
20.5
18.3
13.7
20.7
19.9
15.4
7.0
12.9
17.0
12.5
11.6
15.4
46.8
14.1
11.7
25.4
18.6
16.1
35.2
22.2
0.2
Neutral
Neutral
Buy
Buy
Neutral
Buy
Neutral
Neutral
Neutral
Buy
Neutral
Buy
Neutral
Neutral
Buy
Buy
Buy
Buy
Buy
Buy
Not Rated
Neutral
514
1,977
1,324
696
413
444
617
1,036
2,312
132
594
123
2,505
539
648
828
4,449
665
823
545
519
1,281
540
1,950
1,606
900
335
555
600
1,100
2,575
185
650
200
2,500
550
861
1,000
5,000
797
1,214
610
-
1,400
5
-1
21
29
-19
25
-3
6
11
40
9
62
0
2
33
21
12
20
48
12
9
21.6 21.6
74.6 68.8
57.3 52.7
39.3 44.6
10.2
6.1
14.2 17.5
15.9 21.1
39.9 32.4
72.6 60.6
10.3
1.9
39.3 37.9
7.2
8.0
34.4 44.2
16.1 18.6
36.9 44.2
56.6 37.6
129.1 139.0
14.0 18.1
32.3 41.8
26.1 14.4
13.0 16.1
55.2 50.0
24.9
90.7
64.1
50.3
10.5
23.7
27.0
43.7
115.2
4.9
42.8
11.0
54.9
26.5
55.0
42.7
156.2
29.9
69.2
22.9
18.0
61.4
Buy
Neutral
Buy
Buy
237
230
276
360
260
240
295
385
10
5
7
7
-0.5
20.3
12.0
11.0
1.8
22.9
13.3
14.3
7.1
23.2
14.1
14.5
Buy
Not Rated
Neutral
Buy
Not Rated
Not Rated
169
4,154
1,341
264
133
294
215
-
1,496
282
-
-
27
12
7
9.8
10.9
102.5 129.9
38.0 42.7
6.8
8.4
16.9
8.8
15.9
21.0
13.3
163.2
55.2
11.6
23.9
25.9
17.2
40.5
35.3
38.8
16.0
17.3
31.5
77.1
18.2
NM
Buy
Buy
Neutral
79
364
90
106
430
90
34
18
0
1.0
20.0
-9.3
1.0
21.7
-2.9
2.4
25.4
0.1
24 November 2017
12

Company
Ent.Network
Hind. Media
HT Media
Jagran Prak.
Music Broadcast
PVR
Prime Focus
Siti Net.
Sun TV
Zee Ent.
Aggregate
Metals
Hindalco
Hind. Zinc
JSPL
JSW Steel
Nalco
NMDC
SAIL
Rain Industries
Vedanta
Tata Steel
Aggregate
Oil & Gas
BPCL
GAIL
Gujarat Gas
Gujarat St. Pet.
HPCL
IOC
IGL
MRPL
Oil India
ONGC
PLNG
Reliance Ind.
Aggregate
Retail
Jubilant Food
PC Jeweller
Titan Co.
Aggregate
Technology
Cyient
HCL Tech.
Hexaware
Infosys
KPIT Tech
L&T Infotech
Mindtree
Mphasis
NIIT Tech
Persistent Sys
Tata Elxsi
TCS
Reco
Neutral
Buy
Neutral
Buy
Buy
Buy
Buy
Neutral
Buy
Buy
CMP
(INR)
801
247
102
165
376
1,348
103
25
879
564
TP
% Upside
(INR) Downside
910
14
302
22
113
11
225
36
469
25
1,640
22
130
26
27
10
1,005
14
630
12
FY17
11.4
25.8
7.4
10.7
6.4
20.5
1.2
-1.9
24.9
12.1
EPS (INR)
FY18E FY19E
11.6
20.1
25.6
30.2
10.4
11.9
11.3
13.4
9.0
14.2
27.1
43.0
3.1
6.1
-0.8
0.1
28.1
35.7
10.5
16.0
P/E (x)
P/B (x)
ROE (%)
FY17 FY18E FY17 FY18E FY17 FY18E FY19E
70.1
69.2 4.5
4.2
6.7
6.3
10.1
9.6
9.6
1.6
1.3
18.2 15.0 15.3
13.8
9.8
1.1
1.0
7.9
10.2 10.6
15.5
14.6 2.5
2.6
18.5 17.3 19.3
58.5
41.7 3.9
3.6
11.2
9.0
12.6
65.6
49.8 6.5
5.8
10.4 12.4 17.0
84.7
33.6 5.6
4.8
7.6
15.3 24.8
NM
NM
4.0
4.6 -29.4 -14.2
2.4
35.4
31.3 8.6
8.0
26.0 26.4 30.7
46.5
54.0 6.3
5.8
17.0 12.8 16.8
42.1
36.1 5.3
4.9
12.6 13.5 17.2
29.8
15.9
NM
18.0
22.1
12.7
NM
34.7
20.4
18.7
26.1
10.5
20.5
52.8
23.6
10.4
9.4
34.7
8.5
18.8
11.0
22.3
19.6
14.1
171.7
34.5
89.2
75.8
18.9
14.3
24.1
15.8
15.0
18.1
20.6
18.5
17.2
17.4
33.7
20.1
13.5
13.8
NM
13.2
17.6
9.5
NM
13.1
12.1
12.0
15.4
11.8
16.5
28.6
17.2
11.7
10.0
30.7
13.5
12.2
9.6
16.9
16.7
13.1
80.1
24.5
64.4
52.9
16.1
13.5
20.2
15.5
15.0
16.3
17.9
17.2
15.0
15.2
28.1
20.4
2.0
4.3
0.5
2.9
1.6
1.8
0.8
3.7
1.9
2.2
1.8
3.2
2.0
7.1
2.6
3.2
1.8
7.3
2.2
1.0
1.1
4.7
2.0
1.9
14.1
4.3
16.8
11.6
3.1
3.6
5.9
3.3
2.3
6.6
3.3
2.5
2.3
2.7
10.6
6.0
1.7
4.6
0.6
2.4
1.5
1.6
0.9
3.0
1.8
2.0
1.8
2.7
1.9
5.9
2.3
2.7
1.6
6.2
1.9
1.0
1.0
3.9
1.8
1.7
13.2
3.8
13.6
9.8
2.8
3.4
5.0
3.6
2.0
5.1
3.3
2.8
2.2
2.6
8.5
6.4
7.4
24.4
-7.9
17.3
7.2
12.8
-9.9
10.9
9.7
15.7
7.0
32.4
9.6
14.0
11.6
32.4
20.7
21.0
31.4
5.7
10.1
23.2
11.6
13.1
8.2
14.6
20.6
15.3
16.2
27.5
26.5
22.0
14.3
41.6
16.8
13.2
13.7
17.0
37.1
32.6
13.6
32.3
-4.7
19.8
8.6
15.7
-6.9
25.2
15.1
17.1
11.4
25.2
12.0
22.6
14.4
25.1
17.2
21.7
15.1
8.0
10.8
25.2
12.1
12.9
16.5
16.5
23.4
18.5
17.4
25.9
26.4
21.8
14.1
35.2
17.3
14.6
15.1
17.9
33.6
30.6
16.5
42.5
0.1
20.2
10.1
16.3
-4.9
29.7
23.8
16.6
15.3
25.8
12.6
27.3
14.0
25.0
16.9
20.4
16.7
10.4
12.5
23.7
12.0
13.5
20.9
17.5
25.5
20.9
18.3
25.6
23.4
22.5
14.5
29.6
21.2
17.3
16.4
20.8
32.4
33.5
Buy
Neutral
Buy
Buy
Neutral
Buy
Sell
Buy
Buy
Neutral
255
313
172
267
82
127
82
334
308
711
326
322
209
297
87
187
43
492
394
672
28
3
22
11
6
47
-48
47
28
-6
8.6
19.7
-20.9
14.8
3.7
10.0
-10.1
9.6
15.1
37.9
18.8
22.7
-15.1
20.3
4.7
13.3
-6.4
25.5
25.5
59.4
26.4
33.5
0.5
24.9
5.8
12.7
-4.3
38.9
44.4
65.2
Buy
Sell
Sell
Neutral
Buy
Buy
Neutral
Sell
Buy
Buy
Buy
Buy
507
462
848
208
425
394
305
125
363
181
253
945
643
378
721
184
579
554
301
110
418
231
312
1,077
27
-18
-15
-12
36
41
-1
-12
15
27
23
14
48.3
22.6
16.1
8.8
40.7
41.9
8.8
14.8
19.3
16.4
11.4
48.3
43.1
28.1
29.7
12.1
36.4
39.5
9.9
9.2
29.8
19.0
15.0
56.7
52.1
31.9
44.1
13.2
42.8
43.6
11.0
11.5
40.5
22.8
16.7
62.1
Sell
Buy
Buy
1,718
368
805
1,270
490
850
-26
33
6
10.0
10.7
9.0
21.4
15.1
12.5
27.4
18.4
15.9
Buy
Neutral
Neutral
Buy
Neutral
Buy
Buy
Neutral
Neutral
Buy
Buy
Neutral
580
853
329
991
178
1,004
512
721
655
656
949
2,683
600
970
270
1,100
160
950
600
670
600
780
1,004
2,450
4
14
-18
11
-10
-5
17
-7
-8
19
6
-9
30.6 36.0
59.8 63.2
13.7 16.3
62.8 63.8
11.9 11.9
55.5 61.6
24.9 28.5
38.9 42.0
38.0 43.7
37.7 43.3
28.1 33.8
133.4 131.8
41.9
68.2
17.0
67.8
14.1
66.0
35.1
46.0
50.3
52.4
40.2
151.4
24 November 2017
13

Company
Reco
Tech Mah
Buy
Wipro
Neutral
Zensar Tech
Buy
Aggregate
Telecom
Bharti Airtel
Buy
Bharti Infratel
Neutral
Idea Cellular
Buy
Tata Comm
Buy
Aggregate
Utiltites
Coal India
Buy
CESC
Buy
JSW Energy
Sell
NTPC
Buy
Power Grid
Buy
Tata Power
Sell
Aggregate
Others
Arvind
Neutral
Avenue
Sell
Supermarts
Bata India
Sell
BSE
Neutral
Castrol India
Buy
Century Ply.
Neutral
Coromandel Intl Buy
Delta Corp
Buy
Dynamatic Tech Buy
Eveready Inds.
Buy
Interglobe
Neutral
Indo Count
Neutral
Info Edge
Buy
Inox Leisure
Sell
Jain Irrigation
Under Review
Just Dial
Neutral
Kaveri Seed
Buy
Kitex Garm.
Buy
Manpasand
Buy
MCX
Buy
Monsanto
Buy
Navneet Education Buy
Quess Corp
Buy
PI Inds.
Buy
Piramal Enterp.
Buy
SRF
Buy
S H Kelkar
Buy
Symphony
Sell
Team Lease Serv. Buy
Trident
Buy
TTK Prestige
Neutral
V-Guard
Neutral
Wonderla
Buy
CMP
(INR)
489
293
881
TP
% Upside
(INR) Downside
560
14
280
-5
1,020
16
FY17
30.9
16.9
52.1
EPS (INR)
FY18E FY19E
35.8
37.7
19.1
20.1
52.8
72.7
P/E (x)
P/B (x)
ROE (%)
FY17 FY18E FY17 FY18E FY17 FY18E FY19E
15.8
13.7 2.6
2.5
18.4 18.9 18.2
17.3
15.4 2.8
2.7
16.9 17.0 16.7
16.9
16.7 2.7
2.4
17.2 15.3 18.4
17.7
17.5 4.1
4.3
22.9 24.4 23.2
43.8
25.2
NM
70.0
45.5
18.1
19.6
21.6
15.1
15.0
12.6
16.4
35.1
149.1
55.4
23.1
28.7
33.9
30.3
82.9
30.1
32.2
27.0
9.6
76.7
83.3
20.3
30.3
29.6
16.4
63.7
38.3
29.0
22.7
85.7
25.5
35.7
21.7
36.0
66.8
53.7
13.0
51.2
64.9
52.3
132.1 2.9
22.2 4.5
NM
1.4
128.6 12.5
-312.8 3.0
15.5
11.4
20.6
13.4
12.0
12.8
13.8
41.3
95.5
47.1
20.9
30.8
30.0
20.9
44.7
18.0
28.9
18.5
15.6
50.8
34.6
14.8
28.7
16.5
13.8
40.7
35.9
23.8
19.6
27.6
28.5
24.7
24.3
39.5
45.0
48.4
10.4
49.1
51.8
30.6
6.9
1.3
1.3
1.5
2.2
2.1
2.3
3.1
18.6
7.3
1.9
32.5
9.2
5.1
6.4
4.2
10.4
11.9
2.9
7.4
4.8
1.7
4.1
3.8
4.4
4.0
3.6
8.1
5.6
11.6
7.2
3.0
3.4
4.7
24.8
9.3
1.6
9.2
15.5
4.8
2.9
4.5
1.8
13.6
3.1
6.6
1.2
1.3
1.4
1.9
2.0
2.2
3.0
16.4
6.5
1.9
29.5
7.6
4.4
4.3
3.4
8.4
6.8
2.4
6.6
4.3
1.7
3.6
4.1
3.6
3.7
3.6
7.3
4.8
4.7
6.0
2.8
3.1
4.3
21.8
7.8
1.4
8.4
12.6
4.3
6.8
16.2
-1.6
48.4
6.6
37.8
6.5
6.3
10.5
15.6
17.1
14.4
10.3
17.9
2.2
20.2
-26.6
10.1
-1.0
42.4
10.7
6.3
11.0
17.0
16.0
15.7
7.4
18.2
3.7
22.8
-41.4
30.0
0.2
47.7
11.1
5.0
11.9
17.4
14.6
16.8
10.9
22.9
15.7
8.0
96.1
29.6
23.4
12.9
24.3
31.5
43.0
18.5
13.7
16.2
14.8
13.7
27.4
27.6
13.5
15.9
34.5
27.9
16.4
22.9
15.3
16.3
15.1
54.5
22.2
16.1
20.7
28.8
17.5
496
374
96
698
680
440
110
780
37
18
15
12
11.3
14.9
-1.1
10.0
3.8
16.8
-16.1
5.4
6.5
19.2
-18.0
18.2
271
1,018
83
180
209
93
335
1,360
51
211
261
72
24
34
-39
17
25
-23
14.9
51.9
3.8
12.0
14.0
7.4
17.5
89.1
4.0
13.4
17.4
7.3
20.7
102.1
3.3
15.7
20.4
7.5
435
1,144
748
949
390
294
503
253
2,035
414
1,167
125
1,202
278
113
530
564
305
404
950
2,495
166
857
852
2,588
1,861
261
1,579
2,083
86
6,765
232
366
425
873
578
1,100
467
323
523
257
3,334
400
1,291
128
1,300
240
-
465
738
394
492
1,300
3,295
209
1,170
890
3,266
1,992
301
1,288
2,300
114
5,281
167
393
-2
-24
-23
16
20
10
4
2
64
-3
11
2
8
-14
-12
31
29
22
37
32
26
37
4
26
7
15
-18
10
32
-22
-28
7
12.4
7.7
13.5
41.0
13.6
8.7
16.6
3.1
67.6
12.9
43.2
13.0
15.7
3.3
5.5
17.5
19.1
18.6
6.3
24.8
86.2
7.3
10.0
33.4
72.6
85.9
7.2
23.7
38.8
6.6
132.1
3.6
7.0
10.5
12.0
15.9
45.3
12.6
9.8
24.1
5.7
112.9
14.3
63.2
8.0
23.6
8.0
7.6
18.5
34.1
22.1
9.9
26.5
105.0
8.4
31.1
29.9
104.6
76.7
6.6
35.1
43.0
8.3
137.8
4.5
11.9
16.5
17.5
19.3
46.1
13.3
12.9
29.0
8.0
166.7
17.4
75.4
10.7
26.2
12.0
10.0
21.1
41.0
26.2
15.4
43.4
126.6
10.4
32.7
35.6
149.7
104.9
9.7
42.9
66.4
10.4
176.1
6.0
16.0
13.9 14.6
8.3
9.3
115.0 100.3
31.1 27.7
17.5 22.5
8.1
12.1
15.1 20.7
37.7 32.1
51.0 46.8
34.8 17.0
10.2 13.7
5.9
12.5
8.6
11.7
14.8 13.4
13.6 23.3
29.8 28.6
7.3
8.4
10.2 10.0
31.5 32.5
26.7 26.3
19.0 24.2
32.8 23.0
9.0
11.7
16.6 13.2
13.7 11.3
43.3 51.6
19.2 17.6
13.0 14.5
19.5 18.0
27.4 26.9
9.5
14.8
24 November 2017
14

MOSL Universe stock performance
Company
Automobiles
Amara Raja
Ashok Ley.
Bajaj Auto
Bharat Forge
Bosch
CEAT
Eicher Mot.
Endurance Tech.
Escorts
Exide Ind
Hero Moto
M&M
Mahindra CIE
Maruti Suzuki
Tata Motors
TVS Motor
Banks - Private
Axis Bank
DCB Bank
Equitas Hold.
Federal Bank
HDFC Bank
ICICI Bank
IDFC Bank
IndusInd
J&K Bank
Kotak Mah. Bk
RBL Bank
South Indian
Yes Bank
Banks - PSU
BOB
BOI
Canara
IDBI Bk
Indian Bk
OBC
PNB
SBI
Union Bk
NBFCs
Aditya Birla Cap
Bajaj Fin.
Bharat Fin.
Capital First
Cholaman.Inv.&Fn
Dewan Hsg.
GRUH Fin.
HDFC
HDFC Stand. Life
Indiabulls Hsg
L&T Fin.Holdings
LIC Hsg Fin
Manappuram
M&M Fin.
1 Day (%)
0.0
1.2
-1.5
-1.7
-0.2
-1.3
1.5
-0.5
-0.8
1.3
0.5
-0.7
1.4
-0.4
-0.5
2.4
0.8
3.0
0.0
0.0
-0.4
0.1
-0.4
0.8
0.4
-0.5
0.2
0.0
0.8
-1.4
-0.1
-1.2
0.4
-0.9
-0.7
-1.5
-0.1
-1.8
0.0
-0.6
0.6
-0.4
-0.8
-0.1
0.2
-0.9
-5.4
-1.2
1.1
0.7
-1.3
1.1
1M (%)
13.4
-10.7
1.4
9.4
-10.6
7.7
-1.6
11.2
-5.0
-0.6
-2.9
3.9
1.9
8.5
0.9
7.3
21.0
0.8
-4.5
-9.3
-0.9
21.5
-3.0
-3.2
2.1
-3.9
-3.8
-2.2
-11.8
29.1
49.9
28.8
19.5
56.1
13.6
42.5
36.3
31.5
12.3
-3.8
-4.5
-6.0
11.6
6.3
-0.2
-1.0
-13.5
-14.0
-7.7
0.1
3.5
12M (%)
-16.3
48.3
25.7
55.9
0.1
57.7
46.5
118.3
128.1
17.3
22.1
19.0
32.3
73.8
-9.6
107.7
13.3
69.1
-5.2
62.2
55.9
32.5
-21.3
54.3
27.4
33.6
49.1
67.7
38.7
9.6
72.8
33.0
-9.4
68.8
9.5
35.6
29.4
11.7
Company
Bharat Elec.
BHEL
Blue Star
CG Cons. Elec.
CG Power & Inds Sol.
Cummins
GE T&D
Havells
K E C Intl
L&T
Pennar Eng.
Siemens
Solar Ind
Suzlon Energy
Thermax
Va Tech Wab.
Voltas
Cement
Ambuja Cem.
ACC
Birla Corp.
Dalmia Bharat
Grasim Inds.
India Cem
J K Cements
JK Lakshmi Ce
Ramco Cem
Orient Cem
Prism Cem
Shree Cem
Ultratech
Consumer
Asian Paints
Britannia
Colgate
Dabur
Emami
Godrej Cons.
GSK Cons.
HUL
ITC
Jyothy Lab
Marico
Nestle
Page Inds
Parag Milk
Pidilite Ind.
P&G Hygiene
Prabhat Dairy
United Brew
United Spirits
Healthcare
Alembic Phar
Alkem Lab
Ajanta Pharma
Aurobindo
1 Day (%)
3.6
4.6
-1.0
1.9
1.0
-1.0
5.1
1.4
1.0
-0.4
-0.4
-0.2
0.4
-0.4
0.3
1.4
0.2
-0.3
-0.7
0.8
1.6
0.9
-0.4
0.1
0.0
0.6
0.2
1.3
0.3
-0.8
-1.1
0.1
1.0
0.6
-0.1
0.1
0.8
-0.1
0.0
2.4
0.7
0.0
-1.3
-0.2
0.8
-1.0
1.5
-2.5
-1.2
0.6
1.1
-1.5
-0.4
1M (%)
7.1
7.0
-15.8
11.6
7.5
-4.7
14.5
-6.4
3.6
7.2
-8.1
-1.4
19.2
-11.4
6.8
-7.2
15.0
-6.0
-3.8
8.9
10.5
2.2
-3.0
4.6
-3.2
1.7
3.4
1.7
-9.6
-0.4
-1.0
2.3
-1.3
7.2
9.2
1.7
22.4
1.6
-3.2
-1.9
-4.0
5.2
13.6
-12.4
5.3
6.6
7.9
29.3
30.7
3.7
6.5
12.8
-7.3
12M (%)
58.2
11.4
44.5
68.1
18.8
12.4
32.4
54.6
128.3
34.4
-29.3
12.8
79.3
-3.9
24.5
16.3
108.8
33.6
31.4
64.3
102.5
78.5
53.6
47.3
6.4
26.8
25.3
26.9
15.1
21.5
23.2
61.1
13.6
21.1
19.1
34.2
17.4
52.8
15.0
11.1
19.3
27.9
74.7
-9.7
36.9
39.3
55.4
26.7
72.1
-20.2
16.6
-27.3
-4.8
107.9
35.3
32.5
28.5
167.1
65.6
38.9
72.9
111.7
14.6
31.9
60.0
24 November 2017
15

Company
Muthoot Fin
PNB Housing
PFC
Repco Home
REC
STF
Shriram City Union
Capital Goods
ABB
1 Day (%)
-1.9
-0.4
0.4
0.3
1.5
-1.3
-1.1
0.3
1M (%)
-8.8
-5.1
-3.3
-4.7
5.1
10.9
-6.3
6.0
12M (%)
53.0
67.7
0.9
6.6
23.4
45.0
6.6
32.9
Company
Biocon
Cadila
Cipla
Divis Lab
Dr Reddy’s
Fortis Health
Glenmark
1 Day (%)
1.1
0.2
-0.3
1.0
-2.1
5.6
0.6
1M (%)
13.6
-9.7
4.0
18.6
-2.2
-9.0
-0.8
12M (%)
43.9
13.1
11.8
-12.0
-26.1
-23.8
-34.1
24 November 2017
16

MOSL Universe stock performance
Company
Granules
GSK Pharma
IPCA Labs
Jubilant Life
Lupin
Sanofi India
Shilpa Medicare
Strides Shasun
Sun Pharma
Syngene Intl
Torrent Pharma
Infrastructure
Ashoka Buildcon
IRB Infra.Devl.
KNR Construct.
Sadbhav Engg.
Logistics
Allcargo Logistics
Blue Dart
Concor
Gateway Distriparks
Gati
Transport Corp.
Media
Dish TV
D B Corp
Den Net.
Ent.Network
Hind. Media
HT Media
Jagran Prak.
Music Broadcast
PVR
Prime Focus
Siti Net.
Sun TV
Zee Ent.
Metals
Hindalco
Hind. Zinc
JSPL
JSW Steel
Nalco
NMDC
Rain Industries
SAIL
Vedanta
Tata Steel
Oil & Gas
BPCL
GAIL
Gujarat Gas
Gujarat St. Pet.
HPCL
IOC
IGL
1 Day (%)
-1.3
0.4
0.6
1.7
0.0
0.3
4.4
-0.6
1.8
-0.6
0.5
3.6
-0.8
1.8
1.7
-0.2
0.1
-1.4
0.4
4.6
1.2
3.1
0.8
-0.7
0.5
-0.1
1.7
-1.1
1.5
-0.5
2.1
-1.6
0.5
0.4
-1.2
0.0
-1.0
-0.4
0.6
1.0
4.7
0.7
-0.3
0.0
-0.2
-1.1
1.0
-1.0
1.3
-0.4
-0.7
1M (%)
-12.7
2.8
10.1
4.4
-20.2
5.4
1.2
-3.4
0.8
4.3
-6.7
27.3
8.4
29.8
30.0
-0.3
1.0
0.7
10.3
15.1
3.9
14.7
-1.0
7.8
2.3
2.0
-1.5
-6.7
-2.4
-4.7
0.0
2.1
9.3
14.5
-6.3
-1.5
8.8
2.8
-2.9
5.3
50.0
39.1
-6.3
0.0
-0.8
6.4
-6.6
0.0
-7.7
-2.5
-5.5
12M (%)
16.1
-5.4
-3.8
-0.4
-44.4
4.4
18.7
-24.3
-22.3
-2.0
-4.3
66.5
24.9
91.9
27.4
3.3
-10.1
48.8
16.9
13.3
73.8
-6.6
-1.0
25.6
12.8
-9.0
42.7
-3.8
21.2
54.5
-32.7
96.5
23.1
47.1
21.4
155.9
61.8
58.6
10.3
581.2
68.7
42.0
81.3
19.9
49.5
61.8
35.0
40.4
32.3
84.5
Company
Titan Co.
Technology
Cyient
HCL Tech.
Hexaware
Infosys
KPIT Tech
L&T Infotech
Mindtree
Mphasis
NIIT Tech
Persistent Sys
Tata Elxsi
TCS
Tech Mah
Wipro
Zensar Tech
Telecom
Bharti Airtel
Bharti Infratel
Idea Cellular
Tata Comm
Utiltites
Coal India
CESC
JSW Energy
NTPC
Power Grid
Tata Power
Others
Arvind
Avenue Super.
Bata India
BSE
Castrol India
Century Ply.
Coromandel Intl
Delta Corp
Dynamatic Tech
Eveready Inds.
Interglobe
Indo Count
Info Edge
Inox Leisure
Jain Irrigation
Just Dial
Kaveri Seed
Kitex Garm.
Manpasand
MCX
Monsanto
Navneet Educat.
PI Inds.
Piramal Enterp.
Quess Corp
SRF
1 Day (%)
-0.9
4.0
1.4
-0.6
2.6
4.2
1.2
-1.4
-0.1
2.1
0.6
0.1
0.0
1.3
-0.3
1.5
-0.5
-0.5
-2.6
0.5
-0.5
-1.5
5.5
-0.9
1.0
0.2
0.7
0.6
-0.1
0.0
0.5
-1.2
-1.2
-3.4
0.0
2.2
0.2
2.2
-0.2
-3.5
-0.8
0.4
0.8
0.2
-0.4
-0.5
-0.7
-2.6
2.0
-0.5
-6.2
4.6
1M (%)
33.3
6.6
-8.7
16.3
5.5
40.7
24.8
1.7
7.3
7.2
-1.6
11.7
3.7
5.9
-1.1
17.3
-0.3
-16.6
-2.1
-2.8
-6.6
-0.6
2.4
1.9
-1.6
14.0
10.9
1.4
-5.7
-2.1
3.4
5.7
1.5
7.2
-1.6
28.0
0.7
11.6
9.1
21.0
19.9
28.6
1.4
41.7
-7.8
-12.9
3.4
-2.9
9.4
-5.4
3.3
10.7
12M (%)
157.7
19.3
11.9
74.0
7.7
41.5
66.0
12.8
41.4
63.4
10.9
74.3
24.4
8.3
30.9
-10.8
65.2
4.0
32.1
9.8
-10.8
79.1
50.1
12.5
15.0
34.6
26.1
79.0
-0.9
67.6
99.5
125.9
-29.9
89.4
34.3
-13.8
29.1
23.9
32.2
43.1
47.9
13.5
31.1
-23.6
10.3
52.9
6.2
56.3
42.5
26.9
24 November 2017
17

Company
MRPL
Oil India
ONGC
PLNG
Reliance Ind.
Retail
Jubilant Food
PC Jeweller
1 Day (%)
0.1
-0.1
0.4
0.2
1.6
-0.6
2.0
1M (%)
-3.4
7.2
5.7
-7.2
0.8
11.1
6.4
12M (%)
40.7
13.2
-2.6
34.5
87.7
94.8
101.9
Company
S H Kelkar
Symphony
Team Lease Serv.
Trident
TTK Prestige
V-Guard
Wonderla
1 Day (%)
0.8
0.5
-0.3
-1.3
0.3
0.4
0.9
1M (%)
-6.6
12.8
26.3
-13.3
9.7
19.2
-0.8
12M (%)
-9.7
30.2
146.8
67.2
30.6
88.5
12.6
24 November 2017
18

THEMATIC/STRATEGY RESEARCH GALLERY

REPORT GALLERY
RECENT INITIATING COVERAGE REPORTS
Rs

DIFFERENTIATED PRODUCT GALLERY

Disclosures:
The following Disclosures are being made in compliance with the SEBI Research Analyst Regulations 2014 (herein after referred to as the Regulations).
Motilal Oswal Securities Ltd. (MOSL) is a SEBI Registered Research Analyst having registration no. INH000000412. MOSL, the Research Entity (RE) as defined in the Regulations, is engaged in the business of providing Stock
broking services, Investment Advisory Services, Depository participant services & distribution of various financial products. MOSL is a subsidiary company of Motilal Oswal Financial Service Ltd. (MOFSL). MOFSL is a listed
public company, the details in respect of which are available on
www.motilaloswal.com.
MOSL is registered with the Securities & Exchange Board of India (SEBI) and is a registered Trading Member with National Stock
Exchange of India Ltd. (NSE) and Bombay Stock Exchange Limited (BSE), Metropolitan Stock Exchange Of India Ltd. (MSE) for its stock broking activities & is Depository participant with Central Depository Services Limited
(CDSL) & National Securities Depository Limited (NSDL) and is member of Association of Mutual Funds of India (AMFI) for distribution of financial products. Details of associate entities of Motilal Oswal Securities Limited are
available on the website at
http://onlinereports.motilaloswal.com/Dormant/documents/Associate%20Details.pdf
Pending Regulatory Enquiries against Motilal Oswal Securities Limited by SEBI:
SEBI pursuant to a complaint from client Shri C.R. Mohanraj alleging unauthorized trading, issued a letter dated 29th April 2014 to MOSL notifying appointment of an Adjudicating Officer as per SEBI regulations to hold
inquiry and adjudge violation of SEBI Regulations; MOSL requested SEBI to provide all documents, records, investigation report relied upon by SEBI which were referred in Show Cause Notice and also sought personal
hearing. The matter is currently pending.
MOSL, it’s associates, Research Analyst or their relative may have any financial interest in the subject company. MOSL and/or its associates and/or Research Analyst may have beneficial ownership of 1% or more securities in
the subject company at the end of the month immediately preceding the date of publication of the Research Report.
MOSL and its associate company(ies), their directors and Research Analyst and their relatives may; (a) from
time to time, have a long or short position in, act as principal in, and buy or sell the securities or derivatives thereof of companies mentioned herein. (b) be engaged in any other transaction involving such securities and earn
brokerage or other compensation or act as a market maker in the financial instruments of the company(ies) discussed herein or act as an advisor or lender/borrower to such company(ies) or may have any other potential
conflict of interests with respect to any recommendation and other related information and opinions.; however the same shall have no bearing whatsoever on the specific recommendations made by the analyst(s), as the
recommendations made by the analyst(s) are completely independent of the views of the associates of MOSL even though there might exist an inherent conflict of interest in some of the stocks mentioned in the research
report.
Research Analyst may have served as director/officer, etc. in the subject company in the last 12 month period. MOSL and/or its associates may have received any compensation from the subject company in the past
12 months.
In the last 12 months period ending on the last day of the month immediately preceding the date of publication of this research report, MOSL or any of its associates may have:
managed or co-managed public offering of securities from subject company of this research report,
received compensation for investment banking or merchant banking or brokerage services from subject company of this research report,
received compensation for products or services other than investment banking or merchant banking or brokerage services from the subject company of this research report.
Subject Company may have been a client of MOSL or its associates during twelve months preceding the date of distribution of the research report.
MOSL and it’s associates have not received any compensation or other benefits from the subject company or third party in connection with the research report. To enhance transparency, MOSL has incorporated a Disclosure
of Interest Statement in this document. This should, however, not be treated as endorsement of the views expressed in the report. MOSL and / or its affiliates do and seek to do business including investment banking with
companies covered in its research reports. As a result, the recipients of this report should be aware that MOSL may have a potential conflict of interest that may affect the objectivity of this report. Compensation of Research
Analysts is not based on any specific merchant banking, investment banking or brokerage service transactions.
Terms & Conditions:
This report has been prepared by MOSL and is meant for sole use by the recipient and not for circulation. The report and information contained herein is strictly confidential and may not be altered in any way, transmitted to,
copied or distributed, in part or in whole, to any other person or to the media or reproduced in any form, without prior written consent of MOSL. The report is based on the facts, figures and information that are considered
true, correct, reliable and accurate. The intent of this report is not recommendatory in nature. The information is obtained from publicly available media or other sources believed to be reliable. Such information has not
been independently verified and no guaranty, representation of warranty, express or implied, is made as to its accuracy, completeness or correctness. All such information and opinions are subject to change without notice.
The report is prepared solely for informational purpose and does not constitute an offer document or solicitation of offer to buy or sell or subscribe for securities or other financial instruments for the clients. Though
disseminated to all the customers simultaneously, not all customers may receive this report at the same time. MOSL will not treat recipients as customers by virtue of their receiving this report.
Analyst Certification
The views expressed in this research report accurately reflect the personal views of the analyst(s) about the subject securities or issues, and no part of the compensation of the research analyst(s) was, is, or will be directly or
indirectly related to the specific recommendations and views expressed by research analyst(s) in this report.
Disclosure of Interest Statement
Analyst ownership of the stock
Companies where there is interest
No
A graph of daily closing prices of securities is available at
www.nseindia.com, www.bseindia.com.
Research Analyst views on Subject Company may vary based on Fundamental research and Technical Research. Proprietary
trading desk of MOSL or its associates maintains arm’s length distance with Research Team as all the activities are segregated from MOSL research activity and therefore it can have an independent view with regards to
subject company for which Research Team have expressed their views.
Regional Disclosures (outside India)
This report is not directed or intended for distribution to or use by any person or entity resident in a state, country or any jurisdiction, where such distribution, publication, availability or use would be contrary to law,
regulation or which would subject MOSL & its group companies to registration or licensing requirements within such jurisdictions.
For Hong Kong:
This report is distributed in Hong Kong by Motilal Oswal capital Markets (Hong Kong) Private Limited, a licensed corporation (CE AYY-301) licensed and regulated by the Hong Kong Securities and Futures Commission (SFC)
pursuant to the Securities and Futures Ordinance (Chapter 571 of the Laws of Hong Kong) “SFO”. As per SEBI (Research Analyst Regulations) 2014 Motilal Oswal Securities (SEBI Reg No. INH000000412) has an agreement with
Motilal Oswal capital Markets (Hong Kong) Private Limited for distribution of research report in Hong Kong. This report is intended for distribution only to “Professional Investors” as defined in Part I of Schedule 1 to SFO. Any
investment or investment activity to which this document relates is only available to professional investor and will be engaged only with professional investors.” Nothing here is an offer or solicitation of these securities,
products and services in any jurisdiction where their offer or sale is not qualified or exempt from registration. The Indian Analyst(s) who compile this report is/are not located in Hong Kong & are not conducting Research
Analysis in Hong Kong.
For U.S.
Motilal Oswal Securities Limited (MOSL) is not a registered broker - dealer under the U.S. Securities Exchange Act of 1934, as amended (the"1934 act") and under applicable state laws in the United States. In addition MOSL is
not a registered investment adviser under the U.S. Investment Advisers Act of 1940, as amended (the "Advisers Act" and together with the 1934 Act, the "Acts), and under applicable state laws in the United States.
Accordingly, in the absence of specific exemption under the Acts, any brokerage and investment services provided by MOSL, including the products and services described herein are not available to or intended for U.S.
persons. This report is intended for distribution only to "Major Institutional Investors" as defined by Rule 15a-6(b)(4) of the Exchange Act and interpretations thereof by SEC (henceforth referred to as "major institutional
investors"). This document must not be acted on or relied on by persons who are not major institutional investors. Any investment or investment activity to which this document relates is only available to major institutional
investors and will be engaged in only with major institutional investors. In reliance on the exemption from registration provided by Rule 15a-6 of the U.S. Securities Exchange Act of 1934, as amended (the "Exchange Act") and
interpretations thereof by the U.S. Securities and Exchange Commission ("SEC") in order to conduct business with Institutional Investors based in the U.S., MOSL has entered into a chaperoning agreement with a U.S.
registered broker-dealer, Motilal Oswal Securities International Private Limited. ("MOSIPL"). Any business interaction pursuant to this report will have to be executed within the provisions of this chaperoning agreement.
The Research Analysts contributing to the report may not be registered /qualified as research analyst with FINRA. Such research analyst may not be associated persons of the U.S. registered broker-dealer, MOSIPL, and
therefore, may not be subject to NASD rule 2711 and NYSE Rule 472 restrictions on communication with a subject company, public appearances and trading securities held by a research analyst account.
For Singapore
Motilal Oswal Capital Markets Singapore Pte Limited is acting as an exempt financial advisor under section 23(1)(f) of the Financial Advisers Act(FAA) read with regulation 17(1)(d) of the Financial Advisors Regulations and is a
subsidiary of Motilal Oswal Securities Limited in India. This research is distributed in Singapore by Motilal Oswal Capital Markets Singapore Pte Limited and it is only directed in Singapore to accredited investors, as defined in
the Financial Advisers Regulations and the Securities and Futures Act (Chapter 289), as amended from time to time. In respect of any matter arising from or in connection with the research you could contact the following
representatives of Motilal Oswal Capital Markets Singapore Pte Limited:
Disclaimer:
The report and information contained herein is strictly confidential and meant solely for the selected recipient and may not be altered in any way, transmitted to, copied or distributed, in part or in whole, to any other person
or to the media or reproduced in any form, without prior written consent. This report and information herein is solely for informational purpose and may not be used or considered as an offer document or solicitation of
offer to buy or sell or subscribe for securities or other financial instruments. Nothing in this report constitutes investment, legal, accounting and tax advice or a representation that any investment or strategy is suitable or
appropriate to your specific circumstances. The securities discussed and opinions expressed in this report may not be suitable for all investors, who must make their own investment decisions, based on their own investment
objectives, financial positions and needs of specific recipient. This may not be taken in substitution for the exercise of independent judgment by any recipient. Each recipient of this document should make such investigations
as it deems necessary to arrive at an independent evaluation of an investment in the securities of companies referred to in this document (including the merits and risks involved), and should consult its own advisors to
determine the merits and risks of such an investment. The investment discussed or views expressed may not be suitable for all investors. Certain transactions -including those involving futures, options, another derivative
products as well as non-investment grade securities - involve substantial risk and are not suitable for all investors. No representation or warranty, express or implied, is made as to the accuracy, completeness or fairness of
the information and opinions contained in this document. The Disclosures of Interest Statement incorporated in this document is provided solely to enhance the transparency and should not be treated as endorsement of the
views expressed in the report. This information is subject to change without any prior notice. The Company reserves the right to make modifications and alternations to this statement as may be required from time to time
without any prior approval. MOSL, its associates, their directors and the employees may from time to time, effect or have effected an own account transaction in, or deal as principal or agent in or for the securities
mentioned in this document. They may perform or seek to perform investment banking or other services for, or solicit investment banking or other business from, any company referred to in this report. Each of these entities
functions as a separate, distinct and independent of each other. The recipient should take this into account before interpreting the document. This report has been prepared on the basis of information that is already
available in publicly accessible media or developed through analysis of MOSL. The views expressed are those of the analyst, and the Company may or may not subscribe to all the views expressed therein. This document is
being supplied to you solely for your information and may not be reproduced, redistributed or passed on, directly or indirectly, to any other person or published, copied, in whole or in part, for any purpose. This report is not
directed or intended for distribution to, or use by, any person or entity who is a citizen or resident of or located in any locality, state, country or other jurisdiction, where such distribution, publication, availability or use would
be contrary to law, regulation or which would subject MOSL to any registration or licensing requirement within such jurisdiction. The securities described herein may or may not be eligible for sale in all jurisdictions or to
certain category of investors. Persons in whose possession this document may come are required to inform themselves of and to observe such restriction. Neither the Firm, not its directors, employees, agents or
representatives shall be liable for any damages whether direct or indirect, incidental, special or consequential including lost revenue or lost profits that may arise from or in connection with the use of the information.
The
person accessing this information specifically agrees to exempt MOSL or any of its affiliates or employees from, any and all responsibility/liability arising from such misuse and agrees not to hold MOSL or any of its affiliates or
employees responsible for any such misuse and further agrees to hold MOSL or any of its affiliates or employees free and harmless from all losses, costs, damages, expenses that may be suffered by the person accessing this
information due to any errors and delays.
Registered Office Address: Motilal Oswal Tower, Rahimtullah Sayani Road, Opposite Parel ST Depot, Prabhadevi, Mumbai-400025; Tel No.: 022-3980 4263; www.motilaloswal.com. Correspondence Address: Palm Spring
Centre, 2nd Floor, Palm Court Complex, New Link Road, Malad (West), Mumbai- 400 064. Tel No: 022 3080 1000. Compliance Officer: Neeraj Agarwal, Email Id:
na@motilaloswal.com,
Contact No.:022-30801085.
Registration details of group entities.: MOSL: NSE (Cash): INB231041238; NSE (F&O): INF231041238; NSE (CD): INE231041238; BSE (Cash): INB011041257; BSE(F&O): INF011041257; BSE(CD); MSE(Cash): INB261041231;
MSE(F&O): INF261041231; MSE(CD): INE261041231; CDSL: IN-DP-16-2015; NSDL: IN-DP-NSDL-152-2000; Research Analyst: INH000000412. AMFI: ARN 17397. Investment Adviser: INA000007100. Motilal Oswal Asset
Management Company Ltd. (MOAMC): PMS (Registration No.: INP000000670) offers PMS and Mutual Funds products. Motilal Oswal Wealth Management Ltd. (MOWML): PMS (Registration No.: INP000004409) offers wealth
management solutions. *Motilal Oswal Securities Ltd. is a distributor of Mutual Funds, PMS, Fixed Deposit, Bond, NCDs, Insurance and IPO products. * Motilal Oswal Commodities Broker Pvt. Ltd. offers Commodities
Products. * Motilal Oswal Real Estate Investment Advisors II Pvt. Ltd. offers Real Estate products. * Motilal Oswal Private Equity Investment Advisors Pvt. Ltd. offers Private Equity products
13 December 2016
20