4 December 2017
Market snapshot
Equities - India
Close
Chg .%
Sensex
32,833
-1.0
Nifty-50
10,122
-1.0
Nifty-M 100
19,692
-1.0
Equities-Global
Close
Chg .%
S&P 500
2,642
-0.2
Nasdaq
6,848
-0.4
FTSE 100
7,300
-0.4
DAX
12,861
-1.2
Hang Seng
11,449
-0.2
Nikkei 225
22,819
0.4
Commodities
Close
Chg .%
Brent (US$/Bbl)
64
1.4
Gold ($/OZ)
1,281
0.4
Cu (US$/MT)
6,809
1.1
Almn (US$/MT)
2,059
1.2
Currency
Close
Chg .%
USD/INR
64.5
0.2
USD/EUR
1.2
0.0
USD/JPY
112.2
-0.3
YIELD (%)
Close
1MChg
10 Yrs G-Sec
7.1
0.03
10 Yrs AAA Corp
7.8
0.02
Flows (USD b)
1-Dec
MTD
FIIs
0.0
3.1
DIIs
0.0
1.5
Volumes (INRb)
1-Dec
MTD*
Cash
329
387
F&O
4,413
6,910
Note: YTD is calendar year, *Avg
YTD.%
23.3
23.7
37.2
YTD.%
18.0
27.2
2.2
12.0
21.9
19.4
YTD.%
14.9
11.1
23.3
20.8
YTD.%
-5.1
13.1
-4.1
YTDchg
0.5
0.3
YTD
8.6
12.8
YTD*
307
5,670
Today’s top research idea
NMDC: Iron ore pricing improving
Highly profitable steel project, albeit delayed, is available for free
NMDC has increased iron ore prices by 10-13% as Indian iron ore mines are
regaining price power. We expect NMDC’s iron ore volumes to grow at 5-6% over
the next 4-5 years from its existing mines that are currently operating at ~80%
utilization.
Investment in rail evacuation line and growth at its key customers will drive
volume growth. Steel plant, though delayed, will be highly profitable given
technology efficiency, scale advantage and raw material sourcing. Margins in the
steel business are likely to be 10,000/t.
Despite factoring in 10% lower iron ore margins w.r.t. FY18, we expect EBITDA
CAGR of 17% to INR97b over FY17-22. We expect equity value CAGR of 15% to
INR223 in four years, while the dividend yield will be ~5% at CMP. Thus, we
expect a 20% annual total stock return over the next 3-4 years.
Research covered
Cos/Sector
NMDC
Infosys
Biocon
Persistent Systems
Utilities
Automobiles
Key Highlights
Iron ore pricing improving
New era Take#2; Appoints CapGemini’s Salil Parekh as CEO and MD
Mylan/ Biocon received Trastuzuman approval in US
Solutions in sight; Analyst Day Takeaways
CESC wins 100MW in BEST’s PPA, Tata Power at loss
Volumes numbers (November 2017)
Piping hot news
Reviving growth tops Infosys boss Salil Parekh’s agenda
Infosys will seek to revive growth and create a fresh team of leaders when
chief executive Salil Parekh takes charge in January at the Bengaluru company,
which has battled nearly a year of internal turmoil and slashed revenue
forecast for the fiscal year…
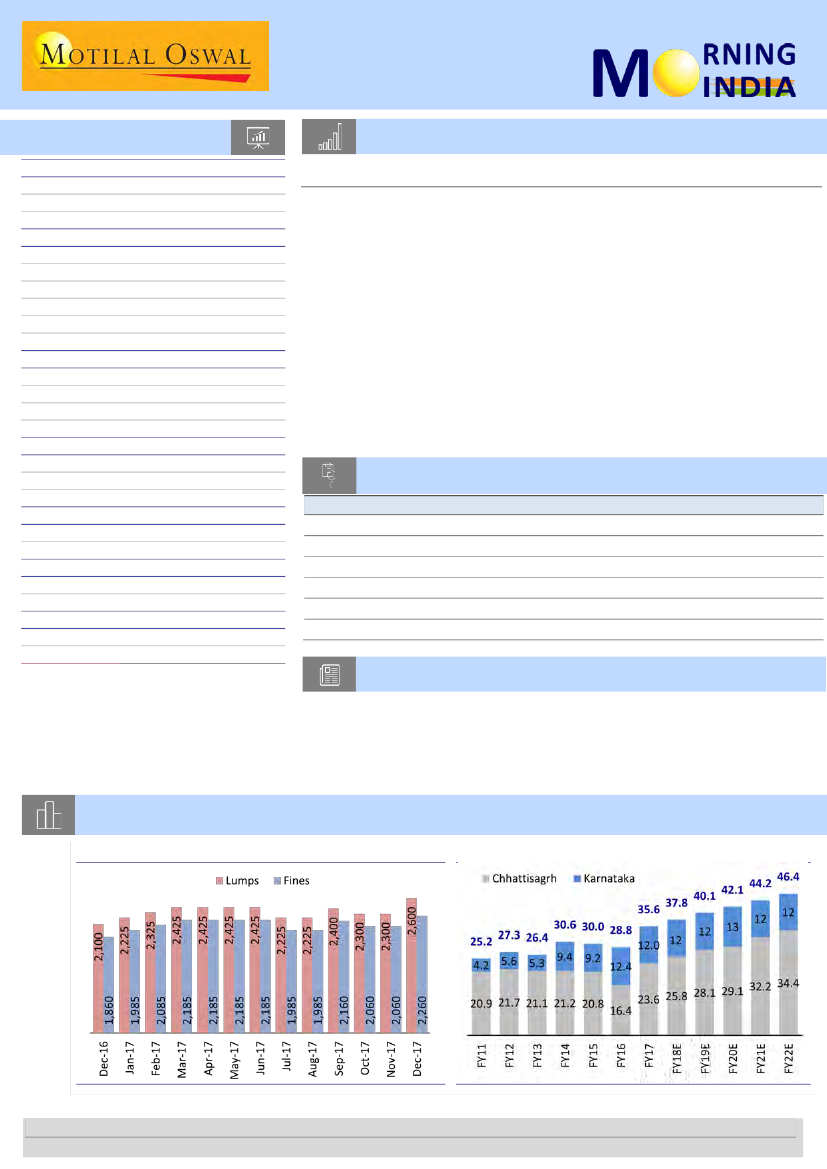
Chart of the Day: NMDC—Iron ore pricing improving
NMDC’s prices – INR/t (ex-royalty, DMF etc)
Iron ore sales – mt
Research Team (Gautam.Duggad@MotilalOswal.com)
Motilal Oswal research is available on www.motilaloswal.com/Institutional-Equities, Bloomberg, Thomson Reuters, Factset and S&P Capital.
Investors are advised to refer through important disclosures made at the last page of the Research Report.

In the news today
Kindly click on textbox for the detailed news link
1
FIIs invested $3 billion in
equities in November, the
highest since March
Foreign institutional investors (FIIs)
invested $3 billion in Indian
equities in November, the highest
since March, but are likely to take
further cues from the US Federal
Reserve’s policy meeting later this
month…
2
BSE, NSE want to venture into AI, data analytics biz
The Bombay Stock Exchange and the National Stock Exchange are
exploring the opportunity to venture beyond the current businesses and
have, along with other market infrastructure companies, sought SEBI’s
permission to form a separate entity to take on these businesses. “Stock
exchanges (SEs) are seeking a one-time regulatory approval to venture into
business areas outside SEBI’s purview,” sources close to the development
told BusinessLine. “They have sought SEBI’s permission to engage in
activities or businesses that are unrelated to, or not identical to, those of
an SE or of clearing corporations (CCs) or their core business, through a
separate legal entity,” they added…
3
RBI defaulters list number 2:
Lenders willing to take haircuts
of 50-60 pct than risk firms’
liquidation
4
Media, entertainment industry
to touch Rs8 trillion in revenue
by 2022: report
The Indian media and entertainment
(M&E) industry is expected to
double its revenue to reach Rs7.5-8
trillion by 2022 from an estimated
Rs4.5 trillion in 2017, said a report
published by consulting firm
Boston Consulting Group (BCG) and
lobby group Confederation of
Indian Industry (CII)…
Banks are veering around to the
view it might be better to clinch
one-time settlements (OTS) with
defaulting companies — on the
Reserve Bank of India’s second list
— and take haircuts of 50-60%
rather than face uncertainty in the
courts…
5
Tata Teleservices likely to offer
26% stake to JV partner in lieu
of penalty
Tata Teleservices (TTSL) is looking
to offset telecom infrastructure
commitments by offering its 26
per cent stake in a local joint
venture to controlling shareholder
American Tower Corp. (ATC) for
discontinuing rentals, said two
people familiar with the
development. This follows the
Tata Group’s exit from mobile
services. The value of the stake is
pegged at Rs 5,000 crore while the
penalty for early termination may
be as much as Rs 7,000 crore. It’s
unclear if Tata will offer additional
cash payouts to bridge the deficit,
the sources added…
6
Union Petroleum and Natural Gas
Minister Dharmendra Pradhan
today said the government is
planning to curb the imports of
petroleum coke, also known as 'pet
coke', which is believed to be a
major polluter. The statement
follows reports that US-based oil
refineries are exporting pet coke --
a carbon-rich solid material derived
from oil refining -- to India…
7
Bharti Airtel PAT expected to
leap 9-fold by 2020-2021: CLSA
Bharti Airtel is likely to deliver 16%
compound annual growth rate
(CAGR) in operating income and a
ninefold jump in profit after tax
(PAT) between 2017-18 and 2020-
21 on the strength of its
countrywide data network and
execution, brokerage CLSA said…
Soon, policy to restrict pet
coke imports: Oil Minister
4 December 2017
2

1 December 2017
Update
| Sector:
Metals
NMDC
Buy
BSE SENSEX
32,833
S&P CNX
10,122
CMP: INR129
TP: INR187 (+46%)
Iron ore pricing improving
Highly profitable steel project, albeit delayed, is available for free
Pricing power returning – mines take price hike in December
Stock Info
Bloomberg
Equity Shares (m)
52-Week Range (INR)
1, 6, 12 Rel. Per (%)
M.Cap. (INR b)
M.Cap. (USD b)
Avg Val, INRm
Free float (%)
NMDC IN
3,164
153 / 103
1/9/-14
401.8
6.2
446
25.1
Indian iron ore miners are gaining pricing power again, as some of the mines in
Odisha are shut, international iron ore prices have moved up, and demand is
increasing (as Indian steel mills are trying to boost production in a seasonally
strong part of the year). We expect Indian iron ore supply to get tight over the next
2-3 years, with leases of a number of private mines expiring by end-FY20 and
increasing domestic steel production. NMDC has increased prices by 10-13%
(Exhibit 4) with effect from 1
st
December 2017, but it remains competitive with
respect to imports for its key customers (Exhibit 7/8).
Financials Snapshot (INR b)
Y/E Mar
2017 2018E 2019E
Net Sales
88.3 107.9 107.6
EBITDA
44.9
60.3
59.7
PAT
31.5
41.9
40.2
EPS (INR)
10.0
13.2
12.7
Gr. (%)
11.7
33.0
-4.2
BV/Sh (INR)
71.2
77.2
82.7
RoE (%)
12.8
15.6
16.2
RoCE (%)
12.2
15.2
15.8
P/E (x)
12.9
9.7
10.1
P/BV (x)
1.8
1.7
1.5
Shareholding pattern (%)
As On
Sep-17 Jun-17 Sep-16
Promoter
74.9
74.9
80.0
DII
17.3
17.0
14.0
FII
3.7
4.3
3.4
Others
4.0
3.8
2.7
FII Includes depository receipts
Stock Performance (1-year)
NMDC
Sensex - Rebased
170
150
130
110
90
Capacity utilization to improve as demand is rising sharply
NMDC has iron ore mining capacity of 46mtpa, but utilization is only ~80%. We
expect utilization to improve gradually to 100% over the next 2-3 years, as its key
customers (JSW steel, Essar Steel and RINL) are all ramping up production. There
will be additional demand of 15-20mtpa. NMDC is well placed to serve them due to
its high quality of ore and access to rail infrastructure. NMDC is also investing in
doubling of the KK line to improve evacuation from the Chhattisgarh complex.
Steel plants, albeit delayed, will be highly profitable
NMDC is setting up a 3mtpa steel plant at Nagarnagar, Chhattisgarh, which is
290km away from the Vizag port. The steel project is running behind schedule and
likely to start production in FY20. However, the steel plant is likely to be highly
profitable because (1) equipment and technology are supplied by high-quality
European players, (2) the economy of scale will be high at 3mtpa single 4,500 cubic
meter blast furnace, (3) it is in proximity to mines and ports and (4) it has captive
iron ore mines. Iron ore will be supplied from Deposit 13. The mine has 325mt R&R
and 10mtpa EC, and lease for 50 years starting January 2017.
Expect annual total stock return of 20% over next 3-4 years
We expect iron ore volumes CAGR of 5-6% over the next 4-5 years from the
existing mines (Exhibit 6). Steel plant is likely to produce about 1mt in FY21 and full
3mt in FY22. Margins in the steel business are likely to be 10,000/t, as it has many
advantages. Despite factoring in 10% lower iron ore margins w.r.t. FY18, we expect
EBITDA CAGR of 17% to INR97b over FY17-22. We expect equity value CAGR of 15%
to INR223 in four years, while the dividend yield will be ~5% at CMP. Thus, we
expect a 20% annual total stock return over the next 3-4 years.
The stock is trading at attractive valuations of EV/EBITDA of 6.1x, P/E of 9.7x and
P/BV of 1.7xFY18E. Return ratios are attractive at 15-16% RoE/RoCE, despite the
drag of large CWIP on balance sheet. Valuations are ignoring value of the steel
plant. Reiterating
Buy.
4 December 2017
3

3 December 2017
Update
| Sector:
Technology
Infosys
Buy
BSE SENSEX
32,833
S&P CNX
10,122
CMP: INR960
New era Take#2
TP: INR1,100(+15%)
Appoints CapGemini’s Salil Parekh as CEO and MD
Stock Info
Bloomberg
Equity Shares (m)
52-Week Range (INR)
1, 6, 12 Rel. Per (%)
M.Cap. (INR b)
M.Cap. (USD b)
Avg Val, INRm
Free float (%)
The event
INFO IN
2,297
1,045/862
5/-6/-25
2,201.7
34.1
4,845.9
87.3
Infosys announced over the weekend that its Board of Directors has appointed
Salil S. Parekh as Chief Executive Officer and Managing Director (CEO & MD) of
the Company effective January 2, 2018. Mr. Parekh joins Infosys from
Capgemini where he was a member of the Group Executive Board.
Mr. U B Pravin Rao will step down as the interim CEO and Managing Director
effective January 2, 2018 and will continue as Chief Operating Officer and a
whole-time Director of the Company.
Financials Snapshot (INR b)
Y/E Mar
2017 2018E 2019E
Net Sales
684.9 704.5 771.3
EBITDA
186.1 186.5 202.5
PAT
143.8 143.0 147.5
EPS (INR)
62.8
63.8
67.8
Gr. (%)
6.4
1.6
6.3
BV/Sh (INR)
301.5 278.7 316.4
RoE (%)
22.0
21.8
22.5
RoCE (%)
22.0
21.8
22.5
P/E (x)
15.3
15.0
14.1
P/BV (x)
3.2
3.4
3.0
Shareholding pattern (%)
As On
Sep-17 Jun-17 Sep-16
Promoter
12.8
12.8
12.8
DII
22.1
20.2
18.0
FII
34.6
38.0
40.1
Others
30.6
29.0
29.2
FII Includes depository receipts
Stock Performance (1-year)
Infosys
Sensex - Rebased
1,250
1,150
1,050
950
850
About Salil Parekh
Mr. Parekh had been with Capgemini India for over a decade & a half, starting
with Ernst & Young in 1992 and was part of the consulting business that was
acquired by Capgemini in 2000.
Mr. Parekh was responsible for overseeing a business cluster comprising
Application Services (North America, UK, Asia), Cloud Infrastructure Services,
and Sogeti (Technology & Engineering Services Division). He was also the
Chairman of the company’s North America Executive Council.
He leveraged Digital and Cloud services to drive transformation for clients. He
was responsible for the strategy and execution for the Cloud business - setting
its direction and enabling its rapid adoption at clients. He was also the architect
of the North America growth and turnaround, and was instrumental in setting
up their off-shoring capabilities.
He has Master of Engineering degrees in Computer Science and Mechanical
Engineering from Cornell University, and a Bachelor of Technology degree in
Aeronautical Engineering from the Indian Institute of Technology, Bombay.
First thoughts: Early days, few positives and caveats
We would be remiss to jump to any conclusions on INFO’s future prospects under
the new leadership. That said, we enlist our first few thoughts on the appointment
below:
Potential positives…
Appointment of Mr. Parekh comes in reasonable time after Mr. Nilekani’s swift
appointment to the Board. This allows INFO to expedite away from inward
focus and start to chase growth in business sooner than later
The new CEO’s extensive tenure in CAPG, among large companies with
favorable Digital Perception (others being Accenture, TCS and Cognizant),
maybe applicable to good effect.
Mr. Parekh has a strong technology background and rich IT services experience,
and is unlikely to feel out of place in his new role.
4 December 2017
4

…Albeit with a caveat
Leadership appointments at INFY in the past have been accompanied with a flux
at senior level that it can ill-afford. Under the scanner would be leaders who
were internal candidates for the role.
While Mr. Parekh has been a Services mainstay and led many small and big
business units, this is likely his biggest assignment and in a transformative time
for the industry, where nothing is a given.
Investment thesis
INFO's rollercoaster ride in recent years has witnessed more downs than ups.
However, with reinjection of founder influence following the appointment of Mr
Nilekani as Board’s non-executive Chairman, hopes of a swift move towards
stability were rekindled. The appointment of new CEO is another big task
accomplished to that effect, and it can now look to prolonged period of steady
execution in the business.
Earlier in October, INFO's 2Q performance and FY18 guidance quelled fears of
impact on business post the leadership exit, and we note that ex-RBS, the
midpoint of current guidance is close to industry. The company has not been
underperforming its peers on the front of revenue growth and profitability, but
its valuation to peers remained discounted amid the ongoing search for a new
leader and concerns around Governance.
Our price target of INR1,100 discounts forward earnings by 15x, implying 15%
upside. We retain our Buy rating, and believe that the gradual recovery to
normalcy will provide further case for rerating.
4 December 2017
5

3 December 2017
Update
| Sector:
Healthcare
Biocon
Neutral
BSE SENSEX
32,833
S&P CNX
10,122
CMP: INR447
TP: INR485(+9%)
Mylan/ Biocon received Trastuzumab approval in US
Stock Info
Bloomberg
Equity Shares (m)
52-Week Range (INR)
1, 6, 12 Rel. Per (%)
M.Cap. (INR b)
M.Cap. (USD b)
Avg Val, INRm
Free float (%)
BIOS IN
600
449/294
25/33/22
267.9
4.1
1054
39.3
Financials Snapshot (INR b)
2017 2018E 2019E
Y/E Mar
40.8
42.7
52.2
Net Sales
11.4
9.3
12.8
EBITDA
6.1
3.7
6.1
PAT
10.2
6.1
10.1
EPS (INR)
31.8 -40.2
65.4
Gr. (%)
80.6
84.9
92.1
BV/Sh (INR)
12.3
7.2
11.0
RoE (%)
9.4
6.1
11.4
RoCE (%)
43.8
73.2
44.3
P/E (x)
5.5
5.3
4.9
P/BV (x)
Shareholding pattern (%)
As On
Sep-17 Jun-17 Sep-16
Promoter
60.7
60.7
60.7
DII
3.8
3.7
5.1
FII
17.1
16.9
17.8
Others
18.4
18.8
16.5
FII Includes depository receipts
Stock Performance (1-year)
Biocon
Sensex - Rebased
480
430
380
330
280
Mylan/ Biocon announced on Friday that US FDA approved Mylan’s Ogivr
(trastuzumab-dkst), a biosimilar to Herceptin (trastuzumab), co-developed with
Biocon. Ogivri™ is the first FDA-approved biosimilar to Herceptin and the first
biosimilar from Mylan and Biocon’s joint portfolio approved in the US. Notably,
Mylan is the only player which has settled for a launch date with innovator
Roche. Mylan anticipates to be the first player to launch biosimilar version of
Herceptin. Patent for Herceptin is expiring in mid-2019. Since Biocon has not
filed this product through interchangeable route, it will not receive exclusivity
period for this product. We expect Mylan/ Biocon to launch Ogivri at least 3-6
months before patent expiry.
Biosimilar- USD900m-1b opportunity in medium term:
Trastuzumab,
PegFilgrastim and Insulin Glargine could be USD1b opportunity for Mylan/
Bioocon in medium term (USD250m from each product in US/ EU and
USD250m from all three products in EMs). Biocon’s sales could be ~40% of the
joint portfolio with EBITDA margin of ~30%.
Trastuzumab opportunity:
Roche is generating sales of ~USD2-2.5b/USD2b and
~USD1.8b from US, EU and EMs, respectively. Pfizer, Amgen/ allergen and
Teva/ Celtrion have also filed BLA in 2H CY17 with US FDA. Hanwha, and
Samsung are other potential late stage filers. Biocon has re-filed Trastuzumab
and PegFilgrastim with EU regulator in 3Q FY18.
PegFilgrastim opportunity:
Pegfilgrastim is a USD4.5b opportunity with US
sales of ~USD3.7-3.8b. Because of multiple biosimilar players in EU region for
Filgrastim, market size of Pegfilgrastim has come down to ~USD500m. Apotex,
Coherus, Sandoz and Cinfa are other late stage filers for this product. Apotex
has partnered with Intas for manufacturing supply and Intas’ plant has received
483s in mid-2017. Coherus received CRL from US FDA in Jun-17 and is expected
to re-file the product in next 1-2 quarters. Sandoz will be re-filing the product
in 2019. Biocon is planning to re-file the product in next few months.
Glargine Opportunity:
Glargine insulin sales in US stood at ~USD4b and
~USD2.5b in other geographies. Eli Lilly has already got the approval and has
clocked sales of USD115m in US and ~USD30m in other geographies in latest
quarter. Merck has got US FDA approval but cannot launch the product till
Mar-18 due to 30 month stay. Similarly, Biocon also has also been sued by
Sanofi in Oct-17. Unless Merck or Biocon win case against Sanofi, they will have
to wait for 30-month period. EU launch for Biocon is expected in FY19E.
Biologics business to take off from 2019:
Biocon can generate sales of
~USD350m-400m from sales of these there biosimilars in medium term.
Trastuzumab approval by US FDA is an important milestone for the company.
We maintain our neutral rating with revised target price of INR485@ 26x
FY20E PER (v/s INR335 @ 24x 1H FY20E PER). We have increased our TP
multiple to capture upside of biologics business in developed market which will
commence from 2019 onwards. We have increased our FY20E EPS by 17% on
the back of higher visibility of Biosimilar sales.
6
4 December 2017

Persistent Systems
BSE SENSEX
32,833
S&P CNX
10,122
3 December 2017
Update
| Sector:
Technology
CMP: INR656
Solutions in sight
TP: INR780(+19%)
Buy
Analyst Day Takeaways
We attended the PSYS Analyst day in Pune, where the company demonstrated its
multiple solutions ready to hit the market, while also laying out its growth strategy
and explaining the opportunities in Blockchain, though long drawn. Appended
below are our key takeaways from the event:
A suite of ready solutions to take to market:
PSYS demonstrated with use
cases a number of solutions that it has invested into and readied over the
recent period, which is in line with its strategy of delineating revenue growth
from headcount growth in the new services era. These included its solutions in
IoT (Concert), Security (Sentient), clinical decisions support in Healthcare (with
Partners Healthcare), Neuro - continuous risk-based authentication (in
partnership with USAA). With every solution built in collaboration with a
client, a ready reference will be in place to take it to more enterprises in the
market; but these remain in very early stages of their sales life cycles.
Market readiness and PSYS’ sales build-up:
Three imperatives to scaling in the
solutions continue to evolve: [1] Product readiness, [2] Market acceptance, [3]
PSYS’ sales team readiness. But we likely see sales ramp up in one or multiple
of these investments next fiscal.
Solutions are the structural trigger to margins:
PSYS’ investments in Digital,
and the accompanying onsite centricity has taken its toll on margins - down
from 26% (FY13) to 16% (FY17). Aspiration levels remain much higher, and,
over the long term, repeat sales of pre-built solutions remains the main lever
to margin expansion.
IBM IoT – sell-with has been slow:
While PSYS’ continuous engineering IoT
platform partnership with IBM continues to grow, the other anticipated
revenue streams here were sell-with and PSYS’ own over-the-top solutions.
However, progress on sell-with remains slow, which could take away some
growth percentage points in the segment. On the other hand, sale of own
solutions on the platform was always expected to have a higher gestation.
Sales focus on opening new accounts:
In the new Digital Services, PSYS’ focus
remains on opening more doors over and above mining existing accounts into
much larger scale. While mining is core to the company’s plans, but much
larger sized accounts (USD15-20m) at this juncture would still mean entering
into services that may be legacy and not all Digital. So focus on this aspect will
gradually gain ground.
India – an area of opportunity:
PSYS cited exciting opportunity in the Indian
market as well amid all the Government initiatives lined up. That said, it
maintains that business in the region makes much more sense through sale of
solutions than through services, and that will be the company’s approach. An
example of that is the company’s solution sale for digitization of the
proceedings of State Legislature – and Uttar Pradesh Vidhaan Sabha is the first
state legislature in the country to embrace the same.
7
Stock Info
Bloomberg
Equity Shares (m)
52-Week Range (INR)
1, 6, 12 Rel. Per (%)
M.Cap. (INR b)
M.Cap. (USD b)
Avg Val, INRm
Free float (%)
PSYS IN
80
693/558
2/3/-16
52.5
0.8
85.4
69.3
Financials Snapshot (INR b)
2017 2018E 2019E
Y/E Mar
28.8
31.0
35.2
Net Sales
4.7
4.9
6.0
EBITDA
3.1
3.5
4.2
PAT
37.7
43.3
52.4
EPS (INR)
1.4
14.8
21.2
Gr. (%)
244.5 254.1 264.8
BV/Sh (INR)
17.0
17.9
20.8
RoE (%)
16.7
16.0
17.0
RoCE (%)
17.4
15.2
12.5
P/E (x)
2.7
2.6
2.5
P/BV (x)
Shareholding pattern (%)
As On
Sep-17 Jun-17 Sep-16
Promoter
30.7
30.7
37.9
DII
14.6
14.1
12.3
FII
26.6
26.2
26.7
Others
28.2
29.1
23.2
FII Includes depository receipts
Stock Performance (1-year)
Persistent Sys
Sensex - Rebased
800
750
700
650
600
550
4 December 2017

Sector Update | 1 December 2017
Utilities
CESC wins 100MW in BEST’s PPA, Tata Power at loss
CESC’s generation portfolio fully secured with PPAs
According to media reports (Mumbai Mirror, dated 1 December 2017), the L1 bidders in
the 750MW five-year PPA bid by BEST DISCOM (Mumbai) were (a) CESC’s Dhariwal and
Adani Power for the base-load PPA of 300MW, (b) Maharashtra DISCOM for the peak-load
PPA of 250MW and (c) Tata Power (TPWR) Trombay for the peak-load PPA of another
200MW. BEST had called the bids in place of its existing PPA with TPWR’s Mumbai
generating assets that are expiring in March 2018. Mumbai has transmission capacity to
import only 300-500MW. The outcome of the bids is likely to be decided by the regulator
and the transmission capacity study, but the base load PPA should get preference. MAH
DISCOM and TPWR have filed for a review of the PPA’s bidding conditions. The case will be
th
heard on 6 December 2017.
st
CESC: Generation portfolio fully secured with PPAs
CESC’s Dhariwal is L1 for 100MW at a price of ~INR3.5/kWh. Being a medium-
term PPA, it will be eligible for coal linkage under the SHAKTI policy. We
estimate additional EBITDA contribution of INR0.9-1.1b.
Dhariwal was recently L1 for another 185MW short-term PPA under the flexible
coal policy by Maharashtra (report
link).
Together, the Dhariwal plant will now be fully secured with PPAs (existing -
100MW TN, 187MW Noida, and new – 100MW BEST and 185MW MAH).
We estimate Dhariwal’s EBITDA will increase from INR0.1b in FY17 to INR4.6b in
FY19 with the full benefit of all the PPAs. It will turn PAT positive, and FCF
generation will improve. This should also drive savings in interest cost (it was
12.9% in FY17). CESC’s consol. PAT will get upgraded by ~13% for FY19/20E.
Post demerger, CESC’s generation entity will have one of the best mix of
capacities among the listed private sector power companies – 2.5GW of capacity
under PPAs, with a predictable cash flow stream.
We will revise our estimates after the outcome and the final approval from the
regulatory commission. We remain positive of CESC with a TP of INR1,360/sh.
Tata Power: Regulated equity of ~INR11b at risk
Of TPWR’s Mumbai generation portfolio of 1.87GW, 500MW was already at risk
of closure (coal+imported gas based). BEST’s PPA puts additional 550MW at risk.
The regulated equity in the asset was INR19.9b in FY17.
Of the remaining 827MW, 180MW is a domestic gas-based plant and 447MW is
hydro, both of which are competitive. The remaining capacity of 200MW, on
imported coal, will be at risk once the transmission issue is resolved in Mumbai.
We were already building in the impact of the closure of the 500MW plant. The
loss of 550MW will result in ~4% cut to our PAT estimates and TP. We maintain
Sell
on Tata Power with a TP of INR72/sh.
4 December 2017
8

Exhibit 1: Utilities valuation
Rating
PowerGrid
NTPC
JSW Energy
CESC
Tata Power
Coal India
Buy
Buy
Sell
Buy
Sell
Buy
CMP
(INR)
203
181
84
995
90
272
TP Up/(dw) MCAP
(USD M) FY17E
(INR)
%
261
29
16,542 14.0
211
17
23,282 12.0
49
-41
2,141
3.9
1,360
37
2,067
51.9
72
-21
3,809
7.4
335
23
26,804 14.9
EPS
FY18E
17.4
13.4
3.4
88.9
7.3
17.5
FY19E
20.4
15.7
2.7
99.3
7.5
20.7
P/E (x)
FY18E FY19E
11.6
9.9
13.5
11.6
24.6
31.0
11.2
10.0
12.4
12.0
15.5
13.2
P/B(x)
FY18E FY19E
1.9
1.6
1.4
1.3
1.3
1.3
1.1
1.0
1.9
1.6
6.6
6.3
RoE (%)
FY18E FY19E
17.0
17.4
11.0
11.9
5.3
4.2
10.6
10.8
16.0
14.6
43.4
48.9
Source: MOSL, Company
4 December 2017
9

Sector Update | 30 November 2017
Automobiles
Maruti Suzuki
CMP: INR8,608
Stock Info
Bloomberg
Equity Shares (m)
M.Cap. (INR b)/(USD b)
52-Week Range (INR)
1, 6, 12 Rel. Per (%)
TP: INR9,866 (+14.6%)
Buy
MSIL IN
302
Domestic sales grew 15% YoY to 145k units
2,025/31.6
7249 / 3868
MSIL’s Nov-17 wholesales came in at 154,600 units (+14.1% YoY), higher than our
5/22/55
Volume up 14.1% YoY to 154.6k units (above est. of 149k)
Financials Snapshot (INR b)
Y/E MARCH 2018E 2019E 2020E
Sales
800.4 956.2 1,103.0
EBITDA
124.8 159.1 183.8
Adj. PAT
85.3 113.3 133.3
Adj. PS(INR)* 288.1 381.0 447.8
EPS Gr. (%)
15.8 32.3
17.5
BV/Sh. (INR) 1,378 1,632 1,930
RoE (%)
20.5 23.0
22.9
RoCE (%)
28.6 31.7
31.4
Payout (%)
36.2 32.1
32.7
Valuations
P/E (x)
29.9 22.6
19.2
P/CE (x)
22.6 17.7
15.3
EV/EBITDA (x) 18.3 13.8
11.5
Div. Yield (%)
1.0
1.2
1.4
*Cons.
estimate of 148,970 units. YTD growth was at 14.6%, with a residual monthly run-rate
of 148.5k units.
Domestic volumes grew 15% YoY to 145k (est. of 138k), led by growth in the compact
(+24.8% YoY) and UV (+34% YoY) segments.
Growth in the compact segment was led by Baleno and new Dzire, while that in UVs
was led by Brezza and the new S-cross.
Ciaz sales declined 26.2% YoY to 4k (est. of 3.8k).
Export volumes were flat YoY at 9,300 units (est. of 11,000 units).
The stock trades at 22.6x/19.2x FY19E/20E consol. EPS of ~INR381/448. Maintain Buy.
Snapshot of volumes for Nov-17
YoY
Company Sales
Maruti Suzuki
LCVs
Vans
Mini Segment
Compact (incl Dzire Tour)
Mid Size - CIAZ
UVs
Total Domestic
Export
YoY
Nov-17 Nov-16 (%)
chg
154,600 135,550 14.1
1,003
105
13,565 12,238 10.8
38,204 38,886 -1.8
65,447 52,448 24.8
4,009 5,433 -26.2
23,072 17,215 34.0
145,300 126,325 15.0
9,300 9,225 0.8
MoM
MoM
Oct-17 (%)
chg
146,446 5.6
872
15.0
12,669 7.1
32,490 17.6
62,480 4.7
4,107 -2.4
23,382 -1.3
136,000 6.8
10,446 -11.0
FY18YTD
1,187,735
5,232
105,353
290,421
493,173
42,251
170,702
1,107,132
80,603
Residual Residual FY18 YTD
(%)
FY18
Gr. Growth Monthly Monthly
FY17YTD
Run rate Run rate
(%)
chg estimate (%)
1,036,256
268
102,783
280,474
401,349
43,403
127,182
955,459
80,797
14.6 1,798,133
8,000
2.5 161,802
3.5 432,948
22.9 760,103
-2.7 63,159
34.2 245,218
15.9 1,671,231
-0.2 126,902
14.6
6.4
4.6
30.0
-2.0
25.3
15.7
2.3
14.7
14.7
6.8
45.5
-0.7
8.7
15.3
7.0
152,600
692
14,112
35,632
66,733
5,227
18,629
141,025
11,575
148,467
654
13,169
36,303
61,647
5,281
21,338
138,392
10,075
4 December 2017
10

Mahindra & Mahindra
CMP: INR1,409
Stock Info
Bloomberg
Equity Shares (m)
M.Cap.(INR b)/(USD b)
52-Week Range (INR)
1, 6, 12 Rel. Per (%)
MM IN
592.6
794.7/12.4
1509 / 1142
3/6/-10
TP: INR1,658 (+17.6%)
Buy
Volumes grew 23.2% YoY to 61.3k units (below est. of 70.3k)
UV volumes up by 18.3% YoY, Tractors up by 31.8% YoY
Financials Snapshot (INR b)
Y/E MARCH
2018E 2019E 2020E
Sales
EBITDA
NP*
Adj. EPS(INR) *
EPS Gr. (%)
Cons. EPS(INR)
BV/Sh. (INR)
RoE (%)
RoCE (%)
Valuations
P/E (x)
P/BV (x)
EV/EBITDA (x)
Div. Yield (%)
*incl. MVML
478.9
59.8
41.1
68.7
9.8
75.0
478.3
14.5
13.4
20.5
2.9
13.6
1.4
540.1
66.6
46.3
77.4
12.7
85.7
531.8
14.6
13.6
18.2
2.6
12.0
1.4
599.1
75.3
53.0
88.6
14.5
94.6
596.1
14.9
14.0
15.9
2.4
9.0
1.4
MM’s volumes grew by 23.2% YoY to 61.3k units (est. of 70.3k units), led by an
increase in both tractor and UV volumes.
Tractors sales of 22.8k (+31.8% YoY) were below our estimate (25k), as domestic sales
and exports grew by ~32% YoY and ~27% YoY, respectively.
UV sales (incl. pick-ups) stood at 32.8k units (+18.3% YoY), below estimate of 38.2k.
Momentum in pick-ups continued with 20% YoY growth, while passenger utility
vehicles reported growth of 21% YoY.
LCV (>3.5t) sales grew by ~11% YoY and M&HCV sales by ~122% YoY.
3W volumes increased ~12.7% YoY to 4.5k units (est. of 6k units).
Speaking on the monthly performance, Rajan Wadhera, President, Automotive Sector,
M&M Ltd. said, “We are happy to be in a positive growth phase for November 2017,
which is usually a lean period post the festive season. Our passenger and small
commercial vehicles growth for the month of November have been very encouraging
at 21% and 29% respectively, while the MHCV segment continued to grow very well.
We expect our growth momentum to continue on the back of some recent refresh
launches as well as the positivity of our product portfolio.”
Rajesh Jejurikar, President - Farm Equipment Sector, Mahindra & Mahindra Ltd. said,
“We have sold 21,046 tractors in the domestic market during November 2017, a
growth of 32% over last year. Agri economy has experienced healthy monsoon, higher
kharif production and improved MSPs. We expect the positive demand sentiment to
continue. In the exports market, we sold 1,708 tractors with growth of 27% over
November 2016."
The stock trades at 18.2x/15.9x FY19E/20E. Maintain Buy.
Snapshot of volumes for Nov-17
YoY
Company Sales
M&M
UV (incl. pick-ups)
LCV
Three-Wheelers
Tractors
Nov-17 Nov-16
61,324
32,823
1,292
4,455
22,754
49,761
27,739
807
3,953
17,262
YoY
(%)
chg
23.2
18.3
60.1
12.7
31.8
MoM
MoM
Oct-17 (%)
chg
91,411 -32.9
43,801 -25.1
1,222 5.7
6,126 -27.3
40,262 -43.5
Residual FY18 YTD
Residual
Monthly Monthly Run
FY18
FY18YTD FY17YTD (%) chg
Gr. (%) Growth (%)
Run rate
rate
estimate
572,673 530,908 7.9
300,392 286,592 4.8
9,574
8,320 15.1
34,247 37,304 -8.2
228,460 198,692 15.0
848,740
474,576
16,279
55,444
302,441
19.9
8.5
13.5
6.0
15.0
56.2
15.5
11.4
41.3
15.1
69,017
43,546
1,676
5,299
18,495
71,584
37,549
1,197
4,281
28,558
4 December 2017
11

Tata Motors
CMP: INR399
Stock Info
Bloomberg
Equity Shares (m)
M.Cap.(INR b)/ (USDb)
52-Week Range (INR)
1, 6, 12 Rel. Per (%)
TTMT IN
3395.9
1525/22.8
599 / 376
-4/-21/-7
TP: INR575 (+44.1%)
Buy
Volumes grow 47.5% YoY to 57.4k units (above est. of 49.5k)
CV sales grew 55.2% YoY, while PV sales increased 32.4% YoY
Financials Snapshot (INR b)
Y/E MARCH 2018E 2019E 2020E
Net Sales
2,959 3,622 3,923
EBITDA
371.8 577.3 610.1
NP
83.6 220.0 233.0
Adj. EPS (INR) 24.6 64.8
68.6
EPS Gr. (%)
24.2 163.2
5.9
BV/Sh. (INR) 195.6 261.6 331.4
RoE (%)
13.4 28.3
23.1
RoCE (%)
7.0 16.6
14.6
Payout (%)
1.3
0.5
0.5
Valuations
P/E (x)
16.2
6.2
5.8
P/BV (x)
2.0
1.5
1.2
EV/EBITDA (x)
4.4
2.7
2.3
Div. Yield (%)
0.1
0.1
0.1
Tata Motors’ Nov-17 sales volumes increased 47.5% YoY to 57.4k units (est. of 49.5k
units).
PV segment sales increased by 32.4% YoY, as the car segment volumes declined 4.5%
YoY, while the UV segment registered volume growth of 366% YoY due to healthy
initial response to the recently launched Tata Nexon.
Total CV volumes increased 55.2% YoY to 40.1k units, led by an increase in both LCV
and HCV sales.
M&HCV sales increased 52.3% YoY to 17.5k units (est. of 14.1k units), while LCV sales
increased 57.5% YoY to 22.6k units (est. of 19.5k units).
The stock trades at 6.2x/5.8x FY19E/20E consol. EPS. Maintain Buy.
Snapshot of volumes for Nov-17
YoY
Company Sales
Tata Motors
HCV's
LCV's
CV's
Cars
UV's
MoM
YoY (%)
MoM
Nov-17 Nov-16
Oct-17
FY18YTD FY17YTD
chg
(%) chg
57,391
17,517
22,570
40,087
11,239
6,065
38,900
11,504
14,326
25,830
11,768
1,302
47.5
52.3
57.5
55.2
-4.5
365.8
56,065
16,500
22,961
39,461
11,403
5,201
2.4
6.2
-1.7
1.6
-1.4
16.6
376,469
106,262
153,206
259,468
90,774
26,227
(%)
chg
Residual Residual FY18 YTD
Growth Monthly Monthly
FY18
Gr. (%)
Run rate Run rate
(%)
estimate
580,688
174,193
227,240
401,433
137,014
42,240
7.1
-0.9
8.7
4.3
0.0
106.6
6.4
-1.0
4.6
1.9
5.4
82.2
51,055
16,983
18,509
35,491
11,560
4,003
47,059
13,283
19,151
32,433
11,347
3,278
350,311 7.5
107,265 -0.9
138,247 10.8
245,512 5.7
93,144 -2.5
11,655 125.0
4 December 2017
12

EICHER Motors
CMP: INR29,303
Stock Info
Bloomberg
EIM IN
Equity Shares (m)
27.2
M.Cap.(INR b)/(USD b)
644.0/9.6
52-Week Range (INR) 29983/18006
1, 6, 12 Rel. Per (%)
6/8/37
Financials Snapshot (INR b)
Y/E MARCH 2018E 2019E 2020E
Net Income
88.8 107.2 126.9
EBITDA
28.2
35.4
43.3
Net Profit
22.2
28.9
36.3
Adj. EPS (INR) 814.7 1,062.7 1,334.6
EPS Gr. (%)
33.0
30.4
25.6
BV/Sh. (INR) 2,603 3,463 4,567
RoE (%)
35.7
35.0
33.2
RoCE (%)
32.0
32.1
31.2
Payout (%)
0.5
0.6
0.7
Valuations
P/E (x)
36.0
27.6
22.0
P/BV (x)
11.3
8.5
6.4
EV/EBITDA
(x)
22.7
17.7
14.0
TP: INR34,722 (+18.5%)
Buy
RE (+22.4% YoY) below est.; VECV (+54.1% YoY) in-line
RE dispatches at 70.1k units (est. 72.5k units)
RE volumes increased 22.4% YoY to 70,126 units (below est. of 72,500 units).
VECV's overall volumes increased 54.1% YoY to 4.7k units (in-line).
Domestic LMD and HD segments grew 72.5% YoY and 124.3% YoY, respectively. Buses
volume grew 7% YoY.
VECV exports were flat YoY at 665 units (est. of 780 units).
The stock trades at 27.6x/22x FY19E/FY20E EPS. Maintain Buy.
Snapshot of volumes for Nov-17
YoY
Company Sales
Royal Enfield
VECV
Domestic LMD
Domestic HD
Domestic Buses
Total Domestic
Exports
Nov-17 Nov-16
70,126 57,313
4,727 3,067
2,501 1,450
1,025
457
536
501
4,062 2,408
665
659
MoM
Residual Residual FY18 YTD
Growth Monthly Monthly
YoY (%)
(%)
FY18
MoM
FY18YTD FY17YTD
Oct-17
Gr. (%)
Run rate Run rate
(%)
chg
chg estimate
(%) chg
22.4 69,492
0.9
526,483 430,864 22.2 828,730
24.3
28.3
75,562 65,810
54.1
5,166
-8.5
36,165 36,579 -1.1
60,662
3.9
12.2
6,124
4,521
72.5
2,903
-13.8 18,051 16,615
8.6
27,989
8.0
6.9
2,485
2,256
124.3 1,051
-2.5
6,312
6,674
-5.4
10,887
-2.0
3.2
1,144
789
7.0
509
5.3
6,691
7,837 -14.6 11,700
-4.6
13.0
1,252
836
68.7
4,463
-9.0
31,054 31,126 -0.2
50,576
0.2
1.0
4,881
3,882
0.9
703
-5.4
5,111
5,453
-6.3
8,922
11.0
47.6
953
639
4 December 2017
13

Ashok Leyland
CMP: INR120
Stock Info
Bloomberg
Equity Shares (m)
M.Cap.(INR b)/ (USDb)
52-Week Range (INR)
1, 6, 12 Rel. Per (%)
AL IN
2,845.9
254.0/3.8
112 / 74
3/3/-29
TP: INR134 (+11.9%)
Buy
Vols. up 51% to 14.5k (above est. of 11.7k)
MHCVs grew 53.6%, while LCVs increased 44.3% YoY
Financials Snapshot (INR b)
Y/E MARCH 2018E 2019E 2020E
Sales
244.0 289.2 340.3
EBITDA
24.1 30.8
37.7
NP
13.1 18.2
24.0
Adj. EPS (INR)
4.5
6.2
8.2
EPS Gr. (%)
-1.5 38.7
31.9
BV/Sh. (INR)
23.0 26.5
31.7
RoE (%)
20.4 25.2
28.2
RoCE (%)
17.4 21.2
24.3
Payout (%)
44.6 36.2
30.5
Valuations
P/E (x)
26.7 19.3
14.6
P/BV (x)
5.2
4.5
3.8
EV/EBITDA (x) 14.1 10.6
8.1
Div. Yield (%)
1.7
1.9
2.1
AL’s Nov-17 wholesale dispatches were at 14,460 units (+51% YoY).
M&HCV volumes, which account for 73.6% of total volumes, grew 53.6% YoY (+16.8%
MoM) to 10,641 units (est. of 8,200 units).
LCVs (Dost) grew 44.3% YoY to 3,819 units (est. of 3,500 units).
The stock trades at 19.3x/14.6x FY19E/FY20E EPS, and at 10.6/8.1x EV/EBITDA.
Maintain Buy.
Snapshot of volumes for Nov-17
YoY
Company Sales
Ashok Leyland
CV (ex LCV)
LCV
Nov-17 Nov-16
14,460
10,641
3,819
9,574
6,928
2,646
MoM
YoY (%)
(%)
MoM
FY18YTD FY17YTD
Oct-17
chg
chg
(%) chg
51.0 12,914 12.0
96,843 86,713 11.7
53.6
9,110
16.8
71,014 65,870
7.8
44.3
3,804
0.4
25,829 20,843
24
Residual Residual FY18 YTD
Growth Monthly Monthly
FY18
Gr. (%)
Run rate Run rate
(%)
estimate
163,988
13.0
15.1
16,786 12,105
121,901
7.6
7.3
12,722
8,877
42,087
32.5
48.7
4,065
3,229
4 December 2017
14

TVS Motor
CMP: INR 724
Stock Info
Bloomberg
Equity Shares (m)
M.Cap.(INR b)/ (USDb)
52-Week Range (INR)
1, 6, 12 Rel. Per (%)
TP: INR764 (+5.5%)
Neutral
TVSL IN
475.1
Domestic sales grew by 6.6%, Exports grew by 43.8%
235.5/3.7
549 / 280
4/31/69
TVS Motor’s Nov-17 sales were at 252k units (12% YoY; below est. of 285k units).
At 252k (+12% YoY), volumes below est. of 285k
Financials Snapshot (INR b)
Y/E MARCH 2018E 2019E 2020E
Sales
149.8 186.6 223.7
EBITDA
11.6 18.9
24.7
Adj. PAT
7.1 12.3
16.6
EPS (INR)
14.9 25.8
34.9
EPS Gr. (%)
27.0 73.1
35.0
BV/Sh (INR)
62.0 83.0 111.9
RoE (%)
26.5 35.6
35.8
RoCE (%)
26.8 38.7
42.4
Payout (%)
24.2 18.6
17.2
Valuations
P/E (x)
48.6 28.0
20.8
P/BV (x)
11.7
8.7
6.5
EV/EBITDA (x) 30.5 18.4
13.7
Div. Yield (%)
0.4
0.6
0.7
Domestic volumes grew by 6.6% YoY, while exports (19% of volumes) grew 43.8% YoY.
Scooter volumes increased by 7.2% YoY to 78.4k units (est. of 100k units).
Mopeds dispatches declined 8.1% YoY to 71.7k units (est. of 72k units).
Motorcycle volumes grew 37.3% YoY to 93.2k units (est. of 105k units).
3Ws volumes increased 46.9% YoY, led by growth in domestic sales and exports.
Total exports grew 43.8% YoY, led by growth in 2W and 3W exports.
The stock trades at 28x/20.8x FY19E/FY20E EPS. Maintain Neutral.
Snapshot of volumes for Nov-17
YoY
Company Sales
Nov-17 Nov-16
TVS Motor
251,965 224,971
Motorcycles
93,202 67,896
Scooters
78,397 73,135
Mopeds
71,724 78,057
Three-Wheelers 8,642
5,883
Total Domestic 204,758 192,142
Total Exports
47,207 32,829
MoM
YoY (%)
MoM
Oct-17
chg
(%) chg
12.0 317,411 -20.6
37.3 125,409 -25.7
7.2 106,910 -26.7
-8.1
76,045
-5.7
46.9
9,047
-4.5
6.6 271,974 -24.7
43.8 45,437
3.9
(%)
chg
2,320,068 2,064,187 12.4
913,938 803,957 13.7
771,212 591,321 30.4
574,944 620,483 -7.3
59,974
48,426 23.8
1,954,665 1,780,709 9.8
365,403 283,478 28.9
FY18YTD FY17YTD
FY18
estimate
3,496,553
1,345,018
1,182,462
873,915
95,158
2,905,287
591,266
Residual
Growth
Gr. (%)
(%)
19.6
37.0
25.4
60.5
35.8
47.1
-4.0
3.1
37.4
68.9
16.3
32.3
38.9
58.7
Residual
Monthly
Run rate
294,121
107,770
102,812
74,743
8,796
237,656
56,466
FY18 YTD
Monthly
Run rate
290,009
114,242
96,402
71,868
7,497
244,333
45,675
4 December 2017
15

Bajaj Auto
CMP: INR3,213
Bloomberg
Equity Shares (m)
52-Week Range (INR)
1, 6, 12 Rel. Per (%)
BJAUT IN
289.4
3122/2366
2/-6/0
TP: INR4,197 (+30.6%)
Buy
Nov-17 dispatches at 326.5k (below est. of 350k)
Domestic volume rises 16.4% YoY; exports grow 27% YoY
M.Cap. (INR b) / (USD b) 840.6/13.1
Financial & Valuation (INR b)
Y/E MARCH 2018E 2019E 2020E
Sales
246
282
322
EBITDA
46.6 58.0 67.2
Consol. NP
45.0 54.4 62.8
ConsEPS(INR) 155
188
217
EPS Gr. (%)
10.2 20.9 15.6
BV/Sh. (INR)
656
743
847
RoE (%)
25.0 26.8 27.3
RoCE (%)
22.7 24.6 34.5
50.3 48.0 47.0
Payout (%)
Valuation
20.7
P/E (x)
4.9
P/BV (x)
EV/EBITDA (x) 16.6
2.0
Div. Yield (%)
17.1
4.3
13.0
2.3
14.8
3.8
10.8
2.6
BJAUT’s Nov-17 sales at 326.5k units (below est. of 350k units) were higher by 20.9%
YoY. Domestic volume increased by 16.4% YoY to 179.8k (est. 210k), while exports
increased 27% YoY to 146.6k (est. of 140k). Overall FY18 volume estimate stands at
3.98m, implying a residual monthly run-rate of 328k units.
Overall motorcycle volumes increased by 11% YoY. Domestic motorcycle dispatches
increased by 2% YoY to 141.9k. Motorcycle exports grew ~25% YoY to 122k units.
S Ravikumar said “Current market share in domestic bike segment is close to 19
percent and we are targeting domestic share of 22-23 percent by March 2018.”
3W volumes witnessed a recovery, with overall volumes growing 94.1% YoY. Domestic
3W volumes continued their positive growth trajectory, clocking highest-ever
dispatches at 37.9k units (+157% YoY). 3W exports at 24.6k units grew 41% YoY.
The stock trades at 17.1x/14.8x FY19E/20E consol. EPS. Maintain Buy.
Snapshot of volumes for Nov-17
YoY
Company Sales
Bajaj Auto
Motorcycles
Total Two-Wheelers
Three-Wheelers
Domestic
Exports
Nov-17 Nov-16
326,458
263,970
263,970
62,488
179,835
146,623
269,948
237,757
237,757
32,191
154,523
115,425
YoY
(%)
chg
20.9
11.0
11.0
94.1
16.4
27.0
MoM
MoM
Oct-17 (%)
chg
382,464 -14.6
325,778 -19.0
325,778 -19.0
56,686 10.2
247,210 -27.3
135,254 8.4
FY18YTD
2,668,866
2,284,183
2,284,183
384,683
1,574,889
1,093,977
Residual Residual FY18 YTD
(%)
FY18
Gr. Growth Monthly Monthly
FY17YTD
(%)
Run rate Run rate
chg estimate (%)
2,652,708
2,315,603
2,315,603
337,105
1,671,316
981,392
0.6
-1.4
-1.4
14.1
-5.8
11.5
3,981,186
3,418,427
3,418,427
562,759
2,351,677
1,629,509
8.6
6.2
6.2
26.2
4
15.5
29.5
25.4
25.4
63.5
33.2
24.6
328,080
283,561
283,561
44,519
194,197
133,883
333,608
285,523
285,523
48,085
196,861
136,747
4 December 2017
16

Hero MotoCorp
CMP: INR3,607
Stock Info
Bloomberg
Equity Shares (m)
M.Cap.(INR b)/ (USDb)
52-Week Range (INR)
1, 6, 12 Rel.Per (%)
HMCL IN
199.7
635/9.5
3813 / 2844
9/-1/4
TP: INR3,819 (+5.9%)
Neutral
Volumes up 26% YoY at 605k units (est. of 590k)
Financials Snapshot (INR b)
Y/E MARCH 2018E 2019E 2020E
Sales
317.2 342.6 375.3
EBITDA
51.8 53.9
58.8
NP
36.6 38.7
42.7
Adj. EPS (INR) 183.1 193.9 213.3
EPS Gr. (%)
8.3
5.9
10.0
BV/Sh. (INR) 580.9 666.4 769.6
RoE (%)
33.7 31.1
29.7
RoCE (%)
32.5 30.1
28.9
Valuations
P/E (x)
19.7 18.6
16.9
P/BV (x)
6.2
5.4
4.7
EV/EBITDA (x) 12.4 11.8
10.6
Div. Yield (%)
2.5
2.5
2.5
HMCL’s November-17 volumes of 605,270 units (+26.1% YoY) came in above our
estimate of 590,000.
Our FY18 total volume estimate is 7.56m units, implying a monthly residual run-rate of
613k units.
Strong volumes growth can be ascribed to robust demand during the ongoing wedding
season in the northern belt and a favorable base of last year (impact of
demonetization).
HMCL trades at 18.6/16.9x FY19E/20E EPS. Maintain Neutral.
Snapshot of volumes for Nov-17
YoY
MoM
YoY (%)
MoM
(%)
Company Sales Nov-17 Nov-16
Oct-17
FY18YTD FY17YTD
chg
(%) chg
chg
Hero MotoCorp 605,270 479,856 26.1 631,105 -4.1 5,108,555 4,711,896 8.4
Residual Residual FY18 YTD
Growth Monthly Monthly
FY18
Gr. (%)
Run rate Run rate
(%)
estimate
7,560,559 13.5
25.6
613,001 638,569
4 December 2017
17

In conversation
1. NMDC: See FY18 sales volumes around 36 MT; focus on
commissioning steel plant; TRK Rao, Director (Commercial)
Buoyancy in demand led to increase in prices.
Domestic steel market doing well - pellet prices, sponge iron prices are up and
steel prices are also up. Globally too iron ore prices from November have been
up. Competitors in Orissa and Karnataka have also risen their prices.
On a landed basis, prices are still competitive and cheaper compared to imports
on east coast, west coast, as well as to most of company’s landlocked plants.
On back of robust demand, confident of surpassing last year's sales volumes
figures of 35.5 million tonnes, with a target of 35.6 or around 36 million tonnes
for FY18 and 38-39 million tonnes for FY19.
Hopeful of EBITDA per tonne going up by 1-2 percent from the current 53
percent.
Focus is on commissioning the steel plant in the first half of next year. Would
require, Rs 5000-6000 crore more to commission the plant. The company
already has spent around Rs 13000 crore.
As of now looking to fund the commissioning of the plant through internal
resources and later may look at borrowing. The current cash on the book stands
at Rs 5500 crore.
2. BAJAJ AUTO: November sales increase 21% to 3.26 lakh units,
exports grow 27%; S Ravikumar, President-Business
Development
Current market share in domestic bike segment close to 19 percent and
targeting domestic share of 22-23 percent by March 2018.
Expect strong run-rate in 3-wheeler segment to continue after stellar
performance in November.
Expects 17 lakh exports by end of the year.
Two new launches would hit the market in January 2018.
3. EQUITAS: Seen good growth in used CV & LCV financing; look
to grow it going forward; PN Vasudevan, MD & CEO
Growth in the light commercial vehicle (LCV) has been very strong in the first
half and continues to be so even in the month of October.
Seen good growth in used commercial vehicle and LCV financing.
Have gained market share in CV financing.
Now financing 600-700 CV units a month and that is something that company
would look to grow.
4 December 2017
18

From the think tank
1. Rupee downward turn trigger may be a global equity collapse
early next year
From time to time, the financial papers print forecasts of the future of the rupee,
taking inputs from banks, consultants and other interested parties. These are
always herd-like with most forecasts bunched narrowly around the current value;
if the market has been trending, there will sometimes be a few forecasts following
the trend. We contribute to these group forecasts as well, even though we know
full well1and always say as much to the journalist—that 3-month or 6-month
forecasts are meaningless. Only very short-term forecasts—a couple of days or
even a few hours—can work to make money, provided you run a professional
dealing operation with a very disciplined stop-loss and sound money
management. This is, of course, not an activity for a company that has a running
business with embedded FX risk.
2. Net neutrality: Telcos too have a reason to cheer TRAI
announcement
Much to the relief of internet start-ups, internet users and internet activists, the
Telecom Regulatory Authority of India (Trai) has finally come out with its
recommendations on net neutrality—after a long-drawn consultation process,
one that lasted over two years. Momentarily, some of us were concerned that
the winds blowing from the US would cloud the issue in India too. But, Trai
deserves full credit; its recommendations are near-perfect. Little doubt,
therefore, among certain sections there is a sense of joy at the smell of a
victory. The organisation that I represent had some contribution in determining
the direction that the recommendations have taken; and the recommendations
give us enough and more reasons to celebrate. Critics with extreme views will
say that this is no victory at all. That this is just a set of recommendations to the
government and not binding at all. There could be much truth in this assertion.
We are all aware of the many slips between the cup and the lip, and the law
may take a course quite different from the recommendations.
3. Credit ratings, GST and the ease of doing business
The upgrade of India’s sovereign rating by Moody’s in mid-November lifted the
national mood. Even people in Delhi paused in the midst of gasping in toxic air, and
cheered feebly. In financial terms, the rating upgrade does not make a huge
difference. It was more in the nature of a follower action to the confidence
reposed in India by global investors, after nearly 14 years of no upgrades, with an
interlude in 2012 when there was threat of a downgrade. Both the 2012 threat and
the earlier upgrade in 2004 had to do with fiscal metrics. In 2004, it was a reward
for having enacted the first Fiscal Responsibility and Budget Management Act,
although the Act was actually notified only by the successor government after the
general election. The decision by Standard and Poor’s not to upgrade in 2017 also
had to do with fiscal metrics, which in their judgement did not look sufficiently
promising.
4 December 2017
19

International
4. Large organizations are better at R&D
Start-ups, incubators, accelerators, angel capital, venture capital, mergers and
acquisitions, initial public offerings, a liquid stock market, techno-parks, a major
university or two, and a group of specialized law firms. Many believe that once
you have built up this ecosystem, à la Silicon Valley, you can become the next
Route 128 in Massachusetts, the next Research Triangle in North Carolina, or the
next Start-Up Israel. But, while success breeds imitation, the opposite is often
not the case. Complex structures with many interdependent pieces are not
created out of whole cloth. They emerge from idiosyncratic path-dependent
processes, whereby each organizational innovation changes the ecosystem,
making other changes feasible. Trying to copy the resulting ecosystem is like
trying to build a bridge with no scaffolding: It cannot be done, because the
structure cannot bear its own weight while it is being built.
4 December 2017
20

Click excel icon
for detailed
valuation guide
CMP
(INR)
TP
% Upside
EPS (INR)
(INR) Downside FY17 FY18E FY19E
11
12
31
23
0
21
18
3
0
24
6
18
15
44
5
28.0
4.6
141.1
13.1
473.1
93.3
612.7
23.5
20.0
8.1
169.1
54.3
5.4
248.6
19.8
11.7
28.3
34.2
4.5
6.2
155.4 187.9
19.1
26.0
457.8 603.0
82.5 116.9
814.7 1,062.7
27.6
36.7
35.8
45.9
7.9
9.7
183.1 193.9
75.0
85.7
9.9
11.8
288.1 381.0
24.6
64.8
14.9
25.8
Valuation snapshot
P/E (x)
P/B (x)
ROE (%)
FY17 FY18E FY17 FY18E FY17 FY18E FY19E
27.6
26.4
22.8
52.4
42.2
18.7
47.8
55.3
34.5
25.2
21.3
25.9
45.2
34.6
20.1
61.7
29.7
34.7
25.9
27.9
22.5
32.5
20.0
18.2
34.6
NM
37.4
43.7
12.7
21.0
30.3
28.0
NM
19.3
39.0
13.4
NM
27.5
1,050.7
19.5
118.7
NA
53.5
46.5
28.2
27.9
20.3
62.4
35.4
83.2
16.7
27.4
26.7
20.7
35.8
43.7
21.1
36.0
47.0
19.2
25.9
19.7
18.8
24.6
29.9
16.2
48.6
25.1
29.0
21.3
81.3
19.6
26.8
22.4
19.6
27.3
18.0
31.4
31.8
17.1
17.2
25.5
9.4
58.9
22.5
9.3
10.7
7.3
20.1
21.4
NM
20.8
51.8
37.4
32.2
21.2
21.7
16.0
51.4
32.2
78.9
13.7
5.1
5.7
5.5
7.8
6.9
2.9
14.9
10.6
3.5
3.5
7.1
3.3
2.8
7.2
2.3
14.3
5.1
2.4
2.7
2.1
2.1
5.5
2.3
1.3
4.8
0.7
4.8
4.6
1.2
3.3
3.5
1.1
0.8
0.8
0.5
1.3
0.3
1.0
1.5
0.5
1.0
NA
10.2
5.5
3.0
4.6
2.4
18.7
6.6
NA
4.0
4.4
5.2
4.9
6.7
6.3
2.6
11.3
8.9
3.0
3.2
6.2
2.9
2.5
6.2
2.0
11.7
4.5
2.0
2.2
2.1
1.7
4.8
2.4
1.2
4.3
0.7
4.3
3.3
1.2
2.8
3.0
1.0
0.9
0.7
0.5
1.2
0.3
0.9
1.4
0.6
1.0
4.9
6.0
4.5
2.6
3.9
2.1
15.3
5.9
NA
3.6
20.3
23.1
26.9
16.2
15.8
16.9
37.1
20.8
10.6
13.9
35.7
14.2
6.4
20.3
9.8
25.6
17.2
6.9
10.8
9.5
9.9
18.3
10.9
7.2
15.3
-27.0
13.8
12.3
9.0
18.9
11.5
4.0
-6.7
4.2
1.4
10.1
-8.4
3.6
-0.2
2.7
0.9
0.0
21.6
15.1
12.0
18.0
14.4
32.5
18.9
25.5
25.5
17.3
20.4
25.0
20.1
15.2
13.0
35.7
20.5
16.8
12.5
33.7
14.5
10.8
20.5
13.4
26.5
17.9
7.3
11.5
2.6
9.6
18.8
8.8
6.3
16.9
4.0
14.8
12.4
6.7
17.3
11.9
6.4
1.5
3.4
5.8
11.6
4.6
4.7
7.0
-4.7
4.6
12.5
20.2
15.3
13.2
19.6
14.1
32.8
19.3
22.7
27.6
18.1
25.2
26.8
23.2
18.1
16.2
35.0
22.8
18.4
13.7
31.1
14.6
11.5
23.0
28.3
35.6
22.8
10.8
11.8
8.2
10.0
20.4
10.5
6.9
19.0
8.0
16.5
13.7
12.6
19.5
13.9
9.4
4.3
6.1
7.3
12.7
5.4
7.1
11.4
2.1
7.7
12.3
20.4
19.3
15.4
19.6
15.3
32.8
18.6
22.2
30.7
Company
Automobiles
Amara Raja
Ashok Ley.
Bajaj Auto
Bharat Forge
Bosch
CEAT
Eicher Mot.
Endurance Tech.
Escorts
Exide Ind
Hero Moto
M&M
Mahindra CIE
Maruti Suzuki
Tata Motors
TVS Motor
Aggregate
Banks - Private
Axis Bank
DCB Bank
Equitas Hold.
Federal Bank
HDFC Bank
ICICI Bank
IDFC Bank
IndusInd
J&K Bank
Kotak Mah. Bk
RBL Bank
South Indian
Yes Bank
Aggregate
Banks - PSU
BOB
BOI
Canara
IDBI Bk
Indian Bk
OBC
PNB
SBI
Union Bk
Aggregate
NBFCs
Aditya Birla Cap
Bajaj Fin.
Bharat Fin.
Capital First
Cholaman.Inv.&Fn
Dewan Hsg.
GRUH Fin.
HDFC
HDFC Stand. Life
Indiabulls Hsg
Reco
Buy
Buy
Buy
Buy
Neutral
Buy
Buy
Buy
Sell
Buy
Neutral
Buy
Not Rated
Buy
Buy
Neutral
774
856
120
134
3,213 4,197
685
844
19,986 19,965
1,744 2,116
29,303 34,722
1,298 1,334
689
688
205
254
3,607 3,819
1,409 1,658
242
-
8,608 9,866
399
575
724
764
Buy
Neutral
Buy
Buy
Buy
Buy
Neutral
Buy
Buy
Buy
Buy
Buy
Buy
534
181
141
108
1,844
305
55
1,662
74
1,005
520
32
307
680
197
209
146
2,150
355
56
2,000
100
1,179
665
36
382
27
9
48
35
17
16
3
20
34
17
28
14
25
15.4
7.0
5.0
4.8
56.8
15.3
3.0
48.1
-31.3
26.8
11.9
2.5
14.6
18.4
8.5
1.7
5.5
68.7
13.6
2.8
60.9
4.1
32.1
16.4
1.9
17.8
30.8
10.5
5.7
6.6
84.7
17.0
3.2
78.6
8.7
41.6
23.0
3.8
23.3
Buy
Neutral
Neutral
Neutral
Buy
Neutral
Buy
Buy
Neutral
168
187
363
60
391
124
171
313
158
201
201
386
49
438
150
250
415
175
20
7
6
-17
12
21
46
33
11
6.0
-14.8
18.8
1.5
29.3
-31.6
6.2
0.3
8.1
17.9
3.2
16.1
6.4
36.7
17.1
8.5
14.6
-13.5
22.6
9.2
30.3
8.6
44.0
21.4
13.5
26.8
6.0
Buy
Buy
Under Review
Buy
Buy
Buy
Neutral
Buy
Buy
Buy
192
1,712
977
695
1,282
600
508
1,659
372
1,144
231
2,300
-
925
1,500
690
500
2,000
370
1,550
20
34
33
17
15
-2
21
-1
35
0.0
32.0
21.0
24.6
46.0
29.6
8.1
46.8
4.5
68.6
3.7
45.7
30.3
32.8
59.2
37.6
9.9
51.6
4.7
83.6
5.4
63.7
47.2
43.7
70.4
46.0
12.0
57.1
5.4
105.1
4 December 2017
21

Click excel icon
for detailed
valuation guide
CMP
(INR)
168
571
101
443
441
1,331
611
2,048
1,327
TP
% Upside
EPS (INR)
(INR) Downside FY17 FY18E FY19E
240
43
5.2
6.9
10.4
680
19
38.2 41.0
46.5
-
8.6
9.2
9.7
500
13
7.1
14.2
19.1
550
25
29.5 42.6
42.0
1,750
31
31.6 52.5
66.5
800
31
29.1 36.0
41.9
2,650
29
84.3 115.6 145.3
1,500
13
22.2 15.5
11.8
Valuation snapshot
P/E (x)
P/B (x)
ROE (%)
FY17 FY18E FY17 FY18E FY17 FY18E FY19E
32.0
24.1
3.8
3.3
12.4 14.9 18.9
14.9
13.9
2.6
2.3
19.1 17.4 17.2
11.7
11.0
2.6
2.3
24.0 22.3 21.4
62.6
31.3
3.9
3.6
6.4
11.9 14.8
14.9
10.3
2.7
2.3
19.4 23.8 19.9
42.1
25.3
4.0
3.6
13.8 15.0 16.7
21.0
17.0
3.4
2.8
17.4 18.0 17.6
24.3
17.7
2.7
2.4
11.7 14.3 15.9
59.8
85.8
2.7
2.4
11.7 15.1 17.4
33.3
26.6
5.4
4.6
16.1 17.2 17.9
70.5
29.3
67.8
57.9
57.3
20.5
31.9
72.1
53.2
26.5
28.7
65.7
55.9
35.7
19.9
39.9
37.4
53.9
46.4
39.8
80.3
16.9
29.9
29.2
58.7
25.5
NM
405.9
NM
44.7
43.4
37.7
54.0
65.1
48.5
47.1
49.8
51.6
38.9
63.8
30.4
34.3
68.6
26.0
31.0
45.2
51.7
58.3
33.4
43.9
44.1
22.0
24.7
59.3
43.9
36.9
17.3
35.2
32.1
38.0
32.1
35.3
51.2
14.0
28.8
20.6
33.7
25.6
25.7
40.4
36.7
35.3
40.8
30.2
52.7
56.8
44.0
44.1
49.7
46.1
37.8
54.9
28.0
42.0
9.0
6.0
1.0
9.4
31.1
1.3
6.3
10.2
9.7
5.1
3.4
6.1
10.3
4.9
3.3
6.2
3.9
2.7
3.6
2.6
5.6
1.7
1.0
3.9
3.5
4.4
3.4
5.8
2.3
7.8
4.8
3.5
14.3
21.4
22.0
12.4
17.1
12.5
8.2
41.8
6.9
6.4
7.9
4.7
1.0
8.9
22.8
1.2
5.8
8.9
8.6
4.3
3.1
5.4
8.6
4.5
2.8
5.5
3.5
2.6
3.5
2.5
5.0
1.5
1.0
3.3
3.2
3.8
3.0
5.2
2.2
6.5
4.3
3.2
14.0
17.7
20.9
10.6
14.6
9.8
8.0
41.6
6.8
6.6
12.7
20.6
1.5
18.0
76.4
6.2
21.2
12.4
18.2
19.2
12.5
9.3
19.8
14.3
16.9
18.0
10.3
5.1
7.9
7.1
7.2
10.8
3.4
14.4
6.1
19.0
-3.2
1.4
-0.6
18.4
11.6
9.3
28.5
36.9
50.4
28.4
35.8
24.6
22.2
66.5
23.5
21.1
11.6
17.9
3.3
20.2
51.0
2.1
18.1
21.8
19.5
19.5
13.1
9.1
21.4
12.6
17.5
16.5
11.0
7.0
11.1
7.3
10.3
11.5
3.5
17.5
9.9
16.0
12.3
13.7
6.1
20.0
11.1
10.6
26.9
34.0
48.7
26.0
31.7
23.8
21.4
75.9
24.4
15.5
14.6
18.1
3.3
27.8
49.8
3.3
22.2
22.6
21.2
20.2
14.0
13.1
21.5
13.2
16.4
16.3
12.1
8.0
14.2
12.0
12.7
14.5
6.0
19.2
13.9
17.9
15.6
21.3
11.3
17.4
14.2
12.9
29.4
35.2
56.2
27.3
34.0
22.9
22.6
88.0
25.6
18.3
Company
Reco
L&T Fin Holdings Buy
LIC Hsg Fin
Neutral
Manappuram
Not Rated
M&M Fin.
Buy
Muthoot Fin
Neutral
PNB Housing
Buy
Repco Home
Buy
Shriram City Union Buy
STF
Buy
Aggregate
Capital Goods
ABB
Sell
Bharat Elec.
Buy
BHEL
Sell
Blue Star
Neutral
CG Cons. Elec.
Buy
CG Power & Indu. Neutral
Cummins
Buy
GE T&D
Neutral
Havells
Neutral
K E C Intl
Neutral
L&T
Buy
Siemens
Neutral
Solar Ind
Neutral
Thermax
Neutral
Va Tech Wab.
Buy
Voltas
Neutral
Aggregate
Cement
Ambuja Cem.
Neutral
ACC
Neutral
Birla Corp.
Buy
Dalmia Bharat
Buy
Grasim Inds.
Neutral
India Cem
Neutral
J K Cements
Buy
JK Lakshmi Ce
Buy
Ramco Cem
Buy
Orient Cem
Buy
Prism Cem
Buy
Sagar Cements
Not Rated
Shree Cem
Buy
Ultratech
Buy
Aggregate
Consumer
Asian Paints
Neutral
Britannia
Buy
Colgate
Buy
Dabur
Buy
Emami
Buy
Godrej Cons.
Neutral
GSK Cons.
Neutral
HUL
Buy
ITC
Neutral
Jyothy Lab
Neutral
1,390
185
91
745
268
84
846
413
508
314
1,213
1,171
1,152
1,102
596
617
1,230
210
78
685
260
90
1,150
440
570
350
1,450
1,313
1,120
930
745
550
-11
14
-14
-8
-3
7
36
7
12
12
20
12
-3
-16
25
-11
19.7
6.3
1.3
12.9
4.7
4.1
26.5
5.7
9.6
11.9
42.3
17.8
20.6
30.8
29.9
15.5
20.2
7.1
2.9
16.5
5.2
1.4
25.3
9.4
11.5
14.3
49.0
19.8
26.2
29.9
34.5
17.5
28.7
8.0
3.0
24.4
6.5
2.3
35.0
11.2
14.3
17.6
57.5
31.0
31.3
34.4
37.2
19.6
264
314
1,677 1,797
1,137 1,435
3,112 3,517
1,149 1,302
168
188
986
1,324
409
512
695
853
162
205
111
128
857
-
17,174 21,852
4,173 4,906
19
7
26
13
13
12
34
25
23
27
16
27
18
4.9
6.9
36.1 52.2
28.5 32.2
38.8 60.8
67.8 81.9
5.6
5.8
33.7 47.8
7.0
12.1
27.3 27.1
-1.6
6.3
0.3
2.7
-1.9 23.4
384.4 486.2
96.1 102.2
8.4
70.9
56.7
83.7
116.8
10.5
61.8
19.1
35.1
9.1
5.0
47.4
499.3
147.1
1,136
4,799
1,030
341
1,320
975
6,078
1,252
255
386
1,280
5,845
1,325
410
1,435
1,015
5,400
1,500
280
365
13
22
29
20
9
4
-11
20
10
-5
21.0 21.6
73.7 84.5
21.2 23.4
7.2
7.7
26.5 26.6
18.9 21.2
156.1 160.8
19.6 22.8
8.4
9.1
11.2
9.2
25.8
106.9
28.6
9.3
33.2
24.5
182.3
27.6
10.0
10.9
4 December 2017
22

Click excel icon
for detailed
valuation guide
CMP
TP
% Upside
(INR) (INR) Downside
309
340
10
7,704 7,750
1
21,813 25,580
17
242
275
14
851
975
15
9,495 9,267
-2
162
-
1,057 1,320
25
3,212 2,970
-8
EPS (INR)
FY18E FY19E
6.5
7.9
128.4 149.0
296.6 413.1
8.9
12.4
17.2
20.8
151.5 176.7
3.5
6.4
14.7
18.0
34.9
53.7
Valuation snapshot
P/E (x)
FY17 FY18E
49.2
47.5
62.3
60.0
91.4
73.5
67.1
27.1
50.9
49.5
71.4
62.7
46.0
46.8
121.8 72.1
120.1 92.0
48.2
43.9
23.6
26.4
23.3
17.1
43.8
30.1
37.6
25.9
30.7
13.9
14.1
17.2
71.5
33.1
18.7
14.4
34.0
46.2
24.9
20.1
42.2
23.2
24.0
NM
10.9
22.6
34.6
21.8
23.6
29.0
25.4
15.1
73.2
24.4
28.3
31.9
36.8
76.3
14.6
15.6
55.6
28.7
15.7
21.7
31.6
35.7
19.2
36.6
34.0
25.6
28.1
134.6
9.7
20.3
26.5
18.2
16.7
31.6
30.0
28.0
8.5
14.2
25.8
79.2
16.6
NM
64.3
P/B (x)
ROE (%)
FY17 FY18E FY17 FY18E FY19E
17.2 14.9 36.7 33.6 37.1
24.6 22.3 40.9 39.0 40.9
36.5 29.3 40.0 39.8 44.4
3.1
2.8
6.0
10.8 13.3
13.2 10.9 28.2 24.1 23.9
44.7 37.1 39.3 64.8 62.9
2.3
2.2
5.2
4.9
8.5
12.0 10.5 10.2 15.5 16.5
24.1 16.8 21.3 18.2 20.9
13.3 12.4 27.6 28.2 29.5
5.1
5.3
7.5
4.2
5.5
6.3
3.8
5.1
3.0
1.3
3.5
3.1
10.4
2.7
3.1
2.7
5.8
5.7
2.6
3.5
8.5
5.0
4.0
2.7
1.5
4.2
3.9
2.4
2.5
17.8
3.5
2.6
2.2
2.8
3.8
17.5
4.2
2.1
4.1
4.4
4.6
6.0
3.3
5.3
5.3
3.4
5.3
2.9
1.1
2.9
2.2
12.2
2.5
2.7
2.5
5.4
4.9
2.3
3.3
7.0
4.4
3.6
2.5
1.3
3.6
3.5
2.1
2.2
13.5
3.4
2.5
2.0
2.3
3.5
14.3
3.5
2.3
3.9
23.0
21.9
36.7
27.6
12.3
23.0
10.2
22.0
9.7
10.0
24.7
21.1
14.5
8.6
18.0
20.9
17.1
14.4
10.8
18.1
22.2
23.8
16.8
-0.6
14.0
20.7
12.0
11.0
13.7
50.5
10.8
7.3
12.4
16.7
12.3
25.1
24.6
-19.1
6.7
19.9
17.0
26.4
24.6
7.2
23.4
12.1
16.3
8.2
1.6
19.6
17.7
22.0
9.2
18.4
12.0
17.1
14.7
12.9
9.2
22.5
18.3
12.9
1.9
14.1
19.1
13.8
11.8
14.1
48.6
11.5
9.2
19.4
17.8
13.6
19.9
22.8
-6.4
6.3
19.8
19.4
25.7
22.3
11.4
26.1
13.6
21.2
14.1
3.9
18.4
18.8
31.4
12.0
19.2
12.5
17.6
20.5
18.3
13.7
20.7
19.9
15.4
7.0
12.9
17.0
12.5
11.6
15.4
46.8
14.1
11.7
25.4
18.6
16.1
35.2
22.2
0.2
10.1
Company
Marico
Nestle
Page Inds
Parag Milk
Pidilite Ind.
P&G Hygiene
Prabhat Dairy
United Brew
United Spirits
Aggregate
Healthcare
Alembic Phar
Alkem Lab
Ajanta Pharma
Aurobindo
Biocon
Cadila
Cipla
Divis Lab
Dr Reddy’s
Fortis Health
Glenmark
Granules
GSK Pharma
IPCA Labs
Jubilant Life
Lupin
Sanofi India
Shilpa Medicare
Strides Shasun
Sun Pharma
Syngene Intl
Torrent Pharma
Aggregate
Infrastructure
Ashoka Buildcon
IRB Infra
KNR Constructions
Sadbhav
Engineering
Aggregate
Logistics
Allcargo Logistics
Blue Dart
Concor
Gateway
Distriparks
Gati
Transport Corp.
Aggregate
Media
Dish TV
D B Corp
Den Net.
Ent.Network
Reco
Neutral
Neutral
Buy
Neutral
Buy
Neutral
Not Rated
Buy
Neutral
FY17
6.3
123.7
238.7
3.6
16.7
132.9
3.5
8.7
26.7
Neutral
Buy
Buy
Buy
Neutral
Buy
Neutral
Neutral
Neutral
Buy
Neutral
Buy
Neutral
Neutral
Buy
Buy
Buy
Buy
Buy
Buy
Not Rated
Neutral
510
1,972
1,337
673
447
427
597
1,034
2,230
144
555
124
2,456
532
693
814
4,391
648
803
526
549
1,278
540
2,500
1,606
900
335
555
600
1,100
2,575
185
650
200
2,500
550
861
1,000
5,000
797
1,214
610
-
1,400
6
27
20
34
-25
30
0
6
15
29
17
61
2
3
24
23
14
23
51
16
10
21.6 21.6
74.6 68.0
57.3 52.7
39.3 44.6
10.2
6.1
14.2 17.5
15.9 21.1
39.9 32.4
72.6 60.6
10.3
1.9
39.3 37.9
7.2
8.0
34.4 44.2
16.1 18.6
36.9 44.2
56.6 37.6
129.1 139.0
14.0 18.1
32.3 41.8
26.1 14.4
13.0 16.1
55.2 50.0
24.9
89.5
64.1
50.3
10.5
23.7
27.0
43.7
115.2
4.9
42.8
11.0
54.9
26.5
55.0
42.7
156.2
29.9
69.2
22.9
18.0
61.4
Buy
Neutral
Buy
Buy
244
222
270
379
260
240
295
435
7
8
9
15
-0.5
20.3
12.0
11.0
1.8
22.9
13.3
14.3
7.1
23.2
14.1
14.5
Buy
Not Rated
Neutral
Buy
Not Rated
Not Rated
181
4,106
1,281
246
135
300
215
-
1,496
282
-
-
19
17
15
9.8
10.9
102.5 129.9
38.0 42.7
6.8
8.4
16.9
8.8
15.9
21.0
13.3
163.2
55.2
11.6
23.9
25.9
18.4
40.0
33.7
36.1
16.2
17.7
30.8
78.4
18.1
NM
65.1
Buy
Buy
Neutral
Neutral
80
361
100
744
106
430
90
910
32
19
-10
22
1.0
20.0
-9.3
11.4
1.0
21.7
-2.9
11.6
2.4
25.4
0.1
20.1
4 December 2017
23

Click excel icon
for detailed
valuation guide
CMP
(INR)
246
102
164
379
1,278
99
26
855
558
TP
% Upside
EPS (INR)
(INR) Downside FY17 FY18E FY19E
302
23
25.8 25.6
30.2
113
11
7.4
10.4
11.9
225
37
10.7 11.3
13.4
469
24
6.4
9.0
14.2
1,640
28
20.5 27.1
43.0
130
32
1.2
3.1
6.1
27
5
-1.9
-0.8
0.1
1,005
17
24.9 28.1
35.7
630
13
12.1 10.5
16.0
Valuation snapshot
P/E (x)
P/B (x)
ROE (%)
FY17 FY18E FY17 FY18E FY17 FY18E FY19E
9.5
9.6
1.5
1.3
18.2 15.0 15.3
13.8
9.8
1.1
1.0
7.9
10.2 10.6
15.4
14.5
2.5
2.5
18.5 17.3 19.3
59.0
42.0
3.9
3.6
11.2
9.0
12.6
62.2
47.2
6.2
5.5
10.4 12.4 17.0
80.7
32.0
5.3
4.5
7.6
15.3 24.8
NM
NM
4.2
4.9 -29.4 -14.2
2.4
34.4
30.5
8.4
7.7
26.0 26.4 30.7
46.0
53.4
6.3
5.7
17.0 12.8 16.8
42.5
36.5
5.3
4.9
12.6 13.5 17.2
27.5
15.1
NM
17.0
21.8
12.9
NM
35.9
19.0
17.9
25.2
10.3
20.2
53.6
22.8
10.1
9.3
36.1
24.9
8.3
18.7
10.9
21.4
18.8
14.1
175.0
36.7
89.2
77.6
18.4
13.9
24.8
15.3
13.5
18.2
21.3
18.5
16.6
17.4
32.6
19.7
12.5
13.1
NM
12.4
17.4
9.7
NM
13.6
11.3
11.5
14.9
11.5
16.2
37.6
16.6
11.3
9.8
31.6
20.1
13.4
12.1
9.5
16.3
16.0
13.1
81.7
26.0
64.4
54.2
15.6
13.1
20.8
15.0
13.5
16.4
18.6
17.1
14.5
15.2
27.1
20.0
1.8
4.1
0.5
2.7
1.5
1.8
0.8
3.9
1.8
2.1
1.8
3.2
2.0
7.2
2.5
3.1
1.8
7.6
5.8
2.1
1.0
1.0
4.5
2.0
1.9
14.3
4.6
16.8
11.9
3.0
3.5
6.0
3.2
2.0
6.7
3.5
2.5
2.2
2.7
10.2
5.9
1.6
4.4
0.5
2.3
1.5
1.7
0.9
3.1
1.6
1.9
1.7
2.7
1.9
6.2
2.3
2.6
1.6
6.4
5.2
1.9
1.0
1.0
3.8
1.8
1.7
13.5
4.0
13.6
10.0
2.7
3.3
5.2
3.4
1.8
5.1
3.4
2.8
2.2
2.6
8.2
6.3
7.4
24.4
-7.9
17.3
7.2
12.8
-9.9
10.9
9.7
15.7
7.0
32.4
9.6
14.0
11.6
32.4
20.7
21.0
24.5
31.4
5.7
10.1
23.2
11.6
13.1
8.2
14.6
20.6
15.3
16.2
27.5
26.5
22.0
14.3
41.6
16.8
13.2
13.7
17.0
37.1
32.6
13.6
32.3
-4.7
19.8
8.6
15.7
-6.9
25.2
15.1
17.1
11.4
25.2
12.0
17.8
14.4
25.1
17.2
22.0
27.3
15.1
8.0
10.8
25.2
12.1
12.9
16.5
16.5
23.4
18.5
17.4
25.9
26.4
21.8
14.1
35.2
17.3
14.6
15.1
17.9
33.6
30.6
16.5
42.5
0.1
20.2
10.1
16.3
-4.9
29.7
23.8
16.6
15.3
25.8
12.6
22.1
14.0
25.0
16.9
21.0
24.4
16.7
10.4
12.5
23.7
12.0
13.5
20.9
17.5
25.5
20.9
18.3
25.6
23.4
22.5
14.5
29.6
21.2
17.3
16.4
20.8
32.4
33.5
Company
Hind. Media
HT Media
Jagran Prak.
Music Broadcast
PVR
Prime Focus
Siti Net.
Sun TV
Zee Ent.
Aggregate
Metals
Hindalco
Hind. Zinc
JSPL
JSW Steel
Nalco
NMDC
SAIL
Rain Industries
Vedanta
Tata Steel
Aggregate
Oil & Gas
BPCL
GAIL
Gujarat Gas
Gujarat St. Pet.
HPCL
IOC
IGL
Mahanagar Gas
MRPL
Oil India
ONGC
PLNG
Reliance Ind.
Aggregate
Retail
Jubilant Food
PC Jeweller
Titan Co.
Aggregate
Technology
Cyient
HCL Tech.
Hexaware
Infosys
KPIT Tech
L&T Infotech
Mindtree
Mphasis
NIIT Tech
Persistent Sys
Tata Elxsi
TCS
Reco
Buy
Neutral
Buy
Buy
Buy
Buy
Neutral
Buy
Buy
Buy
Neutral
Buy
Buy
Neutral
Buy
Sell
Buy
Buy
Neutral
236
297
169
252
81
129
78
346
287
681
326
322
209
297
87
187
43
492
394
672
38
8
24
18
7
45
-45
42
37
-1
8.6
19.7
-20.9
14.8
3.7
10.0
-10.1
9.6
15.1
37.9
18.8
22.7
-15.1
20.3
4.7
13.3
-6.4
25.5
25.5
59.4
26.4
33.5
0.5
24.9
5.8
12.7
-4.3
38.9
44.4
65.2
Buy
Sell
Buy
Neutral
Buy
Buy
Buy
Neutral
Sell
Buy
Buy
Buy
Buy
496
456
860
201
409
388
317
1,096
123
361
180
244
910
643
378
1,011
184
579
554
404
1,219
110
418
231
312
1,077
30
-17
18
-8
41
43
27
11
-11
16
29
28
18
48.3
22.6
16.1
8.8
40.7
41.9
8.8
44.0
14.8
19.3
16.4
11.4
48.3
43.1
28.1
22.9
12.1
36.4
39.5
10.0
54.4
9.2
29.8
19.0
15.0
56.7
52.1
31.9
33.6
13.2
42.8
43.6
11.3
53.8
11.5
40.5
22.8
16.7
62.1
Sell
Buy
Buy
1,751
392
806
1,270
490
850
-27
25
6
10.0
10.7
9.0
21.4
15.1
12.5
27.4
18.4
15.9
Buy
Neutral
Neutral
Buy
Neutral
Buy
Buy
Neutral
Neutral
Buy
Buy
Neutral
562
830
340
959
161
1,011
530
721
632
656
918
2,631
600
970
270
1,100
160
950
600
670
600
780
1,004
2,450
7
17
-21
15
0
-6
13
-7
-5
19
9
-7
30.6 36.0
59.8 63.2
13.7 16.3
62.8 63.8
11.9 11.9
55.5 61.6
24.9 28.5
38.9 42.0
38.0 43.7
37.7 43.3
28.1 33.8
133.4 131.8
41.9
68.2
17.0
67.8
14.1
66.0
35.1
46.0
50.3
52.4
40.2
151.4
4 December 2017
24

Click excel icon
for detailed
valuation guide
CMP
(INR)
473
289
849
TP
% Upside
EPS (INR)
(INR) Downside FY17 FY18E FY19E
560
18
30.9 35.8
37.7
280
-3
16.9 19.1
20.1
1,020
20
52.1 52.8
72.7
Valuation snapshot
P/E (x)
P/B (x)
ROE (%)
FY17 FY18E FY17 FY18E FY17 FY18E FY19E
15.3
13.2
2.5
2.4
18.4 18.9 18.2
17.1
15.1
2.7
2.6
16.9 17.0 16.7
16.3
16.1
2.6
2.3
17.2 15.3 18.4
17.6
17.4
4.0
4.2
22.9 24.4 23.2
42.7
25.9
NM
68.1
45.4
18.2
19.2
21.8
15.1
14.5
12.2
16.4
35.1
145.4
53.9
22.7
29.5
30.7
85.7
33.6
26.2
8.8
82.6
28.2
61.9
38.7
28.6
22.8
92.5
28.7
37.6
21.3
35.5
56.4
13.5
49.3
63.2
128.7 2.9
22.8
4.6
NM
1.4
125.2 12.2
-311.7 3.0
15.5
11.2
20.8
13.5
11.6
12.4
13.8
41.3
93.1
45.8
20.5
31.7
21.1
46.2
30.2
17.9
14.2
54.7
15.8
39.6
36.3
23.5
19.7
29.7
32.1
26.1
23.9
39.0
50.9
10.8
47.2
50.4
6.9
1.2
1.3
1.5
2.1
2.1
2.4
3.2
18.1
7.1
1.9
33.4
5.1
6.6
10.9
11.5
2.7
8.0
3.7
3.9
3.6
8.0
5.6
12.5
8.1
3.2
3.4
4.6
9.8
1.6
8.9
15.1
2.8
4.6
1.8
13.2
3.1
6.6
1.1
1.3
1.4
1.9
1.9
2.2
3.0
15.9
6.3
1.9
30.3
4.4
4.4
8.7
6.6
2.2
7.1
3.9
3.6
3.7
7.3
4.8
5.1
6.8
2.9
3.0
4.2
8.2
1.5
8.1
12.3
6.8
16.2
-1.6
48.4
6.6
37.8
6.5
6.3
10.5
15.6
17.1
14.4
10.3
17.9
2.2
20.2
-26.6
10.1
-1.0
42.4
10.7
6.3
11.0
17.0
16.0
15.7
7.4
18.2
3.7
22.8
-41.4
30.0
0.2
47.7
11.1
5.0
11.9
17.4
14.6
16.8
10.9
22.9
15.7
8.0
96.1
23.4
12.9
31.5
43.0
18.5
13.7
27.4
13.5
15.9
34.5
27.9
16.4
22.9
15.3
16.3
15.1
22.2
16.1
20.7
28.8
Company
Reco
Tech Mah
Buy
Wipro
Neutral
Zensar Tech
Buy
Aggregate
Telecom
Bharti Airtel
Buy
Bharti Infratel
Neutral
Idea Cellular
Buy
Tata Comm
Buy
Aggregate
Utiltites
Coal India
Buy
CESC
Buy
JSW Energy
Sell
NTPC
Buy
Power Grid
Buy
Tata Power
Sell
Aggregate
Others
Arvind
Neutral
Avenue
Sell
Supermarts
Bata India
Sell
BSE
Neutral
Castrol India
Buy
Coromandel Intl Buy
Delta Corp
Buy
Eveready Inds.
Buy
Interglobe
Neutral
Indo Count
Neutral
Info Edge
Buy
Kaveri Seed
Buy
Manpasand
Buy
MCX
Buy
Monsanto
Buy
Navneet Education Buy
Quess Corp
Buy
PI Inds.
Buy
Piramal Enterp.
Buy
SRF
Buy
S H Kelkar
Buy
Team Lease Serv. Buy
Trident
Buy
TTK Prestige
Neutral
V-Guard
Neutral
483
385
93
680
680
440
110
780
41
14
18
15
11.3
14.9
-1.1
10.0
3.8
16.8
-16.1
5.4
6.5
19.2
-18.0
18.2
272
995
84
181
203
90
335
1,360
51
211
261
72
23
37
-39
16
29
-20
14.9
51.9
3.8
12.0
14.0
7.4
17.5
89.1
4.0
13.4
17.4
7.3
20.7
102.1
3.3
15.7
20.4
7.5
435
1,115
729
930
401
510
262
433
1,132
114
1,294
538
393
961
2,466
166
925
959
2,728
1,831
258
2,190
89
6,505
226
425
873
578
1,100
467
523
257
400
1,291
128
1,300
738
492
1,300
3,293
209
1,170
890
3,266
1,992
301
2,300
114
5,281
167
-2
-22
-21
18
16
3
-2
-8
14
12
0
37
25
35
34
26
27
-7
20
9
17
5
28
-19
-26
12.4
7.7
10.5
12.0
16.5
17.5
19.3
46.1
13.3
29.0
8.0
17.4
75.4
10.7
26.2
41.0
15.4
43.4
126.6
10.4
32.7
35.6
149.7
104.9
9.7
66.4
10.4
176.1
6.0
13.5 15.9
41.0 45.3
13.6 12.6
16.6 24.1
3.1
5.7
12.9 14.3
43.2 63.2
13.0
8.0
15.7 23.6
19.1 34.1
6.3
9.9
24.8 26.5
86.2 105.0
7.3
8.4
10.0 31.1
33.4 29.9
72.6 104.6
85.9 76.7
7.2
6.6
38.8 43.0
6.6
8.3
132.1 137.8
3.6
4.5
13.9 14.6
8.3
9.3
115.0 100.3
17.5 22.5
8.1
12.1
37.7 32.1
51.0 46.8
34.8 17.0
10.2 13.7
13.6 23.3
7.3
8.4
10.2 10.0
31.5 32.5
26.7 26.3
19.0 24.2
32.8 23.0
9.0
11.7
16.6 13.2
13.7 11.3
19.2 17.6
13.0 14.5
19.5 18.0
27.4 26.9
4 December 2017
25

MOSL Universe stock performance
Company
Automobiles
Amara Raja
Ashok Ley.
Bajaj Auto
Bharat Forge
Bosch
CEAT
Eicher Mot.
Endurance Tech.
Escorts
Exide Ind
Hero Moto
M&M
Mahindra CIE
Maruti Suzuki
Tata Motors
TVS Motor
Banks - Private
Axis Bank
DCB Bank
Equitas Hold.
Federal Bank
HDFC Bank
ICICI Bank
IDFC Bank
IndusInd
J&K Bank
Kotak Mah. Bk
RBL Bank
South Indian
Yes Bank
Banks - PSU
BOB
BOI
Canara
IDBI Bk
Indian Bk
OBC
PNB
SBI
Union Bk
NBFCs
Aditya Birla Cap
Bajaj Fin.
Bharat Fin.
Capital First
Cholaman.Inv.&Fn
Dewan Hsg.
GRUH Fin.
HDFC
HDFC Stand. Life
Indiabulls Hsg
L&T Fin.Holdings
LIC Hsg Fin
Manappuram
M&M Fin.
1 Day (%)
-3.1
1.7
-3.0
-1.3
-1.7
-2.3
-2.3
2.6
-3.9
-0.2
-1.0
-0.1
-1.5
0.1
-1.4
0.8
-0.4
-2.3
-4.8
-2.0
-0.5
-0.8
-0.6
0.0
0.5
0.5
0.4
-3.5
-0.1
-0.8
-4.6
-2.8
-1.4
-0.3
-2.0
-2.7
-2.5
-4.0
-1.3
-1.0
-0.5
-1.2
0.3
-2.7
1.3
-1.1
0.3
-5.1
-2.9
-2.3
-3.7
0.8
1M (%)
10.6
-5.1
-0.9
-2.6
-5.0
3.5
-5.3
10.2
-7.0
-3.1
-5.5
4.4
-3.0
4.5
-8.6
2.2
0.0
1.2
-3.6
-10.1
1.3
-2.5
-12.3
1.3
-9.5
-1.9
-1.0
2.9
-3.6
-2.7
-3.4
-11.8
-6.3
21.3
-12.7
-13.9
-2.3
-11.9
7.8
-5.1
0.2
-6.6
4.9
-7.1
1.6
-5.3
-8.1
-16.5
-4.6
0.8
1.7
12M (%)
-18.0
54.5
19.6
52.6
-1.9
38.2
32.1
122.5
116.7
14.8
13.5
21.5
25.9
64.0
-10.9
97.0
14.5
67.0
-12.7
56.4
54.1
29.5
-19.6
54.1
22.1
35.0
47.2
66.4
31.9
3.8
60.2
18.6
-13.0
58.2
5.3
25.7
22.2
7.0
Company
Muthoot Fin
PNB Housing
PFC
Repco Home
REC
STF
Shriram City Union
Capital Goods
ABB
Bharat Elec.
BHEL
Blue Star
CG Cons. Elec.
CG Power & Inds Sol.
Cummins
GE T&D
Havells
K E C Intl
L&T
Pennar Eng.
Siemens
Solar Ind
Suzlon Energy
Thermax
Va Tech Wab.
Voltas
Cement
Ambuja Cem.
ACC
Birla Corp.
Dalmia Bharat
Grasim Inds.
India Cem
J K Cements
JK Lakshmi Ce
Ramco Cem
Orient Cem
Prism Cem
Sagar Cements
Shree Cem
Ultratech
Consumer
Asian Paints
Britannia
Colgate
Dabur
Emami
Godrej Cons.
GSK Cons.
HUL
ITC
Jyothy Lab
Marico
Nestle
Page Inds
Parag Milk
1 Day (%)
-0.4
-0.7
-1.8
-2.7
-0.4
-0.1
-0.2
-0.3
-0.9
-1.1
0.8
1.2
-2.7
-2.4
-2.6
-0.4
-2.4
-0.3
0.3
-2.0
-0.5
-1.1
-0.5
-1.1
-3.2
0.4
0.6
1.4
-1.2
-1.8
-3.1
-1.1
0.0
-0.8
-0.9
-2.3
-1.7
-0.3
-0.9
-1.0
0.3
-0.7
-1.6
1.3
1.4
-0.2
-1.7
-0.1
2.2
1.2
0.7
-2.2
0.2
1M (%)
-13.8
-7.4
-14.9
-1.2
-11.3
10.9
-10.6
0.0
-0.6
-8.1
-2.4
23.6
-2.8
-5.7
4.9
3.2
3.4
-0.2
-1.9
-7.5
11.5
-17.6
10.7
1.6
9.8
-6.8
-7.7
-0.5
4.8
-7.6
-12.9
-1.9
-5.8
-3.6
-6.2
-7.1
-1.2
-10.6
-5.6
-3.3
2.2
-1.3
-2.0
4.7
0.8
15.1
-0.6
-5.3
-0.3
-2.1
5.4
9.5
-9.8
12M (%)
46.2
47.0
-10.7
3.7
13.3
47.2
9.1
31.7
41.7
5.8
53.4
82.2
10.0
9.4
29.9
51.5
119.5
31.3
-35.1
4.9
73.0
-6.9
32.7
18.4
100.3
27.5
25.5
70.9
94.8
57.6
43.4
34.5
6.0
15.7
21.5
23.1
24.9
14.6
17.1
21.0
59.9
10.6
19.5
23.0
30.2
18.2
48.0
9.4
8.6
21.2
22.6
67.4
-8.0
87.3
31.4
25.6
33.6
141.3
65.6
30.7
51.6
91.8
0.0
36.7
54.7
4 December 2017
26

MOSL Universe stock performance
Company
Pidilite Ind.
P&G Hygiene
Prabhat Dairy
United Brew
United Spirits
Healthcare
Alembic Phar
Alkem Lab
Ajanta Pharma
Aurobindo
Biocon
Cadila
Cipla
Divis Lab
Dr Reddy’s
Fortis Health
Glenmark
Granules
GSK Pharma
IPCA Labs
Jubilant Life
Lupin
Sanofi India
Shilpa Medicare
Strides Shasun
Sun Pharma
Syngene Intl
Torrent Pharma
Infrastructure
Ashoka Buildcon
IRB Infra.Devl.
KNR Construct.
Sadbhav Engg.
Logistics
Allcargo Logistics
Blue Dart
Concor
Gateway Distriparks
Gati
Transport Corp.
Media
Dish TV
D B Corp
Den Net.
Ent.Network
Hind. Media
HT Media
Jagran Prak.
Music Broadcast
PVR
Prime Focus
Siti Net.
Sun TV
Zee Ent.
Metals
Hindalco
1 Day (%)
1.0
1.0
0.4
-2.6
-2.3
-1.9
-1.0
-2.4
-3.2
3.3
-0.6
-0.5
-0.8
-2.4
-0.7
-1.8
-3.3
-0.9
-1.7
5.8
-0.6
-0.5
0.4
0.1
-2.6
-0.8
-0.8
-2.9
-3.3
-1.9
-0.1
1.9
0.0
-2.1
-2.0
-3.3
-1.3
-1.7
0.1
1.1
-0.8
-0.6
2.4
-1.1
0.6
-2.4
-1.0
-0.2
-1.7
-2.0
-1.9
1M (%)
10.3
9.1
14.4
0.6
5.1
1.3
4.5
10.6
-11.7
23.4
-14.2
-4.3
12.4
-5.5
0.3
-10.7
-10.0
-6.5
1.2
7.4
-20.8
-1.5
-3.4
-2.8
-4.1
8.9
-0.7
13.2
-7.9
5.3
19.2
2.9
-1.0
-7.9
-8.4
13.1
8.3
4.3
0.4
18.9
-7.5
6.6
0.0
-6.3
-3.5
-7.2
-4.6
3.0
0.1
4.2
-14.4
12M (%)
32.8
44.6
56.9
22.1
69.0
-21.5
17.9
-28.4
-9.5
45.1
6.8
5.1
-10.0
-31.2
-17.5
-36.7
11.7
-8.6
-6.9
-2.2
-46.2
2.0
-1.8
-25.4
-27.1
-9.3
-8.0
69.0
16.6
77.6
37.2
4.0
-12.2
38.3
7.8
9.8
73.1
-10.2
-0.7
56.6
4.0
-10.6
43.6
-7.7
12.8
41.5
-27.0
85.7
22.1
37.5
Company
Hind. Zinc
JSPL
JSW Steel
Nalco
NMDC
Rain Industries
SAIL
Vedanta
Tata Steel
Oil & Gas
BPCL
GAIL
Gujarat Gas
Gujarat St. Pet.
HPCL
IOC
IGL
Mahanagar Gas
MRPL
Oil India
ONGC
PLNG
Reliance Ind.
Retail
Jubilant Food
PC Jeweller
Titan Co.
Technology
Cyient
HCL Tech.
Hexaware
Infosys
KPIT Tech
L&T Infotech
Mindtree
Mphasis
NIIT Tech
Persistent Sys
Tata Elxsi
TCS
Tech Mah
Wipro
Zensar Tech
Telecom
Bharti Airtel
Bharti Infratel
Idea Cellular
Tata Comm
Utiltites
Coal India
CESC
JSW Energy
NTPC
Power Grid
Tata Power
1 Day (%)
-1.0
-1.9
-1.0
-1.2
0.9
-2.4
1.8
-3.0
-2.1
-1.3
-2.7
-2.2
-4.5
-1.8
-1.5
-2.9
-1.2
0.8
-0.6
-0.4
-2.8
-1.4
-1.4
-1.1
-1.6
-2.4
-2.2
1.0
-1.7
-6.0
0.2
-1.6
-1.2
-1.1
0.5
-2.7
-0.1
-3.4
-0.8
-0.5
-2.7
0.4
-1.2
-1.1
-1.4
-1.8
0.0
0.1
-1.5
-4.6
1M (%)
-8.6
3.0
-4.9
-14.1
0.3
32.1
-4.0
-16.5
-3.7
-8.1
-2.5
-4.9
-1.4
-7.7
-6.8
0.2
-12.5
-11.9
-2.0
-5.8
-7.3
-4.5
7.7
12.2
26.7
3.9
-1.0
21.3
3.5
10.2
22.8
11.7
4.4
-3.3
0.0
7.6
1.1
-3.3
-1.2
7.5
-10.2
-10.0
-5.9
-1.9
-4.7
-2.1
-1.8
0.6
-3.6
6.1
12M (%)
8.0
147.4
50.3
45.5
9.5
590.7
54.2
26.4
66.1
18.2
38.4
59.2
35.5
37.3
30.2
89.8
46.3
28.9
12.2
-7.7
27.9
82.5
92.4
110.6
148.8
14.2
3.5
64.5
-1.8
21.6
55.8
13.4
36.6
49.0
8.0
41.1
16.1
-0.5
23.8
-15.0
51.4
-0.6
27.7
2.1
-11.2
67.3
42.9
12.1
10.0
24.0
4 December 2017
27

MOSL Universe stock performance
Company
Others
Arvind
Avenue Super.
Bata India
BSE
Castrol India
Century Ply.
Coromandel Intl
Delta Corp
Dynamatic Tech
Eveready Inds.
Interglobe
Indo Count
Info Edge
Inox Leisure
Jain Irrigation
Just Dial
Kaveri Seed
Kitex Garm.
Manpasand
MCX
Monsanto
Navneet Educat.
PI Inds.
Piramal Enterp.
Quess Corp
SRF
S H Kelkar
Symphony
Team Lease Serv.
Trident
TTK Prestige
V-Guard
Wonderla
1 Day (%)
-0.2
-0.1
-0.8
0.2
0.2
-1.8
-1.6
0.4
-1.1
-1.3
0.6
-3.6
0.3
-1.0
-1.0
-3.7
-1.2
-1.2
-0.9
-0.1
-0.6
-3.4
0.8
-1.7
-1.5
0.1
0.6
-1.2
-1.0
0.2
-1.1
-1.8
-0.4
1M (%)
8.1
-3.1
-10.6
-5.8
-1.0
9.6
-0.4
-6.2
-8.4
27.6
-9.2
-2.3
8.2
5.0
15.9
12.7
-5.6
27.3
-10.3
-8.0
-2.1
0.8
19.4
0.0
10.1
8.2
-3.8
7.3
33.1
-14.2
-0.8
-1.4
-4.1
12M (%)
23.5
75.9
0.9
74.5
92.5
131.4
-29.8
100.5
35.2
-26.0
44.6
22.5
34.7
34.4
32.1
5.2
26.3
-21.0
8.6
50.8
13.6
66.8
44.0
15.8
-11.9
33.1
153.2
57.4
23.2
87.3
5.2
4 December 2017
28

THEMATIC/STRATEGY RESEARCH GALLERY

REPORT GALLERY
RECENT INITIATING COVERAGE REPORTS
Rs

DIFFERENTIATED PRODUCT GALLERY

Disclosures:
The following Disclosures are being made in compliance with the SEBI Research Analyst Regulations 2014 (herein after referred to as the Regulations).
Motilal Oswal Securities Ltd. (MOSL) is a SEBI Registered Research Analyst having registration no. INH000000412. MOSL, the Research Entity (RE) as defined in the Regulations, is engaged in the business of providing Stock
broking services, Investment Advisory Services, Depository participant services & distribution of various financial products. MOSL is a subsidiary company of Motilal Oswal Financial Service Ltd. (MOFSL). MOFSL is a listed
public company, the details in respect of which are available on
www.motilaloswal.com.
MOSL is registered with the Securities & Exchange Board of India (SEBI) and is a registered Trading Member with National Stock
Exchange of India Ltd. (NSE) and Bombay Stock Exchange Limited (BSE), Metropolitan Stock Exchange Of India Ltd. (MSE) for its stock broking activities & is Depository participant with Central Depository Services Limited
(CDSL) & National Securities Depository Limited (NSDL) and is member of Association of Mutual Funds of India (AMFI) for distribution of financial products. Details of associate entities of Motilal Oswal Securities Limited are
available on the website at
http://onlinereports.motilaloswal.com/Dormant/documents/Associate%20Details.pdf
Pending Regulatory Enquiries against Motilal Oswal Securities Limited by SEBI:
SEBI pursuant to a complaint from client Shri C.R. Mohanraj alleging unauthorized trading, issued a letter dated 29th April 2014 to MOSL notifying appointment of an Adjudicating Officer as per SEBI regulations to hold
inquiry and adjudge violation of SEBI Regulations; MOSL requested SEBI to provide all documents, records, investigation report relied upon by SEBI which were referred in Show Cause Notice and also sought personal
hearing. The matter is currently pending.
MOSL, it’s associates, Research Analyst or their relative may have any financial interest in the subject company. MOSL and/or its associates and/or Research Analyst may have beneficial ownership of 1% or more securities in
the subject company at the end of the month immediately preceding the date of publication of the Research Report.
MOSL and its associate company(ies), their directors and Research Analyst and their relatives may; (a) from
time to time, have a long or short position in, act as principal in, and buy or sell the securities or derivatives thereof of companies mentioned herein. (b) be engaged in any other transaction involving such securities and earn
brokerage or other compensation or act as a market maker in the financial instruments of the company(ies) discussed herein or act as an advisor or lender/borrower to such company(ies) or may have any other potential
conflict of interests with respect to any recommendation and other related information and opinions.; however the same shall have no bearing whatsoever on the specific recommendations made by the analyst(s), as the
recommendations made by the analyst(s) are completely independent of the views of the associates of MOSL even though there might exist an inherent conflict of interest in some of the stocks mentioned in the research
report.
Research Analyst may have served as director/officer, etc. in the subject company in the last 12 month period. MOSL and/or its associates may have received any compensation from the subject company in the past
12 months.
In the last 12 months period ending on the last day of the month immediately preceding the date of publication of this research report, MOSL or any of its associates may have:
managed or co-managed public offering of securities from subject company of this research report,
received compensation for investment banking or merchant banking or brokerage services from subject company of this research report,
received compensation for products or services other than investment banking or merchant banking or brokerage services from the subject company of this research report.
Subject Company may have been a client of MOSL or its associates during twelve months preceding the date of distribution of the research report.
MOSL and it’s associates have not received any compensation or other benefits from the subject company or third party in connection with the research report. To enhance transparency, MOSL has incorporated a Disclosure
of Interest Statement in this document. This should, however, not be treated as endorsement of the views expressed in the report. MOSL and / or its affiliates do and seek to do business including investment banking with
companies covered in its research reports. As a result, the recipients of this report should be aware that MOSL may have a potential conflict of interest that may affect the objectivity of this report. Compensation of Research
Analysts is not based on any specific merchant banking, investment banking or brokerage service transactions.
Terms & Conditions:
This report has been prepared by MOSL and is meant for sole use by the recipient and not for circulation. The report and information contained herein is strictly confidential and may not be altered in any way, transmitted to,
copied or distributed, in part or in whole, to any other person or to the media or reproduced in any form, without prior written consent of MOSL. The report is based on the facts, figures and information that are considered
true, correct, reliable and accurate. The intent of this report is not recommendatory in nature. The information is obtained from publicly available media or other sources believed to be reliable. Such information has not
been independently verified and no guaranty, representation of warranty, express or implied, is made as to its accuracy, completeness or correctness. All such information and opinions are subject to change without notice.
The report is prepared solely for informational purpose and does not constitute an offer document or solicitation of offer to buy or sell or subscribe for securities or other financial instruments for the clients. Though
disseminated to all the customers simultaneously, not all customers may receive this report at the same time. MOSL will not treat recipients as customers by virtue of their receiving this report.
Analyst Certification
The views expressed in this research report accurately reflect the personal views of the analyst(s) about the subject securities or issues, and no part of the compensation of the research analyst(s) was, is, or will be directly or
indirectly related to the specific recommendations and views expressed by research analyst(s) in this report.
Disclosure of Interest Statement
Analyst ownership of the stock
Companies where there is interest
No
A graph of daily closing prices of securities is available at
www.nseindia.com, www.bseindia.com.
Research Analyst views on Subject Company may vary based on Fundamental research and Technical Research. Proprietary
trading desk of MOSL or its associates maintains arm’s length distance with Research Team as all the activities are segregated from MOSL research activity and therefore it can have an independent view with regards to
subject company for which Research Team have expressed their views.
Regional Disclosures (outside India)
This report is not directed or intended for distribution to or use by any person or entity resident in a state, country or any jurisdiction, where such distribution, publication, availability or use would be contrary to law,
regulation or which would subject MOSL & its group companies to registration or licensing requirements within such jurisdictions.
For Hong Kong:
This report is distributed in Hong Kong by Motilal Oswal capital Markets (Hong Kong) Private Limited, a licensed corporation (CE AYY-301) licensed and regulated by the Hong Kong Securities and Futures Commission (SFC)
pursuant to the Securities and Futures Ordinance (Chapter 571 of the Laws of Hong Kong) “SFO”. As per SEBI (Research Analyst Regulations) 2014 Motilal Oswal Securities (SEBI Reg No. INH000000412) has an agreement with
Motilal Oswal capital Markets (Hong Kong) Private Limited for distribution of research report in Hong Kong. This report is intended for distribution only to “Professional Investors” as defined in Part I of Schedule 1 to SFO. Any
investment or investment activity to which this document relates is only available to professional investor and will be engaged only with professional investors.” Nothing here is an offer or solicitation of these securities,
products and services in any jurisdiction where their offer or sale is not qualified or exempt from registration. The Indian Analyst(s) who compile this report is/are not located in Hong Kong & are not conducting Research
Analysis in Hong Kong.
For U.S.
Motilal Oswal Securities Limited (MOSL) is not a registered broker - dealer under the U.S. Securities Exchange Act of 1934, as amended (the"1934 act") and under applicable state laws in the United States. In addition MOSL is
not a registered investment adviser under the U.S. Investment Advisers Act of 1940, as amended (the "Advisers Act" and together with the 1934 Act, the "Acts), and under applicable state laws in the United States.
Accordingly, in the absence of specific exemption under the Acts, any brokerage and investment services provided by MOSL, including the products and services described herein are not available to or intended for U.S.
persons. This report is intended for distribution only to "Major Institutional Investors" as defined by Rule 15a-6(b)(4) of the Exchange Act and interpretations thereof by SEC (henceforth referred to as "major institutional
investors"). This document must not be acted on or relied on by persons who are not major institutional investors. Any investment or investment activity to which this document relates is only available to major institutional
investors and will be engaged in only with major institutional investors. In reliance on the exemption from registration provided by Rule 15a-6 of the U.S. Securities Exchange Act of 1934, as amended (the "Exchange Act") and
interpretations thereof by the U.S. Securities and Exchange Commission ("SEC") in order to conduct business with Institutional Investors based in the U.S., MOSL has entered into a chaperoning agreement with a U.S.
registered broker-dealer, Motilal Oswal Securities International Private Limited. ("MOSIPL"). Any business interaction pursuant to this report will have to be executed within the provisions of this chaperoning agreement.
The Research Analysts contributing to the report may not be registered /qualified as research analyst with FINRA. Such research analyst may not be associated persons of the U.S. registered broker-dealer, MOSIPL, and
therefore, may not be subject to NASD rule 2711 and NYSE Rule 472 restrictions on communication with a subject company, public appearances and trading securities held by a research analyst account.
For Singapore
Motilal Oswal Capital Markets Singapore Pte Limited is acting as an exempt financial advisor under section 23(1)(f) of the Financial Advisers Act(FAA) read with regulation 17(1)(d) of the Financial Advisors Regulations and is a
subsidiary of Motilal Oswal Securities Limited in India. This research is distributed in Singapore by Motilal Oswal Capital Markets Singapore Pte Limited and it is only directed in Singapore to accredited investors, as defined in
the Financial Advisers Regulations and the Securities and Futures Act (Chapter 289), as amended from time to time. In respect of any matter arising from or in connection with the research you could contact the following
representatives of Motilal Oswal Capital Markets Singapore Pte Limited:
Disclaimer:
The report and information contained herein is strictly confidential and meant solely for the selected recipient and may not be altered in any way, transmitted to, copied or distributed, in part or in whole, to any other person
or to the media or reproduced in any form, without prior written consent. This report and information herein is solely for informational purpose and may not be used or considered as an offer document or solicitation of
offer to buy or sell or subscribe for securities or other financial instruments. Nothing in this report constitutes investment, legal, accounting and tax advice or a representation that any investment or strategy is suitable or
appropriate to your specific circumstances. The securities discussed and opinions expressed in this report may not be suitable for all investors, who must make their own investment decisions, based on their own investment
objectives, financial positions and needs of specific recipient. This may not be taken in substitution for the exercise of independent judgment by any recipient. Each recipient of this document should make such investigations
as it deems necessary to arrive at an independent evaluation of an investment in the securities of companies referred to in this document (including the merits and risks involved), and should consult its own advisors to
determine the merits and risks of such an investment. The investment discussed or views expressed may not be suitable for all investors. Certain transactions -including those involving futures, options, another derivative
products as well as non-investment grade securities - involve substantial risk and are not suitable for all investors. No representation or warranty, express or implied, is made as to the accuracy, completeness or fairness of
the information and opinions contained in this document. The Disclosures of Interest Statement incorporated in this document is provided solely to enhance the transparency and should not be treated as endorsement of the
views expressed in the report. This information is subject to change without any prior notice. The Company reserves the right to make modifications and alternations to this statement as may be required from time to time
without any prior approval. MOSL, its associates, their directors and the employees may from time to time, effect or have effected an own account transaction in, or deal as principal or agent in or for the securities
mentioned in this document. They may perform or seek to perform investment banking or other services for, or solicit investment banking or other business from, any company referred to in this report. Each of these entities
functions as a separate, distinct and independent of each other. The recipient should take this into account before interpreting the document. This report has been prepared on the basis of information that is already
available in publicly accessible media or developed through analysis of MOSL. The views expressed are those of the analyst, and the Company may or may not subscribe to all the views expressed therein. This document is
being supplied to you solely for your information and may not be reproduced, redistributed or passed on, directly or indirectly, to any other person or published, copied, in whole or in part, for any purpose. This report is not
directed or intended for distribution to, or use by, any person or entity who is a citizen or resident of or located in any locality, state, country or other jurisdiction, where such distribution, publication, availability or use would
be contrary to law, regulation or which would subject MOSL to any registration or licensing requirement within such jurisdiction. The securities described herein may or may not be eligible for sale in all jurisdictions or to
certain category of investors. Persons in whose possession this document may come are required to inform themselves of and to observe such restriction. Neither the Firm, not its directors, employees, agents or
representatives shall be liable for any damages whether direct or indirect, incidental, special or consequential including lost revenue or lost profits that may arise from or in connection with the use of the information.
The
person accessing this information specifically agrees to exempt MOSL or any of its affiliates or employees from, any and all responsibility/liability arising from such misuse and agrees not to hold MOSL or any of its affiliates or
employees responsible for any such misuse and further agrees to hold MOSL or any of its affiliates or employees free and harmless from all losses, costs, damages, expenses that may be suffered by the person accessing this
information due to any errors and delays.
Registered Office Address: Motilal Oswal Tower, Rahimtullah Sayani Road, Opposite Parel ST Depot, Prabhadevi, Mumbai-400025; Tel No.: 022-3980 4263; www.motilaloswal.com. Correspondence Address: Palm Spring
Centre, 2nd Floor, Palm Court Complex, New Link Road, Malad (West), Mumbai- 400 064. Tel No: 022 3080 1000. Compliance Officer: Neeraj Agarwal, Email Id:
na@motilaloswal.com,
Contact No.:022-30801085.
Registration details of group entities.: MOSL: SEBI Registration: INZ000158836; CDSL: IN-DP-16-2015; NSDL: IN-DP-NSDL-152-2000; Research Analyst: INH000000412. AMFI: ARN 17397. Investment Adviser: INA000007100.
Motilal Oswal Asset Management Company Ltd. (MOAMC): PMS (Registration No.: INP000000670) offers PMS and Mutual Funds products. Motilal Oswal Wealth Management Ltd. (MOWML): PMS (Registration No.:
INP000004409) offers wealth management solutions. *Motilal Oswal Securities Ltd. is a distributor of Mutual Funds, PMS, Fixed Deposit, Bond, NCDs, Insurance and IPO products. * Motilal Oswal Commodities Broker Pvt. Ltd.
offers Commodities Products. * Motilal Oswal Real Estate Investment Advisors II Pvt. Ltd. offers Real Estate products. * Motilal Oswal Private Equity Investment Advisors Pvt. Ltd. offers Private Equity products
13 December 2016
30