7 December 2017
Market snapshot
Equities - India
Close
Chg .%
Sensex
32,597
-0.6
Nifty-50
10,044
-0.7
Nifty-M 100
19,552
-1.0
Equities-Global
Close
Chg .%
S&P 500
2,629
0.0
Nasdaq
6,776
0.2
FTSE 100
7,348
0.3
DAX
12,999
-0.4
Hang Seng
11,163
-2.8
Nikkei 225
22,177
-2.0
Commodities
Close
Chg .%
Brent (US$/Bbl)
61
-2.1
Gold ($/OZ)
1,263
-0.2
Cu (US$/MT)
6,518
0.1
Almn (US$/MT)
2,002
-1.6
Currency
Close
Chg .%
USD/INR
64.5
0.2
USD/EUR
1.2
-0.1
USD/JPY
112.2
-0.4
YIELD (%)
Close
1MChg
10 Yrs G-Sec
7.0
-0.03
10 Yrs AAA Corp
7.7
-0.03
Flows (USD b)
6-Dec
MTD
FIIs
-0.2
-0.4
DIIs
0.2
0.6
Volumes (INRb)
6-Dec
MTD*
Cash
289
300
F&O
6,774
5,039
Note: YTD is calendar year, *Avg
YTD.%
22.4
22.7
36.2
YTD.%
17.4
25.9
2.9
13.2
18.8
16.0
YTD.%
10.6
9.6
18.0
17.5
YTD.%
-5.0
12.1
-4.0
YTDchg
0.5
0.2
YTD
8.0
13.4
YTD*
307
5,665
Today’s top research Idea
Havells: Expanding share in electricals sector
Upgrade to Buy
Continuously entering new categories to drive growth:
HAVL has consistently
identified and entered new product categories over the years. Key categories
where it has made a successful entry include lighting in 2003, premium fans in
2005, water heaters in 2010, REO Switches in 2012, air coolers in 2014, re-
launch of the Standard brand in 2016 (target of INR10b by FY20) and entry into
EHV cables.
GST rate cuts to accelerate market share gains from unorganized sector:
The
government has cut GST rates across electrical categories from 28% to 18%,
and this should accelerate the shift toward the organized sector, especially in
categories like cables/wires, fans, switches and lighting, where the share of the
unorganized segment is high.
EESL threat recedes:
Our recent meeting with EESL indicates that its focus has
now shifted to electric vehicles, smart meters and solar rooftops from fans and
lighting. This should benefit electrical players like Havells.
Research covered
Cos/Sector
EcoScope
Havells India
TVS Motor Co.
Granules India
Key Highlights
RBI keeps rates unchanged; maintains neutral stance
Expanding share in electricals sector
Apache RR310: First BMW partnership product launched
Gearing up for next phase of growth
Piping hot news
RBI raises inflation forecast, leaves interest rate unchanged
The Reserve Bank of India’s (RBI) monetary policy committee (MPC) kept the
key interest rate unchanged on Wednesday, noting risks to inflation, but
expressed optimism that the slowdown in economic growth had bottomed out
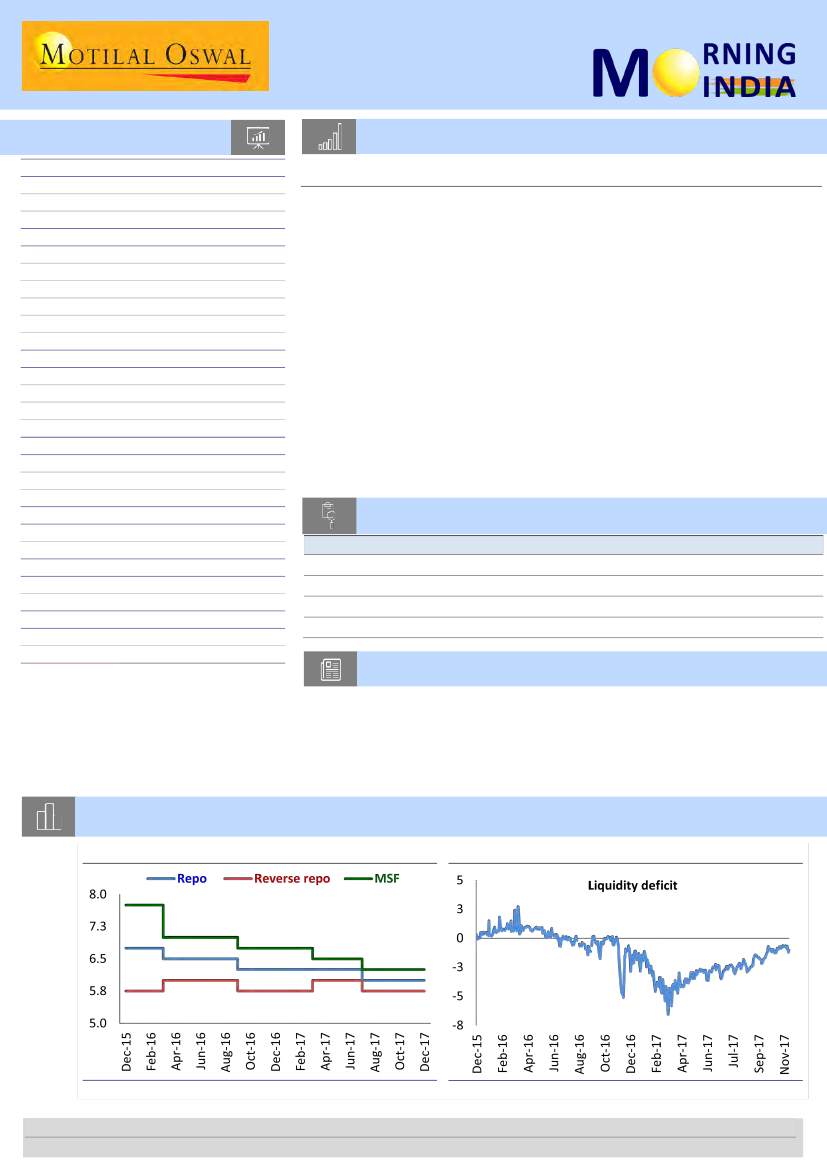
Chart of the Day: EcoScope – RBI keeps rates unchanged; maintains neutral stance
RBI keeps policy rates unchanged
Liquidity surplus continues to decline (% of NDTL)
Source: RBI
Source: RBI
Research Team (Gautam.Duggad@MotilalOswal.com)
Motilal Oswal research is available on www.motilaloswal.com/Institutional-Equities, Bloomberg, Thomson Reuters, Factset and S&P Capital.
Investors are advised to refer through important disclosures made at the last page of the Research Report.

In the news today
Kindly click on textbox for the detailed news link
1
CBI chargesheets IRB chief, 17
others for cheating bid
The Central Bureau of
Investigation (CBI) on Wednesday
filed a chargesheet against
Virendra Mhaiskar, chairman and
managing director of IRB
Infrastructure Developers Limited,
and 17 others for criminal
conspiracy and attempting to
cheat the state by grabbing…
2
Infosys files consent plea with Sebi on Rajiv Bansal’s severance pay
Infosys Ltd has filed a consent plea with capital markets regulator
Securities and Exchange Board of India (Sebi), regarding an ongoing probe
by the regulator related to the company’s decision to give a generous
severance payment to its former chief financial officer (CFO) Rajiv Bansal, a
move that had drawn the ire of some proxy advisory companies as well as
experts. On Wednesday, Infosys in a notice to exchanges said that the
company had submitted a settlement agreement based on an undertaking
that it would neither admit nor deny the findings of the regulator’s
investigation…
3
Union Budget 2018: Industry
lobby groups seek US-like tax
reforms in India
Industry lobby groups on
Wednesday asked finance minister
Arun Jaitley to bring down
corporate tax rates to make India
an attractive destination for
investment in view of the US
Congress approving a major tax
overhaul…
4
RBI monetary policy: MDR
charges linked to merchant
revenue
The Reserve Bank of India (RBI) on
Wednesday revised merchant
discount rate (MDR) charges, or
the commission paid by a
merchant to a bank for facilitating
digital transactions, to encourage
small businesses to start accepting
card payments…
5
Reserve Bank warns of risks to
‘unregulated’ crypto-
currencies
In the wake of a significant spurt
in the valuation of many virtual
currencies and the rapid growth in
the Initial Coin Offerings (ICOs),
the Reserve Bank of India has
reiterated its concerns regarding
the potential economic, financial,
operational, legal and security-
related risks associated with
crypto-currencies. The RBI has
been cautioning the public about
the risks involved in dealing with
crypto-currencies, including
bitcoins, litecoins, bbqcoins and
dogecoins . The central bank also
underscored that it has not given
any licence/authorisation to any
entity/company to operate such
schemes or deal in crypto-
currencieswith VCs…
2
6
NMDC mulls tungsten mining
From doubling its iron ore output
in five years to seeking more
diamond mines in Madhya
Pradesh as well as planning a joint
venture foray in Vietnam for
tungsten mines, NMDC Ltd is
pursuing a multiple-pronged
growth strategy. Addressing
presspersons at the company
headquarters in Hyderabad, on
the upcoming diamond jubilee
year celebrations…
7
Indian Oil prepares for shift to
a less carbon-intensive future
The country’s largest refiner
Indian Oil Corp. Ltd is making a
strategic shift to a less carbon-
intensive future by getting into
clean energy and related
infrastructure, while keeping
refinery expansion plans flexible
for course correction, said
chairman Sanjiv Singh in an
interview…
7 December 2017

E
CO
S
COPE
RBI keeps rates unchanged; maintains neutral stance
No rate action expected in remaining part of FY18
6 December 2017
The Economy Observer
The Monetary Policy Committee (MPC) decided to maintain status quo on rates and its policy stance in its fifth bi-
monthly monetary policy meeting held today. The decision to hold rates was taken with a majority of 5-1 votes and was
in line with market expectations.
As far as the economic forecasts are concerned, the RBI increased its inflation forecast for 2HFY18 slightly to 4.3-4.7%
from 4.2-4.6% earlier. However, it maintained its FY18 real GVA growth forecast at 6.7%. The central bank expects a
sharp acceleration in growth to 7% in 3Q and further to 7.8% in 4Q, from 6.1% in 2QFY18.
We expect inflation to rise towards 5% by March 2018, primarily on account of low base. On the other hand, we expect
real GVA to rise more slowly than the RBI’s expectations. The combination of higher inflation due to low base and weak
growth is unlikely to allow the RBI to change rates in the remaining part of FY18.
RBI keeps rates unchanged, in line with expectations:
The Monetary Policy
Committee (MPC) kept policy rates unchanged – repo rate at 6%, reverse repo
rate at 5.75%, and marginal standing facility (MSF) rate at 6.25%
(Exhibit 1) –
in
its fifth bi-monthly policy meeting today. This was in line with our as well as
market expectations. The decision to hold rates was taken with a majority of 5-1
votes. Like the last meeting, Dr Ravindra Dholakia voted for a 25bp cut in this
meeting also. The MPC continued with its ‘neutral’ policy stance.
Inflation projections nudged up slightly…:
The RBI increased its inflation
projections for 2HFY18 slightly to 4.3-4.7% from 4.2-4.6% earlier. It cited upside
risks to inflation owing to a firming up of three-month ahead and one-year
ahead household inflation expectations as well as expected pass-through of the
increase in input prices to output prices by firms. Further, a possibility of fiscal
slippage and global financial stability also pose risks. The RBI stated that these
risks could be offset by seasonal moderation in prices of fruits & vegetables and
the recent lowering of GST rates.
…while growth forecasts maintained:
The RBI had cut its GVA growth projection
for FY18 to 6.7% from 7.3% in the previous policy meeting. It retained this
projection, expecting GVA growth to accelerate to 7% in 3Q and further to 7.8%
in 4Q from 6.1% in 2QFY18. The central bank believes that risks in GVA forecasts
emerge from increases in oil prices and shortfall in agricultural production,
which could be offset by revival in credit demand. We believe that the RBI’s
2HFY18 estimates are on the higher side.
No rate action expected in remaining part of FY18:
We expect inflation to rise
to 4.3% in November 2017 and move further up to touch 5% by March 2018,
primarily on account of low base. Core inflation, however, is likely to be capped
at ~4.7%, up from 4.4% in the past two months. On the other hand, we believe
that RBI’s GVA forecasts are highly ambitious and will be substantially under-
achieved. Overall, the combination of higher inflation due to low base and weak
growth is unlikely to allow the RBI to change rates in the remaining part of FY18.
7 December 2017
3

Havells India
BSE SENSEX
32,802
S&P CNX
10,118
7 December 2017
Update | Sector: Capital Goods
CMP: INR507
TP: INR590(+16%)
Upgrade to Buy
Expanding share in the electrical sector in India
Entry into durables adds another leg of growth
Continuously entering new categories to drive growth:
Havells India (HAVL) has
consistently identified and entered new product categories over the years (see
Exhibit 1). Some of the key categories where it has made a successful entry include
lighting in 2003, premium fans in 2005, water heaters in 2010, REO Switches in
2012, air coolers in 2014, re-launch of the
Standard
brand in 2016 (target of
INR10b by FY20) and EHV cables. The recent acquisition of Lloyd gives HAVL a
strong foothold in the fast growing durables segment – the aim is to double
revenue in the next three years through new product launches, expansion of
existing product portfolio and increased channel penetration (in talks with large
format stores to stock Lloyd products).
GST rate cuts to accelerate market share gains from the unorganized sector:
The
government has cut GST rates across electrical categories from 28% to 18% and
this should accelerate the shift towards the organized sector, especially in
categories like cables/wires, fans, switches and lighting, where the share of the
unorganized segment is high. Implementation of the E-waybill from April 2018
would further accelerate this transition. Media reports suggest a cut in rates from
28% to 18% for durables as well – this would have a positive impact on Lloyd’s sales
in air-conditioners for the upcoming summer season in 2018.
EESL threat recedes; LED bulb prices stabilizing:
The market has been concerned
on the impact of EESL’s bulk sourcing on prices of fans, lighting products and
durables (air conditioners, washing machines and refrigerators). Our recent
meeting with EESL indicates that its focus has now shifted to electric vehicles,
smart meters and solar rooftops from fans and lighting (LED bulbs, streetlights).
This is positive for electrical companies like HAVL that can leverage their strong
channel relationships to drive sales. We believe the change in EESL’s stance is
driven by (a) installation issues with durables unlike LED lamps, which are ‘plug and
play’, (b) regular servicing requirements of durables, and (c) high cost of raising
product awareness with the customer.
Margins revert to normalized levels post demonetization/GST disruption:
HAVL’s
EBITDA margin had dipped to 12.7% in 3QFY17, as discounts/schemes were offered
to counter the impact of demonetization. EBITDA margin further dipped to 10% in
1QFY18 on GST-related destocking and delays in passing on RM cost hikes to the
channel. With all the demonetization-related schemes being rolled back and price
hikes taken, EBITDA margin has bounced back to 15.8% in 2QFY18 and should
sustain at the historical 13.5-14%. We expect sales growth to accelerate, led by (a)
lighting, consumer durables, and Lloyd Electric, and (b) market share gains in
cables/wires and switches.
Upgrade to Buy; retain TP at INR590 (35x Dec’19 EPS):
We expect HAVL to report
21% EPS CAGR over FY17-20, with EBITDA margin expanding 40bp to 13.8%. With
the Lloyd acquisition, HAVL has turned itself into a complete electricals and
durables behemoth, and is well positioned to tap into the under-penetrated Indian
market. Our target price is based on 35x Dec’19 EPS (in line with Crompton
Consumer Electricals).
Stock Info
Bloomberg
Equity Shares (m)
52-Week Range (INR)
1, 6, 12 Rel. Per (%)
M.Cap. (INR b)
M.Cap. (USD b)
Avg Val, INRm
Free float (%)
HAVL IN
625.0
564/311
4/0/24
316.3
4.9
656
38.4
Financials Snapshot (INR b)
2018E 2019E 2020E
Y/E Mar
Net Sales
83.2 100.4 114.7
EBITDA
10.7 13.6
15.8
Adj PAT
7.2
8.9
10.5
Adj EPS (INR)
11.5 14.3
16.8
EPS Gr. (%)
20.5 23.9
17.7
BV/Sh(INR)
59.0 67.2
76.8
RoE (%)
19.5 21.2
21.9
RoCE (%)
19.7 21.9
22.8
Payout (%)
42.8 42.8
42.8
Valuations
P/E (x)
44.3 35.7
30.4
P/BV (x)
8.6
7.6
6.6
EV/EBITDA (x)
29.0 22.5
19.0
Div Yield (%)
0.8
1.0
1.2
Shareholding pattern (%)
As On
Sep-17 Jun-17 Sep-16
Promoter
61.6
61.6
61.6
DII
3.5
3.2
2.9
FII
25.7
26.3
26.7
Others
9.3
8.9
8.8
FII Includes depository receipts
Stock Performance (1-year)
Havells India
Sensex - Rebased
600
525
450
375
300
7 December 2017
4

TVS Motor Company
BSE SENSEX
32,597
S&P CNX
10,044
6 December 2017
Update | Sector: Automobiles
CMP: INR734
TP: INR764 (+4%)
Neutral
Apache RR310: First BMW partnership product launched
Launch price of INR205k at over 40% premium to Bajaj Dominar/RE Classic
Stock Info
Bloomberg
Equity Shares (m)
52-Week Range (INR)
1, 6, 12 Rel. Per (%)
M.Cap. (INR b)
M.Cap. (USD b)
Avg Val, INRm
Free float (%)
TVSL IN
475
747/346
9/31/83
350.3
5.4
658.0
42.6
Financials Snapshot (INR b)
2018E 2019E 2020E
Y/E Mar
149.8 186.6 223.7
Net Sales
11.6
18.9
24.7
EBITDA
7.1
12.3
16.6
PAT
14.9
25.8
34.9
EPS (INR)
27.0
73.1
35.0
Gr. (%)
62.0
83.0 111.9
BV/Sh (INR)
26.5
35.6
35.8
RoE (%)
26.8
38.7
42.4
RoCE (%)
49.2
28.4
21.1
P/E (x)
11.8
8.8
6.6
P/BV (x)
TVS Apache RR 310 is another step
in our effort to deliver beyond
customers’ expectations and
offering them a chance to upgrade
from premium to super-premium
category. TVS Apache RR 310 is a
testimony to our Racing DNA and
R&D capabilities, positioned to fulfill
the ever-growing aspirations of the
new age customers globally.”
-
Mr. KN Radhakrishnan, President
& Chief Executive Officer, TVS
Motor Company
TVS Motor (TVSL), on 6
th
December 2017, launched Apache RR 310, the first
product from its partnership with BMW. This marks its foray in the super-
premium category, both in the domestic and international markets.
The motorcycle is priced at ~INR205k (ex-showroom), implying a premium of
over 40% to Bajaj Dominar.
Average volumes for 250-500cc segment are ~66.5k/month including Royal
Enfield and ~2.7k/month excluding Royal Enfield.
It is the first motorcycle rolled out under the TVS badge, as part of TVSL’s
partnership with BMW Motorrad, co-developed alongside BMW G310R.
Apache RR 310 uses the same liquid-cooled, 312cc single-cylinder engine as
BMW G310R.
It offers an attractive alternative to the entry-level performance motorcycles,
and will compete with a wide range of motorcycles, including the KTM RC 390,
Mahindra Mojo, Bajaj Dominar and Royal Enfield.
It was designed to be a motorcycle that can cater to daily usage as well as
weekend riding or track days. TVSL further believes that the bike will take the
position of the company to a new level.
Both anti-lock braking system (ABS) and electronic fuel injection (EFI) system,
will be available as standard in TVS Apache RR 310.
TVSL expects to sell 10,000 Apache RR310 bikes worldwide in the first year (v/s
our estimate of ~15k in FY19).
Deliveries will commence by end-December. Bookings are expected to start
soon (no timeline has been confirmed by TVS yet).
BMW Motorrad tie-up provides additional revenue stream, technological edge
BMW G310R and GS exports have clocked average monthly volumes of ~1.9k in
YTD FY18. Management has guided for 2-2.5k units per month in FY18 (v/s our
estimate of 2.25k/month in FY18 and 6.25k/month in FY19).
Launch of these models in India is slated for 2HFY19. We believe this would not
be a threat for Apache RR310 volumes due to the significant price differential,
as globally BMW G310R is priced at USD4,750 (~INR306k).
This tie-up would give TVSL an additional revenue stream in the form of
contract manufacturing for BMW Motorrad.
Valuation view:
We have been positive on TVSL since our coverage initiation in
Nov’13. We also like continued improvement in its competitive positioning and
financial performance. Our EPS estimates are one of the highest on the street
(~18/~29% higher than Bloomberg consensus for FY19/20). However, valuations at
28.4x/21.1x FY19E/FY20E EPS already reflect large part of the earnings drivers,
leaving no margin of safety for execution risk. Our TP is INR764 (~20x Mar-20E EPS
+ INR67/share for value in NBFC investment post 20% HoldCo discount).
7 December 2017
5

Granules India
BSE SENSEX
32,802
S&P CNX
10,118
6 December 2017
Update | Sector: Healthcare
CMP: INR124
TP: INR200(+61%)
Buy
Gearing up for next phase of growth
JV to be under pressure, but long-term prospects intact
Stock Info
Bloomberg
Equity Shares (m)
52-Week Range (INR)
1, 6, 12 Rel. Per (%)
M.Cap. (INR b)
M.Cap. (USD b)
Avg Val, INRm
Free float (%)
GRAN IN
216.0
157/98
-8/-15/-13
27.1
0.4
265.0
51.8
We recently hosted the management of Granules India (GRAN) at our Midcap
Conference. We surmise that the JV business will be impacted in the near term due to
deferral of sales by a key client, though the company maintains its medium-term revenue
growth guidance (of 20-25% CAGR) from Omnichem JV. GRAN plans key filings (4-6
ANDAs) in 1HCY18 in the US. The impact of ramp-up in production in traditional business
will be visible over the next 12-18 months.
GRAN-Omnichem JV – near-term hiccups; medium-term guidance maintained:
This is
Financials Snapshot (INR b)
2017 2018E 2019E
Y/E Mar
Sales
14.4
16.5
21.7
EBITDA
3.0
3.3
4.6
NP
1.7
1.6
2.3
EPS (INR)
7.2
6.9
9.1
EPS Gr. (%)
32.3
-5.1
32.2
BV/Sh. (INR)
39.5
55.1
61.5
RoE (%)
21.1
14.2
15.5
RoCE (%)
17.9
14.2
15.9
P/E (x)
17.1
18.1
13.7
P/BV (x)
3.1
2.2
2.0
Shareholding pattern (%)
As On
Sep-17 Jun-17 Sep-16
Promoter
48.2
53.4
51.0
DII
1.6
1.5
0.9
FII
19.8
12.2
8.2
Others
30.4
32.9
39.9
FII Includes depository receipts
Stock Performance (1-year)
Granules India
Sensex - Rebased
160
140
120
100
80
a 50:50 JV between GRAN and Ajinomoto’s subsidiary, Omnichem. Omnichem
would be transferring large-scale production of intermediates and APIs to the
JV. Procurement from one of the key client has got deferred by two years, due
to which sales growth in the near term will get impacted. The company
maintains its 5-year revenue growth guidance (of 20-25% CAGR) through the
Omnichem JV.
Base business – augmented capacity to fuel growth; focus on formulations to boost
margins:
Currently, API capacity is running at 100% utilization and PFI capacity
at 75-80% utilization. GRAN had planned to increase its API capacity by ~40%
and PFI capacity by >20% (expansion plan to get over in FY18), which will also
help fuel growth in formulations (as the company is dependent on backward
integration). This will help grow the base business at mid-to-high teens till at
least FY20 (~27% CAGR over FY17-20E v/s ~7% in FY17).
US business – plans niche foray into Rx business:
GRAN is planning to file ~25
ANDAs in the US till FY19. Of these, 12-15 complex ANDAs will be filed from its
US-based Virginia facility and rest from India facility located in Gagilapur. The
company has already filed two complex generic ANDAs from its Virginia facility
in March/April 2017 (market size: USD500m). In one product, GRAN could be
the only generic player in the near term (TAD of January 2018).
Expect PAT CAGR of >25% till FY20, despite full R&D expensing:
We expect GRAN to
report ~27% PAT CAGR over FY17-20. This is after assuming R&D expense of
USD12m. This strong growth will be driven primarily by ramp-up of base
business (on the back of capacity expansion), shift in product mix, Omichem JV,
and OTC business expansion. Though FY19 will be the first year of US business
sales, the full impact of investments in US business will be visible from FY20
onwards.
Stock trading at 13.7x FY19E EPS; US business ramp-up key growth driver:
GRAN
trades at 13.7x FY19E EPS (despite assuming >10% equity dilution). We believe
the stock has the potential to deliver >50% return in 12-18 months on the back
of multiple re-rating (to >18x forward earnings) and strong PAT CAGR of ~27%
till FY20E. At 18x 1HFY20E EPS, fair value of the stock works out to INR200. We
have cut our FY18/19E EPS by 10-12% as we factor in impact of loss of sales in
JV business and lower margins.
7 December 2017
6

In conversation
1. CESC: Awaiting NCLT & Shareholders nod for demerger;
apparels to see major thrust; Sanjiv Goenka,Chairman
Shareholder meeting to discuss the demerger is scheduled for December 15 and
will be convened by NCLT. Now depends on NCLT to give the final order and
shareholders the consent. Already have got clearance from SEBI and stock
exchanges.
Post this approval, the demerger would be effective from October 1, 2017.
Spencer’s consistently improving month on month and quarter on quarter, the
Kerala and Bengaluru region are not doing well. However, October has been the
first month of profit before tax (PBT) positive for Spencer's. Plan to aggressively
grow in Bengal, UP and Andhra Pradesh but will grow sensibly and profitably.
Apparels will be a major area of thrust because it’s a high margin business.
2. GODREJ GROUP: Indian ECO on strong footing; see double-
digit growth for FMCG biz; Adi Godrej, Chairman
Indian economy on a very strong footing and expect it to be the fastest growing
economy going forward. The government has taken some good reforms which
will be very valuable in the long-term.
On outlook for realty estate sector and realty business in wake of RERA, will be
difficult for weak companies to survive. Several realty companies had
approached them with whom company does joint ventures and control
operation but do not buy land parcels.
Have witnessed price hikes and good demand for Vikhroli project and also for
some other projects. This is true with all good projects in the country and is
expected to continue as the economy starts picking up.
GST has done well for economy. The GDP growth in Q2 improved and with the
statistics department likely to revise the numbers upwards, Q3 GDP growth
would be huge, especially on a lower base.
Complaints about GST are mainly coming from people who used to evade taxes
in the past.
On FMCG business, Q3 would see a strong growth on a low base and should
continue doing excellent going forward as well.
Possible to maintain a volume growth of 10 percent going forward as well.
Agro business also has a strong future. It is a R&D based organization and with
government giving tremendous emphasis on agri sector, the sector will also do
well in terms of production. However, prices for the farmers is a bit of a worry
but the government is taking initiative to double farm incomes as well.
There is a visibility of farm distress but that is more in terms of prices than
outcome of a drought like situation. So rural demand for FMCG products is
good.
7 December 2017
7

3. WOCKHARDT: Aim to become a research-based co in 10 years;
no plans to sell assets; Habil F Khorakiwala, Founder
Company continues to see decent growth across all geographies.
Working on a drug discovery programme for antibiotics and all products are
moving into phase III clinical trial. Within next 2-3 years at least 1-2 products
would be in Indian as well as global markets.
With regards to the USFDA observations, going ahead with remedial actions and
plan to offer the facilities sometime next year for inspection.
No plans to divest any businesses and neither do promoters have any intention
of divesting their stake in the company.
Although no plans to sell assets to raise money, there is an enabling board
resolution in place to raise money of about Rs 1000 crore. As of now no plans to
exercise the action.
In a transformative stage to become a research-based company in next 10-
years.
4. DOLLAR IND: Hopeful of achieving close to 15% EBITDA margin
in next 2-3 QUARTERS; Vinod Kumar Gupta, MD
EBITDA margins improving and going to improve further in the coming times.
Hopeful on catching up to an EBITDA margin of close to 15 percent in next two-
three quarters.
Everybody now GST compliant, things have already started improving and that is
why have targeted a turnover of Rs 580 crore in second half of the current fiscal.
7 December 2017
8

From the think tank
1. The tasks for the 15th finance commission
The 15th Finance Commission led by N.K. Singh held its first meeting this week.
The tasks before it are unique in the sense that it has to make its
recommendations after the rules of fiscal federalism have been profoundly reset
by the introduction of the goods and services tax (GST). This is the first finance
commission that will do its work under the new tax system. The impact of GST on
federal public finances is still not clear. For example, the fact that the new tax,
which is a destination levy, will shift the incidence of taxation from production to
consumption means that the distribution of indirect taxes between different
states could change significantly. The ambiguity about the revenue-neutral GST
rate also puts a big question mark on the health of public finances at all levels
over the medium term. These issues need to be framed against the larger
challenge of increasing the Indian tax to gross domestic product ratio.
2. Behind GDP data, some signs of concern
The recent release of second-quarter (Q2) gross domestic product (GDP) data
for 2017-18 is encouraging at first glance as both the supply side (gross value
added, or GVA, at basic price went up from 5.6% to 6.1%) and demand side
(expenditure method data rose from 5.7% to 6.3%) have notched up higher
growth over the previous quarter. A comparison of the relevant quarters (Q2
2016-17 with Q2 2017-18) shows a slowdown, with GVA down from 6.8% to
6.1% and GDP growth down from 7.5% to 6.3%. A critical look at the data shows
that on the supply side, growth is supported by mining, which recorded a 5.5%
growth as compared with 1.3% in Q2 of 2016-17. Similarly, trade, hotel
transport and communications have recorded improvements, along with public
administration and defence.
3. Revolutionizing the Indian housing dream
The government launched the “Housing For All by 2022” programme in 2015, with
the Pradhan Mantri Awas Yojana (Pmay) as a key anchor scheme. Pmay envisages
building 20 million urban units by 2022. Global examples indicate that affordable
housing activities generate direct and indirect employment in the medium term
and sustained consumption in the long term. A 2014 study by the National Council
of Applied Economic Research indicates that every additional rupee of capital
invested in the housing sector adds Rs1.54 to the gross domestic product (GDP)
and every Rs1 lakh invested in residential housing creates 2.69 new jobs in the
economy.
7 December 2017
9

4. The need to rethink skilling India
Young and aspirational, the millennial generation that makes up about 40% of
India’s population has long been regarded as the saviour and driver of future
economic growth. Yet, the gap between the productive labour force and the
employment and entrepreneurial opportunities available to them continues to
widen. The fourth Industrial Revolution has already made its mark on certain
sectors. The economic turmoil that could be brought on by further large-scale
disruption should be a cause of concern. India’s status as an information
technology (IT) powerhouse has fostered the false hope that the nation could be
saved from future disruption. It should be noted, however, that the global appeal
of the Indian IT industry has been the labour cost arbitrage available to
multinational corporations looking to capitalize on a young, educated, English-
speaking population. Low wages cannot drive economic growth or foster
innovation, and the sector’s professionals are easily replaceable if they ask for
higher pay or wish to move up the ladder
International
5. Who's afraid of the us fed?
The answer to the above question seems to be: “Certainly not the financial
markets.” At least, that’s what the Bank for International Settlements (BIS) is
saying. In its quarterly review released on 3 December, the bank has tried to
analyse what is fuelling market optimism, despite the US Federal Reserve
starting to tighten its monetary policy. Simply put, the policy doesn’t seem to be
working, at least in the financial markets. In spite of the Fed Funds rate rising by
75 basis points (bps) since December 2016 and despite the Fed certain to raise
rates again at its 12-13 December meet, financial conditions as measured by the
Chicago Fed’s National Financial Conditions Index (NFCI) are now at a 24-year
low, which means they are at their loosest since July 1993
7 December 2017
10

Click excel icon
for detailed
valuation guide
CMP
(INR)
764
115
3,109
696
19,220
1,702
28,205
1,225
649
203
3,500
1,370
236
8,601
397
734
TP
% Upside
EPS (INR)
(INR) Downside FY17 FY18E FY19E
856
134
4,197
844
19,965
2,116
34,722
1,334
688
254
3,819
1,658
-
9,866
575
764
12
17
35
21
4
24
23
9
6
25
9
21
15
45
4
28.0
4.6
141.1
13.1
473.1
93.3
612.7
23.5
20.0
8.1
169.1
54.3
5.4
248.6
19.8
11.7
28.3
34.2
4.5
6.2
155.4 187.9
19.1
26.0
457.8 603.0
82.5 116.9
814.7 1,062.7
27.6
36.7
35.8
45.9
7.9
9.7
183.1 193.9
75.0
85.7
9.9
11.8
288.1 381.0
24.6
64.8
14.9
25.8
Valuation snapshot
P/E (x)
P/B (x)
ROE (%)
FY17 FY18E FY17 FY18E FY17 FY18E FY19E
27.3
25.2
22.0
53.3
40.6
18.2
46.0
52.2
32.5
24.9
20.7
25.2
44.0
34.6
20.0
62.5
29.2
34.5
26.2
27.5
22.4
31.7
19.6
17.7
34.4
NM
37.2
42.8
12.5
21.0
30.0
27.7
NM
19.3
38.4
13.0
NM
27.6
1,049.7
19.2
117.8
NA
52.3
46.9
27.6
27.8
19.8
62.0
35.2
82.3
17.1
27.0
25.5
20.0
36.4
42.0
20.6
34.6
44.4
18.1
25.6
19.1
18.3
23.9
29.9
16.1
49.2
24.6
28.8
21.5
80.0
19.4
26.2
22.0
19.2
27.1
18.0
31.2
31.1
16.7
17.2
25.3
9.3
57.4
22.5
9.1
10.3
7.1
20.2
21.4
NM
20.6
50.4
36.6
32.5
20.8
21.6
15.6
51.1
32.0
78.1
14.0
5.0
5.5
5.3
7.9
6.7
2.9
14.4
10.0
3.3
3.5
6.9
3.2
2.7
7.2
2.3
14.5
5.0
2.3
2.7
2.1
2.1
5.4
2.2
1.2
4.8
0.7
4.8
4.5
1.2
3.3
3.5
1.1
0.8
0.8
0.5
1.3
0.3
1.0
1.5
0.5
1.0
NA
10.0
5.5
2.9
4.6
2.3
18.6
6.5
NA
4.1
4.4
5.0
4.7
6.8
6.1
2.5
10.8
8.4
2.8
3.2
6.0
2.9
2.5
6.2
2.0
11.8
4.4
2.0
2.2
2.0
1.7
4.7
2.3
1.2
4.3
0.7
4.3
3.2
1.1
2.8
3.0
1.0
0.9
0.7
0.5
1.2
0.3
0.9
1.4
0.5
1.0
4.8
5.9
4.5
2.6
3.9
2.1
15.2
5.9
NA
3.7
20.3
23.1
26.9
16.2
15.8
16.9
37.1
20.8
10.6
13.9
35.7
14.2
6.4
20.3
9.8
25.6
17.2
6.9
10.8
9.5
9.9
18.3
10.9
7.2
15.3
-27.0
13.8
12.3
9.0
18.9
11.5
4.0
-6.7
4.2
1.4
10.1
-8.4
3.6
-0.2
2.7
0.9
0.0
21.6
15.1
12.0
18.0
14.4
32.5
18.9
25.5
25.5
17.3
20.4
25.0
20.1
15.2
13.0
35.7
20.5
16.8
12.5
33.7
14.5
10.8
20.5
13.4
26.5
17.9
7.3
11.5
2.6
9.6
18.8
8.8
6.3
16.9
4.0
14.8
12.4
6.7
17.3
11.9
6.4
1.5
3.4
5.8
11.6
4.6
4.7
7.0
-4.7
4.6
12.5
20.2
15.3
13.2
19.6
14.1
32.8
19.3
22.7
27.6
18.1
25.2
26.8
23.2
18.1
16.2
35.0
22.8
18.4
13.7
31.1
14.6
11.5
23.0
28.3
35.6
22.8
10.8
11.8
8.2
10.0
20.4
10.5
6.9
19.0
8.0
16.5
13.7
12.6
19.5
13.9
9.4
4.3
6.1
7.3
12.7
5.4
7.1
11.4
2.1
7.7
12.3
20.4
19.3
15.4
19.6
15.3
32.8
18.6
22.2
30.7
Company
Automobiles
Amara Raja
Ashok Ley.
Bajaj Auto
Bharat Forge
Bosch
CEAT
Eicher Mot.
Endurance Tech.
Escorts
Exide Ind
Hero Moto
M&M
Mahindra CIE
Maruti Suzuki
Tata Motors
TVS Motor
Aggregate
Banks - Private
Axis Bank
DCB Bank
Equitas Hold.
Federal Bank
HDFC Bank
ICICI Bank
IDFC Bank
IndusInd
J&K Bank
Kotak Mah. Bk
RBL Bank
South Indian
Yes Bank
Aggregate
Banks - PSU
BOB
BOI
Canara
IDBI Bk
Indian Bk
OBC
PNB
SBI
Union Bk
Aggregate
NBFCs
Aditya Birla Cap
Bajaj Fin.
Bharat Fin.
Capital First
Cholaman.Inv.&Fn
Dewan Hsg.
GRUH Fin.
HDFC
HDFC Stand. Life
Indiabulls Hsg
Reco
Buy
Buy
Buy
Buy
Neutral
Buy
Buy
Buy
Sell
Buy
Neutral
Buy
Not Rated
Buy
Buy
Neutral
Buy
Neutral
Buy
Buy
Buy
Buy
Neutral
Buy
Buy
Buy
Buy
Buy
Buy
530
183
139
108
1,802
299
53
1,654
75
999
509
31
306
680
197
209
146
2,150
355
56
2,000
100
1,179
665
36
382
28
8
51
35
19
19
5
21
34
18
31
16
25
15.4
7.0
5.0
4.8
56.8
15.3
3.0
48.1
-31.3
26.8
11.9
2.5
14.6
18.4
8.5
1.7
5.5
68.7
13.6
2.8
60.9
4.1
32.1
16.4
1.9
17.8
30.8
10.5
5.7
6.6
84.7
17.0
3.2
78.6
8.7
41.6
23.0
3.8
23.3
Buy
Neutral
Neutral
Neutral
Buy
Neutral
Buy
Buy
Neutral
166
182
363
59
380
121
172
312
155
201
201
386
49
438
150
250
415
175
21
10
6
-16
15
24
45
33
13
6.0
-14.8
18.8
1.5
29.3
-31.6
6.2
0.3
8.1
17.9
3.2
16.1
6.4
36.7
17.1
8.5
14.6
-13.5
22.6
9.2
30.3
8.6
44.0
21.4
13.5
26.8
6.0
Buy
Buy
Under Review
Buy
Buy
Buy
Neutral
Buy
Buy
Buy
187
1,675
984
681
1,278
586
504
1,649
368
1,172
231
2,300
-
925
1,500
690
500
2,000
370
1,550
24
37
36
17
18
-1
21
1
32
0.0
32.0
21.0
24.6
46.0
29.6
8.1
46.8
4.5
68.6
3.7
45.7
30.3
32.8
59.2
37.6
9.9
51.6
4.7
83.6
5.4
63.7
47.2
43.7
70.4
46.0
12.0
57.1
5.4
105.1
7 December 2017
11

Click excel icon
for detailed
valuation guide
CMP
(INR)
168
555
100
444
432
1,319
610
2,079
1,343
TP
% Upside
(INR) Downside
240
43
680
23
-
500
13
550
27
1,750
33
800
31
2,650
27
1,500
12
EPS (INR)
FY18E FY19E
6.9
10.4
41.0
46.5
9.2
9.7
14.2
19.1
42.6
42.0
52.5
66.5
36.0
41.9
115.6 145.3
15.5
11.8
Valuation snapshot
P/E (x)
P/B (x)
ROE (%)
FY17 FY18E FY17 FY18E FY17 FY18E FY19E
32.1
24.2 3.8
3.3
12.4 14.9 18.9
14.5
13.5 2.5
2.2
19.1 17.4 17.2
11.6
10.9 2.5
2.3
24.0 22.3 21.4
62.7
31.4 3.9
3.6
6.4
11.9 14.8
14.6
10.1 2.7
2.2
19.4 23.8 19.9
41.7
25.1 4.0
3.6
13.8 15.0 16.7
20.9
17.0 3.4
2.8
17.4 18.0 17.6
24.6
18.0 2.7
2.4
11.7 14.3 15.9
60.5
86.8 2.7
2.4
11.7 15.1 17.4
33.1
26.4 5.3
4.5
16.1 17.2 17.9
68.2
28.4
67.5
59.0
58.4
20.1
32.5
70.5
53.4
26.4
28.1
63.4
54.9
35.0
19.9
38.9
36.9
53.5
46.8
39.4
78.4
16.2
29.2
29.6
59.2
25.1
NM
413.2
NM
44.2
42.0
37.0
52.5
64.5
48.9
47.1
48.0
53.0
39.1
64.9
29.9
32.8
66.4
25.2
30.8
46.1
52.7
57.1
34.0
42.9
44.3
21.9
24.3
57.2
43.1
36.2
17.3
34.3
31.7
37.6
32.4
35.0
50.0
13.4
28.1
20.9
33.9
25.3
26.1
41.1
35.0
35.0
39.5
29.6
51.2
56.3
44.4
44.1
47.9
47.3
37.9
55.8
27.6
40.1
8.7
5.9
1.0
9.6
31.8
1.2
6.4
10.0
9.7
5.1
3.3
5.9
10.1
4.8
3.3
6.0
3.8
2.7
3.7
2.6
5.4
1.6
1.0
4.0
3.5
4.4
3.4
5.9
2.2
7.7
4.6
3.5
13.9
21.2
22.2
12.4
16.5
12.9
8.2
42.5
6.8
6.1
7.7
4.5
1.0
9.0
23.3
1.2
5.9
8.8
8.6
4.3
3.0
5.2
8.5
4.4
2.8
5.3
3.5
2.6
3.5
2.5
4.9
1.5
1.0
3.4
3.2
3.8
3.0
5.3
2.1
6.4
4.1
3.1
13.6
17.5
21.1
10.6
14.1
10.1
8.0
42.3
6.7
6.3
12.7
20.6
1.5
18.0
76.4
6.2
21.2
12.4
18.2
19.2
12.5
9.3
19.8
14.3
16.9
18.0
10.3
5.1
7.9
7.1
7.2
10.8
3.4
14.4
6.1
19.0
-3.2
1.4
-0.6
18.4
11.6
9.3
28.5
36.9
50.4
28.4
35.8
24.6
22.2
66.5
23.5
21.1
11.6
17.9
3.3
20.2
51.0
2.1
18.1
21.8
19.5
19.5
13.1
9.1
21.4
12.6
17.5
16.5
11.0
7.0
11.1
7.3
10.3
11.5
3.5
17.5
9.9
16.0
12.3
13.7
6.1
20.0
11.1
10.6
26.9
34.0
48.7
26.0
31.7
23.8
21.4
75.9
24.4
15.5
14.6
18.1
3.3
27.8
49.8
3.3
22.2
22.6
21.2
20.2
14.0
13.1
21.5
13.2
16.4
16.3
12.1
8.0
14.2
12.0
12.7
14.5
6.0
19.2
13.9
17.9
15.6
21.3
11.3
17.4
14.2
12.9
29.4
35.2
56.2
27.3
34.0
22.9
22.6
88.0
25.6
18.3
Company
L&T Fin Holdings
LIC Hsg Fin
Manappuram
M&M Fin.
Muthoot Fin
PNB Housing
Repco Home
Shriram City Union
STF
Aggregate
Capital Goods
ABB
Bharat Elec.
BHEL
Blue Star
CG Cons. Elec.
CG Power & Indu.
Cummins
GE T&D
Havells
K E C Intl
L&T
Siemens
Solar Ind
Thermax
Va Tech Wab.
Voltas
Aggregate
Cement
Ambuja Cem.
ACC
Birla Corp.
Dalmia Bharat
Grasim Inds.
India Cem
J K Cements
JK Lakshmi Ce
Ramco Cem
Orient Cem
Prism Cem
Sagar Cements
Shree Cem
Ultratech
Aggregate
Consumer
Asian Paints
Britannia
Colgate
Dabur
Emami
Godrej Cons.
GSK Cons.
HUL
ITC
Jyothy Lab
Reco
Buy
Neutral
Not Rated
Buy
Neutral
Buy
Buy
Buy
Buy
FY17
5.2
38.2
8.6
7.1
29.5
31.6
29.1
84.3
22.2
Sell
Buy
Sell
Neutral
Buy
Neutral
Buy
Neutral
Buy
Neutral
Buy
Neutral
Neutral
Neutral
Buy
Neutral
1,344
179
90
759
273
82
861
404
510
313
1,190
1,129
1,131
1,081
596
601
1,230
210
78
685
260
90
1,150
440
590
350
1,450
1,313
1,120
930
745
580
-8
17
-14
-10
-5
9
34
9
16
12
22
16
-1
-14
25
-4
19.7
6.3
1.3
12.9
4.7
4.1
26.5
5.7
9.6
11.9
42.3
17.8
20.6
30.8
29.9
15.5
20.2
7.1
2.9
16.5
5.2
1.4
25.3
9.4
11.5
14.3
49.0
19.8
26.2
29.9
34.5
17.5
28.7
8.0
3.0
24.4
6.5
2.3
35.0
11.2
14.3
17.6
57.5
31.0
31.3
34.4
37.2
19.6
Neutral
Neutral
Buy
Buy
Neutral
Neutral
Buy
Buy
Buy
Buy
Buy
Not Rated
Buy
Buy
261
1,689
1,126
3,038
1,096
164
998
412
685
164
113
818
17,000
4,034
314
1,797
1,435
3,517
1,302
188
1,324
512
853
205
130
-
21,852
4,906
20
6
27
16
19
14
33
24
24
25
15
29
22
4.9
6.9
36.1 52.2
28.5 32.2
38.8 60.8
67.8 81.9
5.6
5.8
33.7 47.8
7.0
12.1
27.3 27.1
-1.6
6.3
0.3
2.7
-1.9 23.4
384.4 486.2
96.1 102.2
8.4
70.9
56.7
83.7
116.8
10.5
61.8
19.1
35.1
9.1
5.0
47.4
499.3
147.1
Neutral
Buy
Buy
Buy
Buy
Neutral
Neutral
Buy
Neutral
Neutral
1,104
4,756
1,038
341
1,274
1,002
6,100
1,274
251
368
1,280
5,845
1,325
410
1,435
1,015
5,400
1,500
280
365
16
23
28
20
13
1
-11
18
11
-1
21.0 21.6
73.7 84.5
21.2 23.4
7.2
7.7
26.5 26.6
18.9 21.2
156.1 160.8
19.6 22.8
8.4
9.1
11.2
9.2
25.8
106.9
28.6
9.3
33.2
24.5
182.3
27.6
10.0
10.9
7 December 2017
12

Click excel icon
for detailed
valuation guide
CMP
(INR)
306
7,676
22,144
245
835
9,671
166
1,021
3,352
TP
% Upside
(INR) Downside
340
11
7,750
1
25,580
16
275
12
975
17
9,267
-4
-
1,320
29
2,970
-11
EPS (INR)
FY18E FY19E
6.5
7.9
128.4 149.0
296.6 413.1
8.9
12.4
17.2
20.8
151.5 176.7
3.5
6.4
14.7
18.0
34.9
53.7
Valuation snapshot
P/E (x)
FY17 FY18E
48.7
47.1
62.1
59.8
92.8
74.6
67.9
27.4
49.9
48.5
72.7
63.8
47.1
47.8
117.6 69.6
125.4 96.0
47.9
43.7
23.8
28.1
22.3
16.6
50.8
29.5
37.5
25.5
30.2
14.0
13.7
17.1
71.2
33.0
18.6
14.3
33.6
43.5
24.8
19.6
41.4
23.6
23.8
NM
10.3
23.2
33.6
20.9
23.7
30.8
24.3
14.7
84.9
24.0
28.2
31.5
36.2
77.0
14.1
15.5
55.4
28.6
15.5
21.5
31.3
33.7
19.1
35.6
33.4
26.0
27.9
133.6
9.2
20.8
25.8
17.5
16.2
31.6
30.4
27.5
8.3
13.9
25.5
P/B (x)
ROE (%)
FY17 FY18E FY17 FY18E FY19E
17.0 14.8 36.7 33.6 37.1
24.6 22.2 40.9 39.0 40.9
37.1 29.7 40.0 39.8 44.4
3.1
2.8
6.0
10.8 13.3
12.9 10.7 28.2 24.1 23.9
45.6 37.8 39.3 64.8 62.9
2.4
2.3
5.2
4.9
8.5
11.6 10.1 10.2 15.5 16.5
25.1 17.5 21.3 18.2 20.9
13.2 12.3 27.6 28.2 29.5
5.1
5.6
7.2
4.1
6.4
6.2
3.8
5.1
3.0
1.3
3.4
3.1
10.3
2.7
3.1
2.7
5.8
5.3
2.6
3.4
8.4
5.1
4.0
2.7
1.4
4.4
3.8
2.3
2.4
17.7
3.6
2.6
2.1
2.7
3.7
4.4
4.9
5.8
3.2
6.1
5.2
3.4
5.2
2.9
1.2
2.8
2.2
12.2
2.5
2.6
2.5
5.3
4.6
2.3
3.2
6.8
4.5
3.6
2.5
1.2
3.7
3.4
2.1
2.2
13.5
3.4
2.5
1.9
2.3
3.5
15.7
3.4
2.4
3.8
23.0
21.9
36.7
27.6
12.3
23.0
10.2
22.0
9.7
10.0
24.7
21.1
14.5
8.6
18.0
20.9
17.1
14.4
10.8
18.1
22.2
23.8
16.8
-0.6
14.0
20.7
12.0
11.0
13.7
50.5
10.8
7.3
12.4
16.7
12.3
25.1
24.6
-19.1
6.7
19.9
17.0
26.4
24.6
7.2
23.4
12.1
16.3
8.2
1.6
19.6
17.7
22.0
9.2
18.4
12.0
17.1
14.7
12.9
9.2
22.5
18.3
12.9
1.9
14.1
19.1
13.8
11.8
14.1
48.6
11.5
9.2
19.4
17.8
13.6
12.5
22.8
-6.4
6.3
19.8
19.4
25.7
22.3
11.0
26.1
13.6
21.2
14.1
3.9
18.4
18.8
31.4
12.0
19.2
12.5
17.6
20.5
18.3
13.7
20.7
19.9
15.4
7.0
12.9
17.0
12.5
11.6
15.4
46.8
14.1
11.7
25.4
18.6
16.1
34.9
22.2
0.2
10.1
Company
Marico
Nestle
Page Inds
Parag Milk
Pidilite Ind.
P&G Hygiene
Prabhat Dairy
United Brew
United Spirits
Aggregate
Healthcare
Alembic Phar
Alkem Lab
Ajanta Pharma
Aurobindo
Biocon
Cadila
Cipla
Divis Lab
Dr Reddy’s
Fortis Health
Glenmark
Granules
GSK Pharma
IPCA Labs
Jubilant Life
Lupin
Sanofi India
Shilpa Medicare
Strides Shasun
Sun Pharma
Syngene Intl
Torrent Pharma
Aggregate
Infrastructure
Ashoka Buildcon
IRB Infra
KNR Constructions
Sadbhav
Engineering
Aggregate
Logistics
Allcargo Logistics
Blue Dart
Concor
Gateway
Distriparks
Gati
Transport Corp.
Aggregate
Media
Dish TV
D B Corp
Den Net.
Ent.Network
Reco
Neutral
Neutral
Buy
Neutral
Buy
Neutral
Not Rated
Buy
Neutral
FY17
6.3
123.7
238.7
3.6
16.7
132.9
3.5
8.7
26.7
Neutral
Buy
Buy
Buy
Neutral
Buy
Neutral
Neutral
Neutral
Buy
Neutral
Buy
Neutral
Neutral
Buy
Buy
Buy
Buy
Buy
Buy
Not Rated
Neutral
513
2,094
1,280
654
518
419
596
1,020
2,195
145
537
124
2,448
530
687
809
4,345
610
800
512
539
1,302
540
2,500
1,606
900
485
555
600
1,100
2,575
185
650
200
2,500
550
861
1,000
5,000
797
1,214
610
-
1,400
5
19
26
38
-6
32
1
8
17
28
21
62
2
4
25
24
15
31
52
19
8
21.6 21.6
74.6 68.0
57.3 52.7
39.3 44.6
10.2
6.1
14.2 17.5
15.9 21.1
39.9 32.4
72.6 60.6
10.3
1.9
39.3 37.9
7.2
8.0
34.4 44.2
16.1 18.6
36.9 44.2
56.6 37.6
129.1 139.0
14.0 18.1
32.3 41.8
26.1 14.4
13.0 16.1
55.2 50.0
24.9
89.5
64.1
50.3
10.1
23.7
27.0
43.7
115.2
4.9
42.8
11.0
54.9
26.5
55.0
42.7
156.2
29.9
69.2
22.9
18.0
61.4
Buy
Neutral
Buy
Buy
242
210
277
368
260
240
295
435
8
14
6
18
-0.5
20.3
12.0
11.0
1.8
22.9
13.3
14.3
7.1
23.2
14.1
14.5
Buy
Not Rated
Neutral
Buy
Not Rated
Not Rated
176
4,100
1,300
241
131
293
215
-
1,496
282
-
-
22
15
17
9.8
10.9
102.5 129.9
38.0 42.7
6.8
8.4
16.9
8.8
15.9
21.0
13.3
163.2
55.2
11.6
23.9
25.9
17.9
40.0
34.2
35.5
15.7
17.3
30.4
79.7
17.8
NM
63.9
Buy
Buy
Neutral
Neutral
82
356
106
730
106
430
90
910
30
21
-15
25
1.0
20.0
-9.3
11.4
0.6
21.7
-2.9
11.6
2.2
25.4
0.1
20.1
132.9 17.8
16.4 4.1
NM
2.2
63.1 4.1
7 December 2017
13

Click excel icon
for detailed
valuation guide
CMP
(INR)
242
99
164
391
1,269
101
26
842
569
TP
% Upside
(INR) Downside
302
25
113
14
225
37
469
20
1,640
29
130
29
27
5
1,005
19
630
11
EPS (INR)
FY18E FY19E
25.6
30.2
10.4
11.9
11.3
13.4
8.7
14.1
27.1
43.0
3.1
6.1
-0.8
0.1
28.1
35.7
10.5
16.0
Valuation snapshot
P/E (x)
P/B (x)
ROE (%)
FY17 FY18E FY17 FY18E FY17 FY18E FY19E
9.4
9.5
1.5
1.3
18.2 15.0 15.3
13.4
9.5
1.0
0.9
7.9
10.2 10.6
15.4
14.5 2.5
2.5
18.5 17.3 19.3
60.8
45.1 4.1
3.7
11.2
8.6
12.6
61.8
46.9 6.1
5.5
10.4 12.4 17.0
82.3
32.7 5.4
4.6
7.6
15.3 24.8
NM
NM
4.2
4.8 -29.4 -14.2
2.4
33.9
30.0 8.2
7.6
26.0 26.4 30.7
47.0
54.4 6.4
5.9
17.0 12.8 16.8
42.3
36.7 5.3
4.9
12.6 13.4 17.2
27.1
14.5
NM
16.4
20.5
12.9
NM
36.5
18.6
17.6
24.8
10.2
20.2
53.2
23.0
10.0
9.3
36.8
25.1
8.2
18.0
10.7
21.5
19.2
14.0
170.8
37.5
85.8
75.5
19.0
14.3
24.5
15.8
13.5
17.5
21.7
18.6
16.7
17.2
32.3
19.7
12.3
12.6
NM
11.9
16.3
9.7
NM
13.8
11.1
11.2
14.7
11.4
16.2
37.3
16.7
11.1
9.8
32.3
20.3
13.1
11.7
9.3
16.3
16.4
13.0
79.7
26.6
61.9
52.7
16.2
13.6
20.5
15.5
13.6
15.8
18.9
17.2
14.5
15.0
26.9
20.0
1.8
3.9
0.5
2.6
1.4
1.8
0.8
3.9
1.7
2.0
1.7
3.1
2.0
7.2
2.5
3.0
1.8
7.7
5.9
2.1
1.0
1.0
4.5
2.0
1.8
14.0
4.7
16.2
11.6
3.1
3.6
5.9
3.3
2.0
6.4
3.5
2.5
2.2
2.7
10.1
5.9
1.6
4.2
0.5
2.2
1.4
1.7
0.8
3.1
1.6
1.8
1.7
2.7
1.9
6.2
2.3
2.6
1.6
6.5
5.3
1.9
0.9
1.0
3.8
1.8
1.7
13.1
4.1
13.1
9.8
2.8
3.4
5.1
3.6
1.8
4.9
3.4
2.8
2.2
2.6
8.2
6.3
7.4
24.4
-7.9
17.3
7.2
12.8
-9.9
10.9
9.7
15.7
7.0
32.4
9.6
14.0
11.6
32.4
20.7
21.0
24.5
31.4
5.7
10.1
23.2
11.6
13.1
8.2
14.6
20.6
15.3
16.2
27.5
26.5
22.0
14.3
41.6
16.8
13.2
13.7
17.0
37.1
32.6
13.6
32.3
-4.7
19.8
8.6
15.6
-6.9
25.2
15.1
17.1
11.4
25.2
12.0
17.8
14.4
25.1
17.2
22.0
27.3
15.1
8.0
10.8
25.2
12.1
12.9
16.5
16.5
23.4
18.5
17.4
25.9
26.4
21.8
14.1
35.2
17.3
14.6
15.1
17.9
33.6
30.6
16.5
42.5
0.1
20.2
10.1
16.2
-4.9
29.7
23.8
16.6
15.3
25.8
12.6
22.1
14.0
25.0
16.9
21.0
24.4
16.7
10.4
12.5
23.7
12.0
13.5
20.9
17.5
25.5
20.9
18.3
25.6
23.4
22.5
14.5
29.6
21.2
17.3
16.4
20.8
32.4
33.5
Company
Hind. Media
HT Media
Jagran Prak.
Music Broadcast
PVR
Prime Focus
Siti Net.
Sun TV
Zee Ent.
Aggregate
Metals
Hindalco
Hind. Zinc
JSPL
JSW Steel
Nalco
NMDC
SAIL
Rain Industries
Vedanta
Tata Steel
Aggregate
Oil & Gas
BPCL
GAIL
Gujarat Gas
Gujarat St. Pet.
HPCL
IOC
IGL
Mahanagar Gas
MRPL
Oil India
ONGC
PLNG
Reliance Ind.
Aggregate
Retail
Jubilant Food
PC Jeweller
Titan Co.
Aggregate
Technology
Cyient
HCL Tech.
Hexaware
Infosys
KPIT Tech
L&T Infotech
Mindtree
Mphasis
NIIT Tech
Persistent Sys
Tata Elxsi
TCS
Reco
Buy
Neutral
Buy
Buy
Buy
Buy
Neutral
Buy
Buy
FY17
25.8
7.4
10.7
6.4
20.5
1.2
-1.9
24.9
12.1
Buy
Neutral
Buy
Buy
Neutral
Buy
Sell
Buy
Buy
Neutral
232
286
159
242
76
128
76
351
282
668
326
322
209
297
87
187
43
492
394
672
41
13
32
22
14
46
-43
40
40
1
8.6
19.7
-20.9
14.8
3.7
10.0
-10.1
9.6
15.1
37.9
18.8
22.7
-15.1
20.3
4.7
13.2
-6.4
25.5
25.5
59.4
26.4
33.5
0.5
24.9
5.8
12.7
-4.3
38.9
44.4
65.2
Buy
Sell
Buy
Neutral
Buy
Buy
Buy
Neutral
Sell
Buy
Buy
Buy
Buy
491
456
854
203
405
389
324
1,105
121
348
176
244
928
643
378
1,011
184
579
554
404
1,219
110
418
231
312
1,077
31
-17
18
-9
43
43
25
10
-9
20
31
28
16
48.3
22.6
16.1
8.8
40.7
41.9
8.8
44.0
14.8
19.3
16.4
11.4
48.3
43.1
28.1
22.9
12.1
36.4
39.5
10.0
54.4
9.2
29.8
19.0
15.0
56.7
52.1
31.9
33.6
13.2
42.8
43.6
11.3
53.8
11.5
40.5
22.8
16.7
62.1
Sell
Buy
Buy
1,709
400
775
1,270
490
850
-26
22
10
10.0
10.7
9.0
21.4
15.1
12.5
27.4
18.4
15.9
Buy
Neutral
Neutral
Buy
Neutral
Buy
Buy
Neutral
Neutral
Buy
Buy
Neutral
584
857
335
990
161
973
539
725
636
649
910
2,631
600
970
270
1,100
160
950
600
670
600
780
1,004
2,450
3
13
-19
11
-1
-2
11
-8
-6
20
10
-7
30.6 36.0
59.8 63.2
13.7 16.3
62.8 63.8
11.9 11.9
55.5 61.6
24.9 28.5
38.9 42.0
38.0 43.7
37.7 43.3
28.1 33.8
133.4 131.8
41.9
68.2
17.0
67.8
14.1
66.0
35.1
46.0
50.3
52.4
40.2
151.4
7 December 2017
14

Click excel icon
for detailed
valuation guide
CMP
(INR)
472
282
838
TP
% Upside
(INR) Downside
560
19
280
-1
1,020
22
EPS (INR)
FY18E FY19E
35.8
37.7
19.1
20.1
52.8
72.7
Valuation snapshot
P/E (x)
P/B (x)
ROE (%)
FY17 FY18E FY17 FY18E FY17 FY18E FY19E
15.3
13.2 2.5
2.4
18.4 18.9 18.2
16.7
14.8 2.7
2.6
16.9 17.0 16.7
16.1
15.9 2.6
2.3
17.2 15.3 18.4
17.5
17.3 4.0
4.2
22.9 24.4 23.2
42.7
24.9
NM
66.7
44.8
17.7
18.9
20.5
14.7
14.3
11.8
15.9
34.6
146.1
54.2
22.3
28.8
30.2
79.9
33.9
26.3
8.7
79.7
27.2
60.6
36.5
28.5
21.9
93.8
28.9
37.6
20.8
35.8
53.6
13.1
51.8
65.0
128.9 2.9
21.9 4.4
NM
1.4
122.6 11.9
-307.6 2.9
15.1
11.0
19.5
13.0
11.5
12.0
13.4
40.7
93.6
46.1
20.2
31.0
20.8
43.1
30.5
18.0
14.0
52.8
15.2
38.7
34.2
23.4
19.0
30.2
32.3
26.1
23.3
39.2
48.3
10.5
49.6
51.9
6.7
1.2
1.2
1.5
2.1
2.0
2.3
3.1
18.2
7.1
1.8
32.7
5.1
6.1
11.0
11.5
2.6
7.7
3.5
3.8
3.4
8.0
5.4
12.7
8.2
3.2
3.3
4.6
9.3
1.6
9.3
15.5
2.8
4.4
1.8
12.9
3.1
6.4
1.1
1.2
1.4
1.8
1.8
2.1
3.0
16.0
6.4
1.9
29.6
4.4
4.1
8.8
6.6
2.2
6.9
3.7
3.6
3.5
7.2
4.6
5.1
6.8
2.9
3.0
4.3
7.8
1.4
8.5
12.7
6.8
16.2
-1.6
48.4
6.6
37.8
6.5
6.3
10.5
15.6
17.1
14.4
10.3
17.9
2.2
20.2
-26.6
10.1
-1.0
42.4
10.7
6.3
11.0
17.0
16.0
15.7
7.4
18.2
3.7
22.8
-41.4
30.0
0.2
47.7
11.1
5.0
11.9
17.4
14.6
16.8
10.9
22.9
15.7
8.0
96.1
23.4
12.9
31.5
43.0
18.5
13.7
27.4
13.5
14.4
34.5
27.9
16.4
22.9
15.3
16.3
15.1
22.2
16.1
20.7
28.8
Company
Reco
Tech Mah
Buy
Wipro
Neutral
Zensar Tech
Buy
Aggregate
Telecom
Bharti Airtel
Buy
Bharti Infratel
Neutral
Idea Cellular
Buy
Tata Comm
Buy
Aggregate
Utiltites
Coal India
Buy
CESC
Buy
JSW Energy
Sell
NTPC
Buy
Power Grid
Buy
Tata Power
Sell
Aggregate
Others
Arvind
Neutral
Avenue
Sell
Supermarts
Bata India
Sell
BSE
Neutral
Castrol India
Buy
Coromandel Intl Buy
Delta Corp
Buy
Eveready Inds.
Buy
Interglobe
Neutral
Indo Count
Neutral
Info Edge
Buy
Kaveri Seed
Buy
Manpasand
Buy
MCX
Buy
Monsanto
Buy
Navneet Education Buy
Quess Corp
Buy
PI Inds.
Buy
Piramal Enterp.
Buy
SRF
Buy
S H Kelkar
Buy
Team Lease Serv. Buy
Trident
Buy
TTK Prestige
Neutral
V-Guard
Neutral
FY17
30.9
16.9
52.1
484
370
93
665
680
440
110
780
41
19
18
17
11.3
14.9
-1.1
10.0
3.8
16.8
-16.1
5.4
6.5
19.2
-18.0
18.2
265
979
79
175
200
88
335
1,360
49
211
261
72
26
39
-38
20
30
-18
14.9
51.9
3.8
12.0
14.0
7.4
17.5
89.1
4.0
13.4
17.4
7.3
20.7
102.1
3.3
15.7
20.4
7.5
428
1,121
733
914
392
502
244
437
1,136
113
1,249
518
385
905
2,455
160
938
965
2,727
1,786
259
2,080
87
6,841
232
425
873
578
1,100
467
523
257
400
1,291
128
1,300
738
492
1,300
3,293
209
1,170
890
3,266
1,992
301
2,300
114
5,281
167
-1
-22
-21
20
19
4
5
-8
14
14
4
42
28
44
34
31
25
-8
20
12
16
11
31
-23
-28
12.4
7.7
10.5
12.0
16.5
17.5
19.3
46.1
13.3
29.0
8.0
17.4
75.4
10.7
26.2
41.0
15.4
39.2
126.6
10.4
32.7
35.6
149.7
104.9
9.7
66.4
10.4
176.1
6.0
13.5 15.9
41.0 45.3
13.6 12.6
16.6 24.1
3.1
5.7
12.9 14.3
43.2 63.2
13.0
8.0
15.7 23.6
19.1 34.1
6.3
9.9
24.8 26.5
86.2 105.0
7.3
8.4
10.0 31.1
33.4 29.9
72.6 104.6
85.9 76.7
7.2
6.6
38.8 43.0
6.6
8.3
132.1 137.8
3.6
4.5
13.9 14.6
8.3
9.3
115.0 100.3
17.5 22.5
8.1
12.1
37.7 32.1
51.0 46.8
34.8 17.0
10.2 13.7
13.6 23.3
7.3
8.4
10.2 10.0
31.5 32.5
26.7 26.3
19.0 24.2
32.8 23.0
9.0
11.7
16.6 13.2
13.7 11.3
19.2 17.6
13.0 14.5
19.5 18.0
27.4 26.9
7 December 2017
15

MOSL Universe stock performance
Company
Automobiles
Amara Raja
Ashok Ley.
Bajaj Auto
Bharat Forge
Bosch
CEAT
Eicher Mot.
Endurance Tech.
Escorts
Exide Ind
Hero Moto
M&M
Mahindra CIE
Maruti Suzuki
Tata Motors
TVS Motor
Banks - Private
Axis Bank
DCB Bank
Equitas Hold.
Federal Bank
HDFC Bank
ICICI Bank
IDFC Bank
IndusInd
J&K Bank
Kotak Mah. Bk
RBL Bank
South Indian
Yes Bank
Banks - PSU
BOB
BOI
Canara
IDBI Bk
Indian Bk
OBC
PNB
SBI
Union Bk
NBFCs
Aditya Birla Cap
Bajaj Fin.
Bharat Fin.
Capital First
Cholaman.Inv.&Fn
Dewan Hsg.
GRUH Fin.
HDFC
HDFC Stand. Life
Indiabulls Hsg
L&T Fin.Holdings
LIC Hsg Fin
Manappuram
M&M Fin.
1 Day (%)
-1.6
0.4
-1.7
-0.2
-3.6
-0.9
-2.5
0.0
-2.0
-0.1
-0.6
-1.4
-0.1
1.2
-1.4
-0.4
-0.7
-1.0
-0.6
-0.3
-1.1
-2.0
-1.2
-0.7
-1.1
-0.1
-0.2
-1.4
-0.8
-2.3
-1.1
-2.8
0.0
-2.0
-2.2
-2.2
-2.2
-3.6
-1.7
-1.9
-1.1
-2.0
-1.9
-2.0
-0.2
-1.8
1.7
-1.3
-1.7
-3.1
-2.7
0.6
1M (%)
10.5
-9.0
-3.2
-2.0
-8.0
-4.7
-9.3
3.7
-9.4
-0.3
-5.2
0.4
-5.1
3.6
-14.0
3.9
-0.7
1.2
-4.0
-7.6
-1.6
-5.3
-7.1
0.4
-6.9
-0.9
-1.7
-0.6
-4.3
-3.5
-11.3
-10.6
-8.9
0.6
-15.9
-14.5
-5.1
-12.0
-9.9
-7.9
-0.1
-7.2
1.1
-8.8
2.0
-7.6
-4.5
-14.0
-8.5
-1.8
2.4
12M (%)
-17.1
46.8
13.9
55.3
-6.2
34.4
25.6
116.9
103.2
14.4
9.5
16.6
25.2
67.3
-10.1
106.5
16.0
69.2
-13.8
55.4
51.1
26.1
-19.6
53.0
22.9
36.0
46.2
62.1
28.3
2.3
55.8
19.0
-13.8
57.1
2.1
28.1
20.5
8.4
Company
Muthoot Fin
PNB Housing
PFC
Repco Home
REC
STF
Shriram City Union
Capital Goods
ABB
Bharat Elec.
BHEL
Blue Star
CG Cons. Elec.
CG Power & Inds Sol.
Cummins
GE T&D
Havells
K E C Intl
L&T
Pennar Eng.
Siemens
Solar Ind
Suzlon Energy
Thermax
Va Tech Wab.
Voltas
Cement
Ambuja Cem.
ACC
Birla Corp.
Dalmia Bharat
Grasim Inds.
India Cem
J K Cements
JK Lakshmi Ce
Ramco Cem
Orient Cem
Prism Cem
Sagar Cements
Shree Cem
Ultratech
Consumer
Asian Paints
Britannia
Colgate
Dabur
Emami
Godrej Cons.
GSK Cons.
HUL
ITC
Jyothy Lab
Marico
Nestle
Page Inds
Parag Milk
1 Day (%)
-1.4
1.1
-0.8
0.0
-0.5
-2.2
0.1
-1.4
-1.6
0.3
1.5
0.1
-2.4
-1.0
-1.1
0.7
-0.1
-1.4
-4.1
-3.1
-1.2
0.4
-0.8
-0.5
-3.4
0.4
0.0
0.0
-0.7
-2.0
-1.9
0.5
0.1
-0.3
0.0
0.3
-0.3
0.1
-1.9
-0.9
-0.2
0.8
-0.5
-1.1
2.4
0.3
1.0
-1.0
2.0
-1.0
-0.2
3.3
-0.2
1M (%)
-11.8
-6.3
-14.1
-0.9
-8.9
2.7
-5.3
-1.4
-3.2
-8.6
12.5
22.2
-6.3
-4.5
0.0
2.4
-0.8
-2.7
-9.2
-10.9
6.2
-15.0
11.5
0.7
8.8
-6.8
-6.0
-3.8
0.7
-14.9
-9.9
-0.2
-6.9
-6.3
-7.2
-6.3
-4.5
-9.4
-8.8
-5.0
2.3
-0.5
-0.5
2.1
3.2
10.7
2.7
-5.0
-5.8
-2.3
1.0
9.1
-9.5
12M (%)
44.9
52.4
-8.7
8.4
13.9
45.8
11.8
27.9
35.1
5.8
57.3
86.9
24.4
11.0
28.4
53.7
121.3
31.0
-42.4
0.3
71.4
-6.6
30.1
21.4
97.4
24.2
25.2
73.3
97.5
49.9
43.5
36.1
8.5
19.3
26.7
26.7
20.0
9.7
11.9
18.2
58.4
12.4
21.6
24.0
36.9
22.0
52.1
9.2
-0.1
20.4
22.5
66.1
-8.5
86.3
37.3
26.3
39.7
131.9
64.9
32.6
60.4
95.1
-1.1
34.9
60.6
7 December 2017
16

MOSL Universe stock performance
Company
Pidilite Ind.
P&G Hygiene
Prabhat Dairy
United Brew
United Spirits
Healthcare
Alembic Phar
Alkem Lab
Ajanta Pharma
Aurobindo
Biocon
Cadila
Cipla
Divis Lab
Dr Reddy’s
Fortis Health
Glenmark
Granules
GSK Pharma
IPCA Labs
Jubilant Life
Lupin
Sanofi India
Shilpa Medicare
Strides Shasun
Sun Pharma
Syngene Intl
Torrent Pharma
Infrastructure
Ashoka Buildcon
IRB Infra.Devl.
KNR Construct.
Sadbhav Engg.
Logistics
Allcargo Logistics
Blue Dart
Concor
Gateway Distriparks
Gati
Transport Corp.
Media
Dish TV
D B Corp
Den Net.
Ent.Network
Hind. Media
HT Media
Jagran Prak.
Music Broadcast
PVR
Prime Focus
Siti Net.
Sun TV
Zee Ent.
Metals
Hindalco
1 Day (%)
0.2
-1.2
4.7
-3.4
-1.3
-0.5
-0.8
-4.7
-2.4
1.0
-1.2
-0.2
-0.4
-0.7
-3.4
-1.8
-1.4
-0.8
0.1
-0.6
-0.1
-0.9
-4.0
-1.9
-2.3
-2.5
1.2
-2.4
0.6
0.7
-0.6
-0.2
-0.3
1.0
-2.0
-0.3
-0.9
1.6
1.0
0.3
-1.2
-1.4
0.8
0.1
0.9
-0.1
0.7
-0.4
-1.6
0.1
-3.4
1M (%)
9.3
9.3
14.9
-10.4
8.1
0.1
6.9
3.1
-18.0
25.7
-16.6
-9.1
-2.9
-8.3
1.1
-13.8
-11.2
-8.1
0.8
4.8
-21.8
-5.5
-8.9
-2.6
-5.5
7.2
-0.4
5.1
-14.7
2.2
18.1
-2.7
0.0
-6.6
-9.5
5.5
0.9
3.1
-4.9
15.4
-8.3
0.1
-2.8
-5.5
1.2
-9.5
-0.4
1.4
-6.9
7.1
-15.1
12M (%)
30.9
44.3
66.1
19.5
74.8
-18.5
23.4
-31.9
-10.6
69.3
6.1
3.6
-11.6
-31.2
-14.4
-38.3
10.1
-11.3
-4.8
-1.4
-47.1
2.4
-5.9
-26.5
-27.5
-6.3
-3.2
65.0
12.2
74.7
34.8
6.7
-11.2
46.3
4.8
10.6
71.8
-6.0
2.0
69.8
4.3
-6.9
40.1
-3.9
17.0
46.1
-26.4
77.4
28.1
32.3
Company
Hind. Zinc
JSPL
JSW Steel
Nalco
NMDC
Rain Industries
SAIL
Vedanta
Tata Steel
Oil & Gas
BPCL
GAIL
Gujarat Gas
Gujarat St. Pet.
HPCL
IOC
IGL
Mahanagar Gas
MRPL
Oil India
ONGC
PLNG
Reliance Ind.
Retail
Jubilant Food
PC Jeweller
Titan Co.
Technology
Cyient
HCL Tech.
Hexaware
Infosys
KPIT Tech
L&T Infotech
Mindtree
Mphasis
NIIT Tech
Persistent Sys
Tata Elxsi
TCS
Tech Mah
Wipro
Zensar Tech
Telecom
Bharti Airtel
Bharti Infratel
Idea Cellular
Tata Comm
Utiltites
Coal India
CESC
JSW Energy
NTPC
Power Grid
Tata Power
1 Day (%)
-3.1
-3.9
-2.5
-2.6
-2.8
0.7
-3.0
-2.3
-1.2
-1.5
-1.3
1.0
-0.5
-1.6
-0.7
-1.2
0.0
-1.0
-1.9
-1.5
-2.1
1.8
-2.1
2.6
-2.3
0.5
1.4
-2.7
0.6
4.2
-1.0
-0.1
0.3
-0.3
-0.2
-2.7
-0.1
1.2
-0.4
0.2
-1.3
-2.2
-0.3
-0.7
-0.1
-1.0
-2.8
-0.8
0.1
-1.6
1M (%)
-11.5
-2.4
-9.3
-19.4
-1.9
6.8
-9.4
-16.8
-5.7
-6.4
-2.1
-10.6
-7.6
-6.7
-5.3
3.8
-13.7
-9.5
-6.2
-11.5
-6.4
-0.7
5.9
6.6
-1.2
10.2
1.0
4.5
6.7
3.2
19.9
11.0
4.9
0.0
-0.4
5.2
-1.3
2.4
-5.7
0.4
-9.2
-12.7
-7.5
-3.4
-7.7
-1.7
-4.0
-2.2
-5.0
2.3
12M (%)
3.6
123.8
47.2
23.3
3.9
525.1
48.4
23.0
59.7
20.1
41.4
58.2
35.6
39.1
31.6
94.6
47.1
20.8
6.1
-11.7
27.5
84.9
99.7
122.0
139.6
17.3
9.2
65.2
2.4
22.2
50.5
17.4
40.2
49.8
8.0
31.9
20.1
1.4
23.4
-14.6
47.1
-3.0
25.2
4.1
-13.5
66.4
34.8
7.3
9.5
16.3
7 December 2017
17

MOSL Universe stock performance
Company
Others
Arvind
Avenue Super.
Bata India
BSE
Castrol India
Century Ply.
Coromandel Intl
Delta Corp
Dynamatic Tech
Eveready Inds.
Interglobe
Indo Count
Info Edge
Inox Leisure
Jain Irrigation
Just Dial
Kaveri Seed
Kitex Garm.
Manpasand
MCX
Monsanto
Navneet Educat.
PI Inds.
Piramal Enterp.
Quess Corp
SRF
S H Kelkar
Symphony
Team Lease Serv.
Trident
TTK Prestige
V-Guard
Wonderla
1 Day (%)
1.2
-0.6
1.1
-0.9
-0.6
0.5
-0.4
0.0
-0.5
-0.3
-1.4
-3.3
-1.4
0.3
-2.9
0.8
-0.9
-1.4
0.7
-0.2
-1.0
-0.2
1.0
-1.0
-0.4
-2.5
0.5
-1.5
0.8
0.7
-0.7
0.2
-0.3
1M (%)
-2.4
-0.4
-9.6
-7.6
-6.8
5.0
-2.4
-12.7
-9.3
25.2
-8.7
0.0
6.2
4.2
6.0
6.1
-7.7
-4.4
-10.5
-11.0
-2.2
-7.7
16.6
-1.3
12.6
6.8
-4.6
0.2
27.3
-6.9
4.8
3.6
-6.4
12M (%)
24.4
76.5
-1.5
83.3
97.4
123.5
-31.3
102.7
34.1
-27.8
43.1
25.3
33.3
33.7
23.8
0.7
25.4
-26.9
8.4
47.9
16.1
62.4
47.9
17.4
-13.0
35.2
141.6
54.5
30.8
89.2
8.1
7 December 2017
18

THEMATIC/STRATEGY RESEARCH GALLERY

REPORT GALLERY
RECENT INITIATING COVERAGE REPORTS
Rs

DIFFERENTIATED PRODUCT GALLERY

Disclosures:
The following Disclosures are being made in compliance with the SEBI Research Analyst Regulations 2014 (herein after referred to as the Regulations).
Motilal Oswal Securities Ltd. (MOSL) is a SEBI Registered Research Analyst having registration no. INH000000412. MOSL, the Research Entity (RE) as defined in the Regulations, is engaged in the business of providing Stock
broking services, Investment Advisory Services, Depository participant services & distribution of various financial products. MOSL is a subsidiary company of Motilal Oswal Financial Service Ltd. (MOFSL). MOFSL is a listed
public company, the details in respect of which are available on
www.motilaloswal.com.
MOSL is registered with the Securities & Exchange Board of India (SEBI) and is a registered Trading Member with National Stock
Exchange of India Ltd. (NSE) and Bombay Stock Exchange Limited (BSE), Metropolitan Stock Exchange Of India Ltd. (MSE) for its stock broking activities & is Depository participant with Central Depository Services Limited
(CDSL) & National Securities Depository Limited (NSDL) and is member of Association of Mutual Funds of India (AMFI) for distribution of financial products. Details of associate entities of Motilal Oswal Securities Limited are
available on the website at
http://onlinereports.motilaloswal.com/Dormant/documents/Associate%20Details.pdf
Pending Regulatory Enquiries against Motilal Oswal Securities Limited by SEBI:
SEBI pursuant to a complaint from client Shri C.R. Mohanraj alleging unauthorized trading, issued a letter dated 29th April 2014 to MOSL notifying appointment of an Adjudicating Officer as per SEBI regulations to hold
inquiry and adjudge violation of SEBI Regulations; MOSL requested SEBI to provide all documents, records, investigation report relied upon by SEBI which were referred in Show Cause Notice and also sought personal
hearing. The matter is currently pending.
MOSL, it’s associates, Research Analyst or their relative may have any financial interest in the subject company. MOSL and/or its associates and/or Research Analyst may have beneficial ownership of 1% or more securities in
the subject company at the end of the month immediately preceding the date of publication of the Research Report.
MOSL and its associate company(ies), their directors and Research Analyst and their relatives may; (a) from
time to time, have a long or short position in, act as principal in, and buy or sell the securities or derivatives thereof of companies mentioned herein. (b) be engaged in any other transaction involving such securities and earn
brokerage or other compensation or act as a market maker in the financial instruments of the company(ies) discussed herein or act as an advisor or lender/borrower to such company(ies) or may have any other potential
conflict of interests with respect to any recommendation and other related information and opinions.; however the same shall have no bearing whatsoever on the specific recommendations made by the analyst(s), as the
recommendations made by the analyst(s) are completely independent of the views of the associates of MOSL even though there might exist an inherent conflict of interest in some of the stocks mentioned in the research
report.
Research Analyst may have served as director/officer, etc. in the subject company in the last 12 month period. MOSL and/or its associates may have received any compensation from the subject company in the past
12 months.
In the last 12 months period ending on the last day of the month immediately preceding the date of publication of this research report, MOSL or any of its associates may have:
managed or co-managed public offering of securities from subject company of this research report,
received compensation for investment banking or merchant banking or brokerage services from subject company of this research report,
received compensation for products or services other than investment banking or merchant banking or brokerage services from the subject company of this research report.
Subject Company may have been a client of MOSL or its associates during twelve months preceding the date of distribution of the research report.
MOSL and it’s associates have not received any compensation or other benefits from the subject company or third party in connection with the research report. To enhance transparency, MOSL has incorporated a Disclosure
of Interest Statement in this document. This should, however, not be treated as endorsement of the views expressed in the report. MOSL and / or its affiliates do and seek to do business including investment banking with
companies covered in its research reports. As a result, the recipients of this report should be aware that MOSL may have a potential conflict of interest that may affect the objectivity of this report. Compensation of Research
Analysts is not based on any specific merchant banking, investment banking or brokerage service transactions.
Terms & Conditions:
This report has been prepared by MOSL and is meant for sole use by the recipient and not for circulation. The report and information contained herein is strictly confidential and may not be altered in any way, transmitted to,
copied or distributed, in part or in whole, to any other person or to the media or reproduced in any form, without prior written consent of MOSL. The report is based on the facts, figures and information that are considered
true, correct, reliable and accurate. The intent of this report is not recommendatory in nature. The information is obtained from publicly available media or other sources believed to be reliable. Such information has not
been independently verified and no guaranty, representation of warranty, express or implied, is made as to its accuracy, completeness or correctness. All such information and opinions are subject to change without notice.
The report is prepared solely for informational purpose and does not constitute an offer document or solicitation of offer to buy or sell or subscribe for securities or other financial instruments for the clients. Though
disseminated to all the customers simultaneously, not all customers may receive this report at the same time. MOSL will not treat recipients as customers by virtue of their receiving this report.
Analyst Certification
The views expressed in this research report accurately reflect the personal views of the analyst(s) about the subject securities or issues, and no part of the compensation of the research analyst(s) was, is, or will be directly or
indirectly related to the specific recommendations and views expressed by research analyst(s) in this report.
Disclosure of Interest Statement
Analyst ownership of the stock
Companies where there is interest
No
A graph of daily closing prices of securities is available at
www.nseindia.com, www.bseindia.com.
Research Analyst views on Subject Company may vary based on Fundamental research and Technical Research. Proprietary
trading desk of MOSL or its associates maintains arm’s length distance with Research Team as all the activities are segregated from MOSL research activity and therefore it can have an independent view with regards to
subject company for which Research Team have expressed their views.
Regional Disclosures (outside India)
This report is not directed or intended for distribution to or use by any person or entity resident in a state, country or any jurisdiction, where such distribution, publication, availability or use would be contrary to law,
regulation or which would subject MOSL & its group companies to registration or licensing requirements within such jurisdictions.
For Hong Kong:
This report is distributed in Hong Kong by Motilal Oswal capital Markets (Hong Kong) Private Limited, a licensed corporation (CE AYY-301) licensed and regulated by the Hong Kong Securities and Futures Commission (SFC)
pursuant to the Securities and Futures Ordinance (Chapter 571 of the Laws of Hong Kong) “SFO”. As per SEBI (Research Analyst Regulations) 2014 Motilal Oswal Securities (SEBI Reg No. INH000000412) has an agreement with
Motilal Oswal capital Markets (Hong Kong) Private Limited for distribution of research report in Hong Kong. This report is intended for distribution only to “Professional Investors” as defined in Part I of Schedule 1 to SFO. Any
investment or investment activity to which this document relates is only available to professional investor and will be engaged only with professional investors.” Nothing here is an offer or solicitation of these securities,
products and services in any jurisdiction where their offer or sale is not qualified or exempt from registration. The Indian Analyst(s) who compile this report is/are not located in Hong Kong & are not conducting Research
Analysis in Hong Kong.
For U.S.
Motilal Oswal Securities Limited (MOSL) is not a registered broker - dealer under the U.S. Securities Exchange Act of 1934, as amended (the"1934 act") and under applicable state laws in the United States. In addition MOSL is
not a registered investment adviser under the U.S. Investment Advisers Act of 1940, as amended (the "Advisers Act" and together with the 1934 Act, the "Acts), and under applicable state laws in the United States.
Accordingly, in the absence of specific exemption under the Acts, any brokerage and investment services provided by MOSL, including the products and services described herein are not available to or intended for U.S.
persons. This report is intended for distribution only to "Major Institutional Investors" as defined by Rule 15a-6(b)(4) of the Exchange Act and interpretations thereof by SEC (henceforth referred to as "major institutional
investors"). This document must not be acted on or relied on by persons who are not major institutional investors. Any investment or investment activity to which this document relates is only available to major institutional
investors and will be engaged in only with major institutional investors. In reliance on the exemption from registration provided by Rule 15a-6 of the U.S. Securities Exchange Act of 1934, as amended (the "Exchange Act") and
interpretations thereof by the U.S. Securities and Exchange Commission ("SEC") in order to conduct business with Institutional Investors based in the U.S., MOSL has entered into a chaperoning agreement with a U.S.
registered broker-dealer, Motilal Oswal Securities International Private Limited. ("MOSIPL"). Any business interaction pursuant to this report will have to be executed within the provisions of this chaperoning agreement.
The Research Analysts contributing to the report may not be registered /qualified as research analyst with FINRA. Such research analyst may not be associated persons of the U.S. registered broker-dealer, MOSIPL, and
therefore, may not be subject to NASD rule 2711 and NYSE Rule 472 restrictions on communication with a subject company, public appearances and trading securities held by a research analyst account.
For Singapore
Motilal Oswal Capital Markets Singapore Pte Limited is acting as an exempt financial advisor under section 23(1)(f) of the Financial Advisers Act(FAA) read with regulation 17(1)(d) of the Financial Advisors Regulations and is a
subsidiary of Motilal Oswal Securities Limited in India. This research is distributed in Singapore by Motilal Oswal Capital Markets Singapore Pte Limited and it is only directed in Singapore to accredited investors, as defined in
the Financial Advisers Regulations and the Securities and Futures Act (Chapter 289), as amended from time to time. In respect of any matter arising from or in connection with the research you could contact the following
representatives of Motilal Oswal Capital Markets Singapore Pte Limited:
Disclaimer:
The report and information contained herein is strictly confidential and meant solely for the selected recipient and may not be altered in any way, transmitted to, copied or distributed, in part or in whole, to any other person
or to the media or reproduced in any form, without prior written consent. This report and information herein is solely for informational purpose and may not be used or considered as an offer document or solicitation of
offer to buy or sell or subscribe for securities or other financial instruments. Nothing in this report constitutes investment, legal, accounting and tax advice or a representation that any investment or strategy is suitable or
appropriate to your specific circumstances. The securities discussed and opinions expressed in this report may not be suitable for all investors, who must make their own investment decisions, based on their own investment
objectives, financial positions and needs of specific recipient. This may not be taken in substitution for the exercise of independent judgment by any recipient. Each recipient of this document should make such investigations
as it deems necessary to arrive at an independent evaluation of an investment in the securities of companies referred to in this document (including the merits and risks involved), and should consult its own advisors to
determine the merits and risks of such an investment. The investment discussed or views expressed may not be suitable for all investors. Certain transactions -including those involving futures, options, another derivative
products as well as non-investment grade securities - involve substantial risk and are not suitable for all investors. No representation or warranty, express or implied, is made as to the accuracy, completeness or fairness of
the information and opinions contained in this document. The Disclosures of Interest Statement incorporated in this document is provided solely to enhance the transparency and should not be treated as endorsement of the
views expressed in the report. This information is subject to change without any prior notice. The Company reserves the right to make modifications and alternations to this statement as may be required from time to time
without any prior approval. MOSL, its associates, their directors and the employees may from time to time, effect or have effected an own account transaction in, or deal as principal or agent in or for the securities
mentioned in this document. They may perform or seek to perform investment banking or other services for, or solicit investment banking or other business from, any company referred to in this report. Each of these entities
functions as a separate, distinct and independent of each other. The recipient should take this into account before interpreting the document. This report has been prepared on the basis of information that is already
available in publicly accessible media or developed through analysis of MOSL. The views expressed are those of the analyst, and the Company may or may not subscribe to all the views expressed therein. This document is
being supplied to you solely for your information and may not be reproduced, redistributed or passed on, directly or indirectly, to any other person or published, copied, in whole or in part, for any purpose. This report is not
directed or intended for distribution to, or use by, any person or entity who is a citizen or resident of or located in any locality, state, country or other jurisdiction, where such distribution, publication, availability or use would
be contrary to law, regulation or which would subject MOSL to any registration or licensing requirement within such jurisdiction. The securities described herein may or may not be eligible for sale in all jurisdictions or to
certain category of investors. Persons in whose possession this document may come are required to inform themselves of and to observe such restriction. Neither the Firm, not its directors, employees, agents or
representatives shall be liable for any damages whether direct or indirect, incidental, special or consequential including lost revenue or lost profits that may arise from or in connection with the use of the information.
The
person accessing this information specifically agrees to exempt MOSL or any of its affiliates or employees from, any and all responsibility/liability arising from such misuse and agrees not to hold MOSL or any of its affiliates or
employees responsible for any such misuse and further agrees to hold MOSL or any of its affiliates or employees free and harmless from all losses, costs, damages, expenses that may be suffered by the person accessing this
information due to any errors and delays.
Registered Office Address: Motilal Oswal Tower, Rahimtullah Sayani Road, Opposite Parel ST Depot, Prabhadevi, Mumbai-400025; Tel No.: 022-3980 4263; www.motilaloswal.com. Correspondence Address: Palm Spring
Centre, 2nd Floor, Palm Court Complex, New Link Road, Malad (West), Mumbai- 400 064. Tel No: 022 3080 1000. Compliance Officer: Neeraj Agarwal, Email Id:
na@motilaloswal.com,
Contact No.:022-30801085.
Registration details of group entities.: MOSL: SEBI Registration: INZ000158836; CDSL: IN-DP-16-2015; NSDL: IN-DP-NSDL-152-2000; Research Analyst: INH000000412. AMFI: ARN 17397. Investment Adviser: INA000007100.
Motilal Oswal Asset Management Company Ltd. (MOAMC): PMS (Registration No.: INP000000670) offers PMS and Mutual Funds products. Motilal Oswal Wealth Management Ltd. (MOWML): PMS (Registration No.:
INP000004409) offers wealth management solutions. *Motilal Oswal Securities Ltd. is a distributor of Mutual Funds, PMS, Fixed Deposit, Bond, NCDs, Insurance and IPO products. * Motilal Oswal Commodities Broker Pvt. Ltd.
offers Commodities Products. * Motilal Oswal Real Estate Investment Advisors II Pvt. Ltd. offers Real Estate products. * Motilal Oswal Private Equity Investment Advisors Pvt. Ltd. offers Private Equity products
13 December 2016
20