27 December 2017
Market snapshot
Equities - India
Close
Chg .%
Sensex
34,011
0.2
Nifty-50
10,532
0.4
Nifty-M 100
21,005
0.8
Equities-Global
Close
Chg .%
S&P 500
2,683
0.0
Nasdaq
6,960
-0.1
FTSE 100
7,593
-0.1
DAX
13,073
-0.3
Hang Seng
11,653
0.5
Nikkei 225
22,893
0.0
Commodities
Close
Chg .%
Brent (US$/Bbl)
66
2.6
Gold ($/OZ)
1,283
0.6
Cu (US$/MT)
7,085
0.6
Almn (US$/MT)
2,181
2.2
Currency
Close
Chg .%
USD/INR
64.1
0.1
USD/EUR
1.2
0.0
USD/JPY
113.2
-0.1
YIELD (%)
Close
1MChg
10 Yrs G-Sec
7.3
0.00
10 Yrs AAA Corp
8.0
0.01
Flows (USD b)
26-Dec
MTD
FIIs
0.0
-1.2
DIIs
0.1
1.4
Volumes (INRb)
26-Dec
MTD*
Cash
341
335
F&O
5,192
6,570
Note: YTD is calendar year, *Avg
YTD.%
27.7
28.7
46.4
YTD.%
19.9
29.3
6.3
13.9
24.0
19.8
YTD.%
19.8
11.3
28.3
28.0
YTD.%
-5.7
12.8
-3.2
YTDchg
0.8
0.4
YTD
7.2
14.2
YTD*
309
5,738
Today’s top research idea
Sanghi Industries: Ready for the next leap
Diversification into new markets to bring in scale and margin expansion
SIL, a Gujarat-based cement company, has capacity of 4.1mt and sells ~90% of
volumes in Gujarat. It owns a 63MW captive power plant and a port.
SIL is one of the lowest cost cement producers due to its quality limestone,
locational advantage and strong integration across manufacturing value chain.
We expect SIL’s margin to expand by 8.4pp over FY17-20, led by (i)
commissioning of a waste heat recovery system (WHRS), (ii) focusing on coastal
mode of transportation by way of acquisition of ships and (iii) favorable
revenue mix with higher proportion of Portland Pozzolana Cement (PPC).
Increase in capacity to 8.2mt over next 30 months and diversification into new
higher-priced markets should result in capacity-led re-rating.
Expect PAT CAGR of 61% to INR2.63b over FY17-20; RoE to increase by 11pp to
16.8% in FY20, led by sharp uptick in profitability.
We initiate coverage on SIL with Buy and TP of INR157 (23% upside; valuing its
present capacity of 4.1mt at USD120 EV/tonne; incremental capacity of 4.1mt
at USD78/t).
Research covered
Cos/Sector
Key Highlights
Sanghi Industries (Initiating Coverage) Ready for the next leap
India Strategy
Contrarian Investing: Exploring two sub-themes
Bharat Forge (ART)
High capital intensity keeps return ratios subdued
Piping hot news
RCom finalizes Rs39,000 crore debt resolution plan
Reliance Communications Ltd (RCom) has finalized a debt resolution plan that
involves the sale of its assets and does not require lenders and bond holders to
write off their dues or convert it into equity. The company has also exited the
strategic debt restructuring process (SDR), RCom said on Tuesday…
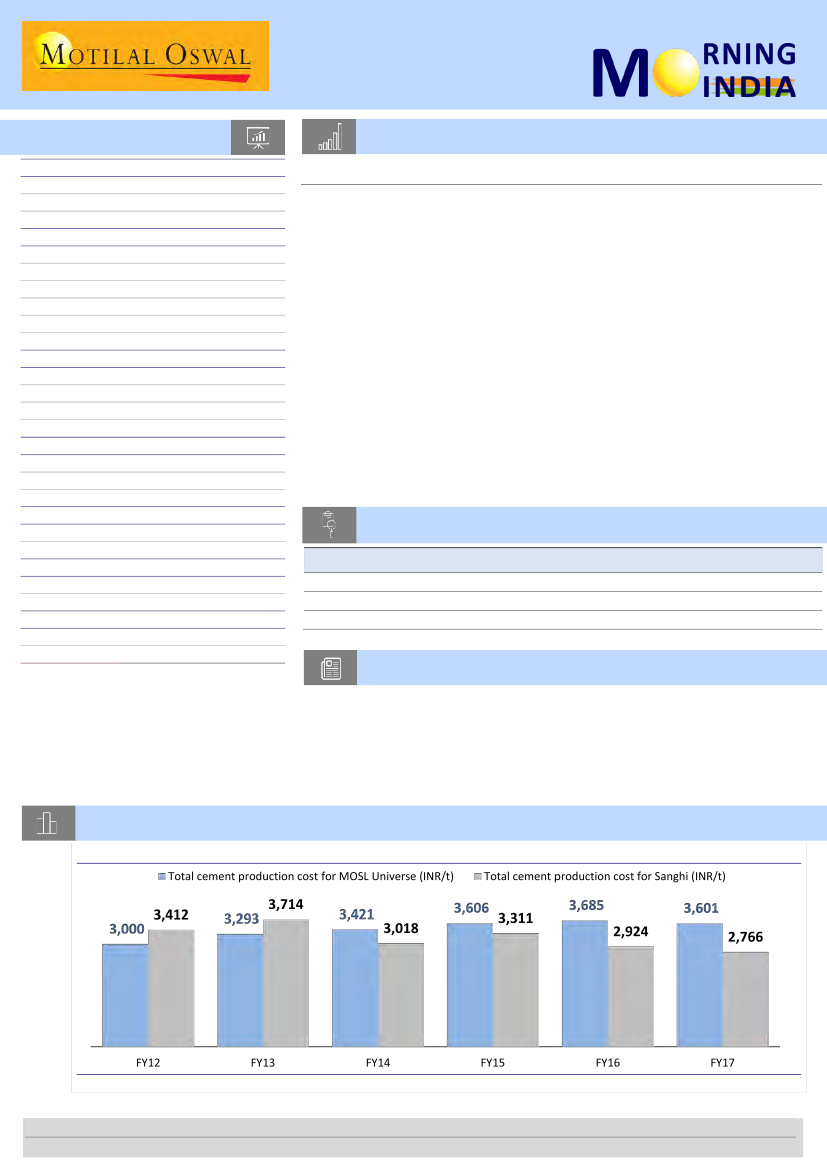
Chart of the Day: Sanghi Industries—Ready for the next leap
SIL’s cement production cost has remained lower than industry average over the years
Research Team (Gautam.Duggad@MotilalOswal.com)
Motilal Oswal research is available on www.motilaloswal.com/Institutional-Equities, Bloomberg, Thomson Reuters, Factset and S&P Capital.
Investors are advised to refer through important disclosures made at the last page of the Research Report.

In the news today
Kindly click on textbox for the detailed news link
1
GST collection falls further to
₹80,808 cr. in November
The Goods and Services Tax (GST)
collection in November fell further
down to ₹80,808 crore from
₹83,346 crore in October,
according to official data released
on Tuesday. “The total collection
under the GST for November has
been ₹80,808 crore till December
25, 2017,”…
2
State-run Indian Renewable Energy Development Agency (IREDA) has filed
draft papers with markets regulator SEBI to float an initial public offering.
The proposed share-sale comes at a time when the government is working
on ramping up renewable energy generation capacity as part of larger
efforts to increase clean energy portfolios. The initial public offer (IPO) will
see sale of 13.90 crore equity shares of the company, according to the
draft red herring prospectus (DRHP) filed with SEBI. The issue includes a
reservation of up to 6.95 lakh equity shares for eligible employees…
Green energy agency IREDA files IPO papers
3
Maruti Suzuki raises annual
sales target to 2.5 million units
by 2025
Maruti Suzuki India Ltd, the seller
of every second car in India, has
raised its sales target for the
second time in two years to 2.5
million units every year by 2025,
according to two people with
knowledge of the matter. The
company, which had in 2015 set
itself a target of 2 million in sales
by 2020,…
4
Andhra Pradesh plans sops to
pull in Rs 30,000 crore
investment in electric-vehicles
industry
Andhra Pradesh is seeking to
attract Rs 30,000 crore of
investments in the electric-
vehicles industry through a raft of
incentives that would include
capital subsidies to automakers
and charging-equipment
manufacturers,…
5
Tata row: Cyrus Mistry gets
relief in Rs500 crore
defamation case
The Mumbai sessions court on
Tuesday offered relief to Cyrus
Mistry and his family investment
firms on a criminal defamation
case filed by R. Venkataramanan,
a trustee at Tata Trusts. Mistry,
the former chairman of Tata Sons
Ltd, had filed a plea with the
sessions court that there had been
procedural lapses at the lower
court. The court ruled that there
had been lapses in recording a
statement by Venkatramanan and
sent the case back to the Mumbai
magistrates court to hear it
afresh…
6
In a positive development for
Hyderabad real estate, which has
been facing sluggishness for the
past several years, the residential
launches in the city have increased
by 30% year-on-year since the
past three years mainly driven by
improving infrastructure in the
city…
7
Telecom enters final phase of
consolidation as RCom exits
Reliance Communications Ltd’s
planned sale of its wireless
business assets by the end of
March would be the latest
instance of upheaval that has
swept through the telecom
industry since the entry of
Reliance Jio Infocomm Ltd. Once
the RCom asset sale is completed,
Aircel Ltd will be the sole
remaining small operator…
Hyderabad residential
launches up 30% since 2014,
says JLL
27 December 2017
2

Sanghi Industries
BSE Sensex
33,940
S&P CNX
10,493
Initiating Coverage | Sector: Cement
CMP: INR127
TP: INR157(+23%)
Buy
Ready for the next leap
Stock Info
Bloomberg
Equity Shares (m)
52-Week Range (INR)
1, 6, 12 Rel. Per (%)
M.Cap. (INR b)
M.Cap. (USD b)
Avg Val, INRm
Free float (%)
Diversification into new markets to bring in scale and margin expansion
SNGI IN
220
137 / 46
2/48/130
27.9
0.4
80.0
25.0
Financial Snapshot (INR b)
Y/E Mar
2018E 2019E 2020E
Net Sales
12.7 14.6 16.4
EBITDA
3.0
3.8
4.6
PAT
1.3
2.0
2.6
EPS (INR)
5.8
8.9 12.0
Gr. (%)
102.0 53.5 34.6
BV/Sh (INR)
56.4 65.3 77.3
RoE (%)
10.8 14.6 16.8
RoCE (%)
10.4 11.4 11.1
P/E (x)
21.9 14.3 10.6
P/BV (x)
2.3
1.9
1.6
EV/EBITDA (x)
10.5
8.0
5.9
Shareholding pattern (%)
As On
Sep-16 Jun-17 Sep-17
Promoter
75.0
75.0
75.0
DII
5.9
3.6
4.1
FII
0.4
0.2
0.2
Others
18.8
21.2
20.8
FII Includes depository receipts
Sanghi Industries Limited (SIL) is a Gujarat-based cement company, with capacity of
4.1mt. Around ~90% of its volumes are sold in Gujarat. An integrated cement unit, SIL
owns a 63MW captive power plant and a port. SIL is one of the lowest cost cement
producers due to its quality limestone, locational advantage and strong integration
across the manufacturing value chain (SIL’s cost/t of INR2,766 v/s industry average of
INR3,603).
SIL’s strength lies in its access to 1b tonne of quality marine limestone reserves,
which should allow it to sustainably add capacity over the next 15 years.
We expect SIL’s margins to expand by 8.4pp over FY17-20, led by its three-pronged
strategy: (i) commissioning of a waste heat recovery system (WHRS), (ii) focusing more
on the coastal mode of transportation by way of acquisition of ships and (iii) achieving a
favorable revenue mix with higher proportion of Portland Pozzolana Cement (PPC).
In our view, SIL is a strong candidate for a re-rating, led by (i) expected increase in
its capacity from 4.1mt now to 8.2mt over the next 30 months and (ii) anticipated
scale benefits led by diversification into new higher-priced markets.
We expect EBITDA CAGR of 33% over FY17-20, with improved pricing and positive
operating leverage leading to 26% CAGR in EBITDA/t. This is likely to drive PAT
CAGR of 61% to INR2.63b over FY17-20. We expect RoE to increase by 11pp to
16.8% in FY20, led by a sharp uptick in profitability.
We initiate coverage on SIL with a Buy rating and a target price of INR157 (23%
upside; valuing its present capacity of 4.1mt at USD120 EV/tonne; incremental
capacity of 4.1mt likely to be added by FY20 at USD78/t at a 35% discount to
replacement cost of USD120/t).
Strong integration, access to limestone reserve are differentiators
Sanghi Industries
Ready for the Next Leap
Abhishek Ghosh
+
91 22 3980 5436
Abhishek.ghosh@motilaloswal.com
Please click here for Video Link
In our view, strong integration across the cement production value chain –
from access to limestone reserve to multi-fuel kiln to captive thermal power
plant to captive jetty for outward coastal movement of cement and inward
movement of imported input material – makes SIL one of the lowest-cost
cement producers in India, also providing it with a strong competitive edge in
terms of profitability.
SIL enjoys access to 1b tonne of extremely good-quality marine limestone
reserve, which can support operations at 2x present capacity for over 100
years. Additionally, the limestone mines have deposits at surface, which can
be extracted by surface mining instead of the relatively expensive
conventional technique of blasting. This helps SIL significantly in terms of cost
of mining.
SIL’s margins are likely to expand by 8.4pp over FY17-20, led by its cost-
control program, which encompasses installation of the 15MW WHRS and
acquisition of two ships. Around 20% of its power requirement will be low-
cost post the installation of the WHRS.
Margin improvement led by cost initiatives and favorable revenue mix
27 December 2017
3

Stock Performance (1-year)
This is likely to result in savings of INR150-170m post stabilization. The other
initiative of acquiring two ships will likely lead to more use of the cost-efficient
coastal route for transportation. Additionally, SIL is likely to increase its
proportion of PPC from 35% now to ~50% over the next 18-24 months, for
which it has installed fly ash silo.
SIL targets to increase its cement grinding capacity from 4.1mt now to 8.2mt
over the next 30 months by adding one more line of clinker unit at its existing
location, as well as split grinding units of 2mt each in Kutch and Surat. The new
grinding units would be largely utilized to cater to the better-priced markets of
Mumbai and Kerala, which can be tapped by way of coastal movement – an
efficient mode of cement transportation.
While diversification into the newer markets will provide scale, it will also result
in improved profitability. We also see SIL as a strong re-rating candidate, as the
expected increase in capacity over the next few years should help it achieve
significant scale benefits.
At CMP of INR127/share, SIL trades at EV/EBITDA of ~8.0/5.9x on FY19E/20E
earnings (adjusted for CWIP related to doubling of capacity). It trades at EV/t of
USD115/80 on FY19/20 capacity. We value SIL’s present capacity of 4.1mt at
EV/tonne of USD120 and proposed capacity expansion of 4.1mt at USD78/t
(35% discount to replacement cost of USD120/t) to capture the low capital cost
for incremental capex. Hence, we value its overall capacity of 8.1mt (with
additional debt of INR12b for additional capacity) at USD99/t. Incremental cost
of capacity addition is lower at USD45/t, as against the industry standard of
USD120/t, as the expansion is brownfield in nature and a significant amount of
capex has been incurred toward the ancillary set-up.
We thus initiate coverage on SIL with a
Buy
rating and a target price of
INR157/share, implying upside of ~23% from the current levels.
EV/ton (USD/t)
FY19E
FY20E
115
58
115
77
88
119
116
77
172
201
80
53
115
72
86
117
101
73
162
195
EV/EBITDA (x)
FY19E
FY20E
8.0
8.1
10.0
9.7
8.9
9.6
10.4
7.8
13.6
14.8
5.9
6.6
7.9
7.8
6.1
8.3
7.7
6.5
10.6
12.5
Capacity-led re-rating on the cards; diversification to bring in scale
Valuation and view
Comparative Valuations
Company
Sanghi
Sagar Cement *
Heidelberg*
JK Lakshmi
Orient Cement
JK Cement
Birla Corporation
India Cement
Ramco Cements
Dalmia Cements
FY17
Capacity (mt)
4.1
4.3
5.4
10.9
11.6
12.3
15.4
16
17
25
Source: Company, MOSL, *Bloomberg
27 December 2017
4

26 December 2017
India Strategy
BSE Sensex: 34,011
Please refer our report dated
23 June 2017
S&P CNX: 10,532
Contrarian Investing: Exploring two sub-themes
“Net Sell to Net buy” theme working well in CY17 as well
In our follow-up note on Contrarian Investing, ‘Digging
Deeper’,
dated 24
th
August
2017, we had indicated several anomalies in stock positioning among Nifty stocks.
Interestingly, these anomalies have delivered impressive returns. We had also
highlighted that over the last decade, a simple strategy of investing in stocks
wherein analyst consensus has changed from “net sell to net buy” with a holding
period of one year can deliver phenomenal returns of 23.9%. This strategy is
working well in CY17 also.
Net Sell to Net Buy: Three new stocks to highlight
In our Contrarian Thematic report published in
June 2017,
we had highlighted one of
our key findings:
the simple strategy of investing in stocks wherein analyst consensus
has changed from “net sell to net buy” with a holding period of one year has
delivered 23.9% annual returns over the last 10 years.
Among the BSE100 stocks,
Marico, PNB, United Spirits and Dr. Reddy’s
have turned
“net buy” from “net sell” in October/November 2017. From a fundamental
perspective, PNB appears to be a clear beneficiary of the government’s massive re-
capitalization plan for public sector banks (amounting to INR2.11t). UNSP is
benefitting from triple tailwinds: continued premiumization, more number of states
granting price hikes and benign raw material prices (molasses). Marico, after
underperforming for the last 15 months owing to expensive valuations, is showing
signs of volume recovery even as underlying raw material costs (especially Copra)
have spiked up. Resolution of issues at key plants and competition in key products
remain an overhang for DRRD, although recent niche product approvals and
upcoming launches will help drive sales growth until FY19.
Popularity Score:
Bloomberg collects analyst
recommendations on each
stock and assigns a
consensus rating based on
these recommendations. It
assigns 5 points for every
buy recommendation, 3
points for every hold
recommendation and 1
point for every sell
recommendation. A
consensus rating is arrived
at by taking the weighted
average of these scores
Stock positioning: Interesting anomalies
In our follow-up note on
Contrarian Investing,
we had highlighted an interesting
angle that we came across relating to frequency distribution of stocks across
quintiles and stock positioning. In the 44 quarters covered under our study, for how
many quarters has a stock remained in each quintile and how is it placed currently
compared to its most likely position?
We pointed out that among the Nifty stocks;
Axis Bank, SBI, BOB, NTPC, Dr.
Reddy’s, Sun Pharma, Hindalco, IOCL
and
Vedanta
were positioned differently
compared to their most likely position.
All the above stocks, barring IOCL and NTPC, have outperformed the Nifty. The
returns delivered by these stocks range from -6% to 16.6% v/s 6.9% for Nifty.
In addition to the above stocks,
Bharti Infratel, HDFC Bank, Infosys, Lupin, TCS,
and
Tata Power
are positioned differently compared to their most likely
position. Almost all the stocks barring HDFC Bank are relatively less popular than
their historical quintile positioning (Q1 being the most popular quintile and Q5
the least unpopular).
As a part of our analysis,
we have divided BSE100 in
5 groups of 20-Quintile1
(Q1), Quintile2 (Q2),
Quintile3 (Q3), Quintile4
(Q4) and Quintile5 (Q5)
respectively with Q1 being
composed of most popular
stocks and so on
27 December 2017
5

26 December 2017
A
nnual
R
eport
T
hreadbare
Bharat Forge’s (BHFC) FY17 annual report analysis highlights rising
capital intensity and a weak operating performance, which led to a
muted RoCE of 9.6% (FY16: 10.5%).
RoE (adjusted for exceptional
gain) stood at 15% (FY16: 19%), aided by a high equity multiplier
ratio. Consolidated revenue declined 6% to INR66.0b, while the
EBITDA margin shrunk 115bp to 19% due to rising personnel cost.
The cash conversion cycle deteriorated to 107 days (FY16: 94 days),
leading to low OCF of INR10.5b in FY17 (FY16: INR13.6b). Capex
remained high (but declined YoY) at INR6.6b (FY16: INR9.0b), which
led to FCF of INR2.9b (FY16:INR3.4b). Purchases from related party
transactions stood at 28% (FY16: 53%) of raw material cost. Cash
and investments stood at INR15.3b (37% of NW), with a yield of
5.1%. Borrowing cost declined to 3.2% (FY16: 3.4%), aided by the
replacement of high interest debentures with cheaper foreign
currency borrowings.
BHARAT FORGE FY17
The
ART
of annual report analysis
Rising capital intensity and
subdued operating
performance led to muted
RoCE of 9.6% (FY16:
10.5%).
OCF declines to INR10.5b (FY16: INR13.6b)
as cash conversion cycle increases to 107
days (FY16: 94 days).
Purchases from related party stood at 28%
(FY16: 53%) of raw material cost.
Stock Info
Bloomberg
Equity Shares (m)
52-Week Range (INR)
1,6,12 Rel. Perf. (%)
M.Cap. (INR b)
M.Cap. (USD b)
Avg Val, INRm
Free float (%)
BHFC IN
465.7
1220/717
-8/3/27
339.6
5.3
931
54.3
Sep-17
45.7
12.6
20.6
21.1
Jun-17
45.7
15.7
19.8
18.8
Sep-16
46.7
25.8
7.8
19.6
Weak operating performance continues:
BHFC’s consolidated
revenue declined 6% to INR66b (FY16: INR70b) owing to the
sluggish US class 8 truck market and commodity-related sectors,
while the EBITDA margin shrunk 115bp to 19%. PBT stood muted
at INR9.5b (FY16: INR9.7b). Subsidiaries continued with its
minimal contribution to profitability, with PBT (before
exceptional gain) of INR0.1b, as against pre-tax loss of INR0.6b in
FY16. This has dragged the standalone RoCE (at 11.8%) to lower
consolidated RoCE (at 9.6%).
Rising capital intensity keeps return ratios subdued:
BHFC’s
continued investments in non-automotive businesses over the
past few years have led to increased capital intensity (i.e.
increased capex and working capital requirement). However, its
operating performance has been muted, leading to a lower RoCE
of 9.6% (FY16: 10.5%). Subdued revenue growth led to low asset
turnover of 0.7x (FY16: 0.8x). RoE adjusted to exceptional gain on
JV stake sale declined to 15.5% in FY17 (FY16: 19.7%). Dupont
analysis highlights RoE are supported by a high equity multiplier
ratio of 2.3x (Exhibit 3).
Deteriorating cash conversion cycle dents OCF:
Operating cash
flow declined to INR10.5b (FY16: INR13.6b), primarily due to
deterioration in the cash conversion cycle to 107 days (FY16: 94
days). This was mainly on account of an increase in inventory
days to 161 (FY16: 141 days), partially offset by a rise in payable
days to 127 (FY16: 119 days). FCF post interest declined to
INR2.9b (FY16: INR3.4b), but was supported by a reduction in
capex to INR6.6b (FY16: INR9b).
Related party purchases remain substantial:
BHFC’s purchases
from entities owned by KMP stood at INR7.1b, 28% of total raw
material cost. Purchases from related parties, albeit significant,
have declined from FY16 (stood at INR14.1b, 53% of total raw
material cost).
Shareholding pattern (%)
Promoter
DII
FII
Others
Note: FII Includes depository receipts
Stock Performance (1-year)
Auditor’s name
S R B C & Co LLP
Research analyst
Sandeep Ashok Gupta
(S.Gupta@MotilalOswal.com); +91 22 39825544
Mohit Baheti
(Mohit.Baheti@MotilalOswal.com); +91 22 3010 2492
Somil Shah
(Somil.Shah@MotilalOswal.com); +91 22 3312 4975
27 December 2017
6

In conversation
1. PNB HOUSING FINANCE: Expect borrowing cost to rise by 12-
15 bps for FY18; Sanjaya Gupta, MD
Increase in borrowing cost will rise slowly and not immediately.
82 percent of company's portfolio on variable interest rate.
Expect borrowing cost to rise by 12-15 bps for FY18.
Not seeing stress in any segments of the book currently.
Construction finance doing well. Seeing sales velocity and good collection
efficiency there.
2. MANAPPURAM : NO INTENT TO SELL STAKE IN CO BUT MAY
RAISE STAKE; VP Nandakumar, MD & CEO
Emphatically deny news reports of promoters selling stake. No intention of
selling stake and neither any discussion.
Promoters buying stock in open market because of confidence in the company.
Currently promoters hold 34 percent. Going forward, may up the stake further
whenever liquidity is available.
Gold loan book which had declined in the earlier quarters now coming back and
expect a 5-8 percent growth in second half of FY18.
In gold loan book there are no non-performing assets (NPAs). 1 percent NPA
shown in the books is just a technical NPA, which will be cleared in the
upcoming quarters.
However, the microfinance business (MFI) saw some losses in H1FY18 but
expect an improvement in H2FY18.
Moreover, other businesses like commercial vehicle finance, home finance etc
done through subsidiaries and them, have no asset quality problems. Confident
of reporting growth in asset under management (AUM) in Q3FY18.
3. GODREJ AGROVET: See budgetary allocations for irrigation,
enam, rural insurance; Balram Yadav, MD
Have got into a situation in Indian agriculture that during a drought, company
has a problem. Now because of meltdown in global commodity prices, even
during a good monsoon there is a problem.
So, it is expected that government will focus on agriculture in the upcoming
Budget and what they have done in past Budgets would continue.
There will be budgetary allocations into three critical areas of agriculture -- rural
insurance, irrigation projects and eNAM.
Could also be some short-term relief given through increased MSPs and price-
deficit scheme that certain states are running.
National Agriculture Market (eNAM) is a pan-India electronic trading portal
which networks the existing APMC mandis to create a unified national market
for agricultural commodities.
Growth in animal feed business was weak. Low commodity prices also reflected
in animal feed business. Has been high single-digit volume growth for the
business but low commodity prices have impacted them and the value is down
10 percent.
27 December 2017
7

4. BLUE STAR: Expect growth at 15% over next 6 months; B
Thiagarajan, Joint MD
Sale of air purifiers during these months do well.
Total market size for air purifiers is Rs 200 crore.
Will continue to grow but ultimate aim is to integrate air purifiers with air
conditioners.
Price level has to be brought down to Rs 10,000 for air purifiers because Rs
15,000 plus kind of a product will not open up the market.
Expect growth at 15 percent over next six months.
5. L&T CONSTRUCTION: Affordable housing project pipeline
looking healthy; MV Satish, Whole-Time Director & Senior
Executive Vice-President (Buildings, Minerals and Metals)
New order worth Rs 3,355 crore for convention center at Dwarka in New Delhi.
Project to be constructed over 22 months.
Order inflows in building segment are on track with the budget.
Expect more orders from hospitals, exhibition centers and affordable housing
space.
Affordable housing project pipeline looking healthy.
27 December 2017
8

From the think tank
1. India’s digitizing states: leaders and laggards
The third quarter of 2017 started with the landmark goods and services tax
reform coming into effect nationwide. For the Bharatiya Janata Party, a political
shake-up in Bihar resulted in the party expanding its control in yet another state
assembly—and this is important. There’s an increasingly widespread
understanding that states are best positioned to drive its ongoing experiments in
economic development and good governance, a position Prime Minister Narendra
Modi supports. Just like US states, Indian states can serve as laboratories of
democracy—and their experiments are getting more and more cutting edge.
Every week, the Wadhwani Chair collects a weekly update of developments in
India’s states. Our regular quarterly review shows that in the third quarter of
2017, states made digital governance a focus of their reforms across a wide
variety of sectors. Their efforts showed that states recognize the importance of
citizen involvement as a link to political support.
2. The cacophony of GDP numbers
The period from 2011 to 2020 may be called the decade of incomparable gross
domestic product (GDP) growth. Due to a battery of events in the last six years,
the numbers may not be comparable across time periods and may get revised to
such an extent that the revised growth trend may alter. Blanket criticism of the
Union ministry of statistics and programme implementation (Mospi) or the
government not only misses the nuances of the GDP estimation process but
provides a hyper-simplistic explanation, which is incorrect. The author estimates
that over the next six quarters, i.e. till Q4 FY19, the GDP numbers reported will
initially throw up positive surprises, followed by a period of volatile GDP
revisions. Other macro numbers, however, may not improve in tandem. Let us
see under what assumptions and scenarios this can play out.
3. MGNREGA needs a push in Maharashtra
Over the last five years, Maharashtra has experienced two severe droughts. In
general, the Mahatma Gandhi National Rural Employment Guarantee Act
(MGNREGA)has been a saviour when it comes to drought mitigation. It provides
wages and earning opportunity, and also creates water structures that have the
potential to reduce the adverse impact of the next drought. This has been proven
over the years. Yet, the Devendra Fadnavis government has failed to rise to the
occasion; it could not use MGNREGA to tide over the drought during 2015. The
scheme’s performance during drought is its defining moment, but for it to perform
in a particular year, it has to be performing at a good level in other years.
27 December 2017
9

4. In the 2G debris, questions for the CAG
The allegedly largest scam in the country’s history has loomed large in the public
imagination for well over half a decade. It will not fade away quietly. The Central
Bureau of Investigation (CBI) means to appeal the special court’s verdict, for one.
For another, given the 2G affair’s role in laying the Manmohan Singh government
low, the verdict will continue to resonate politically, with a cycle of state polls next
year and the general elections in 2019. And Videocon—which was among those hit
by the Supreme Court’s cancellation of 122 licences in 2012 and is now preparing
to file a Rs10,000 crore compensation claim against the government—may well be
the first in a procession of claimants. Among the most important takeaways,
however, is the overreach of the Comptroller and Auditor General of India (CAG).
International
5. Blockchain for commodities markets
Blockchain technology, which has already been adopted by gold traders, is
starting to show the potential to transform other sectors of the global physical
commodities markets. While it wouldn’t necessarily boost commodity prices,
the innovation could offer a secure means of exchange of raw materials, open
up channels of trade among buyers and sellers that had until now been
perceived as credit risks, and provide more transparency and liquidity to a
market that has slowly lost favour among financial institutions. The technology
provides a way of accounting for financial transactions. It was developed as a
means of addressing the vulnerability of stored data on exchange of assets.
Many associate blockchain with bitcoin.
27 December 2017
10

Click excel icon
for detailed
valuation guide
CMP
(INR)
TP
(INR)
% Upside
EPS (INR)
Downside FY18E FY19E FY20E
2
12
25
16
-1
6
15
-2
-9
15
0
12
2
36
-1
28.3
34.2
41.9
4.5
6.2
8.2
155.4 187.9
217.2
19.1
26.0
33.7
457.8 603.0
727.9
82.5
116.9
140.6
814.7 1,062.7 1,334.6
27.6
36.7
48.5
35.8
45.9
57.6
7.9
9.7
11.7
183.1 193.9
213.3
37.8
43.2
47.7
8.9
11.5
14.5
288.1 381.0
447.8
24.6
64.8
68.6
14.9
25.8
34.9
Valuation snapshot
P/E (x)
P/B (x)
ROE (%)
FY19E FY20E FY19E FY20E FY19E FY20E
24.5
19.2
17.9
28.0
33.6
17.1
28.3
36.9
16.5
22.8
19.6
17.2
22.6
25.4
6.5
29.8
17.0
18.0
18.5
24.8
16.5
22.0
18.6
17.0
21.2
9.0
24.4
22.4
8.4
13.5
19.6
7.4
18.7
12.4
8.8
12.9
11.8
24.8
11.8
34.1
28.0
21.3
16.2
18.4
12.9
41.3
30.0
70.1
11.4
17.3
12.2
20.0
14.5
15.5
21.6
27.8
14.2
22.6
27.9
13.1
18.9
17.8
15.5
18.0
21.6
6.2
22.1
15.0
13.8
15.2
14.4
13.3
17.7
14.6
16.4
16.5
5.7
19.5
16.8
6.4
10.7
15.5
5.6
9.7
6.0
7.6
10.9
8.9
7.6
8.5
23.8
20.5
15.5
12.5
15.1
10.6
33.0
25.9
56.0
9.1
14.0
10.5
4.8
5.2
5.1
7.1
6.4
3.0
11.6
9.2
3.3
3.5
6.5
3.1
2.7
7.0
2.2
12.4
3.9
2.1
2.3
2.1
1.7
4.9
2.4
1.2
4.3
0.7
4.4
3.2
1.2
2.9
2.7
1.0
0.8
0.8
1.2
0.9
1.4
0.5
0.9
4.7
6.3
4.6
2.7
3.9
2.1
15.0
6.1
NA
3.7
3.6
2.3
4.1
4.5
4.5
6.0
5.8
2.6
8.7
7.7
2.8
3.1
5.7
2.8
2.4
5.9
1.6
9.3
3.2
1.9
2.1
2.0
1.6
4.1
2.3
1.2
3.7
0.7
3.7
2.9
1.1
2.4
2.4
0.9
0.8
0.7
1.1
0.9
1.3
0.5
0.9
3.7
5.3
3.7
2.3
3.3
1.9
12.3
5.1
NA
3.3
3.0
2.0
17.3
20.4
25.0
20.1
15.2
13.0
35.7
20.5
16.8
12.5
33.7
14.5
9.8
20.5
13.4
26.5
22.8
7.3
11.5
2.6
9.6
18.8
8.8
6.3
16.9
4.0
14.8
12.4
6.7
17.3
13.9
6.4
1.5
3.4
11.6
4.7
7.0
-4.7
7.9
12.5
20.2
15.3
13.2
19.6
14.1
32.8
19.3
22.7
27.6
14.9
17.4
18.1
25.2
26.8
23.2
18.1
16.2
35.0
22.8
18.4
13.7
31.1
14.6
11.4
23.0
28.3
35.6
21.6
10.8
11.8
8.2
10.0
20.4
10.5
6.9
19.0
8.0
16.5
13.7
12.6
19.5
15.4
9.4
4.3
6.1
12.7
7.1
11.4
2.1
10.0
12.3
20.4
19.3
15.4
19.6
15.3
32.8
18.6
22.2
30.7
18.9
17.2
Company
Automobiles
Amara Raja
Ashok Ley.
Bajaj Auto
Bharat Forge
Bosch
CEAT
Eicher Mot.
Endurance Tech.
Escorts
Exide Ind
Hero Moto
M&M
Mahindra CIE
Maruti Suzuki
Tata Motors
TVS Motor
Aggregate
Banks - Private
Axis Bank
DCB Bank
Equitas Hold.
Federal Bank
HDFC Bank
ICICI Bank
IDFC Bank
IndusInd
J&K Bank
Kotak Mah. Bk
RBL Bank
South Indian
Yes Bank
Aggregate
Banks - PSU
BOB
BOI
Canara
Indian Bk
PNB
SBI
Union Bk
Aggregate
NBFCs
Aditya Birla Cap
Bajaj Fin.
Bharat Fin.
Capital First
Cholaman.Inv.&Fn
Dewan Hsg.
GRUH Fin.
HDFC
HDFC Stand. Life
Indiabulls Hsg
L&T Fin Holdings
LIC Hsg Fin
Reco
Buy
Buy
Buy
Buy
Neutral
Buy
Buy
Buy
Sell
Buy
Neutral
Buy
Not Rated
Buy
Buy
Neutral
837
856
119
134
3,363 4,197
728
844
20,264 19,965
2,003 2,116
30,121 34,653
1,355 1,334
756
688
221
254
3,805 3,819
741
829
260
-
9,671 9,866
424
575
770
764
Buy
Neutral
Buy
Buy
Buy
Buy
Neutral
Buy
Buy
Buy
Buy
Buy
Buy
554
194
142
110
1,866
318
55
1,662
78
1,015
516
32
315
680
197
209
146
2,150
355
56
2,000
100
1,179
665
36
382
23
2
47
33
15
12
2
20
28
16
29
14
21
18.4
8.5
1.7
5.5
68.7
13.6
2.8
60.9
4.1
32.1
16.4
1.9
17.8
30.8
10.5
5.7
6.6
84.7
17.0
3.2
78.6
8.7
41.6
23.0
3.8
23.3
40.2
12.8
9.9
8.2
105.4
21.8
3.4
100.8
13.6
51.9
30.8
4.9
29.5
Buy
Neutral
Neutral
Buy
Buy
Buy
Neutral
167
172
375
389
174
317
148
201
201
386
438
250
415
175
21
17
3
13
43
31
18
17.9
3.2
16.1
36.7
8.5
14.6
-13.5
22.6
9.2
30.3
44.0
13.5
26.8
6.0
29.7
17.7
62.1
50.8
16.0
35.8
19.5
Buy
Buy
Under Review
Buy
Buy
Buy
Neutral
Buy
Buy
Buy
Buy
Neutral
185
1,785
1,004
707
1,294
594
498
1,709
377
1,198
180
570
231
2,300
-
925
1,500
690
500
2,000
370
1,550
240
680
25
29
31
16
16
0
17
-2
29
34
19
3.7
45.7
30.3
32.8
59.2
37.6
9.9
51.6
4.7
83.6
6.9
41.0
5.4
63.7
47.2
43.7
70.4
46.0
12.0
57.1
5.4
105.1
10.4
46.5
7.8
87.0
64.6
56.5
85.9
56.0
15.1
66.0
6.7
131.1
12.9
54.5
27 December 2017
11

Click excel icon
for detailed
valuation guide
CMP
(INR)
476
463
1,338
678
2,061
1,461
TP
(INR)
562
550
1,750
750
2,650
1,500
% Upside
EPS (INR)
Downside FY18E FY19E
18
13.5
18.7
19
42.6
42.0
31
52.5
66.5
11
36.0
41.9
29
115.6 145.3
3
15.5
11.8
Valuation snapshot
FY20E
23.1
48.1
88.8
50.0
173.7
9.7
P/E (x)
P/B (x)
ROE (%)
FY19E FY20E FY19E FY20E FY19E FY20E
25.5
20.6
3.2
3.0
10.7
12.2
11.0
9.6
2.4
2.0
23.8
19.9
20.1
15.1
3.6
3.2
15.0
16.7
16.2
13.6
3.2
2.7
18.1
17.9
14.2
11.9
2.4
2.1
14.3
15.9
124.1 151.3
2.6
2.3
15.1
17.4
22.3
18.1
3.9
3.4
17.6
18.6
48.5
23.2
31.0
32.9
41.4
40.0
26.5
38.1
38.5
20.9
23.4
40.0
38.1
35.7
16.6
33.3
28.4
32.5
24.5
20.2
38.6
9.8
17.5
17.5
23.0
22.7
18.7
23.1
17.6
14.3
35.5
29.4
22.7
44.5
44.3
38.6
38.0
39.0
39.9
35.4
48.8
26.3
35.6
40.1
52.5
40.1
21.7
23.7
26.0
34.3
30.3
23.5
30.6
31.1
17.0
19.5
35.1
30.4
32.9
14.7
29.3
23.9
26.0
21.1
18.6
28.9
8.6
15.3
13.7
17.4
17.8
11.1
17.4
11.5
10.6
23.6
23.5
18.2
36.9
35.4
32.1
32.5
33.6
35.6
31.3
41.6
23.2
29.6
33.9
43.5
7.9
4.7
1.0
9.6
22.9
1.3
6.4
9.3
9.3
5.0
3.3
5.7
9.0
5.0
2.9
5.8
3.4
2.7
3.6
2.5
5.2
1.5
1.1
3.7
3.4
4.4
3.1
5.4
2.1
2.3
6.7
4.4
2.9
14.1
17.4
22.0
11.0
14.3
9.8
8.5
44.7
7.0
6.6
15.4
22.7
7.1
4.2
1.0
8.8
18.8
1.3
5.9
8.1
8.2
4.2
3.0
5.2
1.5
4.5
2.5
5.1
3.1
2.5
3.4
2.3
4.6
1.3
1.0
3.1
3.0
3.8
2.7
4.5
1.9
1.9
5.7
3.9
2.6
12.1
14.1
20.6
9.8
12.4
8.6
7.5
41.4
6.4
6.4
14.4
20.4
11.6
17.9
3.3
20.2
51.0
2.1
18.1
21.8
19.5
19.5
12.5
9.1
21.4
12.6
17.5
16.5
11.9
7.0
11.1
7.3
10.3
11.5
3.5
17.5
9.9
16.0
12.3
13.7
6.1
10.8
20.0
11.1
12.9
26.9
34.0
48.8
26.0
31.7
23.8
21.4
75.9
24.4
15.5
33.6
39.0
14.6
18.1
3.3
27.8
49.8
3.3
22.2
22.6
21.2
20.2
13.3
13.1
21.5
13.2
16.4
16.3
12.9
8.0
14.2
12.0
12.7
14.5
6.0
19.2
13.9
17.9
15.6
21.3
11.3
14.6
17.4
14.2
14.2
29.4
35.2
55.2
27.3
34.0
22.9
22.6
88.0
25.6
18.3
37.1
40.9
Company
M&M Fin.
Muthoot Fin
PNB Housing
Repco Home
Shriram City Union
Shriram Trans.
Aggregate
Capital Goods
ABB
Bharat Elec.
BHEL
Blue Star
CG Cons. Elec.
CG Power & Indu.
Cummins
GE T&D
Havells
K E C Intl
L&T
Siemens
Solar Ind
Thermax
Va Tech Wab.
Voltas
Aggregate
Cement
Ambuja Cem.
ACC
Birla Corp.
Dalmia Bharat
Grasim Inds.
India Cem
J K Cements
JK Lakshmi Ce
Ramco Cem
Orient Cem
Prism Cem
Sagar Cements
Sanghi Inds.
Shree Cem
Ultratech
Aggregate
Consumer
Asian Paints
Britannia
Colgate
Dabur
Emami
Godrej Cons.
GSK Cons.
HUL
ITC
Jyothy Lab
Marico
Nestle
Reco
Buy
Neutral
Buy
Buy
Buy
Buy
Sell
Buy
Sell
Neutral
Buy
Neutral
Buy
Neutral
Buy
Neutral
Buy
Neutral
Neutral
Neutral
Buy
Neutral
1,391
187
93
805
269
91
929
428
549
368
1,270
1,239
1,194
1,228
617
654
1,230
210
78
685
260
90
1,150
440
620
350
1,440
1,313
1,120
930
745
580
-12
13
-16
-15
-3
-1
24
3
13
-5
13
6
-6
-24
21
-11
20.2
7.1
2.9
16.5
5.2
1.4
25.3
9.4
11.5
14.3
46.8
19.8
26.2
29.9
34.5
17.5
28.7
8.0
3.0
24.4
6.5
2.3
35.0
11.2
14.3
17.6
54.3
31.0
31.3
34.4
37.2
19.6
34.7
8.6
3.9
31.0
7.8
3.0
39.6
14.0
17.7
21.7
65.1
35.3
39.3
37.3
41.9
22.4
Neutral
Neutral
Buy
Buy
Neutral
Neutral
Buy
Buy
Buy
Buy
Buy
Not Rated
Buy
Buy
Buy
272
314
1,739 1,797
1,143 1,435
3,229 3,517
1,147 1,302
185
188
1,082 1,324
439
512
795
853
169
205
115
130
833
-
127
157
17,726 21,852
4,322 4,906
15
3
26
9
14
2
22
17
7
21
13
23
23
14
6.9
52.2
32.2
60.8
81.9
5.8
47.8
12.1
27.1
6.3
2.7
23.4
5.8
486.2
102.2
8.4
70.9
56.7
83.7
116.8
10.5
61.8
19.1
35.1
9.1
5.0
47.4
8.9
499.3
147.1
10.5
82.4
61.6
111.7
133.5
12.1
79.1
25.2
44.7
15.2
6.6
72.2
12.0
751.1
184.0
Neutral
Buy
Buy
Buy
Buy
Neutral
Neutral
Buy
Neutral
Neutral
Neutral
Neutral
1,150
4,734
1,082
353
1,295
978
6,460
1,348
264
388
318
7,828
1,280
6,100
1,355
410
1,435
1,015
5,400
1,500
280
365
340
7,750
11
29
25
16
11
4
-16
11
6
-6
7
-1
21.6
84.5
23.4
7.7
26.6
21.2
160.8
22.8
9.1
9.2
6.5
128.4
25.8
106.9
28.1
9.3
33.2
24.5
182.3
27.6
10.0
10.9
7.9
149.0
31.1
133.8
33.7
10.9
38.6
27.4
206.5
32.4
11.4
13.1
9.4
180.1
27 December 2017
12

Click excel icon
for detailed
valuation guide
CMP
TP
% Upside
EPS (INR)
(INR)
(INR) Downside FY18E FY19E
24,625 25,580
4
296.6 413.1
295
275
-7
8.9
12.4
926
975
5
17.2
20.8
9,416 9,267
-2
151.5 176.7
229
-
3.5
6.4
1,063 1,320
24
14.7
18.0
3,567 2,970
-17
34.9
53.7
Valuation snapshot
FY20E
544.5
16.8
24.0
209.4
9.7
22.3
73.6
P/E (x)
P/B (x)
ROE (%)
FY19E FY20E FY19E FY20E FY19E FY20E
59.6
45.2
33.0
26.4
39.8
44.4
23.8
17.6
3.4
3.0
10.8
13.3
44.6
38.6
11.8
9.7
24.1
23.9
53.3
45.0
36.8
30.7
64.8
62.9
35.9
23.6
3.2
2.9
4.9
8.5
59.2
47.7
10.5
9.1
15.5
16.5
66.4
48.4
18.6
13.9
18.2
20.9
38.9
33.2
11.4
10.1
29.5
30.5
21.3
24.4
23.0
13.6
53.6
18.0
22.6
24.8
20.5
30.7
13.4
15.1
44.1
22.4
14.0
20.4
29.7
20.2
12.1
23.6
22.6
21.2
36.1
10.1
23.5
29.3
17.5
17.9
20.0
18.6
12.4
29.0
16.2
18.3
20.8
16.4
17.8
11.3
10.4
40.0
18.3
11.9
15.3
25.9
16.0
9.8
19.3
17.6
17.3
15.9
12.0
21.4
25.0
16.2
13.6
20.5
17.1
18.6
21.1
11.7
26.5
23.8
20.5
7.0
7.1
11.0
21.0
24.7
13.4
4.6
5.1
6.6
3.4
6.4
5.3
3.5
5.6
3.1
1.2
3.0
2.5
12.1
2.8
2.9
2.7
5.7
4.6
2.4
3.4
4.8
3.3
2.6
1.4
4.5
3.9
2.0
2.6
3.7
2.5
3.1
15.4
3.3
2.4
4.0
2.9
1.4
0.9
2.8
3.6
6.1
5.7
3.9
4.4
5.3
2.7
5.9
4.3
3.1
5.0
2.7
1.2
2.5
2.2
13.8
2.6
2.5
2.4
5.2
3.8
2.0
3.1
4.2
2.8
2.4
1.2
3.8
3.5
1.8
2.3
3.4
2.4
2.9
10.8
2.8
2.4
3.6
2.7
1.2
0.8
2.4
3.2
5.2
4.4
19.9
17.0
26.4
24.6
7.2
23.4
12.1
16.3
8.2
1.6
19.6
14.2
22.0
9.2
18.4
12.0
17.1
14.7
12.9
9.2
18.3
15.3
1.9
14.1
19.1
13.8
11.7
14.1
11.5
9.2
13.6
12.5
22.8
-6.4
6.3
-1.2
15.0
10.2
17.3
8.6
12.4
15.3
19.8
19.4
25.7
22.3
11.0
26.1
13.6
21.2
14.1
3.9
18.4
15.5
31.4
12.0
19.2
12.5
17.6
20.5
18.3
13.7
19.9
16.3
7.0
12.9
17.5
12.5
11.3
15.4
14.1
11.7
15.4
34.9
22.2
0.2
10.1
5.2
15.3
10.6
19.3
12.6
17.0
24.8
Company
Reco
Page Inds
Buy
Parag Milk
Neutral
Pidilite Ind.
Buy
P&G Hygiene
Neutral
Prabhat Dairy
Not Rated
United Brew
Buy
United Spirits
Neutral
Aggregate
Healthcare
Alembic Phar
Neutral
Alkem Lab
Buy
Ajanta Pharma
Buy
Aurobindo
Buy
Biocon
Neutral
Cadila
Buy
Cipla
Neutral
Divis Lab
Neutral
Dr Reddy’s
Neutral
Fortis Health
Buy
Glenmark
Neutral
Granules
Buy
GSK Pharma
Neutral
IPCA Labs
Neutral
Jubilant Life
Buy
Lupin
Buy
Sanofi India
Buy
Shilpa Medicare
Buy
Strides Shasun
Buy
Sun Pharma
Buy
Torrent Pharma
Neutral
Aggregate
Infrastructure
Ashoka Buildcon
Buy
IRB Infra
Neutral
KNR Constructions Buy
Sadbhav
Buy
Engineering
Aggregate
Logistics
Allcargo Logistics Buy
Concor
Neutral
Gateway Distriparks Buy
Aggregate
Media
Dish TV
Buy
D B Corp
Buy
Den Net.
Neutral
Ent.Network
Buy
Hathway Cable
Buy
Hind. Media
Buy
HT Media
Neutral
Jagran Prak.
Buy
Music Broadcast
Buy
PVR
Buy
Prime Focus
Buy
531
2,183
1,471
684
540
428
611
1,087
2,360
151
573
137
2,422
596
768
872
4,637
606
836
540
1,386
540
2,500
1,792
900
485
555
600
1,100
2,575
185
650
200
2,500
550
861
1,000
5,000
797
1,214
610
1,400
2
15
22
32
-10
30
-2
1
9
23
13
46
3
-8
12
15
8
32
45
13
1
21.6
68.0
52.7
44.6
6.1
17.5
21.1
32.4
60.6
1.9
37.9
6.9
44.2
18.6
44.2
37.6
139.0
18.1
41.8
14.4
50.0
24.9
89.5
64.1
50.3
10.1
23.7
27.0
43.7
115.2
4.9
42.8
9.1
54.9
26.5
55.0
42.7
156.2
29.9
69.2
22.9
61.4
29.7
109.1
79.2
55.3
18.6
26.4
33.3
52.4
144.0
8.4
50.5
13.2
60.6
32.6
64.4
57.1
179.0
37.8
85.3
28.0
78.5
255
235
341
426
260
240
320
435
2
2
-6
2
1.8
22.9
13.3
14.3
7.1
23.2
14.5
14.5
16.0
19.7
16.0
17.0
209
1,393
239
215
1,496
282
3
7
18
10.9
42.7
8.8
13.3
55.2
11.6
15.3
68.1
14.0
15.8
25.2
20.5
22.6
36.4
13.6
1,497.0
37.7
53.8
8.3
8.1
13.3
26.5
33.0
20.0
80
345
106
758
41
251
97
178
375
1,419
123
106
430
90
910
47
302
113
225
469
1,640
130
32
25
-15
20
15
21
16
26
25
16
6
0.6
21.7
-2.9
11.6
-0.2
25.6
10.4
11.3
8.7
27.1
3.1
2.2
25.4
0.1
20.1
0.8
30.2
11.9
13.4
14.1
43.0
6.1
3.8
29.6
4.0
31.8
2.0
35.6
13.6
16.2
17.8
57.3
9.2
27 December 2017
13

Click excel icon
for detailed
valuation guide
CMP
(INR)
26
999
582
TP
(INR)
27
1,005
690
% Upside
EPS (INR)
Downside FY18E FY19E FY20E
6
-0.8
0.1
0.6
1
28.1
35.7
41.8
19
14.4
17.3
20.6
Valuation snapshot
P/E (x)
P/B (x)
ROE (%)
FY19E FY20E FY19E FY20E FY19E FY20E
202.3
39.5
4.8
4.7
-14.2
2.4
28.0
23.9
9.0
8.2
26.4
30.7
33.6
28.2
7.1
6.1
19.1
19.6
26.7
21.0
4.8
4.1
17.9
19.4
10.2
9.1
423.9
10.7
14.3
11.0
28.8
9.3
7.2
11.1
9.9
10.3
16.0
24.6
16.8
10.1
9.6
29.2
20.7
11.4
8.8
8.6
15.2
15.0
11.8
64.9
25.2
53.8
45.4
13.5
13.0
19.7
15.2
12.1
14.7
17.1
15.7
12.6
13.2
23.9
17.5
13.1
15.1
12.0
16.4
84.0
10.0
9.6
47.2
11.7
14.0
10.6
11.8
8.4
7.0
9.5
9.4
9.7
15.2
20.0
14.7
9.4
9.0
25.6
20.5
10.6
8.4
8.8
12.5
13.4
11.1
49.2
19.7
43.1
35.9
12.3
12.6
17.5
13.7
10.0
13.4
13.8
14.3
11.3
11.4
19.8
16.7
11.4
13.7
10.8
15.2
57.0
1.8
4.5
0.6
2.4
1.5
1.8
1.1
3.2
1.8
2.0
1.6
2.9
2.1
6.0
2.5
2.7
1.7
6.7
5.3
2.0
0.9
1.1
3.9
1.8
1.6
13.7
4.7
14.5
9.5
2.7
3.5
5.1
3.7
1.9
5.3
3.8
2.8
2.2
2.7
8.6
6.3
2.5
2.8
2.4
3.8
3.2
1.6
3.4
0.6
2.0
1.4
1.7
1.0
2.4
1.6
1.7
1.4
2.5
1.9
5.0
2.2
2.3
1.5
5.6
4.8
1.8
0.9
1.0
3.3
1.6
1.5
13.6
4.1
13.1
8.5
2.5
3.2
4.3
3.3
1.6
4.2
3.4
2.6
2.0
2.6
7.0
5.4
2.2
2.3
2.1
3.4
3.1
13.6
32.3
-4.7
19.8
8.6
17.8
-5.0
25.2
15.1
17.1
16.2
25.2
12.0
17.8
14.4
25.1
15.8
22.0
27.3
15.1
8.0
10.8
25.2
12.1
13.4
16.5
16.5
23.4
20.9
17.4
25.9
26.4
21.8
14.1
35.6
17.3
14.6
15.1
17.9
33.6
30.6
18.9
17.0
15.3
23.2
2.2
16.5
42.5
0.1
20.2
10.1
15.9
3.7
29.7
23.8
16.6
15.2
25.8
12.6
22.1
14.0
25.0
16.6
21.0
24.4
16.7
10.4
12.4
23.7
12.0
13.0
20.9
17.5
25.5
23.8
18.3
25.6
23.4
22.5
14.5
31.8
21.2
17.3
16.4
20.8
32.4
33.5
18.2
16.7
18.4
22.5
3.7
Company
Siti Net.
Sun TV
Zee Ent.
Aggregate
Metals
Hindalco
Hind. Zinc
JSPL
JSW Steel
Nalco
NMDC
SAIL
Rain Industries
Vedanta
Tata Steel
Aggregate
Oil & Gas
BPCL
GAIL
Gujarat Gas
Gujarat St. Pet.
HPCL
IOC
IGL
Mahanagar Gas
MRPL
Oil India
ONGC
PLNG
Reliance Ind.
Aggregate
Retail
Jubilant Food
PC Jeweller
Titan Co.
Aggregate
Technology
Cyient
HCL Tech.
Hexaware
Infosys
KPIT Tech
L&T Infotech
Mindtree
Mphasis
NIIT Tech
Persistent Sys
Tata Elxsi
TCS
Tech Mah
Wipro
Zensar Tech
Aggregate
Telecom
Bharti Airtel
Reco
Neutral
Buy
Buy
Buy
Neutral
Buy
Buy
Neutral
Buy
Sell
Buy
Buy
Neutral
268
306
193
267
83
140
90
361
322
721
326
322
209
297
87
187
43
492
394
672
22
5
9
11
5
33
-52
36
23
-7
18.8
22.7
-15.1
20.3
4.7
13.2
-4.3
25.5
25.5
59.4
26.4
33.5
0.5
24.9
5.8
12.7
3.1
38.9
44.4
65.2
26.9
32.1
4.1
22.9
5.9
13.2
7.6
43.0
46.3
75.8
Buy
Sell
Buy
Neutral
Buy
Buy
Buy
Neutral
Sell
Buy
Buy
Buy
Buy
537
509
826
222
430
409
330
1,116
131
357
194
254
928
643
378
1,011
184
579
541
404
1,219
110
418
227
312
1,077
20
-26
22
-17
35
32
22
9
-16
17
17
23
16
43.1
28.1
22.9
12.1
36.4
36.2
10.0
54.4
9.2
29.8
19.1
15.0
56.7
52.1
31.9
33.6
13.2
42.8
42.6
11.3
53.8
11.5
40.5
22.7
16.7
62.1
55.6
33.6
41.3
15.2
45.6
45.6
12.9
54.5
12.3
42.4
21.9
20.3
69.1
Sell
Buy
Buy
1,781
463
855
1,270
490
850
-29
6
-1
21.4
15.1
12.5
27.4
18.4
15.9
36.2
23.5
19.9
Buy
Neutral
Neutral
Buy
Neutral
Buy
Buy
Neutral
Neutral
Buy
Buy
Neutral
Buy
Neutral
Buy
564
888
336
1,034
171
1,055
598
725
636
694
960
2,643
493
303
873
600
970
270
1,100
160
1,200
600
670
600
780
1,004
2,450
560
280
1,020
6
9
-20
6
-6
14
0
-8
-6
12
5
-7
14
-8
17
36.0
63.2
16.3
63.8
11.9
62.4
28.5
42.0
43.7
43.3
33.8
131.8
35.8
19.1
52.8
41.9
68.2
17.0
67.8
14.1
71.8
35.1
46.0
50.3
52.4
40.2
151.4
37.7
20.1
72.7
45.9
70.6
19.2
75.7
17.1
78.9
43.5
50.6
56.1
60.8
48.4
158.4
43.1
22.1
80.9
Buy
543
680
25
3.8
6.5
9.5
27 December 2017
14

Click excel icon
for detailed
valuation guide
CMP
(INR)
369
102
680
TP
(INR)
440
110
780
% Upside
EPS (INR)
Downside FY18E FY19E
19
16.8
19.2
8
-16.1 -18.0
15
5.4
18.2
Valuation snapshot
FY20E
21.1
-14.3
32.8
P/E (x)
P/B (x)
ROE (%)
FY19E FY20E FY19E FY20E FY19E FY20E
19.2
17.5
4.4
4.3
20.2
22.8
NM
NM
1.9
3.0
-26.6 -41.4
37.4
20.7
13.2
9.8
10.1
30.0
2,088.3 96.2
3.3
3.3
0.2
3.5
12.8
10.3
27.9
10.2
11.3
9.9
12.4
11.5
27.5
65.9
39.2
19.7
29.7
19.1
39.8
25.2
15.9
11.1
48.5
13.9
28.2
24.1
19.4
15.2
13.0
33.3
26.7
19.3
18.6
28.5
38.6
8.9
45.3
40.4
10.7
9.5
25.2
8.6
10.0
9.5
11.9
10.2
19.5
47.7
33.6
16.7
28.7
18.2
31.0
19.8
11.0
9.6
41.7
11.8
21.2
20.2
16.4
12.9
11.2
24.5
23.6
15.3
14.7
23.3
28.7
7.3
39.2
36.0
6.4
1.2
1.4
1.1
1.4
1.9
2.0
1.9
3.1
16.4
6.5
1.9
30.0
4.8
5.4
8.9
7.0
2.3
7.0
4.1
4.0
3.6
7.2
4.6
2.5
6.0
6.7
3.1
3.2
4.5
9.3
1.5
9.9
13.1
6.1
1.1
1.4
1.1
1.3
1.6
1.7
1.7
2.9
14.0
5.8
1.6
27.3
4.1
4.9
7.2
6.7
1.9
6.3
3.6
3.6
3.4
6.2
3.9
2.2
5.1
5.6
2.8
2.9
4.1
7.5
1.3
8.8
10.4
42.4
10.7
6.3
8.4
11.0
17.0
16.0
16.1
7.4
18.2
14.6
9.3
100.3
22.5
12.1
32.1
46.8
17.0
13.7
23.3
8.4
10.0
32.5
26.3
13.9
24.2
23.0
11.7
13.2
11.3
17.7
14.5
18.0
26.9
47.7
11.1
5.0
10.8
11.9
17.4
14.6
16.8
10.9
22.9
15.7
8.0
96.1
23.4
12.9
31.5
43.0
18.5
13.7
27.4
13.5
14.4
34.5
27.9
17.8
16.4
22.9
15.3
16.3
15.1
21.5
16.1
20.7
28.8
Company
Reco
Bharti Infratel
Neutral
Idea Cellular
Buy
Tata Comm
Buy
Aggregate
Utiltites
Coal India
Buy
CESC
Buy
JSW Energy
Sell
NHPC
Buy
NTPC
Buy
Power Grid
Buy
Tata Power
Sell
Aggregate
Others
Arvind
Neutral
Avenue Supermarts Sell
Bata India
Sell
BSE
Neutral
Castrol India
Buy
Coromandel Intl
Buy
Delta Corp
Buy
Eveready Inds.
Buy
Interglobe
Neutral
Indo Count
Neutral
Info Edge
Buy
Kaveri Seed
Buy
Manpasand
Buy
MCX
Buy
Monsanto
Buy
Navneet Education Buy
Oberoi Realty
Buy
Quess Corp
Buy
PI Inds.
Buy
Piramal Enterp.
Buy
SRF
Buy
S H Kelkar
Buy
Team Lease Serv. Buy
Trident
Buy
TTK Prestige
Neutral
V-Guard
Neutral
264
1,056
91
32
178
202
93
335
1,360
49
37
211
261
72
27
29
-46
17
19
29
-23
17.5
89.1
4.0
2.4
13.4
17.4
7.3
20.7
102.1
3.3
3.1
15.7
20.4
7.5
24.6
110.7
3.6
3.7
17.8
21.3
7.8
453
1,150
755
907
198
553
320
439
1,201
119
1,271
569
433
946
2,456
159
472
1,090
952
2,890
1,948
276
2,476
92
7,970
240
425
873
578
1,100
234
523
257
400
1,291
128
1,300
738
492
1,300
3,293
209
580
1,170
890
3,266
1,992
301
2,500
114
5,281
167
-6
-24
-23
21
18
-6
-20
-9
8
7
2
30
14
37
34
32
23
7
-7
13
2
9
1
24
-34
-31
10.5
12.0
15.9
45.3
6.3
24.1
5.7
14.3
63.2
8.0
23.6
34.1
9.9
26.5
105.0
8.4
24.8
31.1
29.9
104.6
76.7
6.6
43.2
8.3
137.8
4.5
16.5
17.5
19.3
46.1
6.7
29.0
8.0
17.4
75.4
10.7
26.2
41.0
15.4
39.2
126.6
10.4
36.2
32.7
35.6
149.7
104.9
9.7
64.2
10.4
176.1
6.0
23.2
24.1
22.4
54.5
6.9
30.3
10.3
22.1
109.1
12.4
30.5
48.1
20.5
46.8
149.9
12.3
42.3
44.5
40.3
188.7
132.7
11.8
86.3
12.6
203.2
6.7
27 December 2017
15

MOSL Universe stock performance
Company
Automobiles
Amara Raja
Ashok Ley.
Bajaj Auto
Bharat Forge
Bosch
CEAT
Eicher Mot.
Endurance Tech.
Escorts
Exide Ind
Hero Moto
M&M
Mahindra CIE
Maruti Suzuki
Tata Motors
TVS Motor
Banks - Private
Axis Bank
DCB Bank
Equitas Hold.
Federal Bank
HDFC Bank
ICICI Bank
IDFC Bank
IndusInd
J&K Bank
Kotak Mah. Bk
RBL Bank
South Indian
Yes Bank
Banks - PSU
BOB
BOI
Canara
Indian Bk
PNB
SBI
Union Bk
NBFCs
Aditya Birla Cap
Bajaj Fin.
Bharat Fin.
Capital First
Cholaman.Inv.&Fn
Dewan Hsg.
GRUH Fin.
HDFC
HDFC Stand. Life
Indiabulls Hsg
L&T Fin.Holdings
LIC Hsg Fin
M&M Fin.
Muthoot Fin
PNB Housing
1 Day (%)
0.4
1.6
1.1
-0.2
1.7
2.7
-0.4
0.5
1.3
0.2
0.5
-0.6
4.0
-0.3
0.4
-0.6
0.2
-0.3
-1.0
1.8
-0.6
0.3
0.2
0.8
0.2
0.6
0.2
0.0
1.7
-0.8
0.4
1.3
-0.7
-0.9
-0.9
-0.2
-1.1
0.2
0.7
0.7
0.1
0.2
-0.3
0.0
0.7
0.3
0.4
0.3
0.3
0.0
-1.0
1M (%)
5.9
0.8
2.1
4.0
6.8
9.9
-2.2
13.2
10.4
6.7
4.1
3.3
6.2
13.9
-0.3
4.1
1.8
3.9
-2.5
-2.4
0.8
0.1
0.5
-0.9
3.6
-1.6
0.8
0.6
0.8
-5.8
-14.4
-4.0
-5.7
-6.3
-4.6
-11.7
-8.7
0.0
1.5
0.0
1.6
-3.9
-0.9
-0.1
1.6
2.2
0.9
-4.7
6.4
2.6
-3.0
12M (%)
-4.0
55.9
29.5
65.1
5.1
76.4
48.6
150.7
170.2
27.6
26.6
29.0
47.7
87.2
-7.6
110.2
28.4
88.4
1.2
75.8
58.8
40.6
-2.0
56.7
33.8
43.0
56.1
84.7
43.2
13.1
65.8
45.9
91.0
51.4
29.8
21.2
Company
Repco Home
Shriram City Union
Shriram Trans.
Capital Goods
ABB
Bharat Elec.
BHEL
Blue Star
CG Cons. Elec.
CG Power & Inds Sol.
Cummins
GE T&D
Havells
K E C Intl
L&T
Siemens
Solar Ind
Thermax
Va Tech Wab.
Voltas
Cement
Ambuja Cem.
ACC
Birla Corp.
Dalmia Bharat
Grasim Inds.
India Cem
J K Cements
JK Lakshmi Ce
Ramco Cem
Orient Cem
Prism Cem
Sagar Cements
Sanghi Inds.
Shree Cem
Ultratech
Consumer
Asian Paints
Britannia
Colgate
Dabur
Emami
Godrej Cons.
GSK Cons.
HUL
ITC
Jyothy Lab
Marico
Nestle
Page Inds
Parag Milk
Pidilite Ind.
P&G Hygiene
Prabhat Dairy
United Brew
1 Day (%)
-0.8
-0.1
0.0
0.9
-1.1
0.9
1.0
0.7
0.1
5.9
0.5
0.0
-2.7
0.2
0.7
1.4
0.9
-0.1
-0.4
1.7
1.0
0.4
-1.5
1.2
0.9
-0.4
-1.5
2.4
1.5
-1.1
-0.2
-0.9
-0.4
0.8
1.2
-0.2
-0.9
-0.2
-1.4
-0.9
-0.4
-0.3
0.2
0.9
0.3
-0.5
0.0
0.3
-2.0
0.2
0.6
0.2
1M (%)
7.8
1.8
17.9
-1.4
0.9
0.8
14.9
2.3
6.6
7.6
0.4
5.7
13.2
4.4
4.3
1.3
17.2
7.5
5.0
2.7
2.3
5.7
5.6
-4.5
5.5
8.1
11.8
12.2
3.7
0.3
1.9
4.4
3.8
2.1
-0.9
-0.2
2.8
2.7
2.9
0.9
6.9
6.4
1.4
3.0
3.1
4.2
9.0
22.3
9.9
2.4
46.8
-2.1
12M (%)
32.7
18.0
86.6
35.0
51.9
19.2
81.3
91.3
62.3
17.3
49.9
74.9
179.0
42.4
18.1
80.9
64.4
34.0
111.2
37.4
35.1
82.6
149.5
68.9
71.6
68.9
26.7
57.0
39.0
48.7
35.8
166.8
32.3
40.1
32.6
68.8
21.2
35.8
31.2
37.1
30.2
68.3
17.3
18.2
32.6
34.3
90.6
14.8
60.9
39.6
148.1
40.3
120.5
109.0
37.7
41.6
157.8
65.7
39.8
90.8
119.5
6.3
90.5
73.5
64.7
27 December 2017
16

MOSL Universe stock performance
Company
United Spirits
Healthcare
Alembic Phar
Alkem Lab
Ajanta Pharma
Aurobindo
Biocon
Cadila
Cipla
Divis Lab
Dr Reddy’s
Fortis Health
Glenmark
Granules
GSK Pharma
IPCA Labs
Jubilant Life
Lupin
Sanofi India
Shilpa Medicare
Strides Shasun
Sun Pharma
Torrent Pharma
Infrastructure
Ashoka Buildcon
IRB Infra.Devl.
KNR Construct.
Sadbhav Engg.
Logistics
Allcargo Logistics
Concor
Gateway Distriparks
Media
Dish TV
D B Corp
Den Net.
Ent.Network
Hathway Cab.
Hind. Media
HT Media
Jagran Prak.
Music Broadcast
PVR
Prime Focus
Siti Net.
Sun TV
Zee Ent.
Metals
Hindalco
Hind. Zinc
JSPL
JSW Steel
Nalco
NMDC
Rain Industries
1 Day (%)
0.4
0.3
1.9
-0.4
0.3
0.1
0.9
1.9
-0.2
1.2
5.6
0.7
3.9
-0.6
-0.7
-0.7
0.2
-1.7
0.3
-0.1
1.9
1.6
0.1
-0.1
10.8
2.9
6.5
2.4
0.0
-0.6
1.3
-3.5
-0.1
-0.8
1.6
-0.6
4.3
-1.2
-1.5
6.6
-0.2
0.3
1.3
0.2
-0.3
4.4
1.2
0.5
3.9
0.1
1M (%)
9.5
2.5
10.4
10.8
-4.3
30.4
-4.2
-0.6
3.9
2.7
8.5
-3.4
9.9
-2.6
11.8
20.8
5.1
4.2
-7.7
1.8
-1.5
8.2
6.4
1.4
23.4
19.1
24.6
3.6
-7.5
-2.1
-5.9
17.5
-3.9
17.7
0.8
-3.8
7.8
0.0
8.7
19.5
2.4
14.1
3.2
6.5
-0.9
11.5
0.8
0.7
10.5
10.3
12M (%)
95.4
-12.7
40.9
-12.8
9.5
81.3
26.5
10.3
42.0
-21.0
-12.7
-35.6
34.5
-10.5
14.0
37.0
-37.9
10.4
-12.5
-18.2
-11.7
9.7
64.5
24.5
127.8
64.9
21.0
59.1
3.8
-1.5
-3.1
63.0
-5.1
19.1
-3.6
34.6
7.9
37.7
88.2
-30.9
112.3
34.6
77.0
22.8
194.7
74.3
50.6
17.7
599.3
Company
SAIL
Vedanta
Tata Steel
Oil & Gas
BPCL
GAIL
Gujarat Gas
Gujarat St. Pet.
HPCL
IOC
IGL
Mahanagar Gas
MRPL
Oil India
ONGC
PLNG
Reliance Ind.
Retail
Jubilant Food
PC Jeweller
Titan Co.
Technology
Cyient
HCL Tech.
Hexaware
Infosys
KPIT Tech
L&T Infotech
Mindtree
Mphasis
NIIT Tech
Persistent Sys
Tata Elxsi
TCS
Tech Mah
Wipro
Zensar Tech
Telecom
Bharti Airtel
Bharti Infratel
Idea Cellular
Tata Comm
Utiltites
Coal India
CESC
JSW Energy
NHPC Ltd
NTPC
Power Grid
Tata Power
Others
Arvind
Avenue Super.
Bata India
BSE
1 Day (%)
5.8
1.7
1.5
0.6
1.3
0.5
0.4
0.2
-0.4
0.3
-0.2
2.1
-0.4
0.2
0.8
1.0
0.7
4.7
-0.1
-1.1
0.1
-0.2
-0.4
-1.0
-1.6
-0.1
-1.5
-1.0
6.8
0.2
0.1
0.1
0.7
-0.3
2.6
1.5
1.1
0.1
-0.9
0.6
2.6
4.3
-1.1
-0.4
0.3
-0.2
-0.2
0.5
0.4
1M (%)
9.7
5.2
1.9
5.1
8.1
-2.3
7.0
-0.2
3.4
5.4
1.0
3.4
-2.7
7.1
0.4
-2.3
-1.5
20.9
3.2
-0.6
3.4
3.2
2.4
-2.8
6.4
16.9
1.3
-3.4
6.9
0.9
-1.7
-0.1
3.7
-0.1
9.4
-3.0
7.5
-1.9
-2.7
4.4
8.9
17.2
-1.5
-4.2
-0.5
4.5
0.2
1.9
-3.8
12M (%)
88.9
54.2
89.6
33.8
58.7
63.7
70.0
56.1
32.8
86.4
44.1
49.9
10.8
2.5
46.9
77.3
125.5
136.7
177.9
17.7
12.2
66.7
5.2
26.7
57.5
22.5
36.5
54.7
15.2
48.2
15.3
6.5
33.0
-5.0
83.2
13.1
46.6
12.7
-7.5
73.2
64.8
22.4
11.1
13.2
27.0
38.4
79.3
27 December 2017
17

MOSL Universe stock performance
Company
Others
Castrol India
Coromandel Intl
Delta Corp
Eveready Inds.
Interglobe
Indo Count
Info Edge
Kaveri Seed
Manpasand
MCX
Monsanto
Navneet Educat.
Oberoi Realty
PI Inds.
Piramal Enterp.
Quess Corp
SRF
S H Kelkar
Team Lease Serv.
Trident
V-Guard
1 Day (%)
-1.6
3.1
2.7
-0.2
1.7
-1.6
-0.9
3.1
-1.2
0.1
-0.1
0.1
0.3
-0.5
-0.4
1.9
-0.3
0.2
5.3
0.8
1.0
1M (%)
0.6
10.0
27.3
4.4
2.0
-7.2
4.2
1.6
8.1
-0.2
-0.6
-8.2
-3.9
9.1
8.6
17.8
5.3
6.6
23.6
6.1
0.9
12M (%)
10.7
102.8
235.6
113.9
45.7
-22.2
43.2
46.3
64.7
-22.2
9.7
45.4
61.8
18.9
96.2
77.2
33.5
-4.8
184.3
68.2
110.5
27 December 2017
18

THEMATIC/STRATEGY RESEARCH GALLERY

REPORT GALLERY
RECENT INITIATING COVERAGE REPORTS
Rs
Rs

DIFFERENTIATED PRODUCT GALLERY

Disclosures:
The following Disclosures are being made in compliance with the SEBI Research Analyst Regulations 2014 (herein after referred to as the Regulations).
Motilal Oswal Securities Ltd. (MOSL) is a SEBI Registered Research Analyst having registration no. INH000000412. MOSL, the Research Entity (RE) as defined in the Regulations, is engaged in the business of providing Stock
broking services, Investment Advisory Services, Depository participant services & distribution of various financial products. MOSL is a subsidiary company of Motilal Oswal Financial Service Ltd. (MOFSL). MOFSL is a listed
public company, the details in respect of which are available on
www.motilaloswal.com.
MOSL is registered with the Securities & Exchange Board of India (SEBI) and is a registered Trading Member with National Stock
Exchange of India Ltd. (NSE) and Bombay Stock Exchange Limited (BSE), Metropolitan Stock Exchange Of India Ltd. (MSE) for its stock broking activities & is Depository participant with Central Depository Services Limited
(CDSL) & National Securities Depository Limited (NSDL) and is member of Association of Mutual Funds of India (AMFI) for distribution of financial products. Details of associate entities of Motilal Oswal Securities Limited are
available on the website at
http://onlinereports.motilaloswal.com/Dormant/documents/Associate%20Details.pdf
Pending Regulatory Enquiries against Motilal Oswal Securities Limited by SEBI:
SEBI pursuant to a complaint from client Shri C.R. Mohanraj alleging unauthorized trading, issued a letter dated 29th April 2014 to MOSL notifying appointment of an Adjudicating Officer as per SEBI regulations to hold
inquiry and adjudge violation of SEBI Regulations; MOSL requested SEBI to provide all documents, records, investigation report relied upon by SEBI which were referred in Show Cause Notice and also sought personal
hearing. The matter is currently pending.
MOSL, it’s associates, Research Analyst or their relative may have any financial interest in the subject company. MOSL and/or its associates and/or Research Analyst may have beneficial ownership of 1% or more securities in
the subject company at the end of the month immediately preceding the date of publication of the Research Report.
MOSL and its associate company(ies), their directors and Research Analyst and their relatives may; (a) from
time to time, have a long or short position in, act as principal in, and buy or sell the securities or derivatives thereof of companies mentioned herein. (b) be engaged in any other transaction involving such securities and earn
brokerage or other compensation or act as a market maker in the financial instruments of the company(ies) discussed herein or act as an advisor or lender/borrower to such company(ies) or may have any other potential
conflict of interests with respect to any recommendation and other related information and opinions.; however the same shall have no bearing whatsoever on the specific recommendations made by the analyst(s), as the
recommendations made by the analyst(s) are completely independent of the views of the associates of MOSL even though there might exist an inherent conflict of interest in some of the stocks mentioned in the research
report.
Research Analyst may have served as director/officer, etc. in the subject company in the last 12 month period. MOSL and/or its associates may have received any compensation from the subject company in the past
12 months.
In the last 12 months period ending on the last day of the month immediately preceding the date of publication of this research report, MOSL or any of its associates may have:
managed or co-managed public offering of securities from subject company of this research report,
received compensation for investment banking or merchant banking or brokerage services from subject company of this research report,
received compensation for products or services other than investment banking or merchant banking or brokerage services from the subject company of this research report.
Subject Company may have been a client of MOSL or its associates during twelve months preceding the date of distribution of the research report.
MOSL and it’s associates have not received any compensation or other benefits from the subject company or third party in connection with the research report. To enhance transparency, MOSL has incorporated a Disclosure
of Interest Statement in this document. This should, however, not be treated as endorsement of the views expressed in the report. MOSL and / or its affiliates do and seek to do business including investment banking with
companies covered in its research reports. As a result, the recipients of this report should be aware that MOSL may have a potential conflict of interest that may affect the objectivity of this report. Compensation of Research
Analysts is not based on any specific merchant banking, investment banking or brokerage service transactions.
Terms & Conditions:
This report has been prepared by MOSL and is meant for sole use by the recipient and not for circulation. The report and information contained herein is strictly confidential and may not be altered in any way, transmitted to,
copied or distributed, in part or in whole, to any other person or to the media or reproduced in any form, without prior written consent of MOSL. The report is based on the facts, figures and information that are considered
true, correct, reliable and accurate. The intent of this report is not recommendatory in nature. The information is obtained from publicly available media or other sources believed to be reliable. Such information has not
been independently verified and no guaranty, representation of warranty, express or implied, is made as to its accuracy, completeness or correctness. All such information and opinions are subject to change without notice.
The report is prepared solely for informational purpose and does not constitute an offer document or solicitation of offer to buy or sell or subscribe for securities or other financial instruments for the clients. Though
disseminated to all the customers simultaneously, not all customers may receive this report at the same time. MOSL will not treat recipients as customers by virtue of their receiving this report.
Analyst Certification
The views expressed in this research report accurately reflect the personal views of the analyst(s) about the subject securities or issues, and no part of the compensation of the research analyst(s) was, is, or will be directly or
indirectly related to the specific recommendations and views expressed by research analyst(s) in this report.
Disclosure of Interest Statement
Analyst ownership of the stock
Companies where there is interest
No
A graph of daily closing prices of securities is available at
www.nseindia.com, www.bseindia.com.
Research Analyst views on Subject Company may vary based on Fundamental research and Technical Research. Proprietary
trading desk of MOSL or its associates maintains arm’s length distance with Research Team as all the activities are segregated from MOSL research activity and therefore it can have an independent view with regards to
subject company for which Research Team have expressed their views.
Regional Disclosures (outside India)
This report is not directed or intended for distribution to or use by any person or entity resident in a state, country or any jurisdiction, where such distribution, publication, availability or use would be contrary to law,
regulation or which would subject MOSL & its group companies to registration or licensing requirements within such jurisdictions.
For Hong Kong:
This report is distributed in Hong Kong by Motilal Oswal capital Markets (Hong Kong) Private Limited, a licensed corporation (CE AYY-301) licensed and regulated by the Hong Kong Securities and Futures Commission (SFC)
pursuant to the Securities and Futures Ordinance (Chapter 571 of the Laws of Hong Kong) “SFO”. As per SEBI (Research Analyst Regulations) 2014 Motilal Oswal Securities (SEBI Reg No. INH000000412) has an agreement with
Motilal Oswal capital Markets (Hong Kong) Private Limited for distribution of research report in Hong Kong. This report is intended for distribution only to “Professional Investors” as defined in Part I of Schedule 1 to SFO. Any
investment or investment activity to which this document relates is only available to professional investor and will be engaged only with professional investors.” Nothing here is an offer or solicitation of these securities,
products and services in any jurisdiction where their offer or sale is not qualified or exempt from registration. The Indian Analyst(s) who compile this report is/are not located in Hong Kong & are not conducting Research
Analysis in Hong Kong.
For U.S.
Motilal Oswal Securities Limited (MOSL) is not a registered broker - dealer under the U.S. Securities Exchange Act of 1934, as amended (the"1934 act") and under applicable state laws in the United States. In addition MOSL is
not a registered investment adviser under the U.S. Investment Advisers Act of 1940, as amended (the "Advisers Act" and together with the 1934 Act, the "Acts), and under applicable state laws in the United States.
Accordingly, in the absence of specific exemption under the Acts, any brokerage and investment services provided by MOSL, including the products and services described herein are not available to or intended for U.S.
persons. This report is intended for distribution only to "Major Institutional Investors" as defined by Rule 15a-6(b)(4) of the Exchange Act and interpretations thereof by SEC (henceforth referred to as "major institutional
investors"). This document must not be acted on or relied on by persons who are not major institutional investors. Any investment or investment activity to which this document relates is only available to major institutional
investors and will be engaged in only with major institutional investors. In reliance on the exemption from registration provided by Rule 15a-6 of the U.S. Securities Exchange Act of 1934, as amended (the "Exchange Act") and
interpretations thereof by the U.S. Securities and Exchange Commission ("SEC") in order to conduct business with Institutional Investors based in the U.S., MOSL has entered into a chaperoning agreement with a U.S.
registered broker-dealer, Motilal Oswal Securities International Private Limited. ("MOSIPL"). Any business interaction pursuant to this report will have to be executed within the provisions of this chaperoning agreement.
The Research Analysts contributing to the report may not be registered /qualified as research analyst with FINRA. Such research analyst may not be associated persons of the U.S. registered broker-dealer, MOSIPL, and
therefore, may not be subject to NASD rule 2711 and NYSE Rule 472 restrictions on communication with a subject company, public appearances and trading securities held by a research analyst account.
For Singapore
Motilal Oswal Capital Markets Singapore Pte Limited is acting as an exempt financial advisor under section 23(1)(f) of the Financial Advisers Act(FAA) read with regulation 17(1)(d) of the Financial Advisors Regulations and is a
subsidiary of Motilal Oswal Securities Limited in India. This research is distributed in Singapore by Motilal Oswal Capital Markets Singapore Pte Limited and it is only directed in Singapore to accredited investors, as defined in
the Financial Advisers Regulations and the Securities and Futures Act (Chapter 289), as amended from time to time. In respect of any matter arising from or in connection with the research you could contact the following
representatives of Motilal Oswal Capital Markets Singapore Pte Limited:
Disclaimer:
The report and information contained herein is strictly confidential and meant solely for the selected recipient and may not be altered in any way, transmitted to, copied or distributed, in part or in whole, to any other person
or to the media or reproduced in any form, without prior written consent. This report and information herein is solely for informational purpose and may not be used or considered as an offer document or solicitation of
offer to buy or sell or subscribe for securities or other financial instruments. Nothing in this report constitutes investment, legal, accounting and tax advice or a representation that any investment or strategy is suitable or
appropriate to your specific circumstances. The securities discussed and opinions expressed in this report may not be suitable for all investors, who must make their own investment decisions, based on their own investment
objectives, financial positions and needs of specific recipient. This may not be taken in substitution for the exercise of independent judgment by any recipient. Each recipient of this document should make such investigations
as it deems necessary to arrive at an independent evaluation of an investment in the securities of companies referred to in this document (including the merits and risks involved), and should consult its own advisors to
determine the merits and risks of such an investment. The investment discussed or views expressed may not be suitable for all investors. Certain transactions -including those involving futures, options, another derivative
products as well as non-investment grade securities - involve substantial risk and are not suitable for all investors. No representation or warranty, express or implied, is made as to the accuracy, completeness or fairness of
the information and opinions contained in this document. The Disclosures of Interest Statement incorporated in this document is provided solely to enhance the transparency and should not be treated as endorsement of the
views expressed in the report. This information is subject to change without any prior notice. The Company reserves the right to make modifications and alternations to this statement as may be required from time to time
without any prior approval. MOSL, its associates, their directors and the employees may from time to time, effect or have effected an own account transaction in, or deal as principal or agent in or for the securities
mentioned in this document. They may perform or seek to perform investment banking or other services for, or solicit investment banking or other business from, any company referred to in this report. Each of these entities
functions as a separate, distinct and independent of each other. The recipient should take this into account before interpreting the document. This report has been prepared on the basis of information that is already
available in publicly accessible media or developed through analysis of MOSL. The views expressed are those of the analyst, and the Company may or may not subscribe to all the views expressed therein. This document is
being supplied to you solely for your information and may not be reproduced, redistributed or passed on, directly or indirectly, to any other person or published, copied, in whole or in part, for any purpose. This report is not
directed or intended for distribution to, or use by, any person or entity who is a citizen or resident of or located in any locality, state, country or other jurisdiction, where such distribution, publication, availability or use would
be contrary to law, regulation or which would subject MOSL to any registration or licensing requirement within such jurisdiction. The securities described herein may or may not be eligible for sale in all jurisdictions or to
certain category of investors. Persons in whose possession this document may come are required to inform themselves of and to observe such restriction. Neither the Firm, not its directors, employees, agents or
representatives shall be liable for any damages whether direct or indirect, incidental, special or consequential including lost revenue or lost profits that may arise from or in connection with the use of the information.
The
person accessing this information specifically agrees to exempt MOSL or any of its affiliates or employees from, any and all responsibility/liability arising from such misuse and agrees not to hold MOSL or any of its affiliates or
employees responsible for any such misuse and further agrees to hold MOSL or any of its affiliates or employees free and harmless from all losses, costs, damages, expenses that may be suffered by the person accessing this
information due to any errors and delays.
Registered Office Address: Motilal Oswal Tower, Rahimtullah Sayani Road, Opposite Parel ST Depot, Prabhadevi, Mumbai-400025; Tel No.: 022-3980 4263; www.motilaloswal.com. Correspondence Address: Palm Spring
Centre, 2nd Floor, Palm Court Complex, New Link Road, Malad (West), Mumbai- 400 064. Tel No: 022 3080 1000. Compliance Officer: Neeraj Agarwal, Email Id:
na@motilaloswal.com,
Contact No.:022-30801085.
Registration details of group entities.: MOSL: SEBI Registration: INZ000158836; CDSL: IN-DP-16-2015; NSDL: IN-DP-NSDL-152-2000; Research Analyst: INH000000412. AMFI: ARN 17397. Investment Adviser: INA000007100.
Motilal Oswal Asset Management Company Ltd. (MOAMC): PMS (Registration No.: INP000000670) offers PMS and Mutual Funds products. Motilal Oswal Wealth Management Ltd. (MOWML): PMS (Registration No.:
INP000004409) offers wealth management solutions. *Motilal Oswal Securities Ltd. is a distributor of Mutual Funds, PMS, Fixed Deposit, Bond, NCDs, Insurance and IPO products. * Motilal Oswal Commodities Broker Pvt. Ltd.
offers Commodities Products. * Motilal Oswal Real Estate Investment Advisors II Pvt. Ltd. offers Real Estate products. * Motilal Oswal Private Equity Investment Advisors Pvt. Ltd. offers Private Equity products
13 December 2016
20