1 January 2018
Market snapshot
Equities - India
Close
Chg .%
Sensex
34,057
0.6
Nifty-50
10,531
0.5
Nifty-M 100
21,134
0.7
Equities-Global
Close
Chg .%
S&P 500
2,674
-0.5
Nasdaq
6,903
-0.7
FTSE 100
7,688
0.9
DAX
12,918
-0.5
Hang Seng
11,709
0.2
Nikkei 225
22,765
-0.1
Commodities
Close
Chg .%
Brent (US$/Bbl)
67
0.6
Gold ($/OZ)
1,297
0.4
Cu (US$/MT)
7,207
-0.6
Almn (US$/MT)
2,256
-0.8
Currency
Close
Chg .%
USD/INR
63.8
-0.4
USD/EUR
1.2
0.4
USD/JPY
112.6
-0.2
YIELD (%)
Close
1MChg
10 Yrs G-Sec
7.3
-0.07
10 Yrs AAA Corp
8.0
-0.11
Flows (USD b)
29-Dec
MTD
FIIs
0.1
-0.7
DIIs
0.1
1.3
Volumes (INRb)
29-Dec
MTD*
Cash
394
347
F&O
2,777
6,854
Note: YTD is calendar year, *Avg
YTD.%
27.9
28.6
47.3
YTD.%
19.4
28.2
7.6
12.5
24.6
19.1
YTD.%
20.6
11.9
30.5
32.4
YTD.%
-6.0
13.6
-3.9
YTDchg
0.8
0.5
YTD
7.7
14.0
YTD*
310
5,771
Today’s top research idea
Motherson Sumi: Magical times ahead!
MSS is in a sweet spot to benefit from the evolving disruptive global
automotive trends, which would drive its next wave of growth. MSS is now
entrenched in the virtuous cycle of 'scale begets scale', as it would significantly
benefit from OEMs' focus on vendor consolidation.
MSS has strong organic growth opportunities in both international and
domestic markets, driven by an increase in content per vehicle, a strong order
book and its entry in new markets/segments.
Over the next 12-15 months, with bulk of SMP plants ramping up, we expect
~19% revenue CAGR to EUR5b by FY20 and EBITDA margin expansion of 450bp
to ~11%.
PKC would benefit from a) strong tailwind in US Class 8 trucks, b) ramp-up in
China Truck and c) ramp-up in rolling stock, driving revenue CAGR of 15%
(FY17-20E) and ~400bp EBITDA margin expansion to ~10.9% by FY20E.
For MSS, we estimate consolidated revenue/EBITDA/PAT CAGR of
22%/30%/33.5% over FY17-20E. We initiate coverage with a Buy rating and a
target price of INR458.
Supportive global trends | Strong growth visibility | Financial discipline
Research covered
Cos/Sector
Motherson Sumi (Initiating Coverage)
Automobiles
Key Highlights
Magical times ahead!
Strong wholesales on low base of previous year; Rural
sentiment remains positive
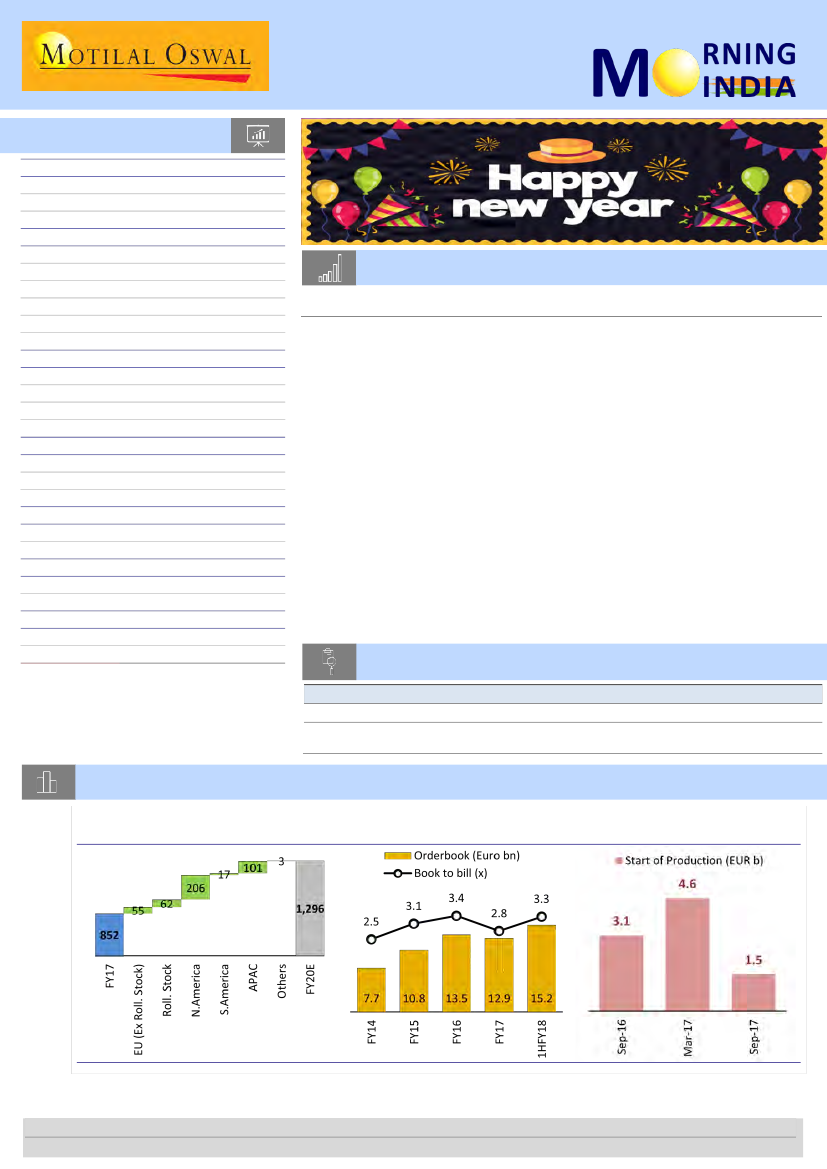
Chart of the Day: Motherson Sumi – Magical times ahead!
We estimate 15% CAGR in PKC’s revenue
driven by US class 8 trucks and APAC
SMRPBV has strong order book
resulting in high growth visibility
SMRPBV has started execution of
EUR9.2b orders in last 12 months
Research Team (Gautam.Duggad@MotilalOswal.com)
Motilal Oswal research is available on www.motilaloswal.com/Institutional-Equities, Bloomberg, Thomson Reuters, Factset and S&P Capital.
Investors are advised to refer through important disclosures made at the last page of the Research Report.

In the news today
Kindly click on textbox for the detailed news link
1
FPIs withdraw Rs. 5,900 cr from
equities in December
Overseas investors have pulled
out close to Rs. 5,900 crore from
domestic equities this month, with
widening fiscal deficit and higher
crude prices making market
participants cautious on macro-
economic front. In spite of
December performance,…
2
The anti-profiteering watchdog set up under goods and services tax (GST)
law has launched investigation into three entities for allegedly not passing
on the benefit of tax cuts to customers. The entities facing investigation
are Hardcastle Restaurants Pvt. Ltd, which runs McDonald’s restaurants in
West and South of India, department store chain Lifestyle International
Pvt. Ltd and a Jaipur-based trading company dealing in consumer packaged
goods made by Hindustan Unilever products, a person familiar with the
development said on condition of anonymity…
McDonald’s, Lifestyle, and HUL stockist among first to be
investigated by anti-profiteering body
3
Looking to expand further in
India: Tata Steel
Tata Steel is committed to further
growing its business in India and is
hoping to work more closely with
the government, a top official said
today. The successful roll out of
the Goods and Services Tax (GST)
also had positive implications
across the company's value chain
in India, T V Narendran, CEO and
Managing Director of Tata Steel,…
4
Bajaj family starts the process
to pass their wealth to
younger generation
The Bajaj Group's promoters have
initiated the process of passing on
their wealth to the younger
generation as part of succession
planning by realigning their
ownership through the purchase
and sale of stock in various listed
group companies among
themselves…
5
ATM operators demand an
increase in inter-bank charges
The automated teller machine
(ATM) industry wants the central
bank to increase the interchange
fee for ATM transactions
because of the increased costs of
running the channel, impact of
demonetization and a fall in
transaction volumes.
Interchange fee is what banks
pay each other for the use of
other banks’ ATMs by their
customers. The representation is
being led by the National
Payments Corp. of India (NPCI),
which has held discussions with
public sector banks and private
sector lenders separately, two
people close to the development
said on condition of anonymity…
6
PNB raises interest rate on
term deposits by up to 1.25%
State-run Punjab National Bank
(PNB) has announced it will raise
interest rates by up to 1.25 per
cent on domestic term deposits of
up to Rs 10 crore for different
tenures, effective from the New
Year, January 1, 2018. As per the
new PNB rates, for domestic retail
term deposits of less than Rs 1
crore with the tenure of 7 to 29
days,…
7
Finance Ministry asks PSBs to
consider selling, swapping loan
assets
The Finance Ministry has asked
public sector banks (PSBs) to
explore options for selling and
swapping of loan assets with other
lenders with a view to strengthen
their balance sheets. Depending
on their competencies, banks can
look at opportunities to buy or
swap loan assets, sources said,…
1 January 2018
2

Motherson Sumi
BSE Sensex
33,848
S&P CNX
10,478
Initiating Coverage | Sector: Automobiles
CMP: INR372
TP: INR458(+23%)
Buy
Stock Info
Bloomberg
Equity Shares (m)
52-Week Range (INR)
1, 6, 12 Rel. Per (%)
M.Cap. (INR b)
M.Cap. (USD b)
Avg Val, INRm
Free float (%)
MSS IN
2,105
395 / 207
2/12/48
782.4
12.2
870
36.9
Motherson Sumi Systems (MSS) is the flagship company of the Samvardhana
Motherson Group. The company was promoted in 1986 in JV with Sumitomo Wiring
Systems and Sojitz Corporation of Japan. MSSL had started out as a single product
(wiring harness) company, but has since expanded its product range to include polymer
products (through SMP), automotive mirrors (through SMR) and elastomers. The group
has four divisions namely the wiring harness (15%), polymers (52%), mirrors (28%) and
others components (5%). The latest acquisition of PKC (100% owned) strengthens MSS
presence in commercial vehicle wiring harness segment. The group operates 230 plants
in 37 countries and employs over 100k people.
Magical times ahead!
Supportive global trends | Strong growth visibility | Financial discipline
MSS has enviable track record of strong performance with unwavering focus on capital
allocation. MSS has evolved as a partner of choice for all most all OEMs in the world,
reflecting in increasing share of business and market leadership in all the key
businesses that it operates in. It is in sweet spot to benefit from evolving disruptive
global automotive trends, which would drive its next wave of growth. MSS is now
entrenched in the virtuous cycle of “scale begets scale”, as it would significantly benefit
from OEMs focus on vendor consolidation. MSS has strong organic growth
opportunities in international as well as domestic market driven by increase in content
per vehicle, strong order book and entry in new markets/segment. We estimate MSS’s
consolidated revenues/EBITDA/PAT to grow 22%/30%/33.5% CAGR FY17-20E.
Consequently, we expect RoCE (post-tax) to improve to 21.2% in FY20 (14.7% in FY17).
We initiate coverage with buy rating and target price of INR458.
Financial Snapshot (INR b) - Consol
Y/E Mar
2017 2018E 2019E
Net Sales
424.9 564.0 670.2
EBITDA
42.8
54.8
75.8
PAT
16.2
21.1
30.3
EPS (INR)
7.7
10.0
14.4
Gr. (%)
18.2
30.0
43.9
BV/Sh (INR)
39.3
46.2
56.5
RoE (%)
25.6
23.4
28.1
RoCE (%)
14.7
13.8
18.7
P/E (x)
48.3
37.1
25.8
P/BV (x)
9.5
8.0
6.6
Shareholding pattern (%)
As On
Sep-17 Jun-17 Sep-16
Promoter
63.1
63.1
63.1
DII
7.6
6.5
6.7
FII
19.7
20
19.9
Others
9.6
10.4
10.2
FII Includes depository receipts
Motherson Sumi
Magical times ahead!
Jinesh Gandhi
+
91 22 3980 5416
Jinesh.Gandhi@motilaloswal.com
Please click here for Video Link
On right side of global automotive megatrends
:
The global automotive
industry is at the cusp of disruption, led by megatrends in the form of (a)
EVs, (b) connect cars, (c) autonomous cars, (d) shared mobility, (e) stricter
emission norms, and (f) platform and vendor consolidation. These trends
have the potential to disrupt the automotive supply chain and challenge
incumbents. We believe, with its diverse product base and market presence,
MSS is set to leverage on these trends to drive its next wave of growth.
PKC – Synergistic acquisition, opens up new businesses; Strong growth
ahead
:
PKC would be biggest beneficiary of strong outlook (up to 25%
growth estimates for CY18) for N.America Class 8 trucks as it enjoys ~62%
market share of US Class 8 truck wiring harness and ~54% of revenues
contribution from North America. PKC is also highly focused on worlds
largest truck market of China, where it has entered recently through two JVs
(3rd JV underway). These two JVs would result in market share addition of
15% in HD trucks and 5% in MD trucks. Lastly, PKC entered rolling stock
business (~USD2b opportunity) in 2015. PKC has already won contract worth
EUR280m from Bombardier since entering into global partnership in May
1 January 2018
3

Stock Performance (1-year)
2016. It is in discussion with other OEMs to develop global supply chain for
electrical system. PKC revenues are expected to grow at 15% CAGR over FY17-
20E, driving ~400bp EBITDA margin expansion to ~10.9% by FY20E.
SMRPBV – the growth engine for MSS; SMP on track to improve margins,
RoCE
:
SMRPBV’s (51% owned hold-co for SMP & SMR) order-book growth lends
us comfort in building ~16% revenue CAGR over FY17-20 for SMRPBV. As of
September 2017, order book stood at EUR15.2b (~2x in 3.5 years), excluding
orders of EUR9.2b, for which execution started in the last 12 months. SMP is in a
sweet spot, as revenue visibility is high and it is nearing the end of an amplified
capex cycle. In the next 12-15 months, with bulk of SMP’s plants ramping up, it
would derive twin benefits of operating leverage and non-recurrence of start-up
costs. We estimate ~19% revenue CAGR to EUR5b by FY20 and EBITDA margin to
expand 450bp to ~11% by FY20, driven by operating leverage, considering the
high fixed cost nature of the business. SMR continues to be #1 PV mirror
company globally and has gained share across markets through continuous
innovation. We estimate 9% CAGR in SMR’s revenue to EUR2b by FY20 and
EBITDA margin to expand further by 120bp to 11.8% by FY20.
Standalone business on strong footing; Beneficiary of high growth in domestic
PV segment, premiumization
:
The India wiring harness business is likely to grow
faster than the PV industry, led by increase in content (due to ongoing
premiumization). BS-6 would increase complexity of wiring harness and increase
value by 20-50%. Also, it would open up the 2W segment for MSS, as 2Ws shift
to electronic fuel injection systems with more sensors. MSS is already market
leader in 2W wiring harness in EU. The India polymer (MATE) and elastomer
(MAE) businesses are evolving from supporting to core businesses to growth
drivers. Polymer business is focusing on leveraging its strengths in export
markets like South Africa for global OEMs. We expect India standalone business
to witness revenue CAGR of 16% and PAT CAGR of 19% over FY17-20E.
Vision 2020 – Management confident to achieve it
:
In May 2015, MSS had
shared its Vision 2020, targeting revenues of USD18b, RoCE of 40% and payout
of 40%. Of USD18b revenues, it was expected organic revenues of USD12.4b and
balance USD5.6b through M&A. M&A has been strategic tool for MSS to
strengthen its relationship with customers and get more share of business.
While acquisitions will play key role to attain revenue targets, management is
very clear that acquisitions have to pass its 40% RoCE hurdle rate in 4-5 years.
Valuation and view:
MSS offers strong visibility of earnings growth along with
improving capital efficiencies. We estimate MSS’s consolidated
revenues/EBITDA/PAT to grow 22%/30%/33.5% CAGR FY17-20E. Consequently,
we expect RoCE (post-tax) to improve to 21.2% in FY20 (14.7% in FY17).
Although MSS is currently trading at premium to its 5 year average PE, premium
valuations are justified considering sharp improvement in post-tax RoCE (~21.2%
in FY20 v/s average ~13.4% in last 5 years) and possibility of stronger than
expected earnings growth. The stock trades at 25.8x/20.3x FY19E/20E consol.
EPS. We initiate coverage with buy rating and target price of INR458/share
valuing 25x FY20 consolidated EPS (in-line with historical average).
1 January 2018
4

Exhibit 1: MSS offers best combination of growth, superior RoEs & reasonable valuations
FY19
38
31
BJAUT
24
17
EXID
10
15
20
25
PE (x)
HMCL
MSIL
SF *
MSS
SEL *
EIM
TVSL
BHFC
SKF *
BOS
SCHFL *
ENDU
TMKN *
AMRJ
WIL *
30
35
40
Source: Bloomberg, MOSL
Exhibit 2: MSS holding structure
MSS consolidated
FY17 Revenue - INR 424.9b
Adjusted PAT - INR 15.5b
India business (100%)
FY17 Revenue - INR63.5b
Adjusted PAT - INR8.3b
Wiring harness,
Elastomers, Polymer,
Others
PKC (100%)
FY17 Revenue - Euro 852m
Adjusted PAT - Euro 13.7m
SMIL
Promoter owned entity
51%
49%
SMPR BV (51%)
Wiring harness
for CVs & rolling stock
SMP (100%) - Polymers
FY17 Revenue - Euro 2.9b
Adjusted PAT - Euro 28m
SMR (100%) - Mirrors
FY17 Revenue - Euro 1.6m
Adjusted PAT - Euro 47m
Exhibit 3: MSS–Revenue mix based on economic interest (%)
MSS
10
43
23
0
24
FY17
PKC
SMR
SMP
Others
9
31
14
22
23
FY20E
Source: Company, MOSL
Exhibit 4: MSS – EBITDA mix based on economic interest (%)
MSS
12
24
21
0
43
FY17
PKC
SMR
SMP
Others
8
32
14
16
30
FY20E
Source: Company, MOSL
1 January 2018
5

Story in charts
Exhibit 5: Strong recovery in US class 8 trucks to benefit PKC
North America Class 8 Build
254
275
243
293
319
224
250
277
313
Exhibit 6: PKCs addressable market have increased 2x
Truck
APAC truck
Agriculture
Rolling stock
Construction
Aerospace
2.0
2.0
0.7 0.2
1.5
1.5
CY15
1.0
0.7 0.2
1.5
1.5
Now
Source: Company, MOSL
Bus
Source: Company, MOSL
Exhibit 7: PKC’s market share in China HD wiring harness
Pre Huakai JV
15
10
5
2
Heavy Duty (%)
0
0
Medium Duty (%)
Source: Company, MOSL
Post Huakai JV
Post JAC JV
Exhibit 8: PKCs rolling stock revenues to grow at 21% CAGR
Rolling stock (EUR m)
113
74
124
136
FY17E
FY18E
FY19E
FY20E
Source: Company, MOSL
Exhibit 9: SMRPBV has strong order book
Orderbook (Euro bn)
3.1
2.5
3.4
Book to bill (x)
2.8
3.3
Exhibit 10: Growth to be driven by recently added plants
SMRP BV - Capex (EUR m)
319
218
149
231
121
7.7
FY14
10.8
FY15
13.5
FY16
12.9
FY17
15.2
1HFY18
FY14
FY15
FY16
FY17
1HFY18
Source: Company, MOSL
Exhibit 11: Beyond 2020 - Motherson group targeting areas beyond autos
Source: Company, MOSL
1 January 2018
6

Sector Update | 29 December 2017
Automobiles
Dec-17 Sales Estimates
Strong wholesales on low base of previous year
Mr. Rakesh Srivastava,
Director - Marketing
and Sales,
Hyundai India, said
“We foresee closing this
calendar with cumulative
retail sales of 200,000 units
in the last four months and
are cautiously optimistic of
recording double-digit
growth for the entire fiscal
year driven by improving
macro-economic factors,
stable interest rates and
booming rural markets.”
Rural sentiment remains positive; 2W retails mixed bag, PV strong
Our channel checks indicate mixed 2W demand, with the momentum gained from the
wedding season in the northern belt being partially negated by muted sales in Rajasthan,
Gujarat and Maharashtra due to an inauspicious buying period.
PV retails are picking up, driven by year-end related discounts and the rush to beat price
increases from January. On the CV front, players are offering steep discounts (~5% higher)
and other incentives to clear the current stock ahead of the upcoming regulatory change
that makes it mandatory for all new CVs to have air blowers (for better ventilation in the
st
cabin) as a standard fitment from 1 January 2018.
The impact of low base of previous year (owing to demonetization) would lead to most
OEMs reporting healthy double-digit growth in wholesales in Dec-17.
Key highlights:
In the 2W segment, BJAUT’s dispatches are expected increase 37% YoY to 309k units,
led by 33.6% growth in domestic sales and 40.8% growth in exports.
HMCL is expected to report 67.5% YoY growth (-8.6% MoM) in wholesales to 553k
units.
TVSL is expected to witness 31.3% sales growth, as motorcycle, scooter and 3W sales
are expected to grow by 54.7%, 36.8% and 44.6%, respectively. Moped sales are also
expected to increase by 4.9% YoY. Exports are likely to improve by 49.9% YoY to 46k
units.
We expect RE volumes to grow by a healthy 22% YoY to 70k units.
In the PV segment, MSIL’s overall dispatches are expected to grow 20% YoY to 141.5k
units. Growth in wholesales is despite the plant shutdown due to yearly maintenance.
Demand for Baleno, Brezza, New Dzire and S-cross remains robust, as these models
enjoy a healthy waiting period. Compact and UV segments continue to see robust
growth of 31.9% and 40.6%, respectively.
Tata Motors’ PV segment is expected to grow 34.2% YoY, led by its new SUV Nexon.
CV segment is likely to grow 44.3% YoY, as HCV and LCV dispatches are expected to
increase 40.7% YoY and 47.4% YoY, respectively.
MM’s volumes are expected to increase 9.3% YoY to 55.1k units, as tractor, LCV and
3W volumes are expected to increase by 28.1%, 39% and 21.5%, respectively.
We expect AL’s wholesales to grow 47.2% YoY to 15.8k units (LCVs: 74.4% YoY; HCVs:
41.2% YoY), while TTMT and VECV’s CV sales are expected to grow by 44.3% and 43.2%
respectively.
We prefer 4Ws over 2Ws and CVs due to stronger volume growth and a stable
competitive environment. While we expect 2W volumes to benefit from a rural
recovery in the near term, competitive intensity remains high in the segment due to
changing customer preferences.
Our top picks in autos are MSIL, Bajaj Auto, Tata Motors and Amara Raja. We also
consider MM as the best bet on a rural market recovery.
“There are early signs that
the farmer is out there in
the market. Retail off take,
which normally slows down
after the festive season, has
seen a pick-up of walk-ins
and buying in central India."
Mr. Y S Guleria,
VP - Marketing and
Sales,
HMSI, said
1 January 2018
7

Exhibit 1:
Snapshot of volumes for Dec-17
YoY
Company Sales
Maruti Suzuki
LCVs
Vans
Mini Segment
Compact (incl Dzire
Tour)
60,500
Mid Size - CIAZ
3,750
UVs
22,600
Total Domestic
130,500
Export
11,000
Mahindra
&
Mahindra
55,100
UV (incl. pick-ups) 31,500
LCV
1,400
Three-Wheelers
4,200
Tractors
18,000
Tata Motors
57,950
HCV's
19,500
LCV's
23,500
CV's
43,000
Cars
10,200
UV's
4,750
Hero MotoCorp
553,000
Bajaj Auto
309,000
Motorcycles
250,000
Total
Two-
Wheelers
250,000
Three-Wheelers
59,000
Domestic
160,000
Exports
149,000
Ashok Leyland
15,800
CV (ex LCV)
12,400
LCV
3,400
TVS Motor
242,800
Motorcycles
90,000
Scooters
76,000
Mopeds
69,000
Three-Wheelers
7,800
Total Domestic
196,800
Total Exports
46,000
Eicher Motors
Royal Enfield
70,000
VECV
5,650
Domestic LMD
3,000
Domestic HD
1,150
Domestic Buses
700
Total Domestic
4,850
Exports
800
MoM
YoY (%)
MoM
Dec-17 Dec-16
Nov-17
chg
(%) chg
141,500 117,908 20.0 154,600 -8.5
850
26
1,003 -15.3
11,000 9,224
19.3 13,565 -18.9
31,800 31,527
0.9
38,204 -16.8
45,854
3,711
16,072
106,414
11,494
31.9
1.1
40.6
22.6
-4.3
Residual
Growth
(%)
FY18
FY18YTD FY17YTD
Gr. (%)
(%)
chg estimate
1329,235 1,154,164 15.2 1,798,133 14.6
13.1
6,082
294
8,000
116,353 112,007 3.9 161,802
6.4
13.6
322,221 312,001 3.3 432,948
4.6
8.6
23.8 760,103
-2.4
63,159
34.9 245,218
16.6 1,671,231
-0.7 126,902
30.0
-2.0
25.3
15.7
2.3
50.0
-1.0
-1.1
13.3
11.1
74.9
20.0
5.8
47.2
11.4
-1.2
-9.9
-4.1
-7.0
4.7
56.7
17.1
27.4
26.1
26.1
37.3
33.1
19.2
7.8
-0.4
43.2
38.6
62.1
49.7
2.5
77.4
33.6
61.1
30.3
5.4
-7.6
-6.0
14.3
-8.8
60.0
Residual
Monthly
Run rate
156,299
639
15,150
36,909
68,810
5,719
17,305
144,533
11,766
73,656
47,561
1,768
5,666
18,660
49,752
16,440
17,526
33,966
11,880
3,906
633,001
334,440
294,748
294,748
39,692
205,596
128,844
17,115
12,829
4,286
311,228
113,693
111,750
76,657
9,128
251,274
59,954
77,416
6,282
2,313
1,142
1,436
4,891
1,004
FY18 YTD
Monthly
Run rate
147,693
676
12,928
35,802
61,519
5,111
21,478
137,515
10,178
69,753
36,877
1,219
4,272
27,384
47,937
13,875
19,407
33,282
11,264
3,391
629,062
330,874
281,576
281,576
49,298
192,765
138,109
12,516
9,268
3,248
284,763
111,549
94,135
71,549
7,530
239,052
45,711
66,276
4,646
2,339
829
821
3,989
657
65,447 -7.6 553,673 447,203
4,009
-6.5
46,001
47,114
23,072 -2.0 193,302 143,254
145,300 -10.2 1,237,632 1,061,873
9,300
18.3
91,603
92,291
50,410
9.3
61,324
31,898 -1.2 32,823
1,007
39.0
1,292
3,458
21.5
4,455
14,047 28.1 22,754
40,944 41.5 57,271
13,863 40.7 17,621
15,942 47.4 22,402
29,805 44.3 40,023
9,829
3.8
11,638
1,310 262.6 5,610
330,202 67.5 605,270
225,529 37.0 326,458
203,312 23.0 263,970
-10.1 627,773 581,318 8.0
-4.0 331,892 318,490 4.2
8.4
10,974
9,327
17.7
-5.7
38,447
40,762 -5.7
-20.9 246,460 212,739 15.9
1.2
431,431 391,255 10.3
10.7 124,874 121,128 3.1
4.9
174,662 154,189 13.3
7.4
299,536 275,317 8.8
-12.4 101,373 102,973 -1.6
-15.3 30,522
12,965 135.4
-8.6 5661,555 5,042,098 12.3
-5.3 2977,866 2,878,237 3.5
-5.3 2,534,183 2,518,915 0.6
0.6
23.5
-3.1
14.3
15.6
11.7
28
14.0
16.4
31.0
-6.2
25.9
11.2
30.9
848,740 19.9
474,576
8.5
16,279
13.5
55,444
6.0
302,441 15.0
580,688
7.1
174,193
-0.9
227,240
8.7
401,433
4.3
137,014
0.0
42,240 106.6
7,560,559 13.5
3,981,186 8.6
3,418,427 6.2
3,418,427
562,759
2,351,677
1,629,509
163,988
121,901
42,087
3,496,553
1,345,018
1,182,462
873,915
95,158
2,905,287
591,266
828,730
60,662
27,989
10,887
11,700
50,576
8,922
6.2
26.2
4
15.5
13.0
7.6
32.5
19.6
25.4
35.8
-4.0
37.4
16.3
38.9
24.3
3.9
8.0
-2.0
-4.6
0.2
11.0
203,312 23.0 263,970 -5.3 2,534,183 2,518,915
22,217 165.6 62,488 -5.6 443,683 359,322
119,725 33.6 179,835 -11.0 1,734,889 1,791,041
105,804 40.8 146,623 1.6 1,242,977 1,087,196
10,731 47.2 14,460
9.3
112,643 97,444
8,782
41.2 10,641 16.5
83,414
74,652
1,949
74.4
3,819 -11.0 29,229
22,792
184,901 31.3 251,965 -3.6 2562,868 2,249,088
58,189 54.7 93,202 -3.4 1,003,938 862,146
55,536 36.8 78,397 -3.1 847,212 646,857
65,783
4.9
71,724 -3.8 643,944 686,266
5,393
44.6
8,642
-9.7
67,774
53,819
154,207 27.6 204,758 -3.9 2,151,465 1,934,916
30,694 49.9 47,207 -2.6 411,403 314,172
57,398
3,946
1,792
792
662
3,246
700
22.0
43.2
67.4
45.2
5.7
49.4
14.3
70,126
4,727
2,501
1,025
536
4,062
665
-0.2
19.5
20.0
12.2
30.6
19.4
20.3
596,483
41,815
21,051
7,462
7,391
35,904
5,911
488,262 22.2
40,525
3.2
18,407 14.4
7,466
-0.1
8,499 -13.0
34,372
4.5
6,153
-3.9
1 January 2018
8

In conversation
1. BERGER PAINTS: Optimistic about volume growth in FY19;
Abhijit Roy, MD & CEO
Crude impact is limited for paint companies, prices of crude derivatives increase
with a lag.
About 30 percent of raw material costs get impacted by crude prices.
Higher crude prices will not impact company's margin.
Have been seeing a monthly increase in rural demand since July.
Volume growth expected to be in double-digits in the second half.
Optimistic about volume growth in FY19.
2. KARNATAKA BANK: Focusing to get 1% mkt share & growing
balance sheet 2x every 3yrs; Mahabaleshwara MS, MD & CEO
Slippage is a continuous concern for the entire sector.
Business growing as on expected lines.
Have been able to adhere to 15 percent credit growth guidance, so far.
However, pressure on provisions will continue for few more quarters.
Banks are preparing for International Financial Reporting Standards (IFRS),
which will lead to rise in provisions.
A few accounts may see slippages due to consortium-based decision.
Retail growth at 12 percent and mid-corporate growth in the range of 12-14
percent.
Focus is on getting 1 percent market share and growing balance sheet 2 times
every three years.
Optimistic on maintaining net interest margin above 3 percent and will maintain
the agriculture sector's share in the book at current levels.
Bank is not up for sale.
3. PRESTIGE ESTATES: New launches in next few quarters will
help achieve fy18 guidance; Irfan Razack, CMD
Sebi's relaxed investment norms for Real Estate Investment Trusts (REITs) has
enabled companies to set stage for listing REITs.
REITs are the future of commercial real estate.
Prestige Projects was a piece of land which were in process of acquiring and now
have consolidated it.
The land is about 185 acres and this will be a township project where company
will have a combination of affordable housing, mid-income housing, villas,
plotted development as well as retail.
Real Estate Regulatory Authority (RERA) will weed out the marginal players in
the real estate market.
Several new launches in next few quarter will help achieve FY18 guidance.
1 January 2018
9

4. NHAI: Aim to complete 3500 kilometer by FY18; Deepak
Kumar, Chairman
Intent of special relief bill is to accelerate highway programme.
Till December the expenditure is Rs 55,000 crore which is much ahead of last
year. Last year was around Rs 35,000 crore, so Rs 20,000 crore jump and the
funding from the lender institutions have also increased.
Till December more than 50 projects under hybrid annuity model (HAM)
achieved financial closure.
7,000 km road projects have been tendered till December. The target is to
spend Rs 90,000 crore on road sector in FY18.
FY19 expenses will be 1.5 times of FY18
Aim to complete 3,500 km this year; have done 1,600-1,700 km till now.
1 January 2018
10

From the think tank
1. India and the future of life sciences innovation
India is known for many wonderful things. On the international stage, it is
recognized as the fastest-growing economy in the world, and is well-known for its
culture, exquisite cuisine and sense of community and family, among many other
qualities. One thing it is less known for is the discovery and development of new
medicines. I think this will soon change. The Indian pharmaceutical industry is a
world leader in bringing generic drugs to the market in a cost-effective way.
Additionally, many Western pharmaceutical companies have established small-
molecule development and manufacturing in India. More recently, Indian pharma
companies have demonstrated the capability to develop biosimilars for global
healthcare markets. These activities are highly valuable, providing essential and
established medicines at more affordable prices to people around the world.
2. India in aerospace: Vision 2020
Over the last two decades, several areas of the economy have been deemed
sunrise sectors. This billing meant broad recognition of the sector’s potential to
generate vast amounts of jobs and revenue. Policymakers put in place measures
such as tax breaks to encourage these sectors. In the past, information
technology (IT) and biotechnology (BT) were the two most prominent holders of
the sunrise-sector tag. Today, if there is a sector that truly merits that billing, it
is aerospace and defence manufacturing. At upwards of $50 billion, India has
one of the largest defence budgets in the world. By 2018, it is expected to be in
the vicinity of $56 billion. In the commercial aviation sector, India remains one
of the highest traffic growth markets. It is estimated to become the third-largest
aviation market in the world by 2025, and will likely need nearly 1,500 new
commercial aircraft by 2030.
3. A policy wish list for the new year
This has clearly been a disappointing year for GDP growth. In February 2017, the
Economic Survey had projected that growth in gross value added (GVA) in 2017-18
would range between 6.75% and 7.5%. That was when the Central Statistics Office
(CSO) had estimated growth for the previous year at 7.1%, which has since been
revised to 6.6%. We will definitely undershoot the range. The first quarter growth
in 2017-18 was disappointingly low at 5.6%. There was a welcome upturn to 6.1%
in Q2. I expect the recovery to continue, but official estimates overstate it. The
Reserve Bank of India (RBI), for example, was surprisingly over-optimistic, earlier
this month, when it projected 6.7% growth for 2017-18. This implies a massive
acceleration in Q3 and Q4 which is not borne out by available data. My bet is that
growth for 2017-18 (as a whole) will range between 6.2% and 6.4%.
1 January 2018
11

4. Cities need a sustainable transport update
The car has been the signifier of the aspiring Indian for decades. Starting in the
1980s, the democratization of car ownership with the explosion in sales of the
humble Maruti 800 heralded an emergent middle class. Every year, governments
across the country lay down fresh tar on any available city space to welcome the
latest entrants into the coveted league of car owners. Meanwhile, the millions who
don’t own cars—and are sidelined to the narrow footpaths that lead to the distant
bus stop—continue to aspire to own their own car one day. The government is
now beginning to see why this is a problem. Bengaluru is engulfed in a never-
ending traffic jam, Delhi’s pollution is at world-beating levels and Mumbai was
never famous for its fast roads. This decade has made it resoundingly clear that the
present model of urban transport is unsustainable, and the only way out of the
cycle—of rising incomes and more wheels on the road—is an efficient public
transport alternative.
International
5. Japan may be the world's biggest surprise in 2018
Japan had a stellar 2017. But could the world’s third biggest economy be a
source of global chaos in the year ahead? Looking at investment-surprise lists
for 2018, it’s intriguing to see how many have Japan serving up negative shocks.
One of the most closely-watched annual what-could-go-wrong lists comes from
Dutch-based Saxo Bank. Its analysts predict 2018 as the year the Bank of Japan
(BoJ) finally loses control of its monetary policy. “As inflation rises,” they write,
“yields, too, will spike, and the result will be a fantastical plunge in the yen.
Ultimately, Saxo says, the central bank may resort to fresh quantitative easing-
style measures, but not before the yen hits 150 to the US dollar (from 113 now).
1 January 2018
12

Click excel icon
for detailed
valuation guide
CMP
(INR)
TP
(INR)
% Upside
EPS (INR)
Downside FY18E FY19E FY20E
2
12
26
15
-1
8
14
-2
-13
14
1
12
15
1
21
33
-1
28.3
34.2
41.9
4.5
6.2
8.2
155.4 187.9
217.2
19.1
26.0
33.7
457.8 603.0
727.9
82.5
116.9
140.6
814.7 1,062.7 1,334.6
27.6
36.7
48.5
35.8
45.9
57.6
7.9
9.7
11.7
183.1 193.9
213.3
37.8
43.2
47.7
8.9
11.5
14.5
288.1 381.0
447.8
10.0
14.4
18.3
24.6
64.8
68.6
14.9
25.8
34.9
Valuation snapshot
P/E (x)
P/B (x)
ROE (%)
FY19E FY20E FY19E FY20E FY19E FY20E
24.6
19.2
17.7
28.1
33.3
16.7
28.5
36.9
17.2
23.0
19.5
17.4
22.4
25.5
26.3
6.7
29.9
17.4
18.3
18.7
25.8
16.4
22.1
18.4
16.8
21.0
9.1
24.3
22.1
8.3
13.5
19.6
7.1
18.5
11.9
8.6
12.7
11.5
24.2
11.4
33.9
27.6
15.8
18.4
12.7
41.7
30.0
71.9
11.4
16.7
12.1
20.0
14.5
15.3
21.7
27.6
13.9
22.7
27.9
13.7
19.1
17.7
15.7
17.8
21.7
20.7
6.3
22.1
15.2
14.0
15.3
15.0
13.2
17.8
14.4
16.2
16.4
5.8
19.4
16.5
6.3
10.7
15.4
5.4
9.6
5.8
7.4
10.7
8.7
7.4
8.3
23.7
20.2
12.3
15.1
10.4
33.3
25.9
57.4
9.1
13.5
10.3
4.8
5.2
5.1
7.1
6.4
2.9
11.6
9.2
3.4
3.5
6.5
3.1
2.7
7.1
8.2
2.2
12.4
4.0
2.1
2.3
2.2
1.7
4.9
2.4
1.2
4.3
0.7
4.3
3.2
1.1
2.9
2.7
1.0
0.8
0.7
1.1
0.9
1.4
0.5
0.9
4.7
6.2
2.6
3.9
2.1
15.2
6.1
2.6
3.7
3.4
2.2
4.1
4.5
4.5
6.0
5.7
2.5
8.7
7.7
2.9
3.2
5.7
2.8
2.4
6.0
6.7
1.6
9.3
3.3
1.9
2.1
2.0
1.6
4.2
2.2
1.1
3.6
0.7
3.7
2.9
1.0
2.4
2.4
0.9
0.8
0.7
1.0
0.9
1.2
0.5
0.8
3.6
5.2
2.3
3.3
1.8
12.4
5.1
2.2
3.3
2.9
1.9
17.3
20.4
25.0
20.1
15.2
13.0
35.7
20.5
16.8
12.5
33.7
14.5
9.8
20.5
23.4
13.4
26.5
23.0
7.3
11.5
2.6
9.6
18.8
8.8
6.3
16.9
4.0
14.8
12.4
6.7
17.3
13.9
6.4
1.5
3.4
11.6
4.7
7.0
-4.7
7.9
12.5
20.2
13.2
19.6
14.1
32.8
19.3
20.0
27.6
14.9
17.4
18.1
25.2
26.8
23.2
18.1
16.2
35.0
22.8
18.4
13.7
31.1
14.6
11.4
23.0
28.1
28.3
35.6
21.9
10.8
11.8
8.2
10.0
20.4
10.5
6.9
19.0
8.0
16.5
13.7
12.6
19.5
15.4
9.4
4.3
6.1
12.7
7.1
11.4
2.1
10.0
12.3
20.4
15.4
19.6
15.3
32.8
18.6
19.1
30.7
18.9
17.2
Company
Automobiles
Amara Raja
Ashok Ley.
Bajaj Auto
Bharat Forge
Bosch
CEAT
Eicher Mot.
Endurance Tech.
Escorts
Exide Ind
Hero Moto
M&M
Mahindra CIE
Maruti Suzuki
Motherson Sumi
Tata Motors
TVS Motor
Aggregate
Banks - Private
Axis Bank
DCB Bank
Equitas Hold.
Federal Bank
HDFC Bank
ICICI Bank
IDFC Bank
IndusInd
J&K Bank
Kotak Mah. Bk
RBL Bank
South Indian
Yes Bank
Aggregate
Banks - PSU
BOB
BOI
Canara
Indian Bk
PNB
SBI
Union Bk
Aggregate
NBFCs
Aditya Birla Cap
Bajaj Fin.
Capital First
Cholaman.Inv.&Fn
Dewan Hsg.
GRUH Fin.
HDFC
HDFC Stand. Life
Indiabulls Hsg
L&T Fin Holdings
LIC Hsg Fin
Reco
Buy
Buy
Buy
Buy
Neutral
Buy
Buy
Buy
Sell
Buy
Neutral
Buy
Buy
Buy
Buy
Buy
Neutral
841
856
119
134
3,323 4,197
732
844
20,103 19,965
1,951 2,116
30,291 34,653
1,355 1,334
787
688
223
254
3,786 3,819
751
839
258
297
9,731 9,866
379
458
431
575
771
764
Buy
Neutral
Buy
Buy
Buy
Buy
Neutral
Buy
Buy
Buy
Buy
Buy
Buy
562
196
148
109
1,874
314
54
1,650
78
1,009
509
31
315
680
197
209
146
2,150
355
56
2,000
100
1,179
665
36
382
21
1
41
34
15
13
3
21
27
17
31
16
21
18.4
8.5
1.7
5.5
68.7
13.6
2.8
60.9
4.1
32.1
16.4
1.9
17.8
30.8
10.5
5.7
6.6
84.7
17.0
3.2
78.6
8.7
41.6
23.0
3.8
23.3
40.2
12.8
9.9
8.2
105.4
21.8
3.4
100.8
13.6
51.9
30.8
4.9
29.5
Buy
Neutral
Neutral
Buy
Buy
Buy
Neutral
161
170
361
377
172
310
144
201
201
386
438
250
415
175
25
18
7
16
46
34
21
17.9
3.2
16.1
36.7
8.5
14.6
-13.5
22.6
9.2
30.3
44.0
13.5
26.8
6.0
29.7
17.7
62.1
50.8
16.0
35.8
19.5
Buy
Buy
Buy
Buy
Buy
Neutral
Buy
Buy
Buy
Buy
Neutral
184
1,757
693
1,294
583
502
1,710
386
1,195
174
563
231
2,300
925
1,500
690
500
2,000
370
1,550
240
680
25
31
34
16
18
0
17
-4
30
38
21
3.7
45.7
32.8
59.2
37.6
9.9
51.6
4.7
83.6
6.9
41.0
5.4
63.7
43.7
70.4
46.0
12.0
57.1
5.4
105.1
10.4
46.5
7.8
87.0
56.5
85.9
56.0
15.1
66.0
6.7
131.1
12.9
54.5
1 January 2018
13

Click excel icon
for detailed
valuation guide
CMP
(INR)
472
474
1,340
683
2,105
1,480
TP
% Upside
EPS (INR)
(INR) Downside FY18E FY19E
562
19
13.5
18.7
550
16
42.6
42.0
1,750
31
52.5
66.5
750
10
36.0
41.9
2,650
26
115.6 145.3
1,500
1
15.5
11.8
Valuation snapshot
P/E (x)
P/B (x)
ROE (%)
FY19E FY20E FY19E FY20E FY19E FY20E
25.3
20.4
3.2
3.0
10.7
12.2
11.3
9.9
2.4
2.1
23.8
19.9
20.1
15.1
3.6
3.2
15.0
16.7
16.3
13.7
3.2
2.7
18.1
17.9
14.5
12.1
2.5
2.2
14.3
15.9
125.7 153.2
2.6
2.3
15.1
17.4
22.2
18.0
3.9
3.3
17.7
18.6
48.8
22.6
30.8
33.3
42.5
40.9
25.8
39.1
39.4
21.8
23.2
39.9
37.9
35.2
16.4
33.4
28.3
32.3
24.8
20.3
38.2
10.0
17.3
18.0
23.1
22.4
18.8
22.5
17.9
15.7
36.1
29.4
22.7
44.8
44.1
39.0
37.5
39.5
40.8
36.0
49.6
26.2
35.3
40.6
52.6
40.3
21.2
23.6
26.3
35.2
31.0
22.8
31.4
31.8
17.7
19.3
35.1
30.2
32.5
14.6
29.3
23.8
25.9
21.3
18.7
28.6
8.7
15.1
14.1
17.5
17.6
11.2
17.0
11.7
11.6
24.0
23.5
18.2
37.2
35.3
32.5
32.1
34.0
36.4
31.8
42.3
23.1
29.3
34.4
43.6
8.0
4.6
1.0
9.7
23.5
1.4
6.2
9.5
9.5
5.3
3.2
5.7
8.9
4.9
2.9
5.8
3.4
2.7
3.6
2.6
5.2
1.6
1.1
3.8
3.4
4.3
3.2
5.3
2.1
2.5
6.8
4.4
2.9
14.3
17.3
22.3
10.9
14.5
10.0
8.6
45.4
7.0
6.5
15.6
22.7
7.1
4.1
1.0
8.9
19.2
1.3
5.7
8.3
8.4
4.4
3.0
5.2
1.5
4.4
2.5
5.1
3.1
2.5
3.4
2.3
4.6
1.4
1.0
3.2
3.0
3.7
2.7
4.4
1.9
2.1
5.8
3.9
2.6
12.2
14.1
20.9
9.7
12.5
8.8
7.7
42.0
6.4
6.3
14.6
20.4
11.6
17.9
3.3
20.2
51.0
2.1
18.1
21.8
19.5
19.5
12.5
9.1
21.4
12.6
17.5
16.5
11.9
7.0
11.1
7.3
10.3
11.5
3.5
17.5
9.9
16.0
12.3
13.7
6.1
10.8
20.0
11.1
12.9
26.9
34.0
48.8
26.0
31.7
23.8
21.4
75.9
24.4
15.5
33.6
39.0
14.6
18.1
3.3
27.8
49.8
3.3
22.2
22.6
21.2
20.2
13.3
13.1
21.5
13.2
16.4
16.3
12.9
8.0
14.2
12.0
12.7
14.5
6.0
19.2
13.9
17.9
15.6
21.3
11.3
14.6
17.4
14.2
14.2
29.4
35.2
55.2
27.3
34.0
22.9
22.6
88.0
25.6
18.3
37.1
40.9
Company
M&M Fin.
Muthoot Fin
PNB Housing
Repco Home
Shriram City Union
Shriram Trans.
Aggregate
Capital Goods
ABB
Bharat Elec.
BHEL
Blue Star
CG Cons. Elec.
CG Power & Indu.
Cummins
GE T&D
Havells
K E C Intl
L&T
Siemens
Solar Ind
Thermax
Va Tech Wab.
Voltas
Aggregate
Cement
Ambuja Cem.
ACC
Birla Corp.
Dalmia Bharat
Grasim Inds.
India Cem
J K Cements
JK Lakshmi Ce
Ramco Cem
Orient Cem
Prism Cem
Sagar Cements
Sanghi Inds.
Shree Cem
Ultratech
Aggregate
Consumer
Asian Paints
Britannia
Colgate
Dabur
Emami
Godrej Cons.
GSK Cons.
HUL
ITC
Jyothy Lab
Marico
Nestle
Reco
Buy
Neutral
Buy
Buy
Buy
Buy
FY20E
23.1
48.1
88.8
50.0
173.7
9.7
Sell
Buy
Sell
Neutral
Buy
Neutral
Buy
Neutral
Buy
Neutral
Buy
Neutral
Neutral
Neutral
Buy
Neutral
1,400
182
93
813
276
93
903
440
562
384
1,257
1,237
1,189
1,211
612
656
1,230
210
78
685
260
90
1,150
440
620
350
1,440
1,313
1,120
930
745
580
-12
15
-16
-16
-6
-3
27
0
10
-9
15
6
-6
-23
22
-12
20.2
7.1
2.9
16.5
5.2
1.4
25.3
9.4
11.5
14.3
46.8
19.8
26.2
29.9
34.5
17.5
28.7
8.0
3.0
24.4
6.5
2.3
35.0
11.2
14.3
17.6
54.3
31.0
31.3
34.4
37.2
19.6
34.7
8.6
3.9
31.0
7.8
3.0
39.6
14.0
17.7
21.7
65.1
35.3
39.3
37.3
41.9
22.4
Neutral
Neutral
Buy
Buy
Neutral
Neutral
Buy
Buy
Buy
Buy
Buy
Not Rated
Buy
Buy
Buy
271
314
1,758 1,797
1,150 1,435
3,198 3,517
1,164 1,302
183
188
1,113 1,324
441
512
786
853
170
205
112
130
848
-
140
157
18,039 21,852
4,321 4,906
16
2
25
10
12
3
19
16
9
20
16
13
21
14
6.9
52.2
32.2
60.8
81.9
5.8
47.8
12.1
27.1
6.3
2.7
23.4
5.8
486.2
102.2
8.4
70.9
56.7
83.7
116.8
10.5
61.8
19.1
35.1
9.1
5.0
47.4
8.9
499.3
147.1
10.5
82.4
61.6
111.7
133.5
12.1
79.1
25.2
44.7
15.2
6.6
72.2
12.0
751.1
184.0
Neutral
Buy
Buy
Buy
Buy
Neutral
Neutral
Buy
Neutral
Neutral
Neutral
Neutral
1,158
4,716
1,096
349
1,312
999
6,557
1,368
263
385
322
7,845
1,280
6,100
1,355
410
1,435
1,015
5,400
1,500
280
365
340
7,750
11
29
24
18
9
2
-18
10
6
-5
6
-1
21.6
84.5
23.4
7.7
26.6
21.2
160.8
22.8
9.1
9.2
6.5
128.4
25.8
106.9
28.1
9.3
33.2
24.5
182.3
27.6
10.0
10.9
7.9
149.0
31.1
133.8
33.7
10.9
38.6
27.4
206.5
32.4
11.4
13.1
9.4
180.1
1 January 2018
14

Click excel icon
for detailed
valuation guide
CMP
TP
% Upside
EPS (INR)
(INR)
(INR) Downside FY18E FY19E
25,463 25,580
0
296.6 413.1
297
275
-7
8.9
12.4
903
975
8
17.2
20.8
9,381 9,267
-1
151.5 176.7
225
-
3.5
6.4
1,082 1,320
22
14.7
18.0
3,671 2,970
-19
34.9
53.7
Valuation snapshot
P/E (x)
P/B (x)
ROE (%)
FY19E FY20E FY19E FY20E FY19E FY20E
61.6
46.8
34.2
27.3
39.8
44.4
24.0
17.7
3.4
3.0
10.8
13.3
43.4
37.6
11.5
9.5
24.1
23.9
53.1
44.8
36.7
30.6
64.8
62.9
35.3
23.2
3.1
2.9
4.9
8.5
60.3
48.5
10.7
9.3
15.5
16.5
68.4
49.9
19.1
14.3
18.2
20.9
38.7
33.1
11.4
10.1
29.5
30.5
21.3
24.6
23.2
13.7
53.3
18.3
22.4
25.1
21.0
32.7
13.9
15.3
45.2
22.5
14.3
20.7
30.2
20.6
11.9
25.0
23.1
21.8
34.7
10.3
22.3
29.3
17.5
17.9
20.2
18.8
12.5
28.8
16.4
18.2
21.0
16.8
19.0
11.8
10.6
40.9
18.3
12.2
15.5
26.3
16.3
9.7
20.4
18.0
17.8
15.3
12.1
20.3
25.0
16.3
13.6
20.3
16.9
18.9
21.6
11.9
26.3
23.7
20.1
7.1
7.5
11.1
21.4
24.7
4.6
5.2
6.7
3.4
6.3
5.3
3.5
5.6
3.1
1.3
3.1
2.5
12.4
2.8
3.0
2.7
5.8
4.7
2.4
3.6
4.9
3.3
2.5
1.4
4.3
3.9
2.0
2.6
3.6
2.4
3.1
15.7
3.4
2.4
4.0
2.8
1.4
1.0
2.8
3.6
6.1
3.9
4.4
5.4
2.8
5.8
4.3
3.1
5.0
2.8
1.2
2.6
2.2
14.2
2.6
2.5
2.5
5.3
3.9
2.0
3.3
4.3
2.9
2.3
1.3
3.6
3.5
1.8
2.3
3.4
2.3
2.9
11.0
2.8
2.4
3.6
2.7
1.2
0.9
2.4
3.2
5.2
19.9
17.0
26.4
24.6
7.2
23.4
12.1
16.3
8.2
1.6
19.6
14.2
22.0
9.2
18.4
12.0
17.1
14.7
12.9
9.2
18.3
15.3
1.9
14.1
19.1
13.8
11.7
14.1
11.5
9.2
13.6
12.5
22.8
-6.4
6.3
-1.2
15.0
10.2
17.3
8.6
12.4
19.8
19.4
25.7
22.3
11.0
26.1
13.6
21.2
14.1
3.9
18.4
15.4
31.4
12.0
19.2
12.5
17.6
20.5
18.3
13.7
19.9
16.3
7.0
12.9
17.5
12.5
11.3
15.4
14.1
11.7
15.4
34.9
22.2
0.2
10.1
5.2
15.3
10.6
19.3
12.6
17.0
Company
Page Inds
Parag Milk
Pidilite Ind.
P&G Hygiene
Prabhat Dairy
United Brew
United Spirits
Aggregate
Healthcare
Alembic Phar
Alkem Lab
Ajanta Pharma
Aurobindo
Biocon
Cadila
Cipla
Divis Lab
Dr Reddy’s
Fortis Health
Glenmark
Granules
GSK Pharma
IPCA Labs
Jubilant Life
Lupin
Sanofi India
Shilpa Medicare
Strides Shasun
Sun Pharma
Torrent Pharma
Aggregate
Infrastructure
Ashoka Buildcon
IRB Infra
KNR Constructions
Sadbhav
Engineering
Aggregate
Logistics
Allcargo Logistics
Concor
Gateway
Distriparks
Aggregate
Media
Dish TV
D B Corp
Den Net.
Ent.Network
Hathway Cable
Hind. Media
HT Media
Jagran Prak.
Music Broadcast
PVR
Reco
Buy
Neutral
Buy
Neutral
Not Rated
Buy
Neutral
FY20E
544.5
16.8
24.0
209.4
9.7
22.3
73.6
Neutral
Buy
Buy
Buy
Neutral
Buy
Neutral
Neutral
Neutral
Buy
Neutral
Buy
Neutral
Neutral
Buy
Buy
Buy
Buy
Buy
Buy
Neutral
531
2,202
1,487
688
537
434
607
1,098
2,414
160
595
137
2,481
598
788
885
4,714
617
823
571
1,417
540
2,500
1,792
900
485
555
600
1,100
2,575
185
650
200
2,500
550
861
1,000
5,000
797
1,214
610
1,400
2
14
21
31
-10
28
-1
0
7
15
9
46
1
-8
9
13
6
29
48
7
-1
21.6
68.0
52.7
44.6
6.1
17.5
21.1
32.4
60.6
1.9
37.9
6.8
44.2
18.6
44.2
37.6
139.0
18.1
41.8
14.4
50.0
24.9
89.5
64.1
50.3
10.1
23.7
27.0
43.7
115.2
4.9
42.8
9.0
54.9
26.5
55.0
42.7
156.2
29.9
69.2
22.9
61.4
29.7
109.1
79.2
55.3
18.6
26.4
33.3
52.4
144.0
8.4
50.5
13.0
60.6
32.6
64.4
57.1
179.0
37.8
85.3
28.0
78.5
Buy
Neutral
Buy
Buy
245
238
324
426
260
240
320
435
6
1
-1
2
1.8
22.9
13.3
14.3
7.1
23.2
14.5
14.5
16.0
19.7
16.0
17.0
Buy
Neutral
Buy
208
1,382
236
215
1,496
282
3
8
19
10.9
42.7
8.8
13.3
55.2
11.6
15.3
68.1
14.0
15.7
25.0
20.3
23.0
Buy
Buy
Neutral
Buy
Buy
Buy
Neutral
Buy
Buy
Buy
82
352
106
754
40
252
102
179
382
1,414
106
430
90
910
47
302
113
225
469
1,640
29
22
-15
21
18
20
11
25
23
16
0.6
21.7
-2.9
11.6
-0.2
25.6
10.4
11.3
8.7
27.1
2.2
25.4
0.1
20.1
0.8
30.2
11.9
13.4
14.1
43.0
3.8
29.6
4.0
31.8
2.0
35.6
13.6
16.2
17.8
57.3
37.2
13.9
1,486.5
37.5
52.6
8.3
8.6
13.4
27.0
32.9
1 January 2018
15

Click excel icon
for detailed
valuation guide
CMP
(INR)
125
26
991
582
TP
% Upside
EPS (INR)
(INR) Downside FY18E FY19E FY20E
130
4
3.1
6.1
9.2
27
4
-0.8
0.1
0.6
1,005
1
28.1
35.7
41.8
690
19
14.4
17.3
20.6
Valuation snapshot
P/E (x)
P/B (x)
ROE (%)
FY19E FY20E FY19E FY20E FY19E FY20E
20.4
13.7
5.8
4.5
15.3
24.8
204.7
40.0
4.9
4.8
-14.2
2.4
27.8
23.7
9.0
8.1
26.4
30.7
33.6
28.2
7.1
6.1
19.1
19.6
27.0
21.3
4.8
4.1
17.9
19.4
10.4
9.2
451.1
10.8
14.9
10.9
29.4
9.5
7.4
11.2
10.3
10.0
15.6
25.1
17.2
9.7
9.1
29.6
20.3
11.2
9.2
8.6
15.2
14.8
11.8
64.2
24.8
53.9
45.3
13.8
13.1
20.0
15.3
12.8
15.6
17.4
15.8
12.8
13.7
24.3
17.8
13.4
15.6
12.2
16.4
10.2
9.6
50.3
11.8
14.6
10.4
12.1
8.6
7.1
9.7
9.7
9.3
14.8
20.4
14.9
9.1
8.5
25.9
20.1
10.4
8.8
8.9
12.5
13.3
11.1
48.7
19.4
43.1
35.8
12.6
12.6
17.7
13.7
10.6
14.2
14.0
14.4
11.5
11.8
20.2
17.0
11.7
14.2
11.0
15.2
1.9
4.5
0.7
2.4
1.6
1.8
1.1
3.3
1.9
2.0
1.7
2.8
2.0
6.1
2.5
2.7
1.6
6.8
5.2
2.0
1.0
1.1
3.9
1.8
1.6
13.6
4.7
14.5
9.5
2.8
3.6
5.2
3.7
2.0
5.6
3.9
2.9
2.2
2.8
8.8
6.5
2.6
2.8
2.4
3.8
1.6
3.5
0.7
2.0
1.5
1.7
1.1
2.5
1.7
1.7
1.5
2.4
1.9
5.1
2.3
2.3
1.4
5.7
4.7
1.8
0.9
1.0
3.3
1.6
1.4
13.4
4.1
13.1
8.5
2.5
3.2
4.3
3.3
1.7
4.4
3.5
2.6
2.0
2.7
7.1
5.6
2.3
2.4
2.1
3.4
13.6
32.3
-4.7
19.8
8.6
17.8
-5.0
25.2
15.1
17.1
16.2
25.2
12.0
17.8
14.4
25.1
15.8
22.0
27.3
15.1
8.0
10.8
25.2
12.1
13.4
16.5
16.5
23.4
20.9
17.4
25.9
26.4
21.8
14.1
35.6
17.3
14.6
15.1
17.9
33.6
30.6
18.9
17.0
15.3
23.2
16.5
42.5
0.1
20.2
10.1
15.9
3.7
29.7
23.8
16.6
15.2
25.8
12.6
22.1
14.0
25.0
16.6
21.0
24.4
16.7
10.4
12.4
23.7
12.0
13.0
20.9
17.5
25.5
23.8
18.3
25.6
23.4
22.5
14.5
31.8
21.2
17.3
16.4
20.8
32.4
33.5
18.2
16.7
18.4
22.5
Company
Prime Focus
Siti Net.
Sun TV
Zee Ent.
Aggregate
Metals
Hindalco
Hind. Zinc
JSPL
JSW Steel
Nalco
NMDC
SAIL
Rain Industries
Vedanta
Tata Steel
Aggregate
Oil & Gas
BPCL
GAIL
Gujarat Gas
Gujarat St. Pet.
HPCL
IOC
IGL
Mahanagar Gas
MRPL
Oil India
ONGC
PLNG
Reliance Ind.
Aggregate
Retail
Jubilant Food
PC Jeweller
Titan Co.
Aggregate
Technology
Cyient
HCL Tech.
Hexaware
Infosys
KPIT Tech
L&T Infotech
Mindtree
Mphasis
NIIT Tech
Persistent Sys
Tata Elxsi
TCS
Tech Mah
Wipro
Zensar Tech
Aggregate
Telecom
Reco
Buy
Neutral
Buy
Buy
Buy
Neutral
Buy
Buy
Neutral
Buy
Sell
Buy
Buy
Neutral
274
309
205
270
86
138
92
371
330
732
326
322
209
297
87
187
43
492
394
672
19
4
2
10
1
36
-53
33
19
-8
18.8
22.7
-15.1
20.3
4.7
13.2
-4.3
25.5
25.5
59.4
26.4
33.5
0.5
24.9
5.8
12.7
3.1
38.9
44.4
65.2
26.9
32.1
4.1
22.9
5.9
13.2
7.6
43.0
46.3
75.8
Buy
Sell
Buy
Neutral
Buy
Buy
Buy
Neutral
Sell
Buy
Buy
Buy
Buy
519
497
844
227
416
388
335
1,094
129
372
195
255
921
643
378
1,011
184
579
541
404
1,219
110
418
227
312
1,077
24
-24
20
-19
39
39
21
11
-14
12
17
23
17
43.1
28.1
22.9
12.1
36.4
36.2
10.0
54.4
9.2
29.8
19.1
15.0
56.7
52.1
31.9
33.6
13.2
42.8
42.6
11.3
53.8
11.5
40.5
22.7
16.7
62.1
55.6
33.6
41.3
15.2
45.6
45.6
12.9
54.5
12.3
42.4
21.9
20.3
69.1
Sell
Buy
Buy
1,762
457
856
1,270
490
850
-28
7
-1
21.4
15.1
12.5
27.4
18.4
15.9
36.2
23.5
19.9
Buy
Neutral
Neutral
Buy
Neutral
Buy
Buy
Neutral
Neutral
Buy
Buy
Neutral
Buy
Neutral
Buy
579
891
340
1,039
180
1,117
610
729
646
719
977
2,700
504
313
889
600
970
270
1,100
160
1,200
600
670
600
780
1,004
2,450
560
280
1,020
4
9
-21
6
-11
7
-2
-8
-7
9
3
-9
11
-11
15
36.0
63.2
16.3
63.8
11.9
62.4
28.5
42.0
43.7
43.3
33.8
131.8
35.8
19.1
52.8
41.9
68.2
17.0
67.8
14.1
71.8
35.1
46.0
50.3
52.4
40.2
151.4
37.7
20.1
72.7
45.9
70.6
19.2
75.7
17.1
78.9
43.5
50.6
56.1
60.8
48.4
158.4
43.1
22.1
80.9
1 January 2018
16

Click excel icon
for detailed
valuation guide
CMP
(INR)
529
378
108
681
TP
(INR)
680
440
110
780
% Upside
EPS (INR)
Downside FY18E FY19E
28
3.8
6.5
17
16.8
19.2
2
-16.1
-18.0
14
5.4
18.2
Valuation snapshot
P/E (x)
P/B (x)
ROE (%)
FY19E FY20E FY19E FY20E FY19E FY20E
81.9
55.6
3.1
3.0
2.2
3.7
19.7
17.9
4.5
4.4
20.2
22.8
NM
NM
2.1
3.1
-26.6 -41.4
37.4
20.8
13.2
9.8
10.1
30.0
2,101.8 96.9
3.4
3.4
0.2
3.5
12.7
10.3
28.2
10.5
11.3
9.8
12.5
11.4
27.3
67.6
38.8
19.7
29.0
19.9
38.2
25.2
15.9
11.6
52.7
13.4
28.4
23.3
19.9
15.7
13.2
35.3
27.1
19.1
18.9
30.9
37.9
8.6
43.6
40.9
10.7
9.5
25.4
8.9
10.0
9.4
12.0
10.1
19.4
49.0
33.3
16.7
28.0
19.0
29.8
19.8
11.0
10.0
45.3
11.4
21.4
19.5
16.8
13.3
11.3
26.0
24.0
15.2
14.9
25.3
28.2
7.1
37.8
36.4
6.4
1.2
1.4
1.2
1.4
1.8
2.0
1.8
3.1
16.9
6.5
1.9
29.2
5.0
5.2
8.9
7.0
2.4
7.6
3.9
4.0
3.5
7.4
4.8
2.5
6.3
6.8
3.1
3.3
4.9
9.1
1.5
9.5
13.2
6.1
1.1
1.4
1.1
1.3
1.6
1.7
1.7
2.9
14.4
5.7
1.6
26.6
4.3
4.7
7.2
6.7
1.9
6.9
3.4
3.6
3.2
6.4
4.1
2.2
5.4
5.7
2.8
2.9
4.4
7.4
1.3
8.5
10.6
42.4
10.7
6.3
8.4
11.0
17.0
16.0
16.1
7.4
18.2
14.6
9.3
100.3
22.5
12.1
32.1
46.8
17.0
13.7
23.3
8.4
10.0
32.5
26.3
13.9
24.2
23.0
11.7
13.2
11.3
17.7
14.5
18.0
26.9
47.7
11.1
5.0
10.8
11.9
17.4
14.6
16.8
10.9
22.9
15.7
8.0
96.1
23.4
12.9
31.5
43.0
18.5
13.7
27.4
13.5
14.4
34.5
27.9
17.8
16.4
22.9
15.3
16.3
15.1
21.5
16.1
20.7
28.8
Company
Reco
Bharti Airtel
Buy
Bharti Infratel
Neutral
Idea Cellular
Buy
Tata Comm
Buy
Aggregate
Utiltites
Coal India
Buy
CESC
Buy
JSW Energy
Sell
NHPC
Buy
NTPC
Buy
Power Grid
Buy
Tata Power
Sell
Aggregate
Others
Arvind
Neutral
Avenue Supermarts Sell
Bata India
Sell
BSE
Neutral
Castrol India
Buy
Coromandel Intl
Buy
Delta Corp
Buy
Eveready Inds.
Buy
Interglobe
Neutral
Indo Count
Neutral
Info Edge
Buy
Kaveri Seed
Buy
Manpasand
Buy
MCX
Buy
Monsanto
Buy
Navneet Education Buy
Oberoi Realty
Buy
Quess Corp
Buy
PI Inds.
Buy
Piramal Enterp.
Buy
SRF
Buy
S H Kelkar
Buy
Team Lease Serv. Buy
Trident
Buy
TTK Prestige
Neutral
V-Guard
Neutral
FY20E
9.5
21.1
-14.3
32.8
263
1,048
92
33
177
200
94
335
1,360
49
37
211
261
72
27
30
-47
13
19
30
-23
17.5
89.1
4.0
2.4
13.4
17.4
7.3
20.7
102.1
3.3
3.1
15.7
20.4
7.5
24.6
110.7
3.6
3.7
17.8
21.3
7.8
450
1,180
747
909
193
576
308
439
1,201
124
1,381
549
437
913
2,519
164
480
1,157
966
2,864
1,984
300
2,433
90
7,673
243
425
873
578
1,100
234
523
257
400
1,291
128
1,300
738
492
1,300
3,293
209
580
1,170
890
3,266
1,992
301
2,500
114
5,281
167
-6
-26
-23
21
21
-9
-16
-9
8
3
-6
34
13
42
31
27
21
1
-8
14
0
0
3
27
-31
-31
10.5
12.0
15.9
45.3
6.3
24.1
5.7
14.3
63.2
8.0
23.6
34.1
9.9
26.5
105.0
8.4
24.8
31.1
29.9
104.6
76.7
6.6
43.2
8.3
137.8
4.5
16.5
17.5
19.3
46.1
6.7
29.0
8.0
17.4
75.4
10.7
26.2
41.0
15.4
39.2
126.6
10.4
36.2
32.7
35.6
149.7
104.9
9.7
64.2
10.4
176.1
6.0
23.2
24.1
22.4
54.5
6.9
30.3
10.3
22.1
109.1
12.4
30.5
48.1
20.5
46.8
149.9
12.3
42.3
44.5
40.3
188.7
132.7
11.8
86.3
12.6
203.2
6.7
1 January 2018
17

MOSL Universe stock performance
Company
Automobiles
Amara Raja
Ashok Ley.
Bajaj Auto
Bharat Forge
Bosch
CEAT
Eicher Mot.
Endurance Tech.
Escorts
Exide Ind
Hero Moto
M&M
Mahindra CIE
Maruti Suzuki
Motherson Sumi
Tata Motors
TVS Motor
Banks - Private
Axis Bank
DCB Bank
Equitas Hold.
Federal Bank
HDFC Bank
ICICI Bank
IDFC Bank
IndusInd
J&K Bank
Kotak Mah. Bk
RBL Bank
South Indian
Yes Bank
Banks - PSU
BOB
BOI
Canara
Indian Bk
PNB
SBI
Union Bk
NBFCs
Aditya Birla Cap
Bajaj Fin.
Capital First
Cholaman.Inv.&Fn
Dewan Hsg.
GRUH Fin.
HDFC
HDFC Stand. Life
Indiabulls Hsg
L&T Fin.Holdings
LIC Hsg Fin
M&M Fin.
Muthoot Fin
PNB Housing
1 Day (%)
-0.7
1.3
0.7
0.2
0.2
0.2
1.1
-1.0
1.9
1.9
2.0
0.1
-0.5
1.0
1.9
3.1
1.1
2.7
0.9
-0.3
-0.3
-0.1
-0.1
-0.1
0.0
-0.8
0.4
0.3
0.3
0.5
-1.4
-0.2
0.0
-1.0
0.5
0.4
-1.1
-0.3
0.1
0.2
0.7
-0.7
-0.2
0.9
2.0
-0.3
0.3
0.3
0.8
-0.1
2.1
1M (%)
4.4
-1.4
0.2
4.6
0.2
7.4
0.2
13.7
11.8
7.8
3.5
4.8
2.6
12.3
4.2
4.1
4.8
2.4
5.9
0.4
-3.1
0.2
-0.3
-3.1
-1.3
4.0
-1.8
-2.3
-5.5
0.9
-6.3
-13.9
-4.5
-6.7
-5.5
-5.9
-11.8
-7.2
0.1
-0.8
0.4
-5.7
-0.9
0.4
2.3
-0.8
-0.9
-5.9
5.1
4.3
0.5
12M (%)
-3.9
51.0
25.1
61.4
-2.6
68.7
41.0
138.6
169.8
24.6
24.9
27.9
41.0
83.2
73.9
-8.4
112.3
26.6
81.1
3.8
63.9
55.9
37.5
-8.9
49.4
30.3
41.5
53.6
76.8
37.1
6.2
60.9
41.8
72.7
51.4
25.0
17.6
Company
Repco Home
Shriram City Union
Shriram Trans.
Capital Goods
ABB
Bharat Elec.
BHEL
Blue Star
CG Cons. Elec.
CG Power & Inds Sol.
Cummins
GE T&D
Havells
K E C Intl
L&T
Siemens
Solar Ind
Thermax
Va Tech Wab.
Voltas
Cement
Ambuja Cem.
ACC
Birla Corp.
Dalmia Bharat
Grasim Inds.
India Cem
J K Cements
JK Lakshmi Ce
Ramco Cem
Orient Cem
Prism Cem
Sagar Cements
Sanghi Inds.
Shree Cem
Ultratech
Consumer
Asian Paints
Britannia
Colgate
Dabur
Emami
Godrej Cons.
GSK Cons.
HUL
ITC
Jyothy Lab
Marico
Nestle
Page Inds
Parag Milk
Pidilite Ind.
P&G Hygiene
Prabhat Dairy
United Brew
1 Day (%)
0.4
4.1
1.6
0.8
0.5
0.4
-0.1
3.1
0.3
-1.1
2.1
2.3
4.1
0.3
-0.2
0.3
1.5
-1.4
0.1
0.1
0.7
2.0
-0.7
3.1
1.5
0.8
2.2
-1.1
1.6
-1.2
0.6
-1.3
0.5
1.0
1.2
0.9
1.2
0.7
0.4
1.8
-0.5
0.8
0.7
1.2
1.6
1.6
1.1
2.6
0.0
-0.3
5.7
0.5
1M (%)
8.3
3.2
10.5
-0.5
-3.7
-1.1
12.7
4.6
5.6
4.4
0.8
7.7
19.3
3.3
3.2
1.9
8.1
2.2
2.0
3.2
4.7
6.3
1.5
-1.3
3.5
12.1
8.2
10.6
4.2
-3.2
-1.5
16.3
6.0
0.9
0.1
-2.0
4.7
2.7
0.1
2.3
7.9
7.1
1.9
-0.3
3.7
4.6
12.7
24.9
6.3
0.6
41.2
-2.5
12M (%)
24.0
17.8
78.0
35.6
46.8
16.7
74.6
88.9
59.1
11.4
48.2
71.4
175.0
40.6
14.3
77.2
61.1
30.9
99.5
33.0
34.3
85.9
138.3
65.5
62.1
63.8
25.4
46.1
36.6
44.1
35.7
178.7
30.7
34.4
31.4
63.8
22.7
27.0
35.1
34.5
30.8
67.4
11.7
17.2
28.4
31.5
85.4
15.2
53.2
32.2
129.4
37.7
111.0
26.1
31.8
137.9
56.2
36.2
86.4
105.3
1.3
73.0
69.1
61.6
1 January 2018
18

MOSL Universe stock performance
Company
United Spirits
Healthcare
Alembic Phar
Alkem Lab
Ajanta Pharma
Aurobindo
Biocon
Cadila
Cipla
Divis Lab
Dr Reddy’s
Fortis Health
Glenmark
Granules
GSK Pharma
IPCA Labs
Jubilant Life
Lupin
Sanofi India
Shilpa Medicare
Strides Shasun
Sun Pharma
Torrent Pharma
Infrastructure
Ashoka Buildcon
IRB Infra.Devl.
KNR Construct.
Sadbhav Engg.
Logistics
Allcargo Logistics
Concor
Gateway Distriparks
Media
Dish TV
D B Corp
Den Net.
Ent.Network
Hathway Cab.
Hind. Media
HT Media
Jagran Prak.
Music Broadcast
PVR
Prime Focus
Siti Net.
Sun TV
Zee Ent.
Metals
Hindalco
Hind. Zinc
JSPL
JSW Steel
Nalco
NMDC
Rain Industries
1 Day (%)
1.0
-2.1
0.7
0.5
0.5
-0.5
2.0
0.3
-1.4
-0.7
-1.0
0.4
0.1
2.0
-1.2
2.8
0.4
-0.7
1.6
-0.8
0.5
1.9
0.4
2.0
-0.4
1.5
0.0
0.4
-2.7
0.6
-0.9
1.8
-1.3
0.4
0.2
3.9
1.0
-0.9
0.4
0.3
1.4
-1.0
-0.8
-0.6
-0.6
1.4
-0.6
-0.6
-0.2
2.5
1M (%)
9.0
3.6
12.5
7.4
-2.9
25.6
-1.4
-0.2
4.9
6.1
15.7
4.2
4.5
1.1
11.3
23.2
6.0
6.9
-4.4
0.3
4.2
10.6
-3.2
1.8
17.2
12.8
17.4
3.8
-6.3
-1.4
-3.2
13.6
-1.6
-6.5
1.2
2.0
9.8
1.8
7.8
21.6
2.2
12.3
1.1
10.9
1.8
19.2
5.6
7.0
8.2
9.1
12M (%)
91.7
-11.7
35.4
-15.7
6.2
70.9
23.5
7.6
39.0
-21.3
-12.2
-33.0
27.9
-8.8
12.6
25.3
-39.7
9.5
-10.9
-22.5
-7.0
10.3
53.7
22.8
89.8
56.1
18.6
55.3
-0.9
-1.6
-1.9
60.9
-8.8
16.5
-3.7
41.3
3.4
25.9
92.0
-31.1
102.9
30.2
76.8
20.5
194.9
68.7
36.1
11.8
597.4
Company
SAIL
Vedanta
Tata Steel
Oil & Gas
BPCL
GAIL
Gujarat Gas
Gujarat St. Pet.
HPCL
IOC
IGL
Mahanagar Gas
MRPL
Oil India
ONGC
PLNG
Reliance Ind.
Retail
Jubilant Food
PC Jeweller
Titan Co.
Technology
Cyient
HCL Tech.
Hexaware
Infosys
KPIT Tech
L&T Infotech
Mindtree
Mphasis
NIIT Tech
Persistent Sys
Tata Elxsi
TCS
Tech Mah
Wipro
Zensar Tech
Telecom
Bharti Airtel
Bharti Infratel
Idea Cellular
Tata Comm
Utiltites
Coal India
CESC
JSW Energy
NHPC Ltd
NTPC
Power Grid
Tata Power
Others
Arvind
Avenue Super.
Bata India
BSE
1 Day (%)
-0.6
-0.8
-0.3
-1.2
-2.6
0.6
0.6
-1.2
-1.0
1.9
0.3
-0.3
-0.6
0.9
1.5
-0.4
2.9
-0.1
0.4
-0.4
1.4
0.6
0.5
4.0
1.9
-0.6
1.1
-0.5
3.1
3.4
2.7
1.1
1.9
1.8
-0.3
2.6
5.9
0.2
0.0
0.2
3.5
2.5
0.8
0.7
1.7
0.4
3.0
0.5
-1.7
1M (%)
17.7
10.5
3.3
1.9
7.7
-2.7
10.1
-0.1
-1.4
2.9
-2.0
2.6
0.9
6.9
0.4
-2.6
-1.7
14.2
4.5
3.8
4.4
1.1
5.7
4.9
10.0
10.9
0.6
2.0
10.6
2.1
1.6
1.5
5.2
2.9
6.8
-1.6
15.7
-1.1
-4.9
2.3
13.2
16.8
-2.6
-4.0
-1.1
1.3
5.1
0.3
-2.3
12M (%)
87.1
52.2
86.6
21.6
56.0
62.6
64.7
45.5
20.7
86.7
40.1
31.0
11.7
1.6
39.3
73.0
112.3
131.7
166.5
17.7
8.7
65.3
4.5
35.2
64.6
16.7
29.8
53.0
15.3
41.6
14.9
4.5
32.7
-5.4
74.7
10.5
48.6
10.5
-11.8
64.5
54.1
22.7
8.4
11.6
25.2
34.7
66.6
1 January 2018
19

MOSL Universe stock performance
Company
Others
Castrol India
Coromandel Intl
Delta Corp
Eveready Inds.
Interglobe
Indo Count
Info Edge
Kaveri Seed
Manpasand
MCX
Monsanto
Navneet Educat.
Oberoi Realty
PI Inds.
Piramal Enterp.
Quess Corp
SRF
S H Kelkar
Team Lease Serv.
Trident
V-Guard
1 Day (%)
0.0
2.4
1.0
-0.7
-0.6
-0.9
5.7
0.1
-0.5
-2.7
2.6
1.2
1.8
1.0
0.7
2.1
2.1
2.3
-1.3
0.8
2.5
1M (%)
-4.0
13.5
15.1
1.4
4.0
2.5
9.3
-0.1
10.6
-6.6
1.5
-4.0
-2.4
3.9
2.1
23.4
6.8
15.7
9.8
-1.2
3.6
12M (%)
2.3
101.3
177.7
104.8
46.8
-23.7
51.6
34.6
66.4
-27.7
12.3
50.2
63.3
18.8
80.1
78.8
30.0
-1.2
173.6
59.3
114.8
1 January 2018
20

THEMATIC/STRATEGY RESEARCH GALLERY

REPORT GALLERY
RECENT INITIATING COVERAGE REPORTS
Rs

DIFFERENTIATED PRODUCT GALLERY

Disclosures:
The following Disclosures are being made in compliance with the SEBI Research Analyst Regulations 2014 (herein after referred to as the Regulations).
Motilal Oswal Securities Ltd. (MOSL) is a SEBI Registered Research Analyst having registration no. INH000000412. MOSL, the Research Entity (RE) as defined in the Regulations, is engaged in the business of providing Stock
broking services, Investment Advisory Services, Depository participant services & distribution of various financial products. MOSL is a subsidiary company of Motilal Oswal Financial Service Ltd. (MOFSL). MOFSL is a listed
public company, the details in respect of which are available on
www.motilaloswal.com.
MOSL is registered with the Securities & Exchange Board of India (SEBI) and is a registered Trading Member with National Stock
Exchange of India Ltd. (NSE) and Bombay Stock Exchange Limited (BSE), Metropolitan Stock Exchange Of India Ltd. (MSE) for its stock broking activities & is Depository participant with Central Depository Services Limited
(CDSL) & National Securities Depository Limited (NSDL) and is member of Association of Mutual Funds of India (AMFI) for distribution of financial products. Details of associate entities of Motilal Oswal Securities Limited are
available on the website at
http://onlinereports.motilaloswal.com/Dormant/documents/Associate%20Details.pdf
Pending Regulatory Enquiries against Motilal Oswal Securities Limited by SEBI:
SEBI pursuant to a complaint from client Shri C.R. Mohanraj alleging unauthorized trading, issued a letter dated 29th April 2014 to MOSL notifying appointment of an Adjudicating Officer as per SEBI regulations to hold
inquiry and adjudge violation of SEBI Regulations; MOSL requested SEBI to provide all documents, records, investigation report relied upon by SEBI which were referred in Show Cause Notice and also sought personal
hearing. The matter is currently pending.
MOSL, it’s associates, Research Analyst or their relative may have any financial interest in the subject company. MOSL and/or its associates and/or Research Analyst may have beneficial ownership of 1% or more securities in
the subject company at the end of the month immediately preceding the date of publication of the Research Report.
MOSL and its associate company(ies), their directors and Research Analyst and their relatives may; (a) from
time to time, have a long or short position in, act as principal in, and buy or sell the securities or derivatives thereof of companies mentioned herein. (b) be engaged in any other transaction involving such securities and earn
brokerage or other compensation or act as a market maker in the financial instruments of the company(ies) discussed herein or act as an advisor or lender/borrower to such company(ies) or may have any other potential
conflict of interests with respect to any recommendation and other related information and opinions.; however the same shall have no bearing whatsoever on the specific recommendations made by the analyst(s), as the
recommendations made by the analyst(s) are completely independent of the views of the associates of MOSL even though there might exist an inherent conflict of interest in some of the stocks mentioned in the research
report.
Research Analyst may have served as director/officer, etc. in the subject company in the last 12 month period. MOSL and/or its associates may have received any compensation from the subject company in the past
12 months.
In the last 12 months period ending on the last day of the month immediately preceding the date of publication of this research report, MOSL or any of its associates may have:
managed or co-managed public offering of securities from subject company of this research report,
received compensation for investment banking or merchant banking or brokerage services from subject company of this research report,
received compensation for products or services other than investment banking or merchant banking or brokerage services from the subject company of this research report.
Subject Company may have been a client of MOSL or its associates during twelve months preceding the date of distribution of the research report.
MOSL and it’s associates have not received any compensation or other benefits from the subject company or third party in connection with the research report. To enhance transparency, MOSL has incorporated a Disclosure
of Interest Statement in this document. This should, however, not be treated as endorsement of the views expressed in the report. MOSL and / or its affiliates do and seek to do business including investment banking with
companies covered in its research reports. As a result, the recipients of this report should be aware that MOSL may have a potential conflict of interest that may affect the objectivity of this report. Compensation of Research
Analysts is not based on any specific merchant banking, investment banking or brokerage service transactions.
Terms & Conditions:
This report has been prepared by MOSL and is meant for sole use by the recipient and not for circulation. The report and information contained herein is strictly confidential and may not be altered in any way, transmitted to,
copied or distributed, in part or in whole, to any other person or to the media or reproduced in any form, without prior written consent of MOSL. The report is based on the facts, figures and information that are considered
true, correct, reliable and accurate. The intent of this report is not recommendatory in nature. The information is obtained from publicly available media or other sources believed to be reliable. Such information has not
been independently verified and no guaranty, representation of warranty, express or implied, is made as to its accuracy, completeness or correctness. All such information and opinions are subject to change without notice.
The report is prepared solely for informational purpose and does not constitute an offer document or solicitation of offer to buy or sell or subscribe for securities or other financial instruments for the clients. Though
disseminated to all the customers simultaneously, not all customers may receive this report at the same time. MOSL will not treat recipients as customers by virtue of their receiving this report.
Analyst Certification
The views expressed in this research report accurately reflect the personal views of the analyst(s) about the subject securities or issues, and no part of the compensation of the research analyst(s) was, is, or will be directly or
indirectly related to the specific recommendations and views expressed by research analyst(s) in this report.
Disclosure of Interest Statement
Analyst ownership of the stock
Companies where there is interest
No
A graph of daily closing prices of securities is available at
www.nseindia.com, www.bseindia.com.
Research Analyst views on Subject Company may vary based on Fundamental research and Technical Research. Proprietary
trading desk of MOSL or its associates maintains arm’s length distance with Research Team as all the activities are segregated from MOSL research activity and therefore it can have an independent view with regards to
subject company for which Research Team have expressed their views.
Regional Disclosures (outside India)
This report is not directed or intended for distribution to or use by any person or entity resident in a state, country or any jurisdiction, where such distribution, publication, availability or use would be contrary to law,
regulation or which would subject MOSL & its group companies to registration or licensing requirements within such jurisdictions.
For Hong Kong:
This report is distributed in Hong Kong by Motilal Oswal capital Markets (Hong Kong) Private Limited, a licensed corporation (CE AYY-301) licensed and regulated by the Hong Kong Securities and Futures Commission (SFC)
pursuant to the Securities and Futures Ordinance (Chapter 571 of the Laws of Hong Kong) “SFO”. As per SEBI (Research Analyst Regulations) 2014 Motilal Oswal Securities (SEBI Reg No. INH000000412) has an agreement with
Motilal Oswal capital Markets (Hong Kong) Private Limited for distribution of research report in Hong Kong. This report is intended for distribution only to “Professional Investors” as defined in Part I of Schedule 1 to SFO. Any
investment or investment activity to which this document relates is only available to professional investor and will be engaged only with professional investors.” Nothing here is an offer or solicitation of these securities,
products and services in any jurisdiction where their offer or sale is not qualified or exempt from registration. The Indian Analyst(s) who compile this report is/are not located in Hong Kong & are not conducting Research
Analysis in Hong Kong.
For U.S.
Motilal Oswal Securities Limited (MOSL) is not a registered broker - dealer under the U.S. Securities Exchange Act of 1934, as amended (the"1934 act") and under applicable state laws in the United States. In addition MOSL is
not a registered investment adviser under the U.S. Investment Advisers Act of 1940, as amended (the "Advisers Act" and together with the 1934 Act, the "Acts), and under applicable state laws in the United States.
Accordingly, in the absence of specific exemption under the Acts, any brokerage and investment services provided by MOSL, including the products and services described herein are not available to or intended for U.S.
persons. This report is intended for distribution only to "Major Institutional Investors" as defined by Rule 15a-6(b)(4) of the Exchange Act and interpretations thereof by SEC (henceforth referred to as "major institutional
investors"). This document must not be acted on or relied on by persons who are not major institutional investors. Any investment or investment activity to which this document relates is only available to major institutional
investors and will be engaged in only with major institutional investors. In reliance on the exemption from registration provided by Rule 15a-6 of the U.S. Securities Exchange Act of 1934, as amended (the "Exchange Act") and
interpretations thereof by the U.S. Securities and Exchange Commission ("SEC") in order to conduct business with Institutional Investors based in the U.S., MOSL has entered into a chaperoning agreement with a U.S.
registered broker-dealer, Motilal Oswal Securities International Private Limited. ("MOSIPL"). Any business interaction pursuant to this report will have to be executed within the provisions of this chaperoning agreement.
The Research Analysts contributing to the report may not be registered /qualified as research analyst with FINRA. Such research analyst may not be associated persons of the U.S. registered broker-dealer, MOSIPL, and
therefore, may not be subject to NASD rule 2711 and NYSE Rule 472 restrictions on communication with a subject company, public appearances and trading securities held by a research analyst account.
For Singapore
Motilal Oswal Capital Markets Singapore Pte Limited is acting as an exempt financial advisor under section 23(1)(f) of the Financial Advisers Act(FAA) read with regulation 17(1)(d) of the Financial Advisors Regulations and is a
subsidiary of Motilal Oswal Securities Limited in India. This research is distributed in Singapore by Motilal Oswal Capital Markets Singapore Pte Limited and it is only directed in Singapore to accredited investors, as defined in
the Financial Advisers Regulations and the Securities and Futures Act (Chapter 289), as amended from time to time. In respect of any matter arising from or in connection with the research you could contact the following
representatives of Motilal Oswal Capital Markets Singapore Pte Limited:
Disclaimer:
The report and information contained herein is strictly confidential and meant solely for the selected recipient and may not be altered in any way, transmitted to, copied or distributed, in part or in whole, to any other person
or to the media or reproduced in any form, without prior written consent. This report and information herein is solely for informational purpose and may not be used or considered as an offer document or solicitation of
offer to buy or sell or subscribe for securities or other financial instruments. Nothing in this report constitutes investment, legal, accounting and tax advice or a representation that any investment or strategy is suitable or
appropriate to your specific circumstances. The securities discussed and opinions expressed in this report may not be suitable for all investors, who must make their own investment decisions, based on their own investment
objectives, financial positions and needs of specific recipient. This may not be taken in substitution for the exercise of independent judgment by any recipient. Each recipient of this document should make such investigations
as it deems necessary to arrive at an independent evaluation of an investment in the securities of companies referred to in this document (including the merits and risks involved), and should consult its own advisors to
determine the merits and risks of such an investment. The investment discussed or views expressed may not be suitable for all investors. Certain transactions -including those involving futures, options, another derivative
products as well as non-investment grade securities - involve substantial risk and are not suitable for all investors. No representation or warranty, express or implied, is made as to the accuracy, completeness or fairness of
the information and opinions contained in this document. The Disclosures of Interest Statement incorporated in this document is provided solely to enhance the transparency and should not be treated as endorsement of the
views expressed in the report. This information is subject to change without any prior notice. The Company reserves the right to make modifications and alternations to this statement as may be required from time to time
without any prior approval. MOSL, its associates, their directors and the employees may from time to time, effect or have effected an own account transaction in, or deal as principal or agent in or for the securities
mentioned in this document. They may perform or seek to perform investment banking or other services for, or solicit investment banking or other business from, any company referred to in this report. Each of these entities
functions as a separate, distinct and independent of each other. The recipient should take this into account before interpreting the document. This report has been prepared on the basis of information that is already
available in publicly accessible media or developed through analysis of MOSL. The views expressed are those of the analyst, and the Company may or may not subscribe to all the views expressed therein. This document is
being supplied to you solely for your information and may not be reproduced, redistributed or passed on, directly or indirectly, to any other person or published, copied, in whole or in part, for any purpose. This report is not
directed or intended for distribution to, or use by, any person or entity who is a citizen or resident of or located in any locality, state, country or other jurisdiction, where such distribution, publication, availability or use would
be contrary to law, regulation or which would subject MOSL to any registration or licensing requirement within such jurisdiction. The securities described herein may or may not be eligible for sale in all jurisdictions or to
certain category of investors. Persons in whose possession this document may come are required to inform themselves of and to observe such restriction. Neither the Firm, not its directors, employees, agents or
representatives shall be liable for any damages whether direct or indirect, incidental, special or consequential including lost revenue or lost profits that may arise from or in connection with the use of the information.
The
person accessing this information specifically agrees to exempt MOSL or any of its affiliates or employees from, any and all responsibility/liability arising from such misuse and agrees not to hold MOSL or any of its affiliates or
employees responsible for any such misuse and further agrees to hold MOSL or any of its affiliates or employees free and harmless from all losses, costs, damages, expenses that may be suffered by the person accessing this
information due to any errors and delays.
Registered Office Address: Motilal Oswal Tower, Rahimtullah Sayani Road, Opposite Parel ST Depot, Prabhadevi, Mumbai-400025; Tel No.: 022-3980 4263; www.motilaloswal.com. Correspondence Address: Palm Spring
Centre, 2nd Floor, Palm Court Complex, New Link Road, Malad (West), Mumbai- 400 064. Tel No: 022 3080 1000. Compliance Officer: Neeraj Agarwal, Email Id:
na@motilaloswal.com,
Contact No.:022-30801085.
Registration details of group entities.: MOSL: SEBI Registration: INZ000158836; CDSL: IN-DP-16-2015; NSDL: IN-DP-NSDL-152-2000; Research Analyst: INH000000412. AMFI: ARN 17397. Investment Adviser: INA000007100.
Motilal Oswal Asset Management Company Ltd. (MOAMC): PMS (Registration No.: INP000000670) offers PMS and Mutual Funds products. Motilal Oswal Wealth Management Ltd. (MOWML): PMS (Registration No.:
INP000004409) offers wealth management solutions. *Motilal Oswal Securities Ltd. is a distributor of Mutual Funds, PMS, Fixed Deposit, Bond, NCDs, Insurance and IPO products. * Motilal Oswal Commodities Broker Pvt. Ltd.
offers Commodities Products. * Motilal Oswal Real Estate Investment Advisors II Pvt. Ltd. offers Real Estate products. * Motilal Oswal Private Equity Investment Advisors Pvt. Ltd. offers Private Equity products
13 December 2016
22