3 January 2018
Market snapshot
Equities - India
Close
Chg .%
Sensex
33,812
0.0
Nifty-50
10,442
0.1
Nifty-M 100
20,960
-0.7
Equities-Global
Close
Chg .%
S&P 500
2,696
0.8
Nasdaq
7,007
1.5
FTSE 100
7,648
-0.5
DAX
12,871
-0.4
Hang Seng
12,069
3.1
Nikkei 225
22,765
0.0
Commodities
Close
Chg .%
Brent (US$/Bbl)
67
-0.1
Gold ($/OZ)
1,312
0.7
Cu (US$/MT)
7,161
-0.6
Almn (US$/MT)
2,252
-0.2
Currency
Close
Chg .%
USD/INR
63.5
-0.4
USD/EUR
1.2
0.6
USD/JPY
112.8
0.2
YIELD (%)
Close
1MChg
10 Yrs G-Sec
7.4
0.05
10 Yrs AAA Corp
8.0
0.02
Flows (USD b)
2-Jan
MTD
FIIs
0.1
0.1
DIIs
0.0
-0.2
Volumes (INRb)
2-Jan
MTD*
Cash
370
346
F&O
5,251
4,098
Note: YTD is calendar year, *Avg
CY17%
27.0
27.5
47.1
CY17%
19.4
28.2
7.6
12.5
24.6
19.1
CY17%
20.5
12.3
30.5
32.4
CY17%
-6.2
13.8
-3.9
CY17%
0.8
0.4
CY17
7.7
14.0
YTD*
346
4,098
Today’s top research idea
Titan Industries: Healthy jewellery retail growth led by
festive demand
Jewellery division witnessed a good festive season, with retail sales growing in
double-digits. If not for PMLA, then growth would have been even better,
despite a high base. However, suspension of PMLA in early Oct’17 helped boost
sales further over the rest of the festive season.
TTAN mentioned that Jewellery retail growth in 3QFY18 was healthy and met
management’s internal expectations. We, however, note that primary growth
for 3QFY18 was lower due to upstocking by franchisees in 2QFY18 (to the
extent of INR2.5b due to early onset of festive season and as PMLA was
effective last quarter). Market share gain for Jewellery continued in 3QFY18.
Recent aggression to capitalize on opportunities across divisions is heartening.
Earnings CAGR is likely to be a massive 36% over FY17-20. The sheer scale of
top-line opportunity demands premium valuations. We thus maintain Buy with
revised a TP of INR975 (valued at 49x Dec’19E EPS).
Research covered
Cos/Sector
Titan Industries
Sustainability Meter
Bulls & Bears
Automobile
Capital Goods
Key Highlights
Healthy jewellery retail growth led by festive demand
Larsen & Toubro: Green portfolio contribution rising
India Valuations Handbook — A stellar finish to the year
Volumes Nos: 1. BJAUT; 2. HMCL; 3. TTMT; 4. AL; 5. EIM; 6. MM
Capex tracker: New project announcements decline sharply in 3QFY18
Piping hot news
Rupee climbs to fresh 2-1/2 year high on sliding dollar
The rupee shot up to end at a nearly 2-1/2 year high of 63.48, surging by 20
paise against the US dollar as the bullish momentum continued strongly for the
fourth-straight day driven by upbeat hopes on macro front.
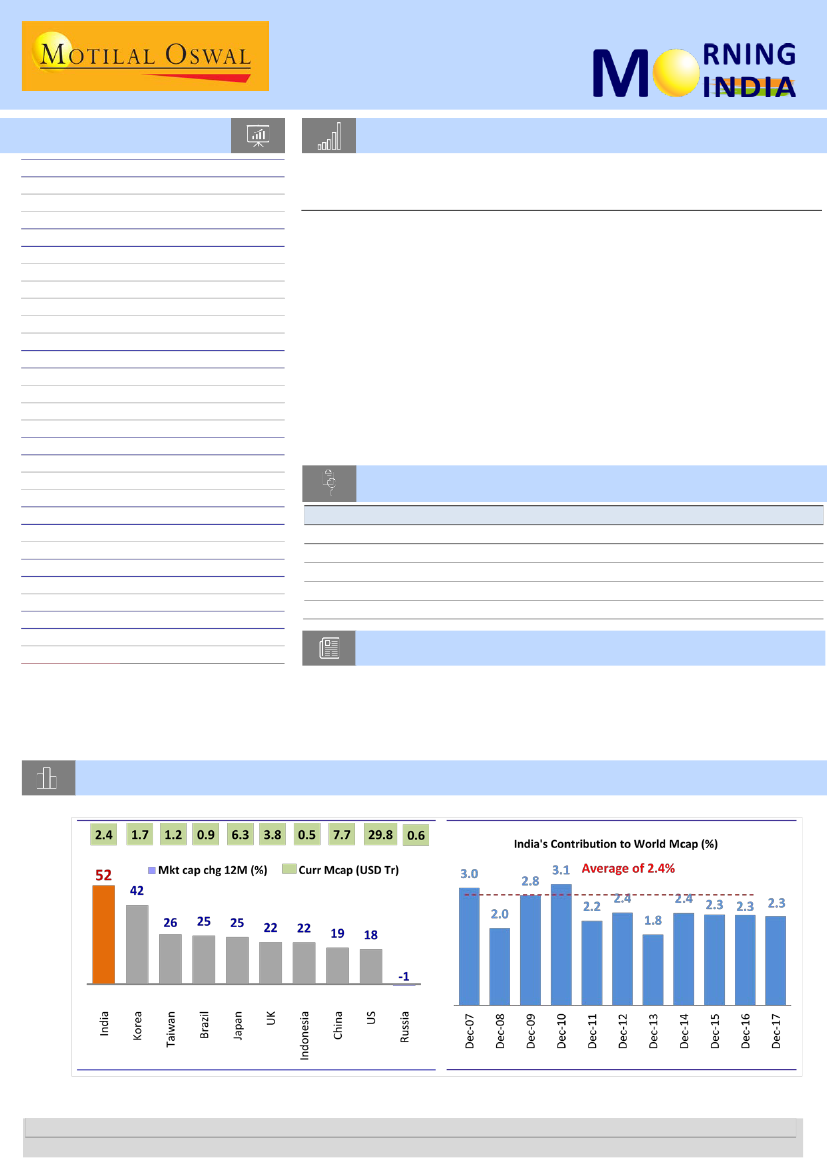
Chart of the Day: India’s share in world market cap marginally below historical average
Over the last 12 months, world market cap has increased 53.5% (USD35.7t), while India’s market cap is up 52%
Research Team (Gautam.Duggad@MotilalOswal.com)
Motilal Oswal research is available on www.motilaloswal.com/Institutional-Equities, Bloomberg, Thomson Reuters, Factset and S&P Capital.
Investors are advised to refer through important disclosures made at the last page of the Research Report.

In the news today
Kindly click on textbox for the detailed news link
1
Trai issues new interconnection
rules, fixes 30-day deadline for
inking pacts
The Telecom Regulatory Authority
of India (Trai) has issued new
guidelines that require telecom
operators to sign an
interconnection agreement on a
non-discriminatory basis within 30
days of receipt of a network …
2
Country's largest bank SBI netted a windfall of Rs 1,771.67 crore, more
than its second quarter profit, from customers for non-maintenance of
monthly average balance in savings accounts in eight months of 2017-18,
finance ministry data showed. State Bank of India has close to 40.5 crore
savings account customers…
SBI earns Rs 1,772 cr in min balance penalty during April-Nov
3
Anti-dumping duty likely on
Chinese chemical imports
India is likely to impose anti-
dumping duty of up to USD 397
per tonne on a Chinese chemical
used in construction and dyes
industry. The move is aimed at
guarding domestic players from
cheap imports of 'Sulphonated
Naphthalene Formaldehyde' from
the neighbouring country…
4
December PMI data signals
revival in manufacturing,
Indian economy
The Nikkei India manufacturing
Purchasing Managers’ Index (PMI),
a bellwether of economic activity,
grew at the fastest rate in five
years in December…
5
The government is considering a
proposal to raise the individual
cap on foreign investment in
power exchanges to 15% from
the current 5%, but only for
serious players having technical
know-how or experience in
running/managing power
bourses overseas, official
sources told FE…
Foreign investment in power
exchanges: Modi govt mulls
higher cap for serious players
6
Production of horticulture crops
like vegetables and fruits is likely
to touch a record 305.4 million
tonnes (mt) in 2017-18, about
1.6% higher than the previous
year and 8% higher than the
previous five years’ average, the
agriculture ministry said in its first
advance estimates released on
Tuesday…
7
Reliance Industries completes
$16 billion expansion plan
Reliance Industries (RIL) on
Tuesday commissioned its refinery
off-gas cracker (ROGC) complex of
1.5 million tonnes per annum
(mtpa) capacity along with
downstream plants and utilities.
This marks the end of the $16
billion refining and petrochemicals
expansion plan that RIL embarked
on in 2014…
Horticulture crop output seen
at record 305.4 mt in 2017-18
3 January 2018
2

Titan Industries
BSE SENSEX
33,812
S&P CNX
10,442
2 January 2018
Update
| Sector:
Retail
CMP: INR845
TP: INR975 (+15%)
Buy
Healthy jewellery retail growth led by festive demand
Titan (TTAN) has released its pre-quarterly update for 3QFY18. Key highlights:
Festive season sales were reportedly healthy, despite a high base. Retail
growth in 3QFY18 was in line with management’s expectations, despite the
advancement of Dussehra sales to 2QFY18. TTAN also continued to gain
market share.
Watches and Prescription Eyewear businesses also saw good growth in the
quarter.
We maintain our Buy rating with a revised target price of INR975 (valued at
49x December 2019E EPS, a 20% premium to three-year average multiple
because of the extraordinarily strong earnings growth prospects – 36% EPS
CAGR over FY17-20E).
Stock Info
Bloomberg
Equity Shares (m)
52-Week Range (INR)
1, 6, 12 Rel. Per (%)
M.Cap. (INR b)
M.Cap. (USD b)
Avg Val, INRm
Free float (%)
Financials Snapshot (INR b)
2018E 2019E
Y/E Mar
Net Sales
160.7 199.3
EBITDA
15.4
19.6
PAT
11.0
14.1
EPS (INR)
12.4
15.9
Gr. (%)
37.7
27.7
BV/Sh (INR) 59.0
65.2
RoE (%)
23.2
25.6
RoCE (%)
23.9
26.0
P/E (x)
68.0
53.2
P/BV (x)
14.3
13.0
TTAN IN
887.8
872 / 326
2/51/127
750.5
11.5
1066
47.1
2020E
245.4
24.3
17.6
19.8
24.9
71.1
29.1
29.5
42.6
11.9
Jewelry: Festive sales healthy, continues gaining market share
Shareholding pattern (%)
As On
Sep-17 Jun-17 Sep-16
Promoter
52.9
53.1
53.1
DII
5.6
5.4
4.5
FII
21.7
21.6
22.0
Others
19.8
19.9
20.4
FII Includes depository receipts
Stock Performance (1-year)
Titan Company
Sensex - Rebased
900
750
600
450
300
The Jewellery division witnessed a good festive season (21
st
Sept’17 to 31
st
Oct’17), with retail sales growing in double-digits. If not for Prevention of
Money Laundering Act (PMLA), then growth would have been even better,
despite a high base (50% sales growth in the festive season last year).
Suspension of PMLA in early October 2017, however, helped the company
boost sales further over the rest of the festive season this year.
We note that some part of festive sales was already reflected in 2QFY18
(Dussehra this year was in 2QFY18, while traditionally Dussehra and Diwali fall
entirely in 3QFY18). TTAN had already mentioned in its 2QFY18 earnings call
that festive season sales were up 16-17% YoY. For 3QFY18 too, TTAN
mentioned that retail growth was healthy and met management’s internal
expectations. We, however, note that primary growth for 3QFY18 was lower
due to upstocking by franchisees in 2QFY18 (to the extent of INR2.5b), given
the early onset of festive season and also as PMLA was effective last quarter.
Market share gain for the division continued in 3QFY18 as well.
Padmavati collection, which was launched in 2QFY18, further enhanced festive
season sales.
3QFY18 saw the launch of: 1) ‘Glitterati’ – high-value diamond studded
jewellery and 2) ‘Aveer’ – sub-brand for men’s jewellery.
TTAN has added 34
Tanishq
stores on a YTD basis (1,01,000 sq.ft of retail
space), including conversion of 20 Gold Plus stores. It has also closed 25 Gold
Plus stores during this period.
Watches: Healthy same-store sales boost overall division sales
The Watches division too witnessed good sales in the festive season and also in
entire 3QFY18, led by healthy same-store sales growth. Online sales growth
exceeded traditional channel sales growth in 3QFY18 too.
3 January 2018
3

Titan launched
Titan We
(women’s smart watch) and also exclusive women
collection by designer Masaba Gupta. Loopholes collection for men and women
was launched under the Fastrack brand. Also, under the Sonata brand, TTAN
added Sleek and Essential categories of watches to its men’s collection, and
Steel Daisies and Start Dust to its women’s collection.
The division has added 21
World of Titan,
16
Fastrack
and 19
Helios
stores
(27,500 sq.ft. of retail space) in FY18 YTD.
Eyewear: Decent retail growth in Prescription Eyewear
Prescription Eyewear maintained its retail growth momentum in 3QFY18.
Sunglasses business suffered this quarter due to destocking by distributors on
account of higher GST rates initially. The company expects better growth in
4QFY18, with GST rates now revised down to 18% from 28% earlier.
The division has added 34
Titan Eye Plus
stores (24,000 sq.ft. of retail space) in
FY18 YTD.
New businesses
Skinn: It has become the largest selling perfume brand in volume and value
terms in all departmental store chains wherein it is present.
Taneira: The business is in the pilot phase, with two stores currently operating in
Bangalore. To assess the market potential further, TTAN might open a few more
stores in other metro cities.
Valuation and view
There is no material change to our forecasts. Consistently strong YoY sales
growth in Jewelry point to the sheer magnitude of value migration happening in
the Indian jewelry market. In FY17, TTAN accounted for only 5% of the INR2t
jewelry market. However, regulations governing the segment, including identity
proofs for all transactions over INR 200,000, GST implementation and
crackdown on black money, have tilted trade decisively in favor of organized
players, among which TTAN is a dominant player in terms of scale and trust.
Recent aggression to capitalize on the massive opportunity is also heartening.
Earnings CAGR is likely to be a massive 36% over FY17-20. The sheer scale of
top-line opportunity demands premium valuations. We thus maintain our
Buy
rating with a revised target price of INR975 (49x December 2019E EPS, 20%
premium to the three-year target price because of extraordinarily strong pace of
earnings growth).
3 January 2018
4

Larsen & Toubro
Green portfolio contribution rising; Health & safety remains monitorable
Larsen & Toubro’s (LT) Sustainability Report 2016 (SR16) is centered on the ‘rooted to the
future’ theme. This focus is well reflected in the company’s sustainable practices, including
creation of a vast pool of ~41,000 employees – who it believes are one of the key
stakeholders in building a sustainable future. Though LT has performed well on several key
performance indicators (KPIs) of
our sustainability (ESG) framework,
we would still like to
closely look at a few important parameters such as toxic emissions, industrial relations,
attrition rate, health & safety, geographical revenue concentration, and unbilled portion of
revenues.
Health & safety, defense revenues–monitorables
LT has consistently witnessed fatality rates of 9-12 per 100k workers over the
past five years. While the company has taken several health & safety initiatives,
their impact on the numbers is not yet visible.
LT is involved in the production of nuclear weapons and cluster munitions. Such
products are opposed by arms control advocates. LT’s defense segment
currently accounts for less than 2% of overall revenues which is insignificant.
However, we believe this is a monitorable.
LT’s attrition rate increased from 10% in FY12 to 18% in FY16. Furthermore,
according to media reports, the company has laid off 14k employees across
businesses over April-September 2016.
The management has highlighted that part of this is to facilitate automation and
improve productivity. We believe that events such as layoffs may result in
insecurity, increased stress levels and poor morale among employees.
Gulf Cooperation Council (GCC) countries account for 60% of export revenues.
This exposes LT to the risk of concentration of revenues.
Further, given the sharp decline in oil prices and the resultant slowdown in GCC
countries, LT’s business from this region may be impacted.
On a standalone basis, unbilled revenue accounted for over 40% of the revenues
in FY15-17. This was 19% in FY13 and 27% in FY14.
LT’s clean technology solutions portfolio grew 49% to INR161.3b in FY16 from
INR108b in FY15. It is well placed to take advantage of opportunities in green
technology. It has undertaken several projects to encourage environment
friendly solutions that ensure lower toxic emissions, reduced carbon emissions
and energy efficiency.
LT stands to gain from the government’s thrust on power and renewable
sources of energy in accordance with the Paris Climate Accord.
Rising attrition rate, layoffs may hurt employee morale
Significant portion of revenues concentrated in GCC countries
Unbilled portion of revenues on an uptrend
Green portfolio registered 24% CAGR over three years up to FY16
3 January 2018
5

Database Periodical | 2 January 2018
India Valuations Handbook
Strategy: A stellar finish to the year; all eyes on earnings recovery in CY18
Bulls & Bears
Nifty ends CY17 at a high:
The Nifty ended CY17 with stellar 29% returns, after gaining 3% in December 2017.
Even as one gets excited about CY17 returns, we note that the three-year CAGR returns for the Nifty stand at
8.5%. In December, FIIs turned net sellers after two months (sold USD0.7b), while DII flows remained robust
(USD1.3b). For CY17, MF flows stood at USD18b (2.5x of CY16 inflows), while FII flows came in at USD7.7b (>
CY15+CY16 inflows). Midcaps (+6.2% in December) continued to outperform the Nifty (led by robust DII flows),
commanding a rich premium of 72% v/s large caps.
Macros weakening at the margin:
The last three years were characterized by strong macros for India, with twin
deficits under control, a stable currency, rising forex reserves and low inflation. However, as we enter CY18,
rising crude prices and consequent higher inflation have taken some sheen off the macros, even as they still
remain healthy. In fact, the 10-year bond yields have increased 80bp in CY17 to 7.3%, incrementally posing a
threat to the prevalent “low cost of capital-led valuation premium” narrative. The possibility of the Indian
government missing its fiscal deficit target owing to lower indirect tax collections is concerning the markets. The
BJP’s sixth victory in elections (formed a government in Gujarat with a majority in December 2017) provided
some stability from the policy perspective, but its inferior performance in rural Gujarat has initiated a debate
about potentially higher rural spending in the CY18 budget – its last full-fledged budget before the General
Elections in 2019. However, if the government indeed increases rural spending, it will augur well for
consumption, which, in our view, is set for a strong recovery in 2HFY18 and beyond, as GST-related supply chain
disruption normalizes. Refer to our Rural Strategy notes, (Back on the saddle, Volume I) and (Back on the saddle,
Volume II), for more details.
India among the best-performing markets in CY17:
For CY17, MSCI EM (+34%), India-Sensex (+28%), Brazil
(+27%), Korea (+22%) and Indonesia (+20%) were the best performers among the key global markets in local
currency terms. On the other hand, Russia (-16%) delivered negative returns. Over the last 12 months, MSCI EM
(+34%) has outperformed MSCI India (+29%). However, over the last five years, MSCI India has outperformed
MSCI EM by 55%. MSCI India P/E is at a premium of 52% to MSCI EM P/E, above its historical average premium
of 43%.
Sectoral performance trends – Real Estate, and Telecom top performers of CY17:
Real Estate (+106%) and
Telecom (+66%) – the underperformers of CY16 – were the top gainers in CY17. Metals (+48%), Private Banks
(+47%), Media (+46%), Cement (+46%), Capital Goods (+40%), PSU Banks (+38%), Oil (+34%), NBFCs (+33%), Auto
(+32%) and Consumer (+32%) were the other gainers. Utilities, Technology and Healthcare underperformed the
Nifty. In this edition of ‘Bulls & Bears’, we take a deep dive into the valuation metrics of the Automobiles sector.
All eyes on earning recovery in CY18:
The key trigger that was missing for three years in an otherwise solid and
strong India macro story was earnings growth. We expect that to change as we usher into 2HFY18 and FY19. Low
base of demonetization, commodity price inflation, a demand recovery in a few B2C sectors and easing
competitive headwinds in Telecom are expected to provide earnings recovery support, in our view. Relative
weakening of macros (crude price rally, inflation pick up, spike in bond yields) are emerging concerns, though.
However, we believe that the macros still remain healthy on balance. Overall, we remain sanguine on
consumption revival in 2HFY18, led by normalization of GST-led issues, normal monsoon, MSP hikes, and low
base. Our recent interactions with companies from consumption space further reinforce our belief that rural
consumption is set for a strong recovery. That apart, a cyclical recovery in Financials and Infrastructure also
interests us. Among the beaten-down sectors, we continue believing that Pharma offers a good contrarian play.
ICICI Bank, SBI, Emami, Titan, SHTF, Bajaj Auto, Motherson Sumi, RBL, Sun Pharma and IGL are some of our
preferred bets.
3 January 2018
6

Sectoral performance – absolute and relative to Nifty (%): Real Estate, Telecom, Metals top performers
MoM Abs. Performance (%)
CY17
Jan- Feb- Mar- Apr- May- Jun- Jul- Aug- Sep- Oct- Nov- Dec- Chg
Sector
17 17 17 17 17 17 17 17 17 17 17 17 (%)
Real Estate
8 9
7 20 0
6 7
-2 -3
11 6
7 106
Telecom
19 5
-9
0
1
3 10 1
-10
26
0
11 66
Metal
15 2
-1 -4 0
1 9 7
2 9
-6
7 48
Nifty
7 7
4
5
-3
1 4
-1 -1
8
2
6 47
Midcap
Banks-Pvt
6 6
3
5
8
0 6
-2
0 3
2
3 47
Media
7 12 7
4
-7 -2
4
-6
3 7
3
7 46
Cement
11 3
5
8
-1 -1
9 4
-5
11
-5
2 46
Cap. Goods
8 4
7
9
-2 -3
5
-4 -1
7
0
4 40
Banks-PSU
8 4
8
5
-3 -2
13
-11 -8
25 2
-3
38
Oil
6 5
0
7
-1 -7
7 7
-2
12
-4
2 34
NBFC
7 1 11 4
0
0
7
-1 -2
1
-2
3 33
Auto
8
-1
2
3
6
-3
5
-3
2 5
-1
6 32
Consumer
5 3
5
2
7
3
-3
1
-4
5
1
4 32
Utilities
9 1
4
2
-5
0 4
-3 -2
6
-1
3 20
Technology
-6
8
0 -7
6
-4
6
-4 -1
4
4
5 11
Healthcare
0 4
0 -2 -10
5 0
-7
3 6
-2
6
0
Nifty-50
5 4
3
1
3
-1
6
-2 -1
6
-1
3 29
MoM Relative Performance (%)
CY17
Jan- Feb- Mar- Apr- May- Jun- Jul- Aug- Sep- Oct- Nov- Dec- Chg
17 17 17 17 17 17 17 17 17 17 17 17 (%)
4 5
4 19
-3
7 1
-1 -2
6
7
4 78
15 2
-12 -1 -3
4 4 3
-9
20 1
8 37
11
-2 -4 -6 -4
2 3 8
3 3
-5
4 19
3
2
3
6
4
4
1
3
3
1
4
-10
-4
3
2
9
-1
0
0
2
-2
-5
-1
-2
5
0
1
0
4
1
4
4
-3
7
-1
2
0
-3
-4
4
3
3
6
7
4
5
3
2
0
1
-9
-3
-7
5
-10
-4
-5
-7
-5
-3
3
4
-8
3
-13
2
1
-1
0
-2
-1
-6
1
-2
4
1
-3
6
-1
0
0
3
-3
1
5
2
20
6
-4
0
-1
1
-1
0
3
3
4
-4
1
3
-3
-1
0
2
0
5
-1
3
0
4
-1
1
-6
-1
0
3
1
0
2
3
19
18
18
17
11
10
5
4
3
3
-9
-18
-28
0
0
1
-2 -4
5
3 5
-4
-1 -2
0
7
-10 -6
2 9
-1
1 1
-1
-1 -2
3
-9
2
-3
-1 -1 -1
0
-2
0
-6 -6
4
Valuation deep-dive for the month: Automobiles
Auto sector has witnessed re-rating (ex-TTMT) over the past year, driven by a recovery in volumes, despite
regulatory hurdles in the form of demonetization, technology switch (from BS-3 to BS-4) and GST. Initial signs of
a recovery in rural volumes further improved volume growth visibility. As against a 10-year and 5-year average
P/E of 17.5x and 21.0x, respectively, the sector is re-rated to 24.6x. The re-rating has been driven by key stocks
like Maruti Suzuki, TVS Motor, Eicher Motors, Bharat Forge and Endurance Technologies. On the other hand,
stocks such as Bosch, Amara Raja, Exide, M&M and Tata Motors have witnessed de-rating.
Unlike in the past, Auto (ex TTMT) is trading at ~29% premium to Sensex P/E, driven by sustained superior
growth and capital efficiencies.
We note that the re-rating is largely witnessed in rural-dependent OEMs like MSIL, MM and HMCL, as well as
premium 2W companies like EIM and TVSL. Component manufacturers like BHFC (a recovery in exports) and
ENDU outperformed other ancillaries.
Near-term challenges exist
in the form of commodity inflation (even though OEMs pass through the same by
considering corrective pricing actions) and regulatory related cost inflation (such as upcoming mandatory
AC/ventilated cabins in CVs from January 2018 and ABS/CBS mandatory in 2W from April 2018). Demand
sustainability in the domestic market – backed by a continued rural recovery, increasing competitive intensity
and ramp-up in exports – would be the key factors driving sector valuations.
Auto should continue trading at a premium, as we expect aggregate EPS growth (ex-TTMT) to remain robust.
We expect 16%/25.5%/18.4% earnings growth in FY18/19/20E. Aggregate RoE (ex-TTMT) is expected to improve
250bp to 22% in FY20.
Trend in Auto P/E relative to Sensex P/E (%)
10 Yr Avg (x)
24.6
32.0
25.0
18.0
11.0
4.0
Auto P/E Ex TTMT (x)
Sensex PE (x)
Auto P/E Ex TTMT (x)
5 Yr Avg (x)
Trend in Auto P/E (ex TTMT) – one-year forward
31.0
24.0
17.0
10.0
3.0
21.0
17.5
24.6
19.0
3 January 2018
7

Sector valuations: Cyclicals at a premium to historical average P/B
Technology sector trades at a P/E of 16.6x, at a 5% premium to its historical average of 15.8x. Recent upward
movement in the stock prices has been a result of improved expectations on performance heading into FY19.
While seasonal weakness, led by lesser working days and furloughs, are likely to impact 3QFY18, underlying
optimism around increased technology spend, resolution of pressures in key accounts and correction of course
in problem verticals have been proving out to be a reason for a sentiment boost.
NBFCs trade at a P/B of 3.8x, above their historical average (29% premium). GSec yields have hardened more
than 50bp and now stabilized above 7%. If yields sustain at these levels over the medium term, it could
meaningfully impact spreads of NBFCs, especially HFCs. HFCs levered most to market borrowings will be
primarily impacted in this case. Despite the impact of RERA on the real estate sector, most HFCs have reported
healthy disbursement growth in 2QFY18, and this trend is expected to continue in 3QFY18.
PSU Banks now trade near its historical average P/B. It was the only negative performing sectors in December (-
3% return MoM). PSU Banks’ valuations have recovered over past few months with improved visibility on
earnings post recapitalization and with improved outlook on stressed asset resolution.
Auto is trading at a P/E of 19.0x, at a 24% premium to its historical average of 15.3x. In December 2017, our
channel checks indicated relatively weak retail growth in certain markets like Rajasthan and Maharashtra as
consumers await passage of the inauspicious period (15Dec-14Jan).
PE (x)
Current
19.0
21.4
13.1
23.2
30.3
25.5
40.6
23.3
18.1
28.9
11.2
12.1
48.0
16.6
Loss
11.4
10 Yr Avg Prem/Disc (%)
15.3
24.5
16.6
28.8
3.6
259.8
17.7
31.7
26.4
14.7
18.4
38.7
30.4
33.8
22.8
2.3
13.5
34.5
23.2
24.5
12.1
-7.3
11.7
3.2
26.0
84.6
15.8
4.8
-
-
14.3
-20.3
Relative to Sensex
P/E (%)
Current 10 Yr Avg
0
-13
13
-5
-31
-72
22
2
60
49
34
5
114
76
23
31
-5
-23
52
33
-41
-31
-36
-31
153
49
-13
-8
-
-
-40
-15
PB (x)
Current
4.2
2.9
0.9
3.8
3.3
3.1
12.0
3.4
2.1
5.4
1.7
1.6
9.8
3.9
3.1
1.5
10 Yr Avg Prem/Disc (%)
3.1
32.4
2.2
31.8
1.0
-7.0
3.0
29.0
3.7
-12.1
2.2
38.7
9.6
25.0
3.9
-12.8
1.7
21.8
4.1
33.9
1.5
12.9
1.6
3.2
6.6
47.6
4.1
-5.4
2.5
24.4
1.7
-13.7
Relative to Sensex
P/B (%)
Current 10 Yr Avg
47
20
3
-15
-68
-62
35
13
15
40
9
-15
321
272
20
50
-25
-34
91
55
-40
-44
-43
-40
244
154
37
57
11
-2
-48
-34
Snapshot: Sector valuations
Sector
Auto
Banks - Private
Banks - PSU
NBFC
Capital Goods
Cement
Consumer
Healthcare
Infrastructure
Media
Metals
Oil & Gas
Retail
Technology
Telecom
Utilities
Nifty: Auto trading at a premium to its historical average
Auto sector is trading at a P/E of 19.0x, at a 24% premium to its historical average of 15.3x. Our channel checks
indicated that retail growth was relatively weak In December 2017 in certain markets like Rajasthan and
Maharashtra as consumers await passage of the inauspicious period (15Dec-14Jan).
Global equities: India among best-performing markets for CY17
For CY17, MSCI EM (+34%), India-Sensex (+28%), Brazil (+27%), Korea (+22%) and Indonesia (+20%) were the
best performers among the key global markets in local currency terms. On the other hand, Russia (-16%) has
delivered negative returns.
Indian equities are trading at 22.7x FY18E earnings.
All key markets continue trading at a discount to India. However, India’s RoE remains superior to most EMs, an
important differentiator for valuation premium.
3 January 2018
8

Global equities: MSCI EM outperforms MSCI India in last 12 months
Over the last 12 months, MSCI EM (+34%) has outperformed MSCI India (+29%). However, over the last five
years, MSCI India has outperformed MSCI EM by 55%.
MSCI India P/E is at a premium of 52% to MSCI EM P/E, above its historical average premium of 43%
MSCI India outperforms MSCI EM by 55% in last five years
170
MSCI India Rebased
MSCI EM Rebased
MSCI EM outperforms MSCI India over 12 months
MSCI India Rebased
138
126
114
102
90
MSCI EM Rebased
134
129
10 Year CAGR:
MSCI India: 4.0%
135
MSCI EM: -0.7%
100
65
30
5 Year CAGR:
MSCI India: 10.6%
MSCI EM: 1.9%
148
93
3 January 2018
9

Sector Update | 2 January 2018
Automobiles
Bajaj Auto
CMP: INR3,294
Bloomberg
Equity Shares (m)
52-Week Range (INR)
1, 6, 12 Rel. Per (%)
Financial & Valuation (INR b)
Y/E MARCH
2018E 2019E
Sales
239
271
EBITDA
45.5 56.1
Consol. NP
43.3 52.0
ConsEPS(INR) 150
180
EPS Gr. (%)
6.1 20.0
BV/Sh. (INR)
651
729
RoE (%)
24.2 26.0
RoCE (%)
21.9 23.8
Payout (%)
52.2 50.2
Valuation
P/E (x)
22.0 18.3
P/BV (x)
5.1
4.5
EV/EBITDA (x) 17.6 13.9
Div. Yield (%)
2.0
2.3
BJAUT IN
289.4
3122/2366
2/-6/0
TP: INR4,023 (+22%)
Buy
Dec-17 dispatches up 29.7% YoY to 292.5k (below est. of 309k)
Domestic volume rises 24.9% YoY; exports grow 35.2% YoY
M.Cap. (INR b) / (USD b) 840.6/13.1
2020E
309
65.3
60.3
208
16.0
824
26.8
33.8
49.0
15.8
4.0
11.6
2.6
BJAUT’s Dec-17 sales increased 29.7% YoY to 292.5k units (below est. of 309k units).
Domestic volumes increased 24.9% YoY to 149.5k (est. of 160k), while exports rose
35.2% YoY to 143k (est. of 149k). Overall FY18 volumes estimate of 3.92m implies a
residual monthly run-rate of 318.5k units.
Overall motorcycle volumes increased 12.5% YoY. Domestic motorcycle dispatches
increased by ~6% YoY to 112.9k. Motorcycle exports grew ~20% YoY to 115.8k units.
3W volumes remained strong, with overall volume growing 187.1% YoY. Domestic 3W
volumes continued their positive trajectory, increasing 180% YoY to 36.6k units. 3W
exports rose 197% YoY to 27.2k units.
On strong 3W volumes, S Ravikumar mentioned that the current growth rate will
sustain at least for the next 4-5 months. Speaking on domestic volumes, he said “We
are quite confident that we will deliver the type of numbers in domestic that we
alluded to in the past.”
The stock trades at 18.3x/15.8x FY19E/20E consol. EPS. Maintain Buy.
Snapshot of volumes for Dec-17
YoY
Company Sales
Bajaj Auto
Motorcycles
Total Two-
Wheelers
Three-Wheelers
Domestic
Exports
MoM
Residual Residual FY18 YTD
Growth Monthly Monthly
YoY (%)
FY18
MoM
(%)
Dec-17 Dec-16
Nov-17
FY18YTD FY17YTD
Gr. (%)
(%) Run rate Run rate
chg
(%) chg
chg estimate
292,547 225,529 29.7 326,458 -10.4 2,961,413 2,878,237 2.9 3,916,894 6.8
21.3 318,494 329,046
228,762 203,312 12.5 263,970 -13.3 2,512,945 2,518,915 -0.2 3,303,922 2.6
12.8 263,659 279,216
228,762
63,785
149,509
143,038
203,312 12.5 263,970 -13.3 2,512,945 2,518,915
22,217 187.1 62,488
2.1
448,468 359,322
119,725 24.9 179,835 -16.9 1,724,398 1,791,041
105,804 35.2 146,623 -2.4 1,237,015 1,087,196
-0.2 3,303,922
24.8 612,973
-3.7 2,271,453
13.8 1,645,441
2.6
37.4
1
16.6
12.8
89.7
18.0
26.0
263,659
54,835
182,352
136,142
279,216
49,830
191,600
137,446
3 January 2018
10

Hero MotoCorp
CMP: INR3,747
Stock Info
Bloomberg
Equity Shares (m)
M.Cap.(INR b)/ (USDb)
52-Week Range (INR)
1, 6, 12 Rel. Per (%)
HMCL IN
199.7
635/9.5
3813 / 2844
9/-1/4
TP: INR3,922 (+5%)
Neutral
At 472.7k (+43.2% YoY), volumes miss est. of 553k
Financials Snapshot (INR b)
Y/E MARCH 2018E 2019E 2020E
Sales
310.4 339.8 372.2
EBITDA
51.3 54.3
59.7
NP
36.2 38.7
42.9
Adj. EPS (INR) 181.3 193.9 214.2
EPS Gr. (%)
7.2
6.9
10.4
BV/Sh. (INR) 579.2 664.7 768.7
RoE (%)
33.4 31.2
29.9
RoCE (%)
32.2 30.2
29.1
Valuations
P/E (x)
20.7 19.3
17.5
P/BV (x)
6.5
5.6
4.9
EV/EBITDA (x) 13.1 12.2
10.9
Div. Yield (%)
2.4
2.4
2.4
HMCL’s Dec-17 volumes of 472,731 units (+43.2% YoY) were below our estimate of
553,000 units. Our FY18 total volume estimate is 7.38m units, asking for a residual
monthly run-rate of ~598k units.
Mr. Pawan Munjal, Managing Director & Chief Executive Officer said “We are now
entering the last quarter of this fiscal with a strong focus on the premium segment and
scooters and we are confident of sustaining our growth momentum.”
The company is introducing three new motorcycles – 125cc Super Splendor, the 110cc
Passion PRO and the 110cc Passion XPRO – in a phased manner starting January 2018.
HMCL trades at 19.3/17.5x FY19E/20E EPS. Maintain Neutral.
Snapshot of volumes for Dec-17
YoY
Company Sales
Hero MotoCorp
MoM
Residual Residual FY18 YTD
Growth Monthly Monthly
YoY (%)
FY18
MoM
(%)
Dec-17 Dec-16
Nov-17
FY18YTD FY17YTD
Gr. (%)
(%) Run rate Run rate
chg
(%) chg
chg estimate
472,731 330,202 43.2 605,270 -21.9 5,581,286 5,042,098 10.7 7,375,515 10.7
10.6 598,076 620,143
3 January 2018
11

Tata Motors
CMP: INR440
Stock Info
Bloomberg
Equity Shares (m)
M.Cap.(INR b)/ (USDb)
52-Week Range (INR)
1, 6, 12 Rel. Per (%)
TTMT IN
3395.9
1525/22.8
599 / 376
-4/-21/-7
TP: INR593 (+35%)
Buy
Volumes grow 48.2% YoY to 60.7k units (above est. of 58k)
CV sales grew 54.8% YoY, while PV sales increased 30.4% YoY
Financials Snapshot (INR b)
Y/E MARCH 2018E 2019E 2020E
Net Sales
2,929 3,548 3,800
EBITDA
383.6 561.0 601.3
NP
111.4 206.3 225.2
Adj. EPS (INR) 32.8 60.7
66.3
EPS Gr. (%)
65.5 85.2
9.2
BV/Sh. (INR) 214.1 276.1 343.6
RoE (%)
17.0 24.8
21.4
RoCE (%)
9.6 15.2
13.9
Valuations
P/E (x)
13.4
7.2
6.6
P/BV (x)
2.1
1.6
1.3
EV/EBITDA (x)
4.5
2.9
2.5
Div. Yield (%)
0.1
0.1
0.1
Tata Motors’ Dec-17 wholesales increased 48.2% YoY to 60.67k units (est. of 57.95k
units).
PV segment sales increased by 30.4% YoY, as the UV segment volumes grew 3.7x to
6.2k units due to healthy response to Nexon, while car segment volumes declined
15.2% YoY to 8.4k units.
Total CV volumes increased 54.8% YoY to 46.1k units, led by a rise in both HCV and LCV
sales.
For FY18 YTD, CV volumes grew 9.9% YoY, led by a 5.2% YoY increase in HCV sales and
a 13.7% YoY increase in LCV sales.
M&HCV sales increased 59.2% YoY to 22k units (est. of 19.5k units), while LCV sales
increased 51.1% YoY to 24.1k units (est. of 23.5k units).
The stock trades at 7.2x/6.6x FY19E/20E consol. EPS. Maintain Buy.
Snapshot of volumes for Dec-17
YoY
Company Sales
Tata Motors
HCV's
LCV's
CV's
Cars
UV's
Dec-17
60,671
22,064
24,083
46,147
8,338
6,186
MoM
YoY (%)
MoM
Dec-16
Nov-17
FY18YTD FY17YTD
chg
(%) chg
40,944
13,863
15,942
29,805
9,829
1,310
48.2
59.2
51.1
54.8
-15.2
372.2
57,271
17,621
22,402
40,023
11,638
5,610
5.9
25.2
7.5
15.3
-28.4
10.3
434,152
127,438
175,245
302,683
99,511
31,958
(%)
chg
Residual Residual FY18 YTD
Growth Monthly Monthly
FY18
Gr. (%)
(%) Run rate Run rate
estimate
597,834
179,739
235,930
415,669
132,598
49,568
10.2
2.2
12.9
8.0
-3.2
142.4
8.4
-4.4
10.7
3.1
-2.8
135.4
54,561
17,434
20,228
37,662
11,029
5,870
48,239
14,160
19,472
33,631
11,057
3,551
391,255 11.0
121,128 5.2
154,189 13.7
275,317 9.9
102,973 -3.4
12,965 146.5
3 January 2018
12

Ashok Leyland
CMP: INR123
Stock Info
Bloomberg
Equity Shares (m)
M.Cap.(INR b)/ (USDb)
52-Week Range (INR)
1, 6, 12 Rel. Per (%)
AL IN
2,845.9
254.0/3.8
112 / 74
3/3/-29
TP: INR137 (+11%)
Buy
Vols. up 79.4% YoY to 19.3k (above est. of 15.8k)
MHCVs grew 81.6%, while LCVs rose 69.5% YoY
Financials Snapshot (INR b)
Y/E MARCH 2018E 2019E 2020E
Sales
248.0 285.4 327.2
EBITDA
24.8 30.9
37.3
NP
13.6 18.2
23.7
Adj. EPS (INR)
4.7
6.2
8.1
EPS Gr. (%)
2.3 33.9
30.0
BV/Sh. (INR)
23.1 26.7
31.8
RoE (%)
21.1 25.0
27.7
RoCE (%)
18.0 21.1
23.9
Valuations
P/E (x)
26.5 19.8
15.2
P/BV (x)
5.3
4.6
3.9
EV/EBITDA (x) 14.1 10.8
8.5
Div. Yield (%)
1.6
1.8
2.0
AL’s Dec-17 wholesale dispatches of 19,253 units (+79.4% YoY) were above our
estimate.
M&HCV volumes, which account for 82.8% of total volumes, grew 28.6% YoY (+49.9%
MoM) to 15,950 units (est. of 12,400 units).
LCVs (Dost) grew 69.5% YoY to 3,303 units (est. of 3,400 units).
The stock trades at 19.8x/15.2x FY19E/20E EPS, and at 10.8/8.5x EV/EBITDA. Maintain
Buy.
Snapshot of volumes for Dec-17
YoY
Company Sales
Ashok Leyland
CV (ex LCV)
LCV
Dec-17 Dec-16
19,253
15,950
3,303
10,731
8,782
1,949
MoM
YoY (%)
MoM
Nov-17
chg
(%) chg
79.4 14,460 33.1
81.6 10,641 49.9
69.5
3,819 -13.5
Residual Residual FY18 YTD
Growth Monthly Monthly
(%)
FY18
FY18YTD FY17YTD
Gr. (%)
(%)
Run rate Run rate
chg estimate
116,096 97,444 19.1 163,988
13.0
0.6
15,964 12,900
86,964 74,652 16.5 121,901
7.6
-9.6
11,646
9,663
29,132 22,792
28
42,087
32.5
44.2
4,318
3,237
3 January 2018
13

EICHER Motors
CMP: INR28,697
Stock Info
Bloomberg
EIM IN
Equity Shares (m)
27.2
M.Cap.(INR b)/(USD b)
644.0/9.6
52-Week Range (INR) 29983/18006
1, 6, 12 Rel. Per (%)
6/8/37
Financials Snapshot (INR b)
Y/E MARCH 2018E 2019E 2020E
Net Income
87.2 106.8 126.4
EBITDA
27.6
35.2
43.1
Net Profit
22.4
29.2
36.6
Adj. EPS (INR) 823.8 1,071.3 1,343.8
EPS Gr. (%)
33.6
30.1
25.4
BV/Sh. (INR) 2,608 3,477 4,592
RoE (%)
36.0
35.2
33.3
RoCE (%)
31.6
31.5
30.7
Payout (%)
0.5
0.6
0.7
Valuations
P/E (x)
34.8
26.8
21.4
P/BV (x)
11.0
8.3
6.2
EV/EBITDA(x) 22.5
17.2
13.6
TP: INR34,678 (+21%)
Buy
VECV volumes above est. at 5.96k units (+50.9% YoY)
Domestic volume grew 55.4% YoY, while exports up 30% YoY
VECV's volumes increased 50.9% YoY to 5.96k units (v/s est. of 5.65k units).
Domestic LMD and HD segments grew 78.4% YoY and 59.6% YoY, respectively. Buses
volume declined 11.8% YoY.
Exports grew 30% YoY to 910 units (est. of 800 units).
The stock trades at 26.8x/21.4x FY19E/20E consol. EPS. Maintain Buy.
Snapshot of volumes for Dec-17
YoY
Company Sales
VECV
Domestic LMD
Domestic HD
Domestic Buses
Total Domestic
Exports
Dec-17 Dec-16
5,955
3,197
1,264
584
5,045
910
3,946
1,792
792
662
3,246
700
MoM
YoY (%)
MoM
Nov-17
chg
(%) chg
50.9
4,727
26.0
78.4
2,501
27.8
59.6
1,025
23.3
-11.8
536
9.0
55.4
4,062
24.2
30.0
665
36.8
Residual Residual FY18 YTD
Growth Monthly Monthly
(%)
FY18
FY18YTD FY17YTD
Gr. (%)
Run rate Run rate
(%)
chg estimate
42,120 40,525 3.9
62,348
6.8
13.1
6,743
4,680
21,248 18,407 15.4 29,544
14.0
10.5
2,765
2,361
7,576
7,466
1.5
11,553
4.0
9.2
1,326
842
7,275
8,499 -14.4 11,345
-7.5
7.9
1,357
808
36,099 34,372 5.0
52,443
3.9
1.6
5,448
4,011
6,021
6,153
-2.1
8,742
8.8
44.6
907
669
3 January 2018
14

Mahindra & Mahindra
CMP: INR753
Stock Info
Bloomberg
Equity Shares (m)
M.Cap.(INR b)/(USD b)
52-Week Range (INR)
1, 6, 12 Rel. Per (%)
MM IN
592.6
794.7/12.4
1509 / 1142
3/6/-10
TP: INR856 (+14%)
Buy
Tractor wholesales at 39.2k (in line with est. of 37.1k)
Domestic dispatches grew 30.5% YoY; exports up 13.2% YoY
Financials Snapshot (INR b)
Y/E MARCH 2018E 2019E 2020E
Sales
470.9 531.0
EBITDA
58.1 66.5
NP*
40.6 46.8
Adj.EPS(INR)* 34.2 39.4
EPS Gr. (%)
8.4 15.3
Cons.EPS INR) 37.6 44.3
BV/Sh. (INR) 238.1 264.9
RoE (%)
14.1 14.6
RoCE (%)
13.0 13.6
Valuations
P/E (x)
22.0 19.1
P/BV (x)
20.0 17.0
EV/EBITDA (x)
3.2
2.8
Div. Yield (%)
15.0 12.9
*incl. MVML
589.0
75.2
53.2
44.8
13.6
48.8
296.7
14.9
14.0
16.8
15.4
2.5
9.7
MM’s farm equipment segment volumes grew 30.2% YoY to 18.3k units (in line with
est. of 18k units).
Domestic dispatches increased 30.5% YoY to 16.58k units.
Exports increased 13.2% YoY to 1.6k units.
For FY18 YTD, MM’s total tractor volumes increased 16% YoY to 246.7k units.
Speaking on the monthly performance, Rajan Wadhera, President, Automotive Sector,
M&M Ltd. said, “We have sold 16,671 tractors in the domestic market during
December 2017, a growth of 32% over last year. With the healthy reservoir levels and
good progress on rabi sowing, we expect the growth momentum to continue in the
coming months. In the exports market, we sold 1,617 tractors, a growth of 13% over
December 2016.”
The stock trades at 19.1x/16.8x FY19E/20E. Maintain Buy.
Snapshot of volumes for Dec-17
YoY
Company Sales
M&M
Tractors
MoM
YoY (%)
(%)
MoM
Dec-17 Dec-16
Nov-17
FY18YTD FY17YTD
chg
(%) chg
chg
18,288 14,047
30.2
22,754
-19.6
246,748 212,739 16.0
Residual Residual FY18 YTD
Growth Monthly Monthly
FY18
Gr. (%)
(%)
Run rate Run rate
estimate
302,441
15.0
10.8
18,564
27,416
3 January 2018
15

Sector Update | 2 January 2018
Capital Goods
Capex tracker
New project announcements decline sharply in 3QFY18
Stalled projects remain elevated
We highlight key takeaways from the quarterly projects data released by Centre for
Monitoring Indian Economy (CMIE). We use this as a proxy for the Indian capex cycle. CMIE
tracks projects across stages of announcement, implementation and completion, and takes
into account stalled/shelved projects.
New project announcements
dip 67%
New projects (INR b)
6600
5500
4400
3300
2200
1100
0
YoY %
180%
110%
40%
-30%
-100%
New project announcements dip 67% to INR768b; 6th quarter of decline
New project announcements stood at INR768b in 3QFY18, a dip of 67% YoY and the
lowest since June 2004. Private sector projects fell to their lowest since June 2003
to INR355b (down 71% YoY) and accounted for 46% of total new projects. The share
of central governments was 84%. State government projects stood at INR59b (down
66% YoY). A sectorial analysis of proposals during the quarter indicates steep
declines in Electricity (-48% YoY; INR115b), Transport Services (-35% YoY; INR343b)
and Manufacturing (-68% YoY; INR217b).
New project proposals declined sharply during 9MFY18 as well – during this period,
1,721 projects with investments worth INR4t were announced as against 2,517
projects with investments worth INR9.2t announced in 9MFY17.
Project completions drop 19% YoY to INR769b; 4
th
quarter of decline
During the quarter, project completions declined 19% YoY to INR769b – this is much
lower than the average run rate of INR1t, and in fact, the lowest in three years.
Project completions have declined on a YoY basis for the last four quarters post
structural reforms like demonetization and GST (renegotiation of contracts). Project
completions should pick up going ahead, as business activity normalizes post GST
implementation.
Stalled projects remain at elevated
levels (13.2% of the projects)
Stalled projects
% of under implementation
Stalled projects rise to INR13.3t, 13.2% of projects under implementation
Projects stalled remain elevated at INR13.3t, 13.2% of projects under
implementation. Some of the key reasons for stalled projects are lack of
environmental clearances, lack of fuel, lack of funds and land acquisition-related
problems. 72% of the total stalled projects are private sector projects.
By sector, power projects, which constitute 40% of stalled projects, continue to
dominate stalled projects. Other key sectors with a high share of stalled projects
are: Manufacturing (28%), Services (19%), and Construction (10%). One of the key
reasons for subdued new project proposals/announcements is high stalled projects.
12400
9300
6200
3100
0
12.5%
10.0%
7.5%
5.0%
2.5%
0.0%
Projects under implementation up 2%, supported by government projects
Projects under implementation registered muted growth of 2% YoY to INR101t in
3QFY18. 62% of the projects under implementation are from the government sector
(highest since June 2006), while the share of the private sector is 38%. This is
reflective of the reluctance of the private sector to invest in new capacity, given (a)
constrained demand scenario and resultant underutilization, and (b) over-leveraged
balance sheets. Sectors that registered strong growth are: Transport Equipment
(+23% YoY, mining (+13% YoY) and Transport Services (+12% YoY).
3 January 2018
16

In conversation
1. BAJAJ AUTO: Expect growth in 3-wheelers to sustain for next
4-5 months; S Ravikumar, President - Business Development
This quarter has been great for three-wheeler segment both domestic and
exports. Have done almost about 118 percent growth in domestic and 200
percent growth in exports.
Going forward, this type of a growth rate will sustain at least for the next 4-5
months.
Export numbers are much more steadier.
Have already started production in plants, both Waluj as well as the Pantnagar
plant. Going to unleash two Discovers in the market, production has already
started in December.
2. HPCL: No specific directive from government on fuel prices;
MK Surana, CMD
As far as the domestic LPG and the public distribution system (PDS) kerosene are
concerned, which are controlled products right now, the under-recovery is being
reimbursed by the government.
Guided by the directions of the government on the pricing of these two
products.
Time to time the directive comes but there is no specific directive from the
government on fuel prices.
3. DABUR: Anti-profiteering contours are clear but
implementation difficult for FMCG; Sunil Duggal, CEO
Contours of anti-profiteering rule are fairly clear but implementation is difficult
for fast moving consumer goods (FMCG).
There are conflicting laws with regards to pricing in lower value FMCG products.
Scrutiny should be for the entire distribution chain.
4. BRIGADE GROUP: Expect to find an investor for hospitality biz
by Q1FY19; KP Pradeep, CFO
Purchase of Bengaluru land done through internal accruals.
Have commercial leasing space of 2.4 million square feet currently.
Rentals are stable and expect them to remain stable going forward.
On hospitality business front, expect to find an investor for the business by Q1
of FY19.
Debt is moving in-line with the project pipeline.
3 January 2018
17

From the think tank
1. Maruti Suzuki’s continuing success begs a relook at early-
stage protectionism
The latest numbers on car sales threw up one clear winner in India’s three-million-
strong passenger vehicle market. Sales at Maruti Suzuki India Ltd, India’s largest
car maker, grew 12.1% in December even as even as Hyundai Motor India Ltd, its
nearest rival, posted flat sales. Maruti continuing success is truly mind boggling.
The company has a market share over 50% in one of the world’s fastest growing
market populated by the biggest names in the business. The company has defied
the global law of the automobile industry, that large multinationals eventually
always dominate markets. In a highly consolidated business, a handful of major
corporations own nearly all of the world’s major car brands.
2. India’s bond market has a 2018 message for Narendra Modi
One year ago, India’s bond market was riding a wave of unprecedented liquidity.
Now it’s mired in all kinds of doubts, ending 2017 weaker than Chinese
sovereign debt when the opposite outcome would have been more natural.
After all, India saw a ratings upgrade by Moody’s Investors Service during the
year, while China was downgraded. The message for Prime Minister Narendra
Modi is clear: in 2018, go easy on the fiscal sauce. A near-4% yield on 10-year
notes from the People’s Republic of China is partly a result of President Xi
Jinping’s deleveraging campaign, and partly a reflection of the strengthening
Chinese economy (a purchasing managers’ index released Tuesday showed the
fastest expansion last month since August.)
3. Economic policy challenges in 2018
The last leg of 2017 did not pan out exactly the way the Narendra Modi
government would have wanted it to. It also showed the kind of policy challenges
that the government will have to deal with in 2018. The goods and services tax
(GST) continues to face implementation issues and distress in the agriculture sector
started to reflect in electoral outcomes. Even though the latest gross domestic
product (GDP) data showed that the Indian economy is recovering from the twin
policy shocks of demonetization and GST, and the pace of growth is likely to be
higher in 2018 than 2017, broader economic management will not be easy. This is
despite the ongoing synchronized global recovery, which will help the Indian
economy during the year. The biggest challenge will be the management of
government finances. Last week, the government announced that it would go in
for additional market borrowings of Rs50,000 crore.
3 January 2018
18

4. Structural reforms should continue
Another year has gone by, and India has shown itself to be an especially exciting
place on the world map. The last 12-18 months have been a significant period and
one which could potentially affect the country several decades going forward. The
defining feature of this period has undoubtedly been the string of structural
reforms . The striking part about these reforms has not been just their breadth in
terms of coverage across industries, but, importantly, the depth to which these
have tried to address existing structural challenges plaguing the country. In terms
of numbers alone, the reforms list presents an impressive picture—as per the
department of industrial policy and promotion (DIPP), we already implemented
122 reforms in India in 2017, with a further 90 on the anvil.
International
5. Has china’s economic growth finally stabilized?
For the last decade or so, China’s economy has been on something of a roller
coaster ride. As 2018 begins, is the country approaching a new ascent, a steep
drop, or something in between? Prior to the global economic crisis a decade
ago, the Chinese economy was growing at a breakneck pace. But when the crisis
hit, the growth rate fell relatively sharply. Thanks to a $4 trillion stimulus
package, growth soon reached its trough and began to climb again, reaching
12.2% year on year in the first quarter of 2010. Soon after, however, monetary
tightening put economic growth back on a downward trajectory, spurring the
government to loosen policy and introduce mini-stimulus packages in late 2011
and early 2012. This produced a short-lived and moderate rebound, with
economic growth again beginning to slide, albeit less steeply, soon after.
3 January 2018
19

Click excel icon
for detailed
valuation guide
CMP
(INR)
TP
(INR)
% Upside
EPS (INR)
Downside FY18E FY19E FY20E
3
9
27
16
1
10
21
-3
-11
15
2
12
18
4
21
31
-1
28.7
34.2
41.1
4.5
6.2
8.2
153.1 183.8
212.4
19.4
26.3
34.4
454.9 604.8
730.1
82.5
116.9
140.6
825.0 1,072.7 1,345.2
27.6
38.5
51.8
35.8
45.9
57.6
7.8
9.8
11.6
183.1 193.9
213.3
37.6
44.3
48.8
9.0
12.0
14.9
286.5 380.0
482.9
10.0
14.4
18.3
24.6
64.8
68.6
14.6
25.4
34.3
Valuation snapshot
P/E (x)
P/B (x)
ROE (%)
FY19E FY20E FY19E FY20E FY19E FY20E
24.3
19.8
17.9
27.6
32.6
16.4
26.8
35.6
16.9
22.6
19.3
17.0
21.0
25.1
26.3
6.8
30.5
17.5
18.2
18.5
25.5
16.2
22.1
18.2
16.7
20.9
6.1
24.1
22.7
8.3
13.4
19.7
7.0
34.0
5.2
9.8
8.8
11.3
4.8
10.1
34.0
27.0
15.9
18.8
12.8
42.3
29.7
73.6
11.1
15.6
12.4
20.2
15.0
15.5
21.1
27.0
13.6
21.3
26.4
13.4
19.0
17.6
15.4
16.9
19.8
20.6
6.4
22.6
15.0
13.9
15.2
14.8
13.1
17.8
14.2
16.1
16.3
4.8
19.3
16.9
6.3
10.6
15.5
5.3
16.3
3.5
8.9
6.9
8.5
3.2
7.5
23.8
19.8
12.3
15.4
10.3
34.0
25.6
58.8
8.9
12.7
10.4
4.1
4.7
4.5
5.9
5.6
2.5
8.2
7.7
2.9
3.1
5.6
2.8
2.3
5.9
6.7
1.7
9.4
4.0
1.9
2.1
2.0
1.6
4.2
2.2
1.1
3.6
0.7
3.7
2.9
1.0
2.4
2.7
0.9
0.7
0.6
1.1
0.8
1.2
0.4
0.9
3.7
5.1
2.3
3.3
1.8
12.4
4.8
2.2
3.2
2.8
2.0
3.5
3.9
3.9
4.9
5.0
2.2
6.2
6.4
2.4
2.8
4.9
2.5
2.1
4.9
5.5
1.3
7.0
3.3
1.7
1.8
1.8
1.4
3.5
1.9
1.1
3.0
0.6
3.1
2.6
0.9
2.0
2.4
0.8
0.7
0.6
1.0
0.7
1.1
0.4
0.8
2.8
4.2
2.0
2.8
1.6
10.1
4.4
1.9
2.8
2.4
1.7
18.1
25.2
26.4
23.4
18.2
16.2
35.2
23.8
18.4
13.9
31.1
14.6
11.8
23.1
28.1
28.3
35.3
23.0
10.8
11.8
8.2
10.0
20.4
10.5
6.9
19.0
12.3
13.5
13.7
12.6
19.5
13.8
9.4
1.8
11.3
11.2
9.0
11.4
9.1
8.5
12.3
20.4
15.4
19.2
15.2
32.1
17.5
19.1
31.0
19.6
16.9
18.7
28.2
27.0
25.2
19.6
16.9
33.3
26.6
19.5
14.8
29.7
14.9
12.9
24.7
29.2
23.1
35.6
22.2
12.7
12.8
12.8
11.3
21.4
12.4
6.8
20.6
14.2
15.0
16.1
14.8
20.8
15.3
10.9
3.6
14.7
11.3
10.4
13.7
12.6
10.4
13.6
23.1
17.2
19.8
16.5
32.7
17.3
19.1
33.8
20.4
17.4
Company
Automobiles
Amara Raja
Ashok Ley.
Bajaj Auto
Bharat Forge
Bosch
CEAT
Eicher Mot.
Endurance Tech.
Escorts
Exide Ind
Hero Moto
M&M
Mahindra CIE
Maruti Suzuki
Motherson Sumi
Tata Motors
TVS Motor
Aggregate
Banks - Private
Axis Bank
DCB Bank
Equitas Hold.
Federal Bank
HDFC Bank
ICICI Bank
IDFC Bank
IndusInd
J&K Bank
Kotak Mah. Bk
RBL Bank
South Indian
Yes Bank
Aggregate
Banks - PSU
BOB
BOI
Canara
Indian Bk
PNB
SBI
Union Bk
Aggregate
NBFCs
Aditya Birla Cap
Bajaj Fin.
Capital First
Cholaman.Inv.&Fn
Dewan Hsg.
GRUH Fin.
HDFC
HDFC Stand. Life
Indiabulls Hsg
L&T Fin Holdings
LIC Hsg Fin
Reco
Buy
Buy
Buy
Buy
Neutral
Buy
Buy
Buy
Sell
Buy
Neutral
Buy
Buy
Buy
Buy
Buy
Neutral
830
856
123
134
3,294 4,197
727
844
19,720 19,965
1,919 2,116
28,697 34,653
1,369 1,334
773
688
221
254
3,747 3,819
753
842
251
297
9,545 9,918
379
458
439
575
776
764
Buy
Neutral
Buy
Buy
Buy
Buy
Neutral
Buy
Buy
Buy
Buy
Buy
Buy
560
194
146
108
1,873
309
54
1,644
82
1,003
512
31
312
680
197
209
146
2,150
355
56
2,000
100
1,179
665
36
382
21
2
43
36
15
15
4
22
22
18
30
16
23
18.4
8.5
1.7
5.5
68.7
13.6
2.8
60.9
8.4
32.1
16.0
1.9
17.8
30.8
10.5
5.7
6.6
84.7
17.0
3.2
78.6
13.4
41.6
22.6
3.8
23.3
40.2
12.8
9.9
8.2
105.4
21.8
3.4
100.8
17.2
51.9
30.2
4.9
29.5
Buy
Neutral
Neutral
Buy
Buy
Buy
Neutral
158
167
352
376
166
303
142
201
201
386
438
250
415
175
27
20
10
17
50
37
23
17.9
-1.2
28.4
34.4
10.5
14.6
18.4
22.6
4.9
67.8
38.3
18.9
26.8
29.4
29.7
10.3
99.7
42.3
24.1
35.8
45.0
Buy
Buy
Buy
Buy
Buy
Neutral
Buy
Buy
Buy
Buy
Neutral
185
1,722
698
1,293
583
497
1,702
395
1,184
171
563
231
2,300
925
1,500
690
500
2,000
370
1,550
240
680
25
34
33
16
18
1
18
-6
31
41
21
3.7
45.7
32.8
59.1
37.2
9.9
67.6
4.7
83.7
7.4
39.7
5.4
63.7
43.7
68.7
45.5
11.7
57.3
5.4
106.3
10.9
45.5
7.8
87.0
56.5
84.2
56.5
14.6
66.5
6.7
132.7
13.5
53.9
3 January 2018
20

Click excel icon
for detailed
valuation guide
CMP
(INR)
462
459
1,314
686
2,102
1,458
TP
% Upside
EPS (INR)
(INR) Downside FY18E FY19E
562
22
13.5
18.7
550
20
42.6
42.0
1,750
33
52.5
66.5
750
9
36.0
41.9
2,650
26
115.6 145.3
1,500
3
80.6
106.2
Valuation snapshot
P/E (x)
P/B (x)
ROE (%)
FY19E FY20E FY19E FY20E FY19E FY20E
24.7
20.0
2.9
2.7
12.2
13.9
10.9
9.5
2.0
1.7
19.9
19.6
19.8
14.8
3.1
2.7
16.7
19.4
16.4
13.7
2.7
2.3
17.9
18.0
14.5
12.1
2.2
1.9
15.9
16.6
13.7
11.4
2.2
1.9
17.4
18.3
22.3
18.1
3.9
3.4
17.4
18.6
49.4
22.5
41.7
33.5
42.9
39.9
27.5
38.8
38.5
21.6
23.0
40.6
37.4
35.4
16.7
33.0
28.9
31.9
24.3
21.7
37.2
9.7
17.1
18.1
23.2
22.0
18.4
23.2
18.1
15.2
36.0
28.9
22.6
44.2
43.7
39.1
37.6
39.5
40.0
35.5
48.5
26.0
36.0
42.1
53.5
41.0
21.1
28.4
26.4
35.6
30.3
23.3
31.2
31.1
17.6
19.2
35.7
29.8
32.6
14.8
29.0
24.2
25.5
20.6
19.9
27.9
8.5
14.9
14.1
17.5
17.3
10.9
17.5
12.9
11.3
23.9
23.1
18.2
36.7
34.9
32.6
32.1
34.0
35.7
31.4
41.4
22.9
28.9
35.0
44.2
7.1
4.1
1.1
8.9
19.4
1.3
5.8
8.2
8.2
4.4
2.9
5.3
7.4
4.5
2.6
5.1
3.4
2.5
3.3
2.5
4.5
1.3
1.0
3.2
3.0
3.7
2.7
4.5
2.0
2.1
5.8
3.9
2.9
12.1
13.9
20.9
9.7
12.5
8.6
7.3
41.1
5.9
6.4
15.0
20.6
6.3
3.7
1.1
8.1
15.9
1.3
5.3
7.1
7.1
3.7
2.7
4.9
6.2
4.0
2.2
4.5
3.1
2.3
3.3
2.3
3.9
1.1
0.9
2.6
2.6
3.1
2.2
3.7
1.8
1.8
4.7
3.4
2.6
10.1
11.3
19.4
9.2
12.1
7.5
6.6
35.8
5.5
6.0
13.4
18.2
14.5
18.1
2.6
27.8
49.8
3.3
22.2
22.6
21.2
20.2
13.3
13.1
21.5
13.2
16.4
16.3
11.8
8.0
14.3
12.0
12.7
14.5
6.0
19.2
13.9
17.9
15.6
21.3
12.0
14.6
17.4
14.2
12.9
29.4
35.2
55.2
27.3
34.0
22.9
21.4
88.0
23.4
17.9
36.8
40.4
15.4
17.4
3.8
32.2
49.3
4.2
24.0
24.3
22.9
20.8
14.5
13.6
22.6
13.0
16.1
16.5
12.9
9.3
16.3
11.8
14.9
14.4
6.5
20.4
15.9
19.3
21.8
23.1
14.7
16.8
21.8
15.7
14.2
30.0
35.7
61.8
29.4
36.2
22.5
22.1
92.5
24.7
21.3
40.4
43.7
Company
M&M Fin.
Muthoot Fin
PNB Housing
Repco Home
Shriram City Union
Shriram Trans.
Aggregate
Capital Goods
ABB
Bharat Elec.
BHEL
Blue Star
CG Cons. Elec.
CG Power & Indu.
Cummins
GE T&D
Havells
K E C Intl
L&T
Siemens
Solar Ind
Thermax
Va Tech Wab.
Voltas
Aggregate
Cement
Ambuja Cem.
ACC
Birla Corp.
Dalmia Bharat
Grasim Inds.
India Cem
J K Cements
JK Lakshmi Ce
Ramco Cem
Orient Cem
Prism Cem
Sagar Cements
Sanghi Inds.
Shree Cem
Ultratech
Aggregate
Consumer
Asian Paints
Britannia
Colgate
Dabur
Emami
Godrej Cons.
GSK Cons.
HUL
ITC
Jyothy Lab
Marico
Nestle
Reco
Buy
Neutral
Buy
Buy
Buy
Buy
FY20E
23.1
48.1
88.8
50.0
173.7
127.6
Sell
Buy
Sell
Neutral
Buy
Neutral
Buy
Neutral
Buy
Neutral
Buy
Neutral
Neutral
Neutral
Buy
Neutral
1,397
181
98
818
279
91
922
437
550
381
1,249
1,259
1,171
1,217
621
647
1,230
210
78
685
260
90
1,150
440
620
350
1,440
1,313
1,120
930
745
580
-12
16
-20
-16
-7
-1
25
1
13
-8
15
4
-4
-24
20
-10
19.8
7.1
2.9
16.5
5.2
1.4
25.3
9.4
11.5
14.3
46.8
19.8
26.2
29.9
34.5
17.5
28.3
8.0
2.3
24.4
6.5
2.3
33.5
11.2
14.3
17.6
54.3
31.0
31.3
34.4
37.2
19.6
34.1
8.6
3.5
31.0
7.8
3.0
39.6
14.0
17.7
21.7
65.1
35.3
39.3
37.3
41.9
22.4
Neutral
Neutral
Buy
Buy
Neutral
Neutral
Buy
Buy
Buy
Buy
Buy
Not Rated
Buy
Buy
Buy
268
314
1,737 1,797
1,227 1,435
3,115 3,517
1,137 1,302
180
188
1,117 1,324
442
512
772
853
167
205
116
130
913
-
136
157
17,951 21,852
4,255 4,906
17
3
17
13
14
4
19
16
10
23
13
16
22
15
6.9
52.2
32.2
60.8
81.9
5.8
47.8
12.1
27.1
6.3
2.7
25.2
5.8
486.2
102.2
8.4
71.6
56.7
83.7
116.8
10.5
61.8
19.1
35.1
9.1
5.0
50.6
8.9
499.3
147.1
10.5
84.5
61.6
111.7
133.5
12.1
79.1
25.2
44.7
15.2
6.6
70.6
12.0
751.1
184.0
Neutral
Buy
Buy
Buy
Buy
Neutral
Neutral
Buy
Neutral
Neutral
Neutral
Neutral
1,143
4,666
1,097
350
1,311
980
6,477
1,339
261
380
325
7,860
1,280
6,100
1,355
410
1,435
1,015
5,400
1,500
280
365
340
7,750
12
31
23
17
9
4
-17
12
7
-4
5
-1
21.6
84.5
23.4
7.7
26.6
21.2
160.8
22.8
9.1
8.4
6.2
128.6
25.8
106.9
28.1
9.3
33.2
24.5
182.3
27.6
10.0
10.5
7.7
146.9
31.1
133.8
33.7
10.9
38.6
27.4
206.5
32.4
11.4
13.1
9.3
177.7
3 January 2018
21

Click excel icon
for detailed
valuation guide
CMP
TP
% Upside
EPS (INR)
(INR)
(INR) Downside FY18E FY19E
24,433 25,580
5
296.6 413.1
297
275
-7
8.9
12.4
889
975
10
17.2
20.8
9,388 9,267
-1
151.5 176.7
215
-
3.5
6.4
1,027 1,320
28
14.7
18.0
3,593 2,970
-17
34.9
53.7
Valuation snapshot
P/E (x)
P/B (x)
ROE (%)
FY19E FY20E FY19E FY20E FY19E FY20E
59.1
44.9
26.2
21.3
44.4
47.4
24.0
17.7
3.0
2.6
13.3
15.6
42.8
37.0
9.3
7.7
23.9
22.7
53.1
44.8
30.6
25.6
62.9
62.3
33.6
22.1
2.8
2.5
8.5
11.9
57.2
46.1
8.8
7.6
16.5
17.7
66.9
48.8
14.0
10.2
20.9
20.9
38.9
33.2
11.0
9.9
28.3
29.7
21.2
24.5
23.0
13.4
53.6
18.0
22.4
24.7
20.9
31.6
13.8
15.0
44.7
23.6
13.8
20.5
29.8
20.5
13.1
25.0
22.7
22.0
34.5
9.9
21.3
29.3
17.6
17.8
20.1
18.6
12.2
29.0
16.2
18.2
20.6
16.7
18.4
11.7
10.3
40.5
18.9
11.8
15.3
26.0
16.2
10.5
20.4
17.8
17.9
15.2
11.6
19.3
25.0
16.4
13.4
19.9
11.0
18.2
22.4
12.1
27.1
23.2
19.7
7.2
7.5
11.2
21.2
24.5
13.7
3.9
4.4
5.3
2.7
5.9
4.3
3.1
4.9
2.8
1.2
2.5
2.2
14.0
2.5
2.4
2.4
5.3
3.8
2.0
3.3
4.3
3.4
2.3
1.2
3.4
3.5
2.1
2.3
3.4
2.2
3.1
11.5
2.9
2.5
3.5
2.6
1.2
0.9
2.4
3.2
5.2
4.5
3.3
3.8
4.3
2.2
5.1
3.5
2.7
4.4
2.4
1.1
2.1
1.9
14.0
2.3
2.1
2.2
4.7
3.1
1.7
2.9
3.7
2.9
2.0
1.1
2.9
3.1
1.8
2.0
3.1
2.1
2.9
7.6
2.4
2.3
3.1
2.2
1.0
0.8
2.1
2.8
4.3
3.4
19.8
19.4
25.7
22.3
11.0
26.1
13.6
21.2
14.1
3.9
18.4
15.4
31.4
11.3
19.2
12.5
17.7
20.5
17.0
13.7
19.9
15.3
7.0
12.9
17.5
12.5
11.7
15.4
14.1
18.2
14.2
34.9
22.2
0.2
10.1
5.2
15.3
10.6
19.3
12.6
17.0
24.8
20.2
20.3
25.5
20.0
17.7
23.7
14.5
22.4
15.4
6.3
18.1
19.7
34.6
12.7
18.9
15.0
18.3
21.3
17.8
15.1
22.2
16.3
14.2
9.9
16.3
13.0
11.3
15.9
16.3
19.4
15.9
40.7
21.6
8.7
14.2
12.3
15.5
10.9
20.0
14.0
19.1
28.3
Company
Reco
Page Inds
Buy
Parag Milk
Neutral
Pidilite Ind.
Buy
P&G Hygiene
Neutral
Prabhat Dairy
Not Rated
United Brew
Buy
United Spirits
Neutral
Aggregate
Healthcare
Alembic Phar
Neutral
Alkem Lab
Buy
Ajanta Pharma
Buy
Aurobindo
Buy
Biocon
Neutral
Cadila
Buy
Cipla
Neutral
Divis Lab
Neutral
Dr Reddy’s
Neutral
Fortis Health
Buy
Glenmark
Neutral
Granules
Buy
GSK Pharma
Neutral
IPCA Labs
Neutral
Jubilant Life
Buy
Lupin
Buy
Sanofi India
Buy
Shilpa Medicare
Buy
Strides Shasun
Buy
Sun Pharma
Buy
Torrent Pharma
Neutral
Aggregate
Infrastructure
Ashoka Buildcon
Buy
IRB Infra
Neutral
KNR Constructions Buy
Sadbhav
Buy
Engineering
Aggregate
Logistics
Allcargo Logistics Buy
Concor
Neutral
Gateway Distriparks Buy
Aggregate
Media
Dish TV
Buy
D B Corp
Buy
Den Net.
Neutral
Ent.Network
Buy
Hathway Cable
Buy
Hind. Media
Buy
HT Media
Neutral
Jagran Prak.
Buy
Music Broadcast
Buy
PVR
Buy
Prime Focus
Buy
FY20E
544.5
16.8
24.0
209.4
9.7
22.3
73.6
529
2,195
1,476
672
541
428
607
1,079
2,408
155
593
134
2,458
588
761
876
4,694
613
817
572
1,396
540
2,500
1,792
900
485
555
600
1,100
2,575
185
650
200
2,500
550
861
1,000
5,000
797
1,214
610
1,400
2
14
21
34
-10
30
-1
2
7
19
10
49
2
-7
13
14
7
30
49
7
0
21.6
68.0
52.7
44.6
6.1
17.5
21.1
32.4
60.6
1.9
37.9
6.8
44.2
17.8
44.2
37.6
140.1
18.1
36.3
14.4
50.0
24.9
89.5
64.1
50.3
10.1
23.7
27.0
43.7
115.2
4.9
42.8
9.0
54.9
25.0
55.0
42.7
157.4
29.9
62.5
22.9
61.4
29.7
109.1
79.2
55.3
18.6
26.4
33.3
52.4
144.0
8.4
50.5
13.0
60.6
31.1
64.4
57.1
180.5
37.8
77.9
28.0
78.5
244
229
309
426
260
240
320
435
7
5
4
2
1.8
22.9
13.3
14.3
7.1
23.2
14.5
14.5
16.0
19.7
16.0
17.0
205
1,356
234
215
1,496
282
5
10
20
10.9
42.7
8.8
13.3
55.2
18.4
15.3
68.1
21.3
15.5
24.6
12.7
22.0
38.6
14.1
1,530.1
36.8
51.6
8.4
8.6
13.4
26.7
32.7
20.5
85
357
109
739
39
255
102
180
378
1,403
126
106
430
90
910
47
302
113
225
469
1,640
130
25
20
-17
23
20
18
10
25
24
17
3
0.6
21.7
-2.9
11.6
-0.2
25.6
10.4
11.3
8.7
27.1
3.1
2.2
25.4
0.1
20.1
0.8
30.2
11.9
13.4
14.1
43.0
6.1
3.8
29.6
4.0
31.8
2.0
35.6
13.6
16.2
17.8
57.3
9.2
3 January 2018
22

Click excel icon
for detailed
valuation guide
CMP
(INR)
26
996
579
TP
% Upside
EPS (INR)
(INR) Downside FY18E FY19E FY20E
27
5
-0.8
0.1
0.6
1,005
1
28.1
35.7
41.8
690
19
14.4
17.3
20.6
Valuation snapshot
P/E (x)
P/B (x)
ROE (%)
FY19E FY20E FY19E FY20E FY19E FY20E
203.1
39.7
4.7
4.2
2.4
11.3
27.9
23.8
8.2
7.4
30.7
32.6
33.4
28.0
6.1
5.1
19.6
19.9
26.9
21.2
4.8
4.1
17.9
19.4
10.3
9.3
447.3
10.6
15.5
11.7
30.1
10.3
7.4
14.9
10.5
9.8
15.6
26.1
17.2
9.5
9.0
28.9
20.3
9.6
9.3
8.4
15.1
13.7
11.2
65.4
25.4
53.2
45.7
14.6
13.9
21.0
15.2
14.2
16.3
17.7
16.5
12.8
14.2
24.3
18.4
14.7
16.4
12.6
17.3
100.0
10.1
9.7
49.8
11.6
15.1
11.2
21.1
9.3
7.1
12.3
10.1
9.2
14.9
20.3
15.9
9.0
8.5
24.9
20.1
9.2
9.1
8.7
12.4
11.8
10.5
49.6
19.9
42.6
36.2
13.1
12.9
18.4
13.5
11.0
13.9
14.2
14.6
11.5
12.0
20.2
16.7
12.2
14.3
10.6
15.4
60.9
1.6
3.5
0.7
2.0
1.5
1.8
1.0
2.7
1.7
1.8
1.7
2.3
1.9
5.2
2.2
2.2
1.4
5.7
4.7
1.7
0.9
1.1
3.3
1.7
1.6
13.7
4.2
12.9
9.6
2.5
3.2
4.3
3.2
1.8
4.1
3.5
2.7
2.0
2.7
7.1
5.5
2.3
2.5
2.1
3.9
3.0
1.4
2.8
0.6
1.7
1.4
1.7
1.0
2.1
1.5
1.6
1.5
2.0
1.8
4.3
2.0
1.9
1.3
4.9
4.3
1.5
0.9
1.0
2.8
1.5
1.4
14.3
3.6
11.9
8.6
2.3
3.0
3.7
2.9
1.6
3.3
3.1
2.5
1.9
2.6
4.7
4.9
2.1
2.3
1.8
3.5
2.8
16.6
42.6
0.1
20.3
9.7
15.9
3.5
29.7
23.8
12.9
15.8
25.5
12.6
21.7
13.7
24.8
16.4
21.4
24.4
18.5
10.3
12.7
23.6
12.9
13.9
20.9
17.5
25.5
20.9
17.3
24.4
22.4
22.4
13.8
27.5
20.7
16.8
16.4
19.8
32.4
32.2
17.0
16.3
17.4
22.5
3.0
14.6
32.2
1.3
15.8
9.3
15.4
4.8
25.4
22.0
14.0
14.7
23.0
12.2
23.3
13.4
22.6
15.7
21.1
22.5
16.9
10.0
11.8
24.2
13.5
13.6
28.9
19.3
29.1
23.8
17.5
23.9
21.7
22.8
15.5
26.2
23.2
17.7
17.1
22.9
28.2
31.0
18.2
16.6
18.0
22.6
4.8
Company
Siti Net.
Sun TV
Zee Ent.
Aggregate
Metals
Hindalco
Hind. Zinc
JSPL
JSW Steel
Nalco
NMDC
SAIL
Rain Industries
Vedanta
Tata Steel
Aggregate
Oil & Gas
BPCL
GAIL
Gujarat Gas
Gujarat St. Pet.
HPCL
IOC
IGL
Mahanagar Gas
MRPL
Oil India
ONGC
PLNG
Reliance Ind.
Aggregate
Retail
Jubilant Food
PC Jeweller
Titan Co.
Aggregate
Technology
Cyient
HCL Tech.
Hexaware
Infosys
KPIT Tech
L&T Infotech
Mindtree
Mphasis
NIIT Tech
Persistent Sys
Tata Elxsi
TCS
Tech Mah
Wipro
Zensar Tech
Aggregate
Telecom
Bharti Airtel
Reco
Neutral
Buy
Buy
Buy
Neutral
Buy
Buy
Neutral
Buy
Sell
Buy
Buy
Neutral
272
310
203
264
85
149
92
400
328
729
326
322
209
297
87
187
43
492
394
672
20
4
3
12
2
26
-53
23
20
-8
18.6
22.6
-15.1
19.7
4.6
13.3
-2.7
25.5
25.4
53.8
26.4
33.5
0.5
24.9
5.5
12.7
3.1
38.9
44.4
48.8
26.9
32.1
4.1
22.9
5.7
13.2
4.4
43.0
46.3
59.2
Buy
Sell
Buy
Neutral
Buy
Buy
Buy
Neutral
Sell
Buy
Buy
Buy
Buy
500
494
846
223
406
386
335
1,095
125
372
197
253
911
643
378
1,011
184
579
541
404
1,219
110
418
227
312
1,077
29
-24
20
-17
42
40
20
11
-12
12
15
23
18
42.4
25.4
20.4
12.5
37.9
41.9
10.1
54.4
10.4
28.9
19.7
15.0
58.3
51.3
31.7
32.4
13.0
42.7
42.7
11.6
53.8
13.0
39.9
23.4
16.7
66.5
54.4
33.2
41.7
14.0
45.3
45.4
13.5
54.5
13.7
41.1
22.7
20.3
77.0
Sell
Buy
Buy
1,794
467
845
1,270
490
850
-29
5
1
21.4
15.1
12.5
27.4
18.4
15.9
36.2
23.5
19.9
Buy
Neutral
Neutral
Buy
Neutral
Buy
Buy
Neutral
Neutral
Buy
Buy
Neutral
Buy
Neutral
Buy
573
892
340
1,030
190
1,148
604
733
644
708
976
2,634
512
319
861
600
970
270
1,100
160
1,200
600
670
600
780
1,004
2,450
560
280
1,020
5
9
-21
7
-16
5
-1
-9
-7
10
3
-7
9
-12
18
35.0
62.2
16.3
64.4
11.7
65.6
28.7
41.6
43.7
42.4
33.8
129.7
35.0
18.9
51.4
39.3
64.3
16.2
67.8
13.3
70.4
34.1
44.4
50.3
49.8
40.2
143.5
34.8
19.4
68.2
43.8
69.2
18.5
76.1
17.3
82.3
42.6
50.1
56.1
59.2
48.4
157.5
41.9
22.3
80.9
Buy
516
680
32
2.8
5.2
8.5
3 January 2018
23

Click excel icon
for detailed
valuation guide
CMP
(INR)
378
101
671
TP
(INR)
440
110
780
% Upside
EPS (INR)
Downside FY18E FY19E
16
16.6
19.0
9
-17.1
-19.2
16
4.4
16.0
Valuation snapshot
P/E (x)
P/B (x)
ROE (%)
FY19E FY20E FY19E FY20E FY19E FY20E
19.8
18.0
4.5
4.3
22.7
24.3
NM
NM
3.1
5.8
-45.9 -64.4
42.0
22.3
10.1
7.0
27.4
37.0
-381.0 142.7
3.4
3.5
-0.9
2.4
13.1
10.3
27.3
10.3
11.4
9.8
12.0
11.5
26.7
66.4
39.1
20.4
29.1
18.7
37.1
25.2
15.8
11.1
51.3
13.2
30.8
23.2
19.7
16.5
13.3
43.7
26.5
23.9
18.6
29.0
36.8
9.6
44.4
39.7
11.0
9.5
24.7
8.7
10.1
9.4
11.6
10.2
19.0
48.1
33.6
17.3
28.5
17.9
28.9
19.8
11.0
9.6
44.1
11.2
23.2
19.4
16.7
14.0
11.4
34.3
23.4
18.7
14.7
23.9
27.3
7.6
38.5
35.4
6.2
1.1
1.4
1.1
1.3
1.6
1.8
1.8
2.8
14.1
5.8
1.6
26.3
4.1
4.5
7.2
6.7
1.9
6.7
3.4
3.9
3.2
6.3
4.1
2.2
5.6
5.6
2.3
2.9
4.3
7.1
1.3
8.7
10.3
5.9
1.0
1.3
1.1
1.2
1.4
1.6
1.7
2.5
11.7
5.1
1.6
24.1
3.5
4.0
5.7
6.3
1.6
6.0
2.9
3.5
2.8
5.3
3.5
1.9
4.7
4.7
2.2
2.5
3.8
5.7
1.2
7.6
8.3
47.7
11.1
5.0
10.8
11.9
17.4
15.9
16.1
10.9
22.9
15.7
8.0
94.6
23.4
12.9
31.5
43.3
18.5
13.7
27.4
13.2
14.4
34.5
26.9
17.8
16.5
22.9
10.5
16.3
15.5
21.5
14.5
20.7
28.8
53.7
10.9
5.5
12.4
12.5
16.0
14.5
16.8
14.1
26.6
16.1
9.4
88.2
21.1
14.8
32.0
59.2
17.8
14.3
27.7
15.8
15.3
34.6
27.2
17.9
17.7
21.7
11.9
18.0
16.8
23.1
16.2
21.1
26.0
Company
Reco
Bharti Infratel
Neutral
Idea Cellular
Buy
Tata Comm
Buy
Aggregate
Utiltites
Coal India
Buy
CESC
Buy
JSW Energy
Sell
NHPC
Buy
NTPC
Buy
Power Grid
Buy
Tata Power
Sell
Aggregate
Others
Arvind
Neutral
Avenue Supermarts Sell
Bata India
Sell
BSE
Neutral
Castrol India
Buy
Coromandel Intl
Buy
Delta Corp
Buy
Eveready Inds.
Buy
Interglobe
Neutral
Indo Count
Neutral
Info Edge
Buy
Kaveri Seed
Buy
Manpasand
Buy
MCX
Buy
Monsanto
Buy
Navneet Education Buy
Oberoi Realty
Buy
Quess Corp
Buy
PI Inds.
Buy
Piramal Enterp.
Buy
SRF
Buy
S H Kelkar
Buy
Team Lease Serv. Buy
Trident
Buy
TTK Prestige
Neutral
V-Guard
Neutral
FY20E
21.0
-16.0
30.1
270
1,053
90
32
179
201
99
335
1,360
49
37
211
261
72
24
29
-45
16
18
30
-28
17.5
89.1
4.0
2.4
13.4
17.4
7.4
20.7
102.1
3.3
3.1
15.7
20.4
8.3
24.6
110.7
3.6
3.7
17.8
21.3
8.5
441
1,159
753
940
191
542
299
439
1,203
118
1,345
539
463
908
2,500
160
482
1,178
944
2,845
1,948
289
2,360
88
7,819
236
425
873
578
1,100
234
523
257
400
1,291
128
1,300
738
492
1,300
3,293
209
580
1,170
890
3,266
1,992
301
2,500
114
5,281
167
-4
-25
-23
17
22
-4
-14
-9
7
8
-3
37
6
43
32
31
20
-1
-6
15
2
4
6
29
-32
-29
10.5
12.0
15.9
45.3
6.6
24.1
5.7
14.3
63.0
8.0
23.6
34.1
9.3
26.5
105.0
7.6
24.8
22.7
29.9
79.6
76.7
6.3
43.2
7.2
137.8
4.5
16.5
17.5
19.3
46.1
6.6
29.0
8.0
17.4
75.9
10.7
26.2
41.0
15.0
39.2
126.6
9.7
36.2
27.0
35.6
119.1
104.9
10.0
64.2
9.2
176.1
6.0
23.2
24.1
22.4
54.5
6.7
30.3
10.3
22.1
109.8
12.4
30.5
48.1
20.0
46.8
149.9
11.4
42.3
34.3
40.3
151.7
132.7
12.1
86.3
11.6
203.2
6.7
3 January 2018
24

MOSL Universe stock performance
Company
Automobiles
Amara Raja
Ashok Ley.
Bajaj Auto
Bharat Forge
Bosch
CEAT
Eicher Mot.
Endurance Tech.
Escorts
Exide Ind
Hero Moto
M&M
Mahindra CIE
Maruti Suzuki
Motherson Sumi
Tata Motors
TVS Motor
Banks - Private
Axis Bank
DCB Bank
Equitas Hold.
Federal Bank
HDFC Bank
ICICI Bank
IDFC Bank
IndusInd
J&K Bank
Kotak Mah. Bk
RBL Bank
South Indian
Yes Bank
Banks - PSU
BOB
BOI
Canara
Indian Bk
PNB
SBI
Union Bk
NBFCs
Aditya Birla Cap
Bajaj Fin.
Capital First
Cholaman.Inv.&Fn
Dewan Hsg.
GRUH Fin.
HDFC
HDFC Stand. Life
Indiabulls Hsg
L&T Fin.Holdings
LIC Hsg Fin
M&M Fin.
Muthoot Fin
PNB Housing
1 Day (%)
-0.5
3.7
0.0
0.5
-0.3
-1.2
-4.0
0.6
-0.2
0.6
-0.6
0.9
-0.6
-1.2
-0.1
3.2
1.2
-0.9
-1.8
-0.7
-1.0
0.8
-0.4
-1.6
1.1
4.3
0.1
0.6
-1.4
-0.5
-2.3
-1.6
-2.6
-0.2
-1.9
-1.4
-2.1
-0.8
-0.2
0.4
-1.9
-1.3
-0.2
0.9
1.4
-2.8
-1.2
-0.5
-1.8
-2.4
-1.7
1M (%)
7.1
2.8
2.5
6.1
-1.3
10.1
-2.1
5.5
12.2
7.8
3.9
6.8
3.8
10.9
5.8
9.9
7.1
4.9
7.1
3.9
-0.7
1.6
1.3
-1.1
-1.1
9.9
-0.2
-1.5
-2.2
1.7
-5.9
-10.7
-2.9
-4.0
-2.9
-3.1
-10.1
-3.7
0.6
0.4
0.9
-2.9
-2.3
2.6
6.2
3.4
1.9
-1.4
4.3
4.0
-1.7
12M (%)
-7.4
52.3
26.9
57.3
-6.5
62.7
27.5
137.0
140.8
20.7
23.7
22.9
36.8
74.6
73.0
-9.9
111.8
25.3
77.2
-2.5
62.0
56.4
35.1
-11.1
51.2
36.6
40.4
52.0
73.9
36.2
5.9
55.9
38.0
68.8
43.9
24.3
13.2
Company
Repco Home
Shriram City Union
Shriram Trans.
Capital Goods
ABB
Bharat Elec.
BHEL
Blue Star
CG Cons. Elec.
CG Power & Inds Sol.
Cummins
GE T&D
Havells
K E C Intl
L&T
Siemens
Solar Ind
Thermax
Va Tech Wab.
Voltas
Cement
Ambuja Cem.
ACC
Birla Corp.
Dalmia Bharat
Grasim Inds.
India Cem
J K Cements
JK Lakshmi Ce
Ramco Cem
Orient Cem
Prism Cem
Sagar Cements
Sanghi Inds.
Shree Cem
Ultratech
Consumer
Asian Paints
Britannia
Colgate
Dabur
Emami
Godrej Cons.
GSK Cons.
HUL
ITC
Jyothy Lab
Marico
Nestle
Page Inds
Parag Milk
Pidilite Ind.
P&G Hygiene
Prabhat Dairy
United Brew
1 Day (%)
-1.1
0.0
-1.2
0.0
-0.2
3.2
-0.1
2.8
-2.3
0.9
-2.0
-1.0
0.0
-1.0
1.7
-1.1
0.8
-1.4
-0.2
0.0
0.1
3.3
-2.2
-0.7
-0.3
-0.2
0.5
-1.2
-0.6
-0.8
2.8
0.3
0.4
-0.1
-0.3
-1.5
-0.2
0.0
-1.7
-0.8
-0.5
-0.6
-0.8
0.7
1.2
0.1
-2.7
0.0
-1.3
0.3
-2.9
-2.8
1M (%)
12.2
3.1
9.9
0.5
-1.8
7.9
9.8
4.0
7.7
8.9
5.7
8.1
21.5
3.0
7.5
1.6
10.5
4.1
5.0
1.5
3.6
7.9
0.1
-1.0
7.1
13.3
8.1
11.2
3.1
4.2
6.5
15.2
4.5
2.0
0.6
-2.8
6.6
2.4
-0.7
0.6
6.6
7.0
2.2
-1.6
4.9
2.0
12.0
22.6
4.4
-1.1
32.0
-2.8
12M (%)
21.7
13.3
64.4
34.3
45.8
19.8
70.0
86.8
51.0
11.8
47.3
60.6
173.2
37.7
12.5
71.0
64.1
30.2
96.9
25.0
28.4
83.3
113.5
56.4
47.1
51.6
21.1
38.3
32.1
44.9
43.4
159.3
23.7
26.5
26.5
61.8
21.6
26.1
35.1
28.8
28.4
62.4
8.2
12.7
27.8
31.1
75.9
13.1
47.6
34.2
119.1
32.4
98.0
21.9
36.3
133.4
51.1
39.6
74.3
93.3
6.1
68.3
60.8
57.3
3 January 2018
25

MOSL Universe stock performance
Company
United Spirits
Healthcare
Alembic Phar
Alkem Lab
Ajanta Pharma
Aurobindo
Biocon
Cadila
Cipla
Divis Lab
Dr Reddy’s
Fortis Health
Glenmark
Granules
GSK Pharma
IPCA Labs
Jubilant Life
Lupin
Sanofi India
Shilpa Medicare
Strides Shasun
Sun Pharma
Torrent Pharma
Infrastructure
Ashoka Buildcon
IRB Infra.Devl.
KNR Construct.
Sadbhav Engg.
Logistics
Allcargo Logistics
Concor
Gateway Distriparks
Media
Dish TV
D B Corp
Den Net.
Ent.Network
Hathway Cab.
Hind. Media
HT Media
Jagran Prak.
Music Broadcast
PVR
Prime Focus
Siti Net.
Sun TV
Zee Ent.
Metals
Hindalco
Hind. Zinc
JSPL
JSW Steel
Nalco
NMDC
Rain Industries
1 Day (%)
-1.3
-0.3
-0.5
-1.3
-1.9
0.6
-1.1
-0.8
-1.8
-0.2
-1.8
-0.5
-2.0
0.0
-1.3
-2.7
-1.0
0.1
-1.0
-0.7
-0.4
0.1
-0.5
-2.2
-3.4
-0.6
-2.0
-1.1
-1.8
4.3
-0.1
0.2
-1.5
-1.5
0.8
0.8
0.2
-0.3
-1.5
0.0
-0.2
0.0
-0.3
0.3
0.3
-1.4
-0.5
0.0
5.6
7.5
1M (%)
11.9
3.8
11.3
10.4
-0.1
21.1
0.3
1.6
4.3
7.9
7.9
6.9
8.0
0.0
10.6
8.9
7.6
6.9
-5.4
1.7
8.7
9.2
0.1
3.4
14.4
12.5
13.3
5.9
-4.5
5.8
-1.1
8.2
-0.6
-3.3
4.0
0.6
9.9
-0.4
9.8
27.5
-0.6
16.5
3.7
15.4
4.4
20.4
5.0
5.2
15.3
15.6
12M (%)
85.5
-11.7
35.5
-19.1
-0.4
70.6
20.6
7.2
35.4
-22.0
-15.0
-33.0
24.4
-9.9
11.3
21.7
-41.8
8.9
-11.1
-23.6
-10.0
6.4
53.1
12.3
83.3
54.9
13.2
47.7
-4.8
0.4
-1.1
63.6
-9.0
9.5
-4.4
39.1
0.7
21.7
83.5
-31.7
98.6
27.8
71.7
19.3
188.7
61.8
28.5
15.9
628.0
Company
SAIL
Vedanta
Tata Steel
Oil & Gas
BPCL
GAIL
Gujarat Gas
Gujarat St. Pet.
HPCL
IOC
IGL
Mahanagar Gas
MRPL
Oil India
ONGC
PLNG
Reliance Ind.
Retail
Jubilant Food
PC Jeweller
Titan Co.
Technology
Cyient
HCL Tech.
Hexaware
Infosys
KPIT Tech
L&T Infotech
Mindtree
Mphasis
NIIT Tech
Persistent Sys
Tata Elxsi
TCS
Tech Mah
Wipro
Zensar Tech
Telecom
Bharti Airtel
Bharti Infratel
Idea Cellular
Tata Comm
Utiltites
Coal India
CESC
JSW Energy
NHPC Ltd
NTPC
Power Grid
Tata Power
Others
Arvind
Avenue Super.
Bata India
BSE
1 Day (%)
-1.0
0.5
0.7
-2.1
-1.2
0.3
-0.9
-2.0
-0.8
-1.3
-1.8
-2.0
-0.2
2.4
-1.2
0.0
1.0
-0.5
-1.0
-0.7
1.2
-0.5
-0.5
2.7
0.1
-0.3
-0.3
-1.2
-0.3
1.1
-0.8
1.9
0.4
-2.3
-2.2
2.1
-3.9
-1.1
1.5
-1.0
-1.3
-1.1
1.3
0.1
2.4
-1.3
-1.0
-0.1
1.0
1M (%)
17.4
14.2
7.1
0.8
8.3
-1.7
10.9
-0.7
-0.3
5.7
-0.1
1.5
3.2
9.6
3.7
0.2
2.4
19.3
4.9
1.9
7.5
0.2
7.4
18.1
13.5
13.9
1.7
1.9
8.0
6.4
0.1
8.4
10.2
1.5
6.8
-1.7
8.2
-1.3
-0.7
5.8
7.3
14.0
-1.3
-1.1
10.1
1.2
3.9
3.3
1.1
12M (%)
82.0
48.3
79.6
17.6
51.3
59.8
60.1
35.8
18.2
82.7
36.5
26.2
9.1
2.4
36.2
68.3
108.8
137.8
153.8
16.8
7.5
61.9
2.8
40.2
68.9
16.9
31.8
50.6
14.1
38.4
11.6
5.0
34.9
-8.8
66.0
9.9
34.4
6.5
-10.1
63.2
44.6
19.1
8.5
9.3
31.9
25.1
68.2
3 January 2018
26

MOSL Universe stock performance
Company
Others
Castrol India
Coromandel Intl
Delta Corp
Eveready Inds.
Interglobe
Indo Count
Info Edge
Kaveri Seed
Manpasand
MCX
Monsanto
Navneet Educat.
Oberoi Realty
PI Inds.
Piramal Enterp.
Quess Corp
SRF
S H Kelkar
Team Lease Serv.
Trident
V-Guard
1 Day (%)
-0.4
-3.2
-2.5
-0.8
0.1
-3.4
-2.5
-1.7
5.2
-1.2
0.3
-1.8
0.5
-1.9
0.0
2.1
-1.1
-1.4
-1.3
-1.3
-1.6
1M (%)
-4.7
6.4
14.1
1.4
6.3
3.8
3.9
0.3
18.0
-5.5
1.4
-3.8
1.6
-1.6
4.3
27.4
6.4
12.0
7.8
-1.0
4.6
12M (%)
-0.8
79.5
157.5
99.6
46.0
-30.3
51.6
31.2
67.4
-27.3
11.4
43.3
54.9
13.8
78.1
79.6
25.0
-5.5
170.0
50.9
102.6
3 January 2018
27

NOTES
3 January 2018
28

THEMATIC/STRATEGY RESEARCH GALLERY

REPORT GALLERY
RECENT INITIATING COVERAGE REPORTS
Rs

DIFFERENTIATED PRODUCT GALLERY

Disclosures:
The following Disclosures are being made in compliance with the SEBI Research Analyst Regulations 2014 (herein after referred to as the Regulations).
Motilal Oswal Securities Ltd. (MOSL) is a SEBI Registered Research Analyst having registration no. INH000000412. MOSL, the Research Entity (RE) as defined in the Regulations, is engaged in the business of providing Stock
broking services, Investment Advisory Services, Depository participant services & distribution of various financial products. MOSL is a subsidiary company of Motilal Oswal Financial Service Ltd. (MOFSL). MOFSL is a listed
public company, the details in respect of which are available on
www.motilaloswal.com.
MOSL is registered with the Securities & Exchange Board of India (SEBI) and is a registered Trading Member with National Stock
Exchange of India Ltd. (NSE) and Bombay Stock Exchange Limited (BSE), Metropolitan Stock Exchange Of India Ltd. (MSE) for its stock broking activities & is Depository participant with Central Depository Services Limited
(CDSL) & National Securities Depository Limited (NSDL) and is member of Association of Mutual Funds of India (AMFI) for distribution of financial products. Details of associate entities of Motilal Oswal Securities Limited are
available on the website at
http://onlinereports.motilaloswal.com/Dormant/documents/Associate%20Details.pdf
Pending Regulatory Enquiries against Motilal Oswal Securities Limited by SEBI:
SEBI pursuant to a complaint from client Shri C.R. Mohanraj alleging unauthorized trading, issued a letter dated 29th April 2014 to MOSL notifying appointment of an Adjudicating Officer as per SEBI regulations to hold
inquiry and adjudge violation of SEBI Regulations; MOSL requested SEBI to provide all documents, records, investigation report relied upon by SEBI which were referred in Show Cause Notice and also sought personal
hearing. The matter is currently pending.
MOSL, it’s associates, Research Analyst or their relative may have any financial interest in the subject company. MOSL and/or its associates and/or Research Analyst may have beneficial ownership of 1% or more securities in
the subject company at the end of the month immediately preceding the date of publication of the Research Report.
MOSL and its associate company(ies), their directors and Research Analyst and their relatives may; (a) from
time to time, have a long or short position in, act as principal in, and buy or sell the securities or derivatives thereof of companies mentioned herein. (b) be engaged in any other transaction involving such securities and earn
brokerage or other compensation or act as a market maker in the financial instruments of the company(ies) discussed herein or act as an advisor or lender/borrower to such company(ies) or may have any other potential
conflict of interests with respect to any recommendation and other related information and opinions.; however the same shall have no bearing whatsoever on the specific recommendations made by the analyst(s), as the
recommendations made by the analyst(s) are completely independent of the views of the associates of MOSL even though there might exist an inherent conflict of interest in some of the stocks mentioned in the research
report.
Research Analyst may have served as director/officer, etc. in the subject company in the last 12 month period. MOSL and/or its associates may have received any compensation from the subject company in the past
12 months.
In the last 12 months period ending on the last day of the month immediately preceding the date of publication of this research report, MOSL or any of its associates may have:
managed or co-managed public offering of securities from subject company of this research report,
received compensation for investment banking or merchant banking or brokerage services from subject company of this research report,
received compensation for products or services other than investment banking or merchant banking or brokerage services from the subject company of this research report.
Subject Company may have been a client of MOSL or its associates during twelve months preceding the date of distribution of the research report.
MOSL and it’s associates have not received any compensation or other benefits from the subject company or third party in connection with the research report. To enhance transparency, MOSL has incorporated a Disclosure
of Interest Statement in this document. This should, however, not be treated as endorsement of the views expressed in the report. MOSL and / or its affiliates do and seek to do business including investment banking with
companies covered in its research reports. As a result, the recipients of this report should be aware that MOSL may have a potential conflict of interest that may affect the objectivity of this report. Compensation of Research
Analysts is not based on any specific merchant banking, investment banking or brokerage service transactions.
Terms & Conditions:
This report has been prepared by MOSL and is meant for sole use by the recipient and not for circulation. The report and information contained herein is strictly confidential and may not be altered in any way, transmitted to,
copied or distributed, in part or in whole, to any other person or to the media or reproduced in any form, without prior written consent of MOSL. The report is based on the facts, figures and information that are considered
true, correct, reliable and accurate. The intent of this report is not recommendatory in nature. The information is obtained from publicly available media or other sources believed to be reliable. Such information has not
been independently verified and no guaranty, representation of warranty, express or implied, is made as to its accuracy, completeness or correctness. All such information and opinions are subject to change without notice.
The report is prepared solely for informational purpose and does not constitute an offer document or solicitation of offer to buy or sell or subscribe for securities or other financial instruments for the clients. Though
disseminated to all the customers simultaneously, not all customers may receive this report at the same time. MOSL will not treat recipients as customers by virtue of their receiving this report.
Analyst Certification
The views expressed in this research report accurately reflect the personal views of the analyst(s) about the subject securities or issues, and no part of the compensation of the research analyst(s) was, is, or will be directly or
indirectly related to the specific recommendations and views expressed by research analyst(s) in this report.
Disclosure of Interest Statement
Analyst ownership of the stock
Companies where there is interest
No
A graph of daily closing prices of securities is available at
www.nseindia.com, www.bseindia.com.
Research Analyst views on Subject Company may vary based on Fundamental research and Technical Research. Proprietary
trading desk of MOSL or its associates maintains arm’s length distance with Research Team as all the activities are segregated from MOSL research activity and therefore it can have an independent view with regards to
subject company for which Research Team have expressed their views.
Regional Disclosures (outside India)
This report is not directed or intended for distribution to or use by any person or entity resident in a state, country or any jurisdiction, where such distribution, publication, availability or use would be contrary to law,
regulation or which would subject MOSL & its group companies to registration or licensing requirements within such jurisdictions.
For Hong Kong:
This report is distributed in Hong Kong by Motilal Oswal capital Markets (Hong Kong) Private Limited, a licensed corporation (CE AYY-301) licensed and regulated by the Hong Kong Securities and Futures Commission (SFC)
pursuant to the Securities and Futures Ordinance (Chapter 571 of the Laws of Hong Kong) “SFO”. As per SEBI (Research Analyst Regulations) 2014 Motilal Oswal Securities (SEBI Reg No. INH000000412) has an agreement with
Motilal Oswal capital Markets (Hong Kong) Private Limited for distribution of research report in Hong Kong. This report is intended for distribution only to “Professional Investors” as defined in Part I of Schedule 1 to SFO. Any
investment or investment activity to which this document relates is only available to professional investor and will be engaged only with professional investors.” Nothing here is an offer or solicitation of these securities,
products and services in any jurisdiction where their offer or sale is not qualified or exempt from registration. The Indian Analyst(s) who compile this report is/are not located in Hong Kong & are not conducting Research
Analysis in Hong Kong.
For U.S.
Motilal Oswal Securities Limited (MOSL) is not a registered broker - dealer under the U.S. Securities Exchange Act of 1934, as amended (the"1934 act") and under applicable state laws in the United States. In addition MOSL is
not a registered investment adviser under the U.S. Investment Advisers Act of 1940, as amended (the "Advisers Act" and together with the 1934 Act, the "Acts), and under applicable state laws in the United States.
Accordingly, in the absence of specific exemption under the Acts, any brokerage and investment services provided by MOSL, including the products and services described herein are not available to or intended for U.S.
persons. This report is intended for distribution only to "Major Institutional Investors" as defined by Rule 15a-6(b)(4) of the Exchange Act and interpretations thereof by SEC (henceforth referred to as "major institutional
investors"). This document must not be acted on or relied on by persons who are not major institutional investors. Any investment or investment activity to which this document relates is only available to major institutional
investors and will be engaged in only with major institutional investors. In reliance on the exemption from registration provided by Rule 15a-6 of the U.S. Securities Exchange Act of 1934, as amended (the "Exchange Act") and
interpretations thereof by the U.S. Securities and Exchange Commission ("SEC") in order to conduct business with Institutional Investors based in the U.S., MOSL has entered into a chaperoning agreement with a U.S.
registered broker-dealer, Motilal Oswal Securities International Private Limited. ("MOSIPL"). Any business interaction pursuant to this report will have to be executed within the provisions of this chaperoning agreement.
The Research Analysts contributing to the report may not be registered /qualified as research analyst with FINRA. Such research analyst may not be associated persons of the U.S. registered broker-dealer, MOSIPL, and
therefore, may not be subject to NASD rule 2711 and NYSE Rule 472 restrictions on communication with a subject company, public appearances and trading securities held by a research analyst account.
For Singapore
Motilal Oswal Capital Markets Singapore Pte Limited is acting as an exempt financial advisor under section 23(1)(f) of the Financial Advisers Act(FAA) read with regulation 17(1)(d) of the Financial Advisors Regulations and is a
subsidiary of Motilal Oswal Securities Limited in India. This research is distributed in Singapore by Motilal Oswal Capital Markets Singapore Pte Limited and it is only directed in Singapore to accredited investors, as defined in
the Financial Advisers Regulations and the Securities and Futures Act (Chapter 289), as amended from time to time. In respect of any matter arising from or in connection with the research you could contact the following
representatives of Motilal Oswal Capital Markets Singapore Pte Limited:
Disclaimer:
The report and information contained herein is strictly confidential and meant solely for the selected recipient and may not be altered in any way, transmitted to, copied or distributed, in part or in whole, to any other person
or to the media or reproduced in any form, without prior written consent. This report and information herein is solely for informational purpose and may not be used or considered as an offer document or solicitation of
offer to buy or sell or subscribe for securities or other financial instruments. Nothing in this report constitutes investment, legal, accounting and tax advice or a representation that any investment or strategy is suitable or
appropriate to your specific circumstances. The securities discussed and opinions expressed in this report may not be suitable for all investors, who must make their own investment decisions, based on their own investment
objectives, financial positions and needs of specific recipient. This may not be taken in substitution for the exercise of independent judgment by any recipient. Each recipient of this document should make such investigations
as it deems necessary to arrive at an independent evaluation of an investment in the securities of companies referred to in this document (including the merits and risks involved), and should consult its own advisors to
determine the merits and risks of such an investment. The investment discussed or views expressed may not be suitable for all investors. Certain transactions -including those involving futures, options, another derivative
products as well as non-investment grade securities - involve substantial risk and are not suitable for all investors. No representation or warranty, express or implied, is made as to the accuracy, completeness or fairness of
the information and opinions contained in this document. The Disclosures of Interest Statement incorporated in this document is provided solely to enhance the transparency and should not be treated as endorsement of the
views expressed in the report. This information is subject to change without any prior notice. The Company reserves the right to make modifications and alternations to this statement as may be required from time to time
without any prior approval. MOSL, its associates, their directors and the employees may from time to time, effect or have effected an own account transaction in, or deal as principal or agent in or for the securities
mentioned in this document. They may perform or seek to perform investment banking or other services for, or solicit investment banking or other business from, any company referred to in this report. Each of these entities
functions as a separate, distinct and independent of each other. The recipient should take this into account before interpreting the document. This report has been prepared on the basis of information that is already
available in publicly accessible media or developed through analysis of MOSL. The views expressed are those of the analyst, and the Company may or may not subscribe to all the views expressed therein. This document is
being supplied to you solely for your information and may not be reproduced, redistributed or passed on, directly or indirectly, to any other person or published, copied, in whole or in part, for any purpose. This report is not
directed or intended for distribution to, or use by, any person or entity who is a citizen or resident of or located in any locality, state, country or other jurisdiction, where such distribution, publication, availability or use would
be contrary to law, regulation or which would subject MOSL to any registration or licensing requirement within such jurisdiction. The securities described herein may or may not be eligible for sale in all jurisdictions or to
certain category of investors. Persons in whose possession this document may come are required to inform themselves of and to observe such restriction. Neither the Firm, not its directors, employees, agents or
representatives shall be liable for any damages whether direct or indirect, incidental, special or consequential including lost revenue or lost profits that may arise from or in connection with the use of the information.
The
person accessing this information specifically agrees to exempt MOSL or any of its affiliates or employees from, any and all responsibility/liability arising from such misuse and agrees not to hold MOSL or any of its affiliates or
employees responsible for any such misuse and further agrees to hold MOSL or any of its affiliates or employees free and harmless from all losses, costs, damages, expenses that may be suffered by the person accessing this
information due to any errors and delays.
Registered Office Address: Motilal Oswal Tower, Rahimtullah Sayani Road, Opposite Parel ST Depot, Prabhadevi, Mumbai-400025; Tel No.: 022-3980 4263; www.motilaloswal.com. Correspondence Address: Palm Spring
Centre, 2nd Floor, Palm Court Complex, New Link Road, Malad (West), Mumbai- 400 064. Tel No: 022 3080 1000. Compliance Officer: Neeraj Agarwal, Email Id:
na@motilaloswal.com,
Contact No.:022-30801085.
Registration details of group entities.: MOSL: SEBI Registration: INZ000158836; CDSL: IN-DP-16-2015; NSDL: IN-DP-NSDL-152-2000; Research Analyst: INH000000412. AMFI: ARN 17397. Investment Adviser: INA000007100.
Motilal Oswal Asset Management Company Ltd. (MOAMC): PMS (Registration No.: INP000000670) offers PMS and Mutual Funds products. Motilal Oswal Wealth Management Ltd. (MOWML): PMS (Registration No.:
INP000004409) offers wealth management solutions. *Motilal Oswal Securities Ltd. is a distributor of Mutual Funds, PMS, Fixed Deposit, Bond, NCDs, Insurance and IPO products. * Motilal Oswal Commodities Broker Pvt. Ltd.
offers Commodities Products. * Motilal Oswal Real Estate Investment Advisors II Pvt. Ltd. offers Real Estate products. * Motilal Oswal Private Equity Investment Advisors Pvt. Ltd. offers Private Equity products
13 December 2016
29