12 January 2018
Market snapshot
Equities - India
Close
Chg .%
Sensex
34,503
0.2
Nifty-50
10,651
0.2
Nifty-M 100
21,719
0.3
Equities-Global
Close
Chg .%
S&P 500
2,768
0.7
Nasdaq
7,212
0.8
FTSE 100
7,763
0.2
DAX
13,203
-0.6
Hang Seng
12,296
0.1
Nikkei 225
23,710
-0.3
Commodities
Close
Chg .%
Brent (US$/Bbl)
69
0.1
Gold ($/OZ)
1,322
0.4
Cu (US$/MT)
7,103
-0.1
Almn (US$/MT)
2,165
-0.1
Currency
Close
Chg .%
USD/INR
63.7
0.1
USD/EUR
1.2
0.7
USD/JPY
111.3
-0.2
YIELD (%)
Close
1MChg
10 Yrs G-Sec
7.3
0.00
10 Yrs AAA Corp
7.6
-0.02
Flows (USD b)
11-Jan
MTD
FIIs
-0.1
0.2
DIIs
0.1
0.2
Volumes (INRb)
11-Jan
MTD*
Cash
406
403
F&O
10,203
5,861
Note: YTD is calendar year, *Avg
CY17%
29.3
29.9
50.9
CY17%
22.8
32.9
8.5
15.7
30.8
24.5
CY17%
25.1
14.3
28.8
27.2
CY17%
-6.4
13.6
-4.7
CY17%
0.7
0.1
CY17
7.7
14.0
YTD*
403
5,861
Today’s top research idea
MAS Financial (Initiating Coverage): Grassroots financier
An efficient player in high growth product segment
Run by first-generation entrepreneurs since 1995, MAS Financial Services
(MASFIN) is an NBFC operating out of six states, primarily Gujarat and
Maharashtra. A quintessential NBFC, it targets the middle and low income
customer segments.
Over the past five years, MASFIN’s AUM grew at a robust 35% CAGR to reach
INR37b. Growth was driven by their flagship product (MEL loans) and new
product such as SME loans. The company has impeccable track record of 39%
PAT CAGR over FY12-17 with consistent ROA (on AUM) of 2%+. At the same
time, the company has always maintained GNPL ratio & credit costs both close
to ~1% - among the best in our NBFC coverage.
Given a favorable backdrop, we expect the company to deliver 25% AUM CAGR
and 25% EPS CAGR over FY17-20E.
Research covered
Cos/Sector
MAS Financials
TCS
IndusInd Bank
Shree Cement
Hindustan Media
Results Expectation
Key Highlights
Grassroots financier
Recovery in Retail offset by muted BFS outlook and margin risks
Strong core operating performance, asset quality deteriorates slightly
Low-cost acquisition in the UAE aligns well with long-term strategy
Lackluster growth, but outlook improving
HT Media | Infosys
Piping hot news
SEBI ban on PW may hit audit of 77 firms, including Tata Steel, Hindalco
SEBI’s order banning the Price Waterhouse network of audit firms (PW firms)
from auditing listed clients for two years will affect 77 NSE-listed firms,
according to data compiled by Prime Database…
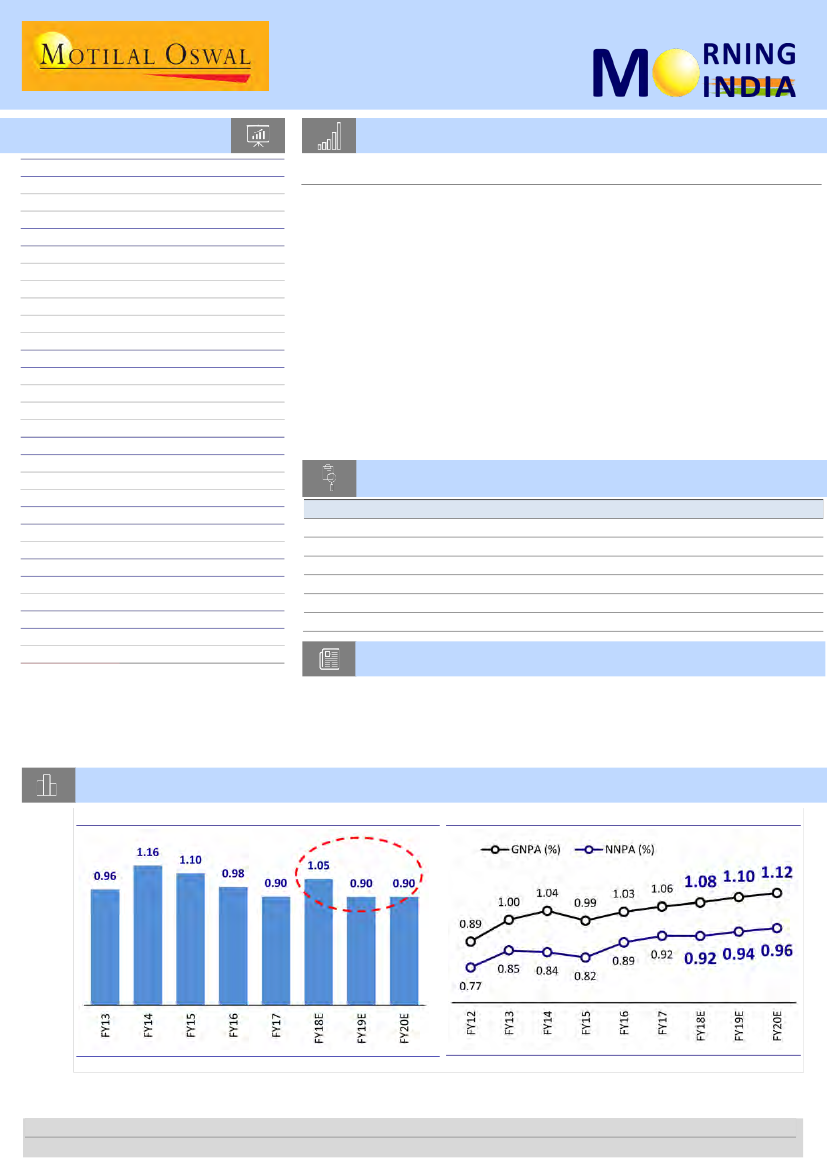
Chart of the Day: MAS Financial (Initiating Coverage)—Grassroots financier
We bake in stable credit costs through FY18-20
GNPA remains in the range of 1-1.2%
Research Team (Gautam.Duggad@MotilalOswal.com)
Motilal Oswal research is available on www.motilaloswal.com/Institutional-Equities, Bloomberg, Thomson Reuters, Factset and S&P Capital.
Investors are advised to refer through important disclosures made at the last page of the Research Report.

In the news today
Kindly click on textbox for the detailed news link
1
Reliance Jio planning its own
cryptocurrency called JioCoin
After disrupting the telecom
sector with its free offers and
hyper-competitive tariffs, Reliance
Jio Infocomm Ltd plans to create
its own cyptocurrency, JioCoin.
With Mukesh Ambani’s elder son
Akash Ambani leading the JioCoin
project,…
2
Binani Cement’s lenders approach NCLAT over corporate
guarantees
At least two lenders of Binani Cement Ltd, currently undergoing insolvency
proceedings, have moved the appellate bankruptcy tribunal after the
insolvency resolution professional (IRP) rejected their claims on corporate
guarantees worth Rs2,000 crore issued by the company to some
subsidiaries in the Binani group. According to two persons aware of the
matter who spoke on condition of anonymity, IDBI Bank and State Bank of
India (SBI) have now approached the National Company Law Appellate
Tribunal (NCLAT)…
3
NCLT orders shutting NRE Coke
but with a twist
National Company Law Tribunal's
Kolkata chapter has ordered
liquidation of Gujarat NRE Coke, a
company that failed to resolve the
Rs. 4,900 crore default case. But,
there is twist! For the first time
under Insolvency and Bankruptcy
Code,…
4
GST Council may lower rates
for farm gear, electric vehicles
next week
The GST Council may take up
rationalisation of the goods and
services tax (GST) rates for a
handful of items at its meeting
next week. These items include
bio-diesel buses, electric vehicles
and irrigation equipment. The GST
Council meeting will be its last one
before the presentation of the
Union Budget on February 1…
5
Capital First clarifies on IDFC
Bank merger
Capital First said late Thursday
that it explores various
opportunities on a continuous
basis amid market talk that the
Mumbai-based non-banking
finance company could be
considering a merger with IDFC
Bank, which is up for sale. "We
would like to clarify that the
Company evaluates various
opportunities on a continuous
basis and (that) the Company, as
the matter of policy, does not
comment on market
speculation," Capital First said in
a statement to the Bombay Stock
Exchange…
6
Direct-to-home (DTH) operator
Dish TV India Ltd on Thursday
pointed to the ongoing insolvency
proceedings against Videocon
group in the context of the delay in
its planned merger with Videocon
d2h. Dish TV and Videocon d2h had
announced a merger in November
2016. Earlier,…
7
ICICI Bank has rolled out a number
of initiatives as part of an
organisation-wide recast
programme aimed at establishing
itself as a workplace of choice for
younger workers amid increasing
disruption by smaller players. The
private sector lender has started
more frequent engagement of the
chief executive, Chanda Kochhar,…
Videocon-Dish TV merger may
get affected by insolvency case
against Videocon Industries
ICICI Bank in makeover mode
12 January 2018
2

Initiating Coverage | Sector: Financials
MAS Financial
BSE Sensex
34,503
S&P CNX
10,651
CMP: INR626
TP: INR740 (+18%)
Buy
Grassroots financier
An efficient player in high growth product segment
Stock Info
Bloomberg
Equity Shares (m)
52-Week Range (INR)
1, 6, 12 Rel. Per (%)
M.Cap. (INR b)
M.Cap. (USD b)
Avg Val, INRm
Free float (%)
MASFIN IN
55
701/564
-5/-/-
34.2
0.5
397
26.8
Financial snapshot (INRb)
Y/E MARCH
FY18E FY19E
NII
2,485 3,162
PPP
1,940 2,452
PAT
1,002 1,315
EPS (INR)
18.3 24.1
BV/Share (INR) 132.6 150.7
RoA on AUM, %
2.7
2.8
RoE (%)
19.8 17.0
Valuations
P/E (x)
34.1 26.0
P/BV (x)
4.7
4.2
Shareholding pattern (%)
As On
Promoter
DII
FII
Others
FII Includes depository receipts
MAS Financial Services (MASFIN) is an Ahmedabad-headquartered, non-deposit-taking
NBFC incorporated in 1995 by first-generation entrepreneurs, Mr. Kamlesh Gandhi and
Mr. Mukesh Gandhi. It operates out of six states, of which Gujarat and Maharashtra
account for bulk of the AUM. A quintessential NBFC, it targets the middle and low
income customer segments. Over the past five years, MASFIN’s AUM grew at a robust
35% CAGR to reach INR37b in 1HFY18. Growth was driven by their flagship product (MEL
loans) and new product such as SME loans. MEL and SME accounts for 83%+ of the total
AUM vs 64% in FY13. The company has impeccable track record of 39% PAT CAGR over
FY12-17 with consistent ROA (on AUM) of 2%+. Given a favorable backdrop, we expect
the company to deliver 25% AUM over FY17-20, resulting in 25% EPS CAGR over the
same time period.
FY20E
3,948
3,027
1,619
29.6
172.9
2.7
18.3
21.1
3.6
Present in high growth segments, with differentiated offering
MASFIN is present in high-growth segments like Micro-lending (57% of AUM),
MSME Lending (25%), Vehicle Finance (13%) and Housing Finance (5%). It has a
unique business model, with over 55% of AUM coming from on-lending to other
NBFCs and sourcing agents across focused product categories. AUM generated by
NBFCs is hypothecated to MASFIN. 35-40% of AUM is assigned to banks (for PSL).
The existing network offers immense growth opportunities and we expect the
company to focus on local area expertise rather than expanding aggressively.
MASFIN should deliver 25% AUM CAGR over FY17-20.
Sep-17
73.2
13.7
2.6
10.5
Strong risk management leading to superior asset quality
The company has consistently delivered GNPA ratio of 0.8-1.2%, despite change in
norms on NPA migration and macroeconomic factors outside management
control. Being a grassroots financier with strong local area knowledge, a unique
business model of on-lending to other financiers and hypothecation of portfolio,
and strong credit control, MASFIN maintains strong control over asset quality.
Credit cost (including standard asset provision) for the company stands at ~1% -
this is among the lowest in our NBFC coverage.
MAS Financial Services
Grassroots financier
RoA to improve; PAT CAGR of 35%+
Margin improvement, operating efficiency and controlled credit cost should drive
ROA improvement of 60bp+ and the company is expected to report 18%+ ROE on
a consistent basis. The recent capital raise would be sufficient for next three years
of growth, in our view. We believe MASFIN has all the ingredients of a good
investment: (a) a small base and presence in well-developed states for strong
growth, (b) superior asset quality, (c) relentless management focus on generating
sustainable, high return ratios, (d) healthy capitalization, and (e) consistent
dividend payout. We initiate coverage with a
Buy
rating and a target price of
INR740 (25x FY20 EPS, Implied 4.3x FY20 BV).
Alpesh Metha
+
91 22 3982 5415
Alpesh.Mehta@MotilalOswal.com
Please click here for Video Link
12 January 2018
3

Dupont Analysis (on avg. AUM) : ROAs to improve 60bp+ over FY17-20 led by margin expansion
MAS Financial Services
Net Interest Income
Fee Income
Net Income
Non interest Income
Net Income
Operating Expenses
Operating Profits
Provisions/write offs
PBT
Tax
PAT
Less: Preference shares and MI
PAT for Equity shareholders
Leverage (x)*
RoE
FY13
8.03
1.53
9.57
0.29
9.86
4.31
5.55
0.96
4.59
1.48
3.11
0.56
2.55
16.65
42.48
FY14
7.16
1.17
8.33
0.13
8.46
3.33
5.12
1.16
3.96
1.32
2.64
0.30
2.34
17.08
39.91
FY15
5.88
1.15
7.04
0.08
7.11
2.55
4.57
1.10
3.47
1.17
2.29
0.24
2.05
17.69
36.32
FY16
5.65
1.05
6.71
0.04
6.75
2.49
4.25
0.98
3.27
1.13
2.14
0.17
1.97
18.74
36.92
FY17
5.71
0.91
6.61
0.03
6.65
2.23
4.42
0.90
3.52
1.22
2.30
0.16
2.14
14.22
30.47
FY18E
6.60
0.83
7.43
0.03
7.46
2.31
5.15
1.05
4.10
1.41
2.69
0.03
2.66
7.46
19.85
FY19E
6.69
0.76
7.46
0.03
7.49
2.30
5.19
0.90
4.29
1.48
2.81
0.03
2.78
6.10
16.99
FY20E
6.68
0.70
7.39
0.03
7.42
2.30
5.12
0.90
4.22
1.46
2.77
0.03
2.74
6.68
18.31
Source: MOSL, Company; *: On-book leverage for FY17 is 7.7x
Valuation comparison
AUM
(INR b)
SHTF
855
LTFH
723
BAF
721
MMFS
499
CIFC
365
SCUF
249
CAFL
230
MUTH
276
MASFIN
37
Price
1,497
182
1,781
482
1, 306
2,140
836
451
626
Market Cap AUM CAGR
(INR b)
(FY17-20E)%
339
16
331
17
1,030
35
286
17
205
18
142
16
83
25
181
10
34
25
Net NPL
RoA (%)
EPS CAGR
(FY17-20E)% (1HFY18, %) FY18E FY19E
32
2.45
2.7
3.1
35
3.31
1.7
2.2
40
0.51
3.5
3.6
51
6.50
1.8
2.1
23
2.89
3.0
3.0
27
1.83
3.3
3.6
32
1.00
1.7
1.8
19
3.99
5.5
5.0
25
0.96
2.7
2.8
RoE (%)
P/B
FY18E FY19E FY18E FY19E
15.1 17.4 2.6
2.3
15.8 19.6 3.3
2.8
20.2 20.4 6.0
5.1
10.7 12.2 3.1
2.9
19.6 19.2 3.9
3.3
14.3 15.9 2.5
2.2
13.2 15.4 2.6
2.3
23.8 19.9 2.3
2.0
19.8 17.0 4.9
4.3
P/E
FY18E FY19E
18.1 13.7
23.0 15.6
37.7 27.0
34.2 24.7
21.9 18.8
18.2 14.5
21.3 15.9
10.8 10.9
35.5 27.0
Source: Company, MOSL
12 January 2018
4

11 January 2018
3QFY18 Results Update | Sector: Technology
TCS
BSE SENSEX
34,503
Bloomberg
Equity Shares (m)
M.Cap.(INRb)/(USDb)
52-Week Range (INR)
1, 6, 12 Rel. Per (%)
Avg Val, INRm
Free float (%)
S&P CNX
10,651
TCS IN
Recovery in Retail offset by muted BFS outlook and margin risks
1,914
Counterbalancing forces keep us subdued:
After declining for three quarters
5,337.8 / 83.8
(YoY CC), Retail recovered with 3% YoY CC growth, and TCS expects this to
2820 / 2154
reach double-digits in FY19, a key positive from its 3Q earnings. However,
2/8/-7
1.5% QoQ CC decline in BFSI (flat YoY CC), and limited likelihood of this
2929
rebounding in the next few quarters offset the strength in Retail. Add to that
26.4
CMP: INR2,788
TP: INR2,700(-3%)
Neutral
Financials & Valuations (INR b)
2017
2018E
Y/E Mar
1,179.7 1,222.7
Net Sales
323.1
323.1
EBITDA
262.9
255.3
PAT
133.4
130.6
EPS (INR)
8.3
-2.1
Gr. (%)
448.3
417.0
BV/Sh (INR)
32.6
30.4
RoE (%)
32.4
26.5
RoCE (%)
20.9
21.4
P/E (x)
6.2
6.7
P/BV (x)
Estimate change
TP change
Rating change
profitability risk that current levels of INR-USD bear, and the overhang to
earnings from potentially greater taxation liability arising out of BEAT, we
remain subdued on the near-to-medium-term triggers for TCS.
2019E
1,358.2
In-line operational performance:
TCS’ 3QFY18 CC revenue growth was 1.3%
358.8
QoQ, marginally ahead of our estimate of +0.9%. 9M YoY CC growth stands at
282.0
6.4%, compared to 6.2% in this quarter. EBIT margin expanded 10bp QoQ to
147.3
25.2%, as against our estimate of a 20bp contraction. PAT increased 1.3%
12.8
QoQ, but fell 3.6% YoY to INR65.3b (2% beat).
481.0
Deals getting larger in Digital:
Digital remained the key growth driver, up
32.9
39.6% YoY CC compared to overall company’s 6.2%. TCS announced its first-
25.3
ever USD50m+ deal in Digital, an indicator of the gradually increasing deal
18.9
sizes within the segment. While 39.6% CC growth of the current quarter may
5.8
not be tenable, TCS continues to witness deepening of Digital adoption
across Enterprises.
Valuation view:
Our numbers are largely unchanged post the earnings, as
Retail recovery was offset by continued expectation of a soft BFS.
Management cited that momentum pick-up in Retail leaves it with only BFS
as the segment where recovery is still WIP. We believe intermittent risks to
TCS’ valuations maybe three-fold: [1] BFS softness, [2] margin headwinds
from a strong INR and [3] likelihood of additional taxation burden under the
new US tax regime. Our price target of INR2,700 (3% downside to CMP),
based 17x forward earnings, keeps us
Neutral.
Quarterly Performance (Consolidated)
12 January 2018
5

11 January 2018
3QFY18 Results Update | Sector: Financials
IndusInd Bank
Buy
BSE SENSEX
34,503
Bloomberg
Equity Shares (m)
M.Cap.(INRb)/(USDb)
52-Week Range (INR)
1, 6, 12 Rel. Per (%)
Avg Val, INRm
Free float (%)
S&P CNX
10,651
IIB IN
595
1,010.4 / 15.7
1818 / 1186
-2/0/11
1889
85.0
CMP: INR1,699
TP: INR2,076(+22%)
Strong core operating performance, asset quality deteriorates slightly
Financials & Valuations (INR b)
2018E
2019E
Y/E Mar
74.7
94.8
NII (INR b)
66.8
85.3
OP (INR b)
36.5
47.2
NP (INR b)
4.2
4.2
NIM (%)
61.1
78.9
EPS (INR)
27.0
29.2
EPS Gr. (%)
387
453.9
BV/Sh.
371
436.9
ABV/Share
17.0
19.1
RoE (%)
1.8
1.9
RoA (%)
27.8
21.5
P/E (X)
4.4
3.7
P/B (X)
2020E
120.1
109.5
60.6
4.2
101.4
28.5
540.6
522.1
20.7
1.9
16.7
3.1
IndusInd Bank's (IIB) 3QFY18 PAT grew 25% YoY (in-line) to INR9.4b. NII grew
20% YoY, led by robust advances growth of 25% YoY, even as calculated NIM
shrunk 15bp YoY (reported NIM was flat YoY at 3.99%).
Total income grew 18.7% YoY due to relatively low other income growth, as
treasury gains were muted with increasing yields. However, controlled opex
growth of 15% YoY (CI ratio declined 150bp YoY to 46%) led to PPoP growth
of 2%/22% QoQ/YoY.
Robust advances growth (25% YoY) was driven by 26% YoY corporate book
growth; retail book grew 24% YoY, led by healthy growth in tractors (+42%
YoY), credit cards (+55% YoY) and equipment finance (+29% YoY). Retail
book stood at 41.3% of advances.
GNPA/NNPA increased 11%/10% QoQ to INR15b/5.9b; however, in
percentage terms, GNPA/NNPA increased 8bp/2bp QoQ to 1.16%/0.46%, as
the bank utilized INR700m of floating provisions created in 1QFY18 to
improve PCR to 60.5%. Slippages moderated to 1.6% (annualized) from 2% in
the previous quarter.
Other highlights:
(1) Robust CASA accretion continued, with 68% SA growth
and 42% CASA growth (CASA ratio at 42.9%). (2) CET1/Tier 1 ratio stood at
14.07%/15.83%. (3) The bank is yet to receive FY17 divergence numbers
from the RBI, as the audit has been completed at the end of Dec '17.
Valuation and view:
IIB's key focus is to scale up on its retail operations, led
by a higher share of non-vehicle retail loans by FY20. The bank is targeting
25-30% loan growth, driven by continued branch expansion (by 800) and
strong customer acquisition (+2x to 20m). A merger with BHAFIN will
strengthen the bank's liability profile and further boost return ratios.
Maintain
Buy
with a revised TP of INR2,076 (4.0x Dec'19 BV v/s earlier TP of
INR2,000 based on 4.0x Sep’19E BV).
FY18E
2Q
3Q
18,210
18,948
24.7
20.0
11,876
11,868
30,086
30,816
13,751
14,169
16,335
16,647
27.5
22.1
2,938
2,362
13,398
14,285
4,597
4,923
8,801
9,362
(INR million)
FY17
FY18E
4Q
19,847
60,626
74,745
19.0
34.2
23.3
16,309
41,715
51,727
36,156 1,02,341 1,26,472
18,217
47,831
59,664
17,939
54,510
66,808
14.1
31.6
22.6
2,642
10,913
11,041
15,297
43,597
55,767
5,300
14,918
19,240
9,997
28,679
36,527
4.0
26.8
25.5
16.0
1.1
3.8
36.1
27.9
10.5
0.9
4.0
26.8
25.5
16.0
1.1
Quarterly Performance
1Q
3Q
4Q
1Q
Net Interest Income
13,564
15,784
16,675
17,741
% Change (YoY)
38.3
34.5
31.5
30.8
Other Income
9,730
10,168
12,113
11,673
Net Income
23,294
25,952
28,788
29,413
Operating Expenses
10,956
12,319
13,065
13,528
Operating Profit
12,338
13,633
15,722
15,885
% Change (YoY)
33.7
28.5
36.6
28.8
Other Provisions
2,305
2,169
4,301
3,100
Profit before Tax
10,033
11,465
11,421
12,786
Tax Provisions
3,419
3,959
3,905
4,420
Net Profit
6,614
7,506
7,516
8,365
Operating Parameters
NIM (Cal, %)
3.8
3.8
3.9
3.9
3.8
4.0
4.1
Deposit Growth (%)
31.0
38.9
37.9
36.1
31.4
25.9
22.5
Loan Growth (%)
29.7
26.4
25.1
27.9
24.3
24.5
25.1
Asset Quality
Gross NPA (INR b)
8.6
9.0
9.7
10.5
12.7
13.5
15.0
Gross NPA (%)
0.9
0.9
0.9
0.9
1.1
1.1
1.2
E: MOSL Estimates; Quarterly calculated margins based on total assets, yearly on interest earning assets
FY17
2Q
14,603
33.4
9,704
24,307
11,491
12,816
27.3
2,139
10,677
3,635
7,042
12 January 2018
6

11 January 2018
3QFY18 Results Update | Sector: Cement
Shree Cement
Buy
BSE SENSEX
34,503
Bloomberg
Equity Shares (m)
M.Cap.(INRb)/(USDb)
52-Week Range (INR)
1, 6, 12 Rel. Per (%)
Avg Val, INRm
Free float (%)
S&P CNX
10,651
SRCM IN
Low-cost acquisition in the UAE aligns well with long-term strategy
35
In-line results:
SRCM reported healthy volume growth of 8% YoY, led by a
679.7 / 10.2
favourable base (3QFY17 was impacted by demonetization). Cement
20560/14244
realization fell 1% QoQ to INR4,120/t due to lower prices in its focus
10/-3/3
markets. Unitary cost increased 14% YoY (3% QoQ) due to higher freight
370.0
cost/t and P&F cost/t (higher petcoke prices and ban on usage of petcoke).
35.2
CMP: INR19,512
TP: INR22,424(+15%)
Financials & Valuations (INR b)
Y/E Mar
2018E
2019E
Net Sales
97.5
121.9
EBITDA
25.5
33.0
PAT
14.7
15.2
EPS (INR)
423.0
435.8
Gr. (%)
10.0
3.0
BV/Sh (INR)
2,584
2,972
RoE (%)
17.6
15.7
RoCE (%)
16.3
15.0
P/E (x)
46.1
44.8
P/BV (x)
7.5
6.6
2020E
149.9
43.2
25.2
724.2
66.2
3,648
21.9
20.7
26.9
5.3
Estimate change
TP change
Rating change
Cement EBITDA/t declined 11% QoQ (+3% YoY) to INR1,003 due to cost push
and weaker realizations. Hence, EBITDA increased 13% YoY to INR5.3b in
3QFY18. Depreciation fell 34% YoY to INR2.1b, resulting in PBT of INR3.8b
(+57% YoY). Tax rate stood at 22% v/s 3.4% in 3QFY17, resulting in adj. PAT
of INR2.9b (+23% YoY). Reported PAT rose 42% YoY to INR3.33b due to
reversal of DMF provision for earlier years.
Establishing footprint in UAE:
SRCM has approved acquisition of Union
Cement Company in the UAE, which has capacity of 4mt, at an EV of
~INR19.5b, translating into EV/tonne of USD76 (~41% discount to
replacement cost in India) and EV/EBITDA of ~8.8x on CY17 annualized
earnings. The move is in line with SRCM’s strategy of setting up/acquiring
plants at lower costs and achieving higher return ratios. The acquisition at
first glance appears positive (given its discounted cost), but SCRM’s
execution capabilities in new geography are yet to be tested. We have not
incorporated the financials of the acquired company in our estimates.
Strong capacity addition in domestic market:
While it would be critical for
SRCM to generate healthy return ratios from the acquisition, we believe the
key trigger for SRCM over the next 12-15 months would be domestic
profitability. SRCM is adding ~13mt of capacity in the domestic market (~3x
of acquired capacity) and also diversifying into newer markets. Given SRCM’s
low cost curve and capex cost, it should be able to generate healthy return
ratios from domestic operations, and any improvement in profitability from
the acquired capacity could only act as a potential trigger for the stock. We
remain positive and value SRCM at ~16x EV/EBITDA (15% premium to peers
due to superior return ratios) on FY20 earnings and arrive at a TP of
INR22,424/share, implying upside of 15% from present levels. Maintain
Buy.
12 January 2018
7

Hindustan Media Ventures
BSE SENSEX
34,503
Bloomberg
Equity Shares (m)
M.Cap.(INRb)/(USD b)
52-Week Range (INR)
1, 6, 12 Rel. Per (%)
Avg Val, INRm
Free float (%)
Financials & Valuations (INR b)
Y/E Mar
2018E 2019E
Sales
9.2
10.0
EBITDA
NP
EPS (Rs)
EPS Gr. (%)
BV/Sh (INR)
P/E (x)
P/BV (x)
EV/EBITDA (x)
EV/Sales (x)
RoE (%)
RoCE (%)
2.2
1.9
25.9
0.2
183.4
10.3
1.4
8.5
2.0
15.1
15.2
2.4
2.1
28.8
11.3
210.8
9.2
1.3
6.9
1.7
14.6
15.0
11 January 2018
3QFY18 Results Update | Sector: Media
S&P CNX
10,651
HMVL IN
Lackluster growth, but outlook improving
73.4
Muted revenue growth:
3QFY18 revenue came in flat YoY (9% QoQ) at
19.6 / 0.3
INR2.3b (in line v/s est. of INR2.35b), despite a low base (3QFY17 was
298/225
impacted by demonetization), largely due to (i) shift of Diwali ad spends to
9/-15/-31
2Q this year and (ii) lackluster local ad spend due to GST-related uncertainty.
7.0
26.0
EBITDA increased 43% YoY (+29% QoQ) to INR583m (est. of INR439m), as
CMP: INR266
TP: INR305(+15%)
Buy
2020E
10.8
2.7
2.4
32.4
12.6
241.8
8.2
1.1
5.6
1.4
14.3
14.7
Estimate change
TP change
Rating change
3QFY17 included high one-off expense related to HT Digital hive-off. EBITDA
margin expanded 760bp YoY to 25.3%. PAT rose 12%/20% YoY/QoQ (at a
slower rate than EBITDA) to INR493m on a high tax rate.
Subdued ad and circulation growth:
Ad spend recovered partly from the
FMCG, auto, banking and finance sectors, while real estate and government
were laggards (overall ad growth was 4%, of which 3% was contributed by
volumes and 1% by yield). Circulation segment, on the contrary, witnessed a
steep 14% revenue decline, though HMVL stated it maintained market share
in UP and Bihar.
Worst behind; management expects healthy growth:
Management
indicated that the ad growth outlook is improving, which should lead to
healthy single-digit growth. However, 4QFY18 could see the impact of a high
base (UP election ads in 4QFY17). Circulation yield improvement across
industry (to pass on firming newsprint prices) may insulate margins.
Maintain Buy with TP of INR305:
In FY18, we expect flat revenue and PAT
growth on the back of a weak ad market. However, the improving ad
outlook for FY19 should drive 8/11% revenue/PAT growth. Our FY19 PAT
estimate is revised down by 5% on a higher tax rate. We maintain
Buy
with a
TP of INR305 (prior: INR 302), based on 11x P/E on FY19E EPS of INR29.
Consolidated - Quarterly Earning Model
Y/E March
Net Sales
YoY Change (%)
Total Expenditure
EBITDA
Margins (%)
Depreciation
Interest
Other Income
PBT before EO expense
Extra-Ord expense
PBT
Tax
Rate (%)
MI & P/L of Asso. Cos.
Reported PAT
Adj. PAT
YoY Change (%)
Margins (%)
E: MOSL Estimates
1Q
2,392
6.8
1,823
569
23.8
50
47
201
673
0
673
186
27.6
0
487
487
16.9
20.4
FY17
2Q
3Q
2,295
2,303
1.4
-4.2
1,791
1,894
504
409
22.0
17.8
52
50
41
39
338
215
749
536
0
0
749
536
202
98
27.0
18.2
0
0
547
438
547
438
20.9
-7.5
23.8
19.0
4Q
2,343
3.1
1,770
573
24.4
50
34
167
655
0
655
191
29.1
41
424
424
-4.8
18.1
1Q
2,368
-1.0
1,858
510
21.5
53
25
251
683
0
683
203
29.7
32
448
448
-8.0
18.9
FY18
2Q
3Q
2,109
2,302
-8.1
-0.1
1,655
1,719
454
583
21.5
25.3
49
48
29
28
204
214
580
721
0
0
580
721
141
199
24.4
27.6
29
29
409
493
409
493
-25.2
12.4
19.4
21.4
FY17
4QE
2,418
3.2
1,763
655
27.1
49
23
217
800
0
800
222
27.7
30
548
548
29.5
22.7
9,333
1.7
7,277
2,055
22.0
202
161
921
2,612
0
2,612
676
25.9
41
1,895
1,895
6.0
20.3
(INR m)
FY18E
9,197
-1.5
6,995
2,202
23.9
199
105
885
2,783
0
2,783
765
27.5
120
1,898
1,898
0.2
20.6
12 January 2018
8

December 2017 Results Preview | Sector: Media
HT Media
Bloomberg
Equity Shares (m)
M. Cap. (INR b)/(USD b)
52-Week Range (INR)
1,6,12 Rel Perf. (%)
HTML IN
230.5
24 / 0
109 / 73
-2 / 18 / 12
CMP: INR102
TP: INR113 (10%)
Neutral
Financial Snapshot (INR Billion)
Y/E MARCH
2017 2018E 2019E 2020E
Net Sales
EBITDA
Adj. NP
Adj. EPS (INR)
Adj. EPS Gr. (%)
BV/Sh (INR)
RoE (%)
RoCE (%)
Div. Payout (%)
Valuations
P/E (x)
P/BV (x)
EV/EBITDA (x)
Div. Yield (%)
13.9
1.1
11.2
0.4
10.4
1.0
7.4
0.4
9.0
0.9
6.1
0.4
7.9
0.8
4.7
0.4
24.5
3.0
1.7
7.4
-1.8
96.8
7.9
9.7
6.9
24.2
4.0
2.3
9.9
33.6
9.7
10.4
5.1
25.4
4.2
2.6
11.3
14.9
10.2
10.7
4.4
26.5
4.5
3.0
12.9
14.0
10.5
11.1
3.9
We expect consolidated revenue to grow 1% YoY to INR6.6b.
Ad revenue is likely to decline 1% YoY to INR4.6b.
English print ad revenue would decline ~3% YoY to INR2.9b,
impacted by digital medium.
Hindi ad revenue is expected to grow 2% to INR1.7b.
We expect circulation revenue to increase 1% YoY to INR0.8b.
EBITDA is likely to de-grow 7% to INR1b and margin is expected to
decline 150bp YoY to 15.5%.
Net profit is likely to come in at INR0.6b (-35% YoY). The stock
trades at 10.4x FY18E and 9.0x FY19E EPS. Maintain Neutral.
106.3 117.1 129.5
Key things to watch for
English ad revenue (we expect ~3% YoY de-growth).
Hindi ad revenue (we expect 2% growth).
EBITDA margin (we expect 15.5%).
Consolidated - Quarterly Earning Model
Y/E March
Net Sales
YoY Change (%)
Total Expenditure
EBITDA
Margins (%)
Depreciation
Interest
Other Income
PBT before EO expense
Extra-Ord expense
PBT
Tax
Rate (%)
Minority Interest & P/L of Asso. Cos.
Reported PAT
Adj PAT
YoY Change (%)
Margins (%)
E: MOSL Estimates
1Q
6,147
4.5
5,504
643
10.5
295
247
478
579
0
579
186
32.2
168
224
224
-9.5
3.6
FY17
2Q
6,022
0.2
5,518
505
8.4
304
245
780
736
0
736
224
30.5
202
309
309
-16.1
5.1
3Q
6,499
-4.6
5,394
1,105
17.0
312
241
549
1,100
0
1,100
36
3.3
150
914
914
32.9
14.1
4Q
5,853
-7.3
5,122
731
12.5
337
218
488
665
0
665
225
33.8
184
256
256
-40.7
4.4
1Q
5,990
-2.5
5,191
799
13.3
320
194
531
817
0
817
239
29.2
162
415
415
85.5
6.9
FY18
2Q
3QE
5,606
6,589
-6.9
1.4
4,561
5,565
1,045
1,024
18.6
15.5
317
363
199
236
435
559
965
984
-31
0
997
984
219
226
22.0
23.0
116
160
662
598
638
598
106.3
-34.6
11.4
9.1
FY17
4QE
6,019
2.8
4,897
1,122
18.6
409
273
683
1,123
0
1,123
296
26.4
205
623
623
143.5
10.3
24,521
-2.0
21,538
2,983
12.2
1,248
951
2,295
3,079
0
3,079
671
21.8
705
1,703
1,703
-1.9
6.9
(INR m)
FY18E
24,204
-1.3
20,214
3,991
16.5
1,409
901
2,209
3,890
-31
3,921
980
25.0
643
2,298
2,275
33.6
9.4
12 January 2018
9

December 2017 Results Preview | Sector: Technology
Infosys
Bloomberg
Equity Shares (m)
M. Cap. (INR b)/(USD b)
52-Week Range (INR)
1,6,12 Rel Perf. (%)
INFO IN
2285.6
2353 / 37
1046 / 862
4 / 1 / -24
CMP: INR1,030
TP: INR1,100 (7%)
Buy
Financial Snapshot (INR b)
Y/E Mar
2017 2018E 2019E 2020E
Sales
EBITDA
PAT
EPS (INR)
EPS Gr. (%)
BV/Sh. (INR)
RoE (%)
RoCE (%)
Payout (%)
Valuations
P/E (x)
P/BV (x)
EV/EBITDA (x)
Div Yield (%)
16.4
3.4
10.5
2.5
16.0
3.7
10.4
3.2
15.2
3.2
9.1
3.3
13.5
2.9
8.1
3.7
684.9
186.1
143.8
62.8
6.4
302
22.0
22.0
40.9
707.6
188.3
144.4
64.4
2.6
279.3
21.9
21.9
50.7
772.0
202.6
147.4
67.8
5.2
317.0
22.4
22.4
50.1
849.1
221.2
165.4
76.1
12.2
349.6
22.8
22.8
49.9
Post 2QFY18, INFO revised its FY18 guidance lower to 5.5-6.5% YoY,
implying an ask rate of 0.4% to 1.6% for 2HFY18.
With 0.9% QoQ growth expectations for 3Q (1.0% in CC), and 1.5%
in the following quarter, we expect INFO to achieve the mid-point
of its CC guidance for FY18.
We expect EBITDA margin to contract by 40bp QoQ to 26.4%, led by
continued investments in the business and the fact that operational
efficiency levers have been squeezed materially over the last few
quarters.
With this, we expect full-year EBIT margin at 23.6%, at the lower
end of the revised profitability guidance range of 23-25%.
Our PAT estimate is INR35.3b (-5.4% QoQ), led by lower profitability
and lower other income.
The stock trades at 15.2x FY19E and 13.5x FY20E earnings. Buy.
Key issues to watch for
Update on internal stability of the company.
Commentary around contribution of newly launched services,
and revenue scale and growth from products and solutions.
Commentary around macro, verticals, margins and pricing.
(INR m)
FY18E
10,924
7.0
707,619
3.3
38.7
12.1
188,272
26.6
24.0
31,250
28.3
144,361
0.4
64.4
211,839
85.1
Quarterly Performance (IFRS)
Y/E March
Revenue (USD m)
QoQ (%)
Revenue (INR m)
YoY (%)
GPM (%)
SGA (%)
EBITDA
EBITDA Margin (%)
EBIT Margin (%)
Other income
ETR (%)
PAT
QoQ (%)
YoY (%)
EPS (INR)
Headcount
Util excl. trainees (%)
Attrition (%)
Offshore rev. (%) (IT
Fixed Price (%)
E: MOSL Estimates
1Q
2,501
2.2
167,820
16.9
38.7
12.2
44,470
26.5
24.1
7,530
28.4
34,360
-4.5
13.4
15.0
197,050
81.1
21.0
43.0
45.7
FY17
2Q
3Q
2,587
2,551
3.4
-1.4
173,100 172,730
10.7
8.6
39.1
39.7
11.8
12.2
47,330
47,670
27.3
27.6
24.9
25.1
7,600
8,200
28.8
28.1
36,060
37,080
4.9
2.8
6.1
7.0
15.8
16.2
199,829 199,763
83.1
82.4
20.0
18.4
43.0
43.5
47.1
49.5
4Q
2,569
0.7
171,200
3.4
39.7
12.5
46,580
27.2
24.6
7,460
27.0
36,030
-2.8
0.2
15.8
200,364
82.6
17.1
43.3
49.4
1Q
2,651
3.2
170,780
1.8
38.8
12.1
45,610
26.7
23.7
8,140
28.2
34,880
-3.2
1.5
15.3
198,553
84.5
21.0
43.4
49.3
FY18E
2Q
3QE
2,728
2,751
2.9
0.9
175,670
178,171
1.5
3.2
38.7
38.4
11.9
12.0
47,020
47,122
26.8
26.4
24.2
23.9
8,830
7,090
27.4
29.0
37,260
35,257
6.8
-5.4
3.3
-4.9
16.3
16.2
198,440
209,281
85.1
86.3
21.4
44.4
50.4
FY17
4QE
2,794
1.5
171,200
0.0
38.7
12.2
48,520
28.3
24.0
7,191
29.0
36,254
2.8
0.6
16.7
211,839
83.7
10,208
7.4
684,850
9.7
39.3
12.2
186,050
27.2
24.7
30,790
28.0
143,830
6.6
62.8
200,364
82.8
12 January 2018
10

In conversation
1. BAJAJ AUTO: Expect 'v' brand bike sales to increase to 15000
units per month; Eric Vas, President-Motorcycle Business
Have had a consistent market share for six-seven quarters.
Will expand market share by 400-500 bps post launch of new Discover bikes.
The company has been weak in the executive segment for three years.
Have had missteps with regards to Discover brand in the past. However, have
found a solution to problems.
Have been selling over 8,000 units of Discover a month for last two-and-a-half
years.
Expect 'V' brand bike sales to increase to 15,000 units per month.
There is a revival of demand; broad-based rural and urban demand growth is
seen.
Look forward to February and March being much better than last year.
2. AU SMALL FINANCE: Budget 2018 - Don't expect major
changes except tax relaxation; Deepak Jain, CFO
Since last five years, have a compounded annual growth rate (CAGR) of 40
percent. Have also added products like agri-term loans, consumer durables and
are starting housing finance business also. Don’t see any challenges to repeat
the growth history.
Don’t see any challenges with respect to entering housing finance.
Non-performing assets (NPAs) will remain under control.
New products will see average growth in FY19.
On Budget 2018, don’t see major changes coming in from this Budget except for
some tax benefits to the retail customers.
3. EVEREADY: Confectionery segment to add around rs 150 cr to
revenues over FY19-FY20; Amritanshu Khaitan, MD
Introduction of confectionery was to utilise the distribution chain and the deep
rural reach.
Moreover, being one of India's oldest FMCG Company, main stay business of
batteries and flashlight was limiting the overall growth potential.
Confectionery a logical product to foray into because it is a mass market product
and at a price point of Rs 1.
Moreover, 30 percent is still unorganised market and so it gives the company an
option to reach deep into rural areas and gives people choice to upgrade from
poor quality unorganised product to a branded product.
Going forward, the company aims to add more branded products in the FMCG
space in couple of years.
To tackle with stiff competition in the confectionery space, company has in an
house team to develop new products. Moreover, there would be no additional
distribution cost for the company, giving competitive advantage.
12 January 2018
11

From the think tank
Indians have had enough of second-rate cars
No-one ever went broke underestimating the intelligence of the American public,
but a sure-fire way to lose money in recent years has been to underestimate the
tastes of Indian drivers. The most glaring example of this has been Tata Motors
Ltd’s Nano. The much-touted Rs1 lakh selling price was once predicted to be a
Model T-style game-changer, but consumers were less enthused about the bus-
like seats and austere interiors. Less than a decade after it first went on sale,
Indian media have been reporting for months the Nano will soon be phased out of
domestic markets. That’s a good reason for the country’s manufacturers not to
fret about new safety rules expected to pass New Delhi’s upper house this year.
While analysts told P.R. Sanjai of Bloomberg News that adding features such as
airbags and anti-lock brakes could kill the market for cars costing Rs4 lakh or less
and raise manufacturers’ costs by 7% to 8%, consumers are already voting with
their feet.
Why it’s time to re-look capital gains policies on equity
With collections from securities transactions tax (STT) not showing the kind of
buoyancy that might have been expected, even though the stock markets have
done reasonably well over the past few years, it might be a good time to rethink
the taxes on share transactions. There could be a case for increasing the STT
rate, which is a tax that can be easily levied and collected. However, given how
trading volumes in derivatives on the Singapore Exchange are picking up—with
derivatives in stocks having been launched—the government would
understandably not wish to upset foreign investors who already feel the cost of
transacting in India is high
Recently, the Unique Identification Authority of India (UIDAI) filed a first
information report (FIR) against a reporter of The Tribune for unauthorized access
of Aadhaar data (for a story that exposed the vulnerability of the Aadhaar
database), and for allegedly violating the provisions of the Aadhaar Act. Last year,
the UIDAI filed an FIR against a CNN-News 18 journalist for a report on how it was
possible to obtain two separate Aadhaar enrolment numbers. In contrast, the
UIDAI did not initiate criminal prosecution against any of the 210 government
websites that displayed the details of Aadhaar number holder, nor did it file an FIR
against Airtel, when it was found out that Airtel used the Aadhaar-eKYC-based
verification process to open payments bank accounts of its subscribers without
their consent. These instances are interesting for two reasons. First, it seems that
over the last seven years since Aadhaar has been operational, we have heard of
only the UIDAI filing FIRs. Second, it seems that some cases are pursued, while
others are not. Why might this be?
The curious case of fir by the UIDAI
12 January 2018
12

India leapfrogged 30 places in the recently-published Ease of Doing Business index
brought out by the World Bank. This is a singular feat any country can aspire for.
One key factor commentators have missed while remarking on this is India
emerging as an investment hotspot, leading to a spike in mergers and acquisitions
(M&As). An important point to note here is that foreign capital’s appetite to be
part of the India Growth Story has been sector-agnostic. The spate of M&As that
the country has witnessed despite global headwinds and domestic disruptions—
though these were transient—cut across sectors and themes. There are a host of
positives that are playing out in India’s favour, including macro-economic outlook
and a fast-changing regulatory eco-system—and both are central to the current
M&A outlook
Why 2018 could be the year of mergers & acquisitions
International
A good year for artificial intelligence
The year 2017 was a seminal year for the field of Artificial Intelligence (AI). The
buildup of research breakthroughs, academic whispers, and the occasional
policy conversation burst into public consciousness. Suddenly, everyone
everywhere was talking about AI, what it means, and how it will affect human
societies and economies. Jobs, warfare, healthcare, film-making, even art—no
area of human enterprise seemed to be immune from discussions of the coming
machine onslaught. Overall, there were three very important outcomes for the
field of AI in 2017. First, technologically, the single most important breakthrough
in 2017 was the development of Google Deep Mind’s AlphaGo Zero. AlphaGo
Zero built on the earlier astonishing success of the AlphaGo program, which
mastered the game of Go—an East Asian game widely believed to be
significantly more complex than chess. AlphaGo was taught how to play the
game through a database of hundreds of thousands of videos of humans playing
Go.
12 January 2018
13

Click excel icon
for detailed
valuation guide
CMP
(INR)
861
127
3202
727
19933
1968
28383
1345
812
224
3706
765
252
9342
386
434
756
Valuation snapshot
Company
Automobiles
Amara Raja
Ashok Ley.
Bajaj Auto
Bharat Forge
Bosch
CEAT
Eicher Mot.
Endurance Tech.
Escorts
Exide Ind
Hero Moto
M&M
Mahindra CIE
Maruti Suzuki
Motherson Sumi
Tata Motors
TVS Motor
Aggregate
Banks - Private
AU Small Finance
Axis Bank
DCB Bank
Equitas Hold.
Federal Bank
HDFC Bank
ICICI Bank
IDFC Bank
IndusInd
J&K Bank
Kotak Mah. Bk
RBL Bank
South Indian
Yes Bank
Aggregate
Banks - PSU
BOB
BOI
Canara
Indian Bk
PNB
SBI
Union Bk
Aggregate
NBFCs
Aditya Birla Cap
Bajaj Fin.
Capital First
Cholaman.Inv.&F
n
Dewan Hsg.
GRUH Fin.
HDFC
HDFC Stand. Life
Indiabulls Hsg
Reco
Buy
Buy
Buy
Buy
Neutral
Buy
Buy
Buy
Sell
Buy
Neutral
Buy
Buy
Buy
Buy
Buy
Neutral
TP % Upside
EPS (INR)
EPS Gr. YoY (%)
P/E (x)
P/B (x)
ROE (%)
(INR) Downside FY18E FY19E FY20E FY18E FY19E FY18E FY19E FY18E FY19E FY18E FY19E
984
156
4023
859
20025
2221
34678
1554
688
265
3922
858
297
11026
458
593
756
14
23
26
18
0
13
22
16
-15
18
6
12
18
18
19
36
0
28.7
4.7
149.7
19.4
454.9
82.5
823.8
27.6
35.8
7.8
181.3
37.6
9.0
286.5
10.0
32.8
14.2
34.2
6.2
179.6
26.3
604.8
116.9
1,071.3
38.5
45.9
9.8
193.9
44.3
12.0
380.0
14.4
60.7
25.6
41.1
2.6
7.7
2.3
208.4
6.1
34.4
48.1
730.1
-3.9
140.6 -11.6
1,343.8 33.6
51.8
17.5
57.6
79.5
11.6
-4.3
214.2
7.2
48.8
37.5
14.9
94.3
482.9 15.2
18.3
30.0
66.3
65.5
34.4
21.0
26.2
21.7
40.2
12.8
9.9
8.2
105.4
21.8
3.4
100.8
17.2
51.9
30.2
4.9
29.5
-41.8
19.7
21.5
-65.7
15.1
21.0
-11.1
-7.4
26.7
LP
19.4
35.0
-22.6
22.1
19.1
199.6
Loss
51.0
17.6
69.4
3,751.8
128.4
323.3
NA
42.8
33.1
28.5
25.5
21.1
40.4
5.4
22.0
18.9
33.9
20.0
35.9
33.0
41.7
30.1
39.6
28.0
25.8
6.9
17.6
33.0
32.6
43.9
85.2
80.4
42.3
42.4
67.4
23.2
231.4
19.9
23.2
25.2
16.3
29.0
59.1
29.7
40.8
97.1
30.9
31.7
26.2
LP
138.9
11.4
79.1
70.8
59.5
79.8
46.5
39.3
33.4
16.3
22.4
19.1
-9.8
13.9
27.1
29.9
27.3
21.4
37.5
43.8
23.9
34.5
48.8
22.6
28.9
20.4
20.3
28.0
32.6
38.5
13.2
53.2
25.2
65.6
30.4
23.8
92.8
20.6
27.2
22.8
24.7
27.9
9.4
31.8
33.3
17.0
19.2
26.2
9.1
NM
12.5
10.8
16.3
26.4
7.5
21.0
49.9
39.0
25.5
22.2
16.6
50.7
26.5
94.5
14.7
25.2
20.4
17.8
27.6
33.0
16.8
26.5
34.9
17.7
23.0
19.1
17.3
21.1
24.6
26.7
7.2
29.5
17.7
46.1
18.1
19.3
28.0
17.2
22.1
18.2
21.2
21.6
5.9
24.5
23.7
8.6
14.7
19.9
7.2
33.8
5.3
9.7
9.1
15.4
4.7
11.7
34.0
28.0
19.1
19.1
13.6
42.6
29.3
82.9
11.6
4.9
5.5
4.9
7.1
6.3
2.9
10.9
9.2
3.5
3.5
6.4
3.2
2.6
6.8
8.3
2.0
12.3
4.7
8.8
2.1
2.4
2.4
1.8
4.9
2.4
1.5
4.4
0.8
4.4
3.4
1.2
3.1
3.2
1.0
0.7
0.7
1.1
0.9
1.2
0.4
0.9
4.7
6.3
3.2
4.0
2.2
15.1
5.9
3.0
3.8
4.2
4.8
4.4
5.9
5.7
2.6
8.2
7.6
3.0
3.2
5.6
2.9
2.3
5.8
6.8
1.6
9.2
3.9
7.3
1.9
2.2
2.2
1.6
4.2
2.2
1.4
3.7
0.7
3.7
3.1
1.1
2.7
2.8
0.9
0.7
0.7
1.0
0.9
1.1
0.4
0.9
3.7
5.3
2.8
3.4
1.9
12.4
5.0
2.5
3.4
17.6
21.1
24.2
20.3
15.1
13.0
36.0
20.5
16.8
12.3
33.4
14.1
9.9
20.4
23.4
17.0
25.4
18.7
14.3
7.3
11.5
2.6
9.6
18.8
8.8
6.3
16.9
8.4
14.8
12.4
6.9
17.3
12.1
6.4
-0.4
5.0
10.9
5.3
5.3
5.9
4.4
12.5
20.2
13.2
19.6
13.9
32.7
19.1
20.0
27.6
18.1
25.0
26.0
23.4
18.2
16.2
35.2
23.8
18.4
13.9
31.2
14.6
11.8
23.1
28.1
24.8
35.8
22.1
17.3
10.8
11.8
8.2
10.0
20.4
10.5
6.9
19.0
12.3
16.5
13.7
12.7
19.5
13.9
9.4
1.8
11.3
11.2
9.0
8.0
9.1
7.3
12.3
20.4
15.4
19.2
15.2
32.1
18.3
19.1
31.0
Buy
Buy
Neutral
Buy
Buy
Buy
Buy
Neutral
Buy
Buy
Buy
Buy
Buy
Buy
710
558
202
161
114
1870
309
69
1699
79
1018
535
33
343
705
680
197
209
146
2150
370
56
2000
100
1179
665
38
382
-1
22
-3
30
28
15
20
-18
18
26
16
24
16
12
10.8
18.4
8.5
1.7
5.5
68.7
13.6
2.8
60.9
8.4
32.1
16.0
1.9
17.8
15.4
30.8
10.5
5.7
6.6
84.7
17.0
3.2
78.6
13.4
41.6
22.6
3.8
23.3
Buy
Neutral
Neutral
Buy
Buy
Buy
Neutral
163
166
356
372
172
302
139
217
175
366
438
250
415
153
33
5
3
18
45
37
10
17.9
-1.2
28.4
34.4
10.5
11.5
18.4
22.6
4.9
67.8
38.3
18.9
19.6
29.4
29.7
10.3
99.7
42.3
24.1
34.9
45.0
Buy
Buy
Buy
Buy
Buy
Neutral
Buy
Buy
Buy
185
1782
836
1310
617
500
1741
445
1229
231
2300
925
1500
710
500
2182
370
1550
25
29
11
14
15
0
25
-17
26
3.7
45.7
32.8
59.1
37.2
9.9
65.8
4.7
83.7
5.4
63.7
43.7
68.7
45.5
11.7
59.3
5.4
106.3
7.8
87.0
56.5
84.2
56.5
14.6
68.9
6.7
132.7
12 January 2018
14

Click excel icon
for detailed
valuation guide
CMP
(INR)
181
569
481
452
1322
694
2143
1506
TP % Upside
(INR) Downside
240
32
640
13
562
17
515
14
1750
32
800
15
2700
1700
26
13
EPS (INR)
EPS Gr. YoY (%)
FY18E FY19E FY20E FY18E FY19E
7.4
10.9
13.5
41.8 47.4
39.7 45.5
53.9
3.9
14.4
13.5 18.7
23.1
90.5 38.5
42.6 42.0
48.1
44.4
-1.4
52.5 66.5
88.8
66.2 26.6
36.0 41.9
50.0
23.5 16.5
115.6 145.3
80.6
106.2
173.7
127.6
37.1
44.9
35.3
-3.4
12.7
119.0
28.0
10.9
-64.9
-4.4
64.4
20.5
20.5
13.8
10.9
27.3
-1.7
15.2
13.4
15.3
25.6
31.8
14.9
48.7
13.3
-19.9
48.3
25.2
57.4
32.2
19.4
23.9
23.3
17.9
56.9
19.5
16.3
8.0
12.0
18.8
Valuation snapshot
P/E (x)
P/B (x)
FY18E FY19E FY18E FY19E
24.4 16.6
3.6
3.0
14.3 12.5
2.3
2.0
35.7 25.8
3.3
3.0
10.6 10.8
2.3
2.0
25.2 19.9
3.6
3.1
19.3 16.6
3.2
2.7
18.5
18.7
26.1
73.6
25.2
35.2
48.3
52.3
67.2
36.9
45.8
47.8
26.4
27.4
65.8
44.5
42.8
17.8
35.7
34.6
14.8
14.2
22.7
49.5
22.3
43.9
32.6
41.8
42.7
28.0
38.4
38.6
21.4
23.3
41.9
37.2
36.8
16.5
31.9
29.1
35.4
26.6
21.5
37.9
10.6
18.2
18.5
23.5
22.8
19.1
27.3
21.6
15.3
39.1
29.9
24.0
46.0
44.2
40.1
38.8
39.5
40.1
35.1
50.0
26.9
2.5
2.7
4.7
8.1
4.5
1.2
9.5
23.1
1.4
6.5
9.3
9.3
5.2
3.4
6.0
8.8
5.2
2.9
5.5
3.8
2.7
3.8
2.7
5.1
1.7
1.1
3.9
3.5
4.4
3.2
6.4
2.8
2.4
7.4
4.5
3.4
14.6
17.4
22.9
11.2
14.5
9.9
7.9
45.8
6.6
2.2
2.3
4.0
7.2
4.0
1.2
8.7
18.9
1.4
5.9
8.1
8.2
4.3
3.1
5.5
7.4
4.7
2.5
4.9
3.5
2.6
3.5
2.5
4.5
1.4
1.1
3.3
3.1
3.8
2.8
5.3
2.4
2.1
6.3
4.0
3.1
12.5
14.1
21.5
10.0
12.5
8.6
7.2
42.3
6.1
ROE (%)
FY18E FY19E
15.8 19.6
16.9 16.9
10.7 12.2
23.8 19.9
15.0 16.7
18.1 17.9
14.3
15.1
18.0
10.9
17.9
3.3
20.2
51.0
2.1
18.1
21.8
19.5
19.5
12.8
9.1
21.4
12.8
17.5
16.5
10.9
6.2
10.3
7.3
10.3
11.5
3.5
17.5
9.9
16.0
12.3
13.7
6.5
10.8
20.0
11.1
10.5
26.9
34.0
48.8
26.0
31.7
23.8
20.7
75.9
23.2
15.9
17.4
17.5
14.5
18.1
2.6
27.8
49.8
3.3
22.2
22.6
21.2
20.2
13.8
13.1
21.5
13.5
16.4
16.3
12.0
7.4
13.7
12.0
12.7
14.5
6.0
19.2
13.9
17.9
15.6
21.3
12.0
14.6
17.4
14.2
12.8
29.4
35.2
55.2
27.3
34.0
22.9
21.4
88.0
23.4
Company
Reco
L&T Fin Holdings Buy
LIC Hsg Fin
Neutral
M&M Fin.
Buy
Muthoot Fin
Neutral
PNB Housing
Buy
Repco Home
Buy
Shriram City
Buy
Union
Shriram Trans.
Buy
Aggregate
Capital Goods
ABB
Sell
Bharat Elec.
Buy
BHEL
Sell
Blue Star
Neutral
CG Cons. Elec.
Buy
CG Power & Indu. Neutral
Cummins
Buy
GE T&D
Neutral
Havells
Buy
K E C Intl
Neutral
L&T
Buy
Siemens
Neutral
Solar Ind
Neutral
Thermax
Neutral
Va Tech Wab.
Buy
Voltas
Neutral
Aggregate
Cement
Ambuja Cem.
Neutral
ACC
Neutral
Birla Corp.
Buy
Dalmia Bharat
Buy
Grasim Inds.
Neutral
India Cem
Neutral
J K Cements
Buy
JK Lakshmi Ce
Buy
Ramco Cem
Buy
Orient Cem
Buy
Prism Cem
Buy
Sagar Cements Not Rated
Sanghi Inds.
Buy
Shree Cem
Buy
Ultratech
Buy
Aggregate
Consumer
Asian Paints
Neutral
Britannia
Buy
Colgate
Buy
Dabur
Buy
Emami
Buy
Godrej Cons.
Neutral
GSK Cons.
Neutral
HUL
Buy
ITC
Neutral
1401
179
103
796
271
97
936
432
550
377
1320
1299
1167
1297
615
626
1230
210
78
685
315
90
1150
440
590
350
1450
1313
1120
1150
745
580
-12
17
-24
-14
16
-7
23
2
7
-7
10
1
-4
-11
21
-7
19.0
7.1
2.9
16.5
5.2
1.4
25.3
9.4
11.5
14.3
48.1
19.8
26.2
30.3
34.5
17.5
28.3
8.0
2.3
24.4
6.5
2.3
33.5
11.2
14.3
17.6
56.7
31.0
31.3
35.2
37.2
19.6
34.1
8.6
3.5
31.0
7.8
3.0
39.6
14.0
17.7
21.7
67.2
35.3
39.3
38.4
41.9
22.4
272
1801
1219
3170
1241
192
1142
448
799
173
136
1093
136
19512
4397
275
1795
1435
3568
1286
188
1324
512
913
205
130
-
157
21852
4914
1
0
18
13
4
-2
16
14
14
19
-4
15
12
12
6.1
7.7
48.6 67.8
32.2 56.7
60.8 83.7
81.9 116.8
5.8
10.5
47.8 61.8
12.1 19.1
27.1 35.1
6.3
9.1
2.7
5.0
25.2 50.6
5.8
8.9
486.2 499.3
102.2 147.1
9.8
80.4
61.6
111.7
133.5
12.1
79.1
25.2
44.7
15.2
6.6
70.6
12.0
751.1
184.0
25.5 25.3 44.4
34.5 39.5 37.1
12.8 76.1 37.9
56.8 37.6 52.1
20.8 42.5 15.1
3.9
80.4 32.9
41.7 29.5 23.9
74.3 57.2 37.0
-0.5
29.3 29.4
LP
44.0 27.5
905.1 81.3 49.5
LP
101.0 43.4
102.0 53.5 23.5
26.5
2.7 40.1
6.4
43.9 43.0
23.2 36.7 32.8
2.6
14.7
10.3
6.8
0.2
11.9
3.0
16.2
8.5
19.8
26.4
19.8
20.0
25.0
15.8
13.4
21.0
10.2
55.1
55.9
48.0
46.5
49.3
46.5
39.8
60.4
29.6
1189
4721
1125
360
1311
984
6405
1379
270
1282
6098
1357
410
1655
1042
5785
1497
276
8
29
21
14
26
6
-10
9
2
21.6 25.8
84.5 106.9
23.4 28.1
7.7
9.3
26.6 33.2
21.2 24.5
160.8 182.3
22.8 27.6
9.1
10.0
31.1
133.8
33.7
10.9
38.6
27.4
206.5
32.4
11.4
12 January 2018
15

Click excel icon
for detailed
valuation guide
CMP
(INR)
370
316
7856
23066
296
900
9297
232
1180
3825
TP % Upside
(INR) Downside
375
1
355
12
8173
4
28650
24
314
6
1044
16
9461
2
-
1320
12
3449
-10
EPS (INR)
EPS Gr. YoY (%)
FY18E FY19E FY20E FY18E FY19E
8.4
10.5
13.1
-25.0 25.2
6.2
7.7
9.3
-1.2
24.3
128.6 146.9 177.7
4.0
14.2
296.6 413.1 544.5 24.3 39.3
8.9
12.4
16.8 147.7 38.7
17.2 20.8
24.0
2.9
20.7
151.5 176.7 209.4 14.0 16.6
3.5
6.4
9.7
-2.0
83.8
14.7 18.0
22.3
68.9 22.4
36.5 56.0
76.9
36.5 53.5
9.7
17.2
21.6 24.9
68.0 89.5
52.7 64.1
44.6 50.3
6.5
9.9
17.5 23.7
22.6 27.0
32.4 43.7
60.8 115.7
1.9
4.9
37.9 42.8
6.8
9.0
44.2 54.9
17.8 26.2
44.2 55.0
37.6 42.7
140.1 157.4
18.1 29.9
36.3 62.5
14.5 22.1
49.7 61.4
29.7
109.1
79.2
55.3
18.3
26.4
33.3
52.4
144.6
8.4
50.5
13.0
60.6
35.2
64.4
57.1
180.5
37.8
77.9
27.5
78.5
0.3
-8.9
-8.1
13.5
-36.7
23.0
42.3
-18.9
-16.2
-81.8
-3.4
-5.4
28.6
10.9
19.7
-33.6
8.5
29.3
12.6
-44.5
-9.9
-14.7
LP
12.5
11.5
29.3
15.1
31.7
21.7
12.8
53.0
35.8
19.5
35.0
90.1
160.8
12.9
31.1
24.3
47.0
24.4
13.7
12.4
65.1
71.9
52.0
23.6
33.2
Valuation snapshot
P/E (x)
P/B (x)
FY18E FY19E FY18E FY19E
43.9 35.1
6.4
6.2
50.9 41.0 15.5 14.7
61.1 53.5 22.7 20.6
77.8 55.8 31.0 24.8
33.2 23.9
3.4
3.0
52.3 43.3 11.5 9.4
61.4 52.6 36.3 30.3
66.8 36.3
3.2
3.0
80.4 65.7 11.7 10.1
104.9 68.3 19.8 14.7
46.2 39.4 12.5 11.2
26.0
33.6
28.7
15.1
84.6
25.4
27.1
33.9
39.9
79.2
16.5
21.5
56.1
32.1
18.3
24.7
33.3
34.3
22.7
40.5
27.8
29.9
22.6
25.5
23.6
13.4
55.3
18.7
22.6
25.1
21.0
30.4
14.6
16.4
45.1
21.8
14.7
21.7
29.6
20.8
13.2
26.7
22.5
22.5
34.6
10.7
21.5
28.4
17.9
16.8
25.8
13.1
23.4
4.8
5.4
6.8
3.3
6.4
5.5
3.5
5.6
3.2
1.2
3.2
2.7
12.4
2.7
3.1
2.8
5.7
4.7
2.4
3.7
4.8
3.9
2.5
1.4
4.1
3.8
2.3
2.7
3.7
2.5
3.6
4.2
4.6
5.5
2.7
5.9
4.4
3.1
5.0
2.8
1.1
2.7
2.4
14.2
2.5
2.6
2.6
5.2
3.9
2.1
3.4
4.2
3.4
2.3
1.3
3.5
3.4
2.1
2.5
3.5
2.3
3.3
11.3
3.1
2.5
3.9
2.7
1.3
ROE (%)
FY18E FY19E
14.3 17.9
32.3 36.8
39.1 40.4
39.8 44.4
10.8 13.3
24.1 23.9
64.8 62.9
4.9
8.5
15.5 16.5
18.9 21.5
27.0 28.3
19.9
17.0
26.4
24.6
7.6
23.4
12.8
16.3
8.2
1.6
19.6
14.2
22.0
8.8
18.4
12.0
17.2
14.7
11.4
9.3
18.2
12.9
1.9
14.1
19.1
13.7
11.8
14.1
11.5
9.2
11.4
13.3
21.9
-6.3
4.9
-1.2
14.0
19.8
19.4
25.7
22.3
10.7
26.1
13.5
21.2
14.1
3.9
18.4
15.4
31.4
11.9
19.2
12.5
17.7
20.5
17.0
13.2
19.9
15.2
7.0
12.9
17.5
12.6
11.7
15.4
14.1
18.2
14.2
34.9
22.3
0.2
10.1
5.2
14.5
Company
Jyothy Lab
Marico
Nestle
Page Inds
Parag Milk
Pidilite Ind.
P&G Hygiene
Prabhat Dairy
United Brew
United Spirits
Aggregate
Healthcare
Alembic Phar
Alkem Lab
Ajanta Pharma
Aurobindo
Biocon
Cadila
Cipla
Divis Lab
Dr Reddy’s
Fortis Health
Glenmark
Granules
GSK Pharma
IPCA Labs
Jubilant Life
Lupin
Sanofi India
Shilpa Medicare
Strides Shasun
Sun Pharma
Torrent Pharma
Aggregate
Infrastructure
Ashoka Buildcon
IRB Infra
KNR
Constructions
Sadbhav
Engineering
Aggregate
Logistics
Allcargo Logistics
Concor
Gateway
Distriparks
Aggregate
Media
Dish TV
D B Corp
Den Net.
Ent.Network
Hathway Cable
Hind. Media
Reco
Neutral
Neutral
Neutral
Buy
Neutral
Buy
Neutral
Not Rated
Buy
Neutral
Neutral
Buy
Buy
Buy
Neutral
Buy
Neutral
Neutral
Neutral
Buy
Neutral
Buy
Neutral
Neutral
Buy
Buy
Buy
Buy
Buy
Buy
Neutral
563
2283
1511
675
546
444
613
1099
2430
149
625
147
2478
572
809
928
4665
622
825
588
1384
540
2500
1791
900
485
555
600
1100
2575
185
650
200
2500
550
957
1000
5000
797
1074
610
1400
-4
10
19
33
-11
25
-2
0
6
24
4
36
1
-4
18
8
7
28
30
4
1
Buy
Neutral
Buy
Buy
244
248
312
417
275
240
325
445
13
-3
4
7
1.8
22.9
13.3
14.2
7.1
23.2
14.5
14.6
16.0
19.7
16.0
17.0
290.2 135.0
1.4 10.8
9.0
3.5
23.4
29.4
19.8
Buy
Neutral
Buy
223
1427
241
242
1496
282
9
5
17
10.9
42.7
8.8
13.3
55.2
18.4
15.3
68.1
21.3
10.7
12.4
29.6
13.1
22.0
29.3
20.5
33.4
109.2 27.3
33.4
237.6
21.5
LP
122.7
LP
18.6
31.2
Buy
Buy
Neutral
Buy
Buy
Buy
84
381
111
806
40
266
106
430
90
910
47
302
26
13
-19
13
16
14
0.7
20.7
-2.9
9.0
-0.2
23.8
2.2
25.2
0.1
20.0
0.8
28.2
3.8
29.3
4.0
31.7
2.0
33.3
-36.4
1.8
Loss
-21.5
Loss
-8.0
128.7 38.1 16.1
18.4 15.1
3.7
NM 1,563.9 2.5
89.8 40.3
4.3
NM
53.2
2.9
11.2
9.4
1.5
12 January 2018
16

Click excel icon
for detailed
valuation guide
CMP
(INR)
111
186
414
1461
115
25
1042
582
TP % Upside
(INR) Downside
113
2
225
21
469
13
1638
12
148
29
27
7
1155
11
690
19
EPS (INR)
EPS Gr. YoY (%)
FY18E FY19E FY20E FY18E FY19E
9.9
11.3
12.9
33.6 14.9
11.0 13.4
16.1
2.5
22.2
8.1
14.1
17.8
26.0 74.5
25.4 43.0
57.3
23.7 69.1
3.2
6.1
9.2
164.0 90.5
-0.8
0.1
0.6
Loss
LP
28.1 35.7
41.8
13.0 27.0
14.4 17.3
20.6
7.9
20.0
20.5 37.3
18.6
21.9
-18.0
19.7
4.6
13.7
-2.7
25.5
24.5
53.8
25.9
33.1
-0.6
24.9
5.3
12.7
3.1
38.9
43.8
48.8
26.3
31.8
3.3
22.9
5.4
13.2
4.4
43.0
45.6
59.2
117.2
11.2
Loss
33.3
24.8
37.4
Loss
165.2
61.9
41.7
57.3
-15.3
15.8
27.2
41.4
-12.8
-7.4
14.4
23.6
-29.6
-11.7
16.7
32.3
15.3
5.0
114.2
41.0
37.7
42.7
15.4
4.2
20.1
3.1
-1.8
18.2
15.4
7.6
15.4
14.4
20.2
-1.7
17.2
39.1
51.1
Loss
26.2
13.1
-7.0
LP
52.3
78.6
-9.2
51.7
25.0
19.3
58.5
4.2
20.2
5.8
15.2
-1.1
25.0
37.7
21.8
11.3
14.2
16.5
28.0
22.3
27.7
26.0
11.3
3.6
-1.1
6.6
13.8
7.3
18.9
4.9
15.8
17.5
19.5
9.6
8.4
Valuation snapshot
P/E (x)
P/B (x)
FY18E FY19E FY18E FY19E
11.2
9.8
1.0
0.9
17.0 13.9
2.9
2.5
51.1 29.3
4.0
3.5
57.5 34.0
6.4
5.4
35.6 18.7
5.3
4.1
NM 200.7 4.8
4.7
37.1 29.2
9.4
8.5
40.3 33.6
7.1
6.1
37.9 27.6
5.6
4.9
14.4
14.6
NM
14.3
18.2
11.4
NM
17.6
13.6
14.4
17.0
12.0
18.9
42.6
17.7
11.9
10.0
32.0
20.1
12.8
12.9
10.3
16.6
16.1
13.4
89.9
35.9
73.0
62.6
16.5
14.7
22.0
16.6
17.8
17.1
21.6
17.1
16.4
17.4
30.7
21.3
15.2
10.4
9.7
NM
11.4
16.1
12.2
32.2
11.5
7.6
15.8
11.2
9.6
15.9
26.9
17.0
9.9
9.5
27.8
20.4
10.2
9.4
8.5
14.9
14.1
11.5
70.2
29.3
57.1
49.7
14.8
14.2
22.2
15.6
15.6
15.9
18.2
16.3
14.1
14.8
25.7
19.4
14.0
1.8
4.7
0.9
2.6
1.5
2.0
1.1
4.0
1.9
2.2
2.0
2.7
2.0
6.4
2.5
2.7
1.6
6.5
5.2
2.0
1.0
1.1
3.9
1.9
1.7
14.8
5.5
15.4
11.6
2.8
3.7
5.5
4.1
2.3
4.9
4.0
2.8
2.5
3.0
9.3
6.7
2.8
1.6
3.6
0.9
2.1
1.4
1.9
1.1
3.0
1.7
1.9
1.7
2.2
1.9
5.4
2.2
2.3
1.4
5.5
4.7
1.8
1.0
1.1
3.2
1.7
1.6
14.7
4.8
13.9
10.4
2.6
3.3
4.6
3.3
2.0
4.0
3.6
2.6
2.2
2.8
7.6
5.8
2.4
ROE (%)
FY18E FY19E
9.7 10.2
16.8 19.4
8.1 12.7
11.6 17.2
15.9 24.7
-14.2 2.4
26.4 30.7
19.1 19.6
14.9 17.9
13.4
31.2
-5.7
19.3
8.6
18.4
-3.0
25.2
14.5
15.6
11.5
24.0
11.2
16.0
14.7
24.5
16.9
22.0
27.3
16.9
8.0
10.9
25.3
12.4
13.0
16.5
16.5
23.2
18.5
17.1
25.6
26.6
21.8
13.9
32.1
17.4
14.6
15.2
17.8
33.6
30.5
19.1
16.2
42.3
-0.2
20.3
9.2
15.8
3.5
29.7
23.5
12.9
15.6
25.4
12.4
21.7
13.7
25.1
16.0
21.4
24.4
18.5
10.5
12.8
23.6
12.9
13.8
20.9
17.5
25.6
20.9
17.3
24.5
22.4
22.3
13.8
27.5
20.7
16.6
16.5
20.1
32.5
32.2
18.8
Company
HT Media
Jagran Prak.
Music Broadcast
PVR
Prime Focus
Siti Net.
Sun TV
Zee Ent.
Aggregate
Metals
Hindalco
Hind. Zinc
JSPL
JSW Steel
Nalco
NMDC
SAIL
Rain Industries
Vedanta
Tata Steel
Aggregate
Oil & Gas
BPCL
GAIL
Gujarat Gas
Gujarat St. Pet.
HPCL
IOC
IGL
Mahanagar Gas
MRPL
Oil India
ONGC
PLNG
Reliance Ind.
Aggregate
Retail
Jubilant Food
PC Jeweller
Titan Co.
Aggregate
Technology
Cyient
HCL Tech.
Hexaware
Infosys
KPIT Tech
L&T Infotech
Mindtree
Mphasis
NIIT Tech
Persistent Sys
Tata Elxsi
TCS
Tech Mah
Reco
Neutral
Buy
Buy
Buy
Buy
Neutral
Buy
Buy
Buy
Neutral
Buy
Buy
Neutral
Buy
Sell
Buy
Buy
Neutral
268
320
268
283
85
155
98
449
334
772
321
354
198
296
81
187
44
492
386
656
20
11
-26
5
-4
20
-55
10
16
-15
Buy
Sell
Buy
Neutral
Buy
Buy
Buy
Neutral
Sell
Buy
Buy
Buy
Buy
492
495
871
221
421
389
322
1095
133
383
198
250
937
632
371
1000
183
576
545
416
1219
113
420
234
312
1069
28
-25
15
-17
37
40
29
11
-15
10
18
25
14
40.9
26.1
20.4
12.5
35.5
38.8
10.1
54.4
10.4
29.8
19.2
15.0
58.3
51.2
31.2
32.4
13.0
42.7
41.0
11.6
53.8
13.0
41.0
23.4
16.7
66.5
54.1
32.7
41.7
14.0
45.3
43.6
13.5
54.5
13.7
42.3
22.6
20.3
77.0
Sell
Buy
Buy
1927
540
907
1359
556
973
-29
3
7
21.4
15.1
12.4
27.4
18.4
15.9
36.2
23.5
19.8
Buy
Neutral
Neutral
Buy
Neutral
Buy
Buy
Neutral
Neutral
Buy
Buy
Neutral
Buy
583
917
361
1076
208
1121
621
716
718
751
1038
2788
550
600
970
270
1200
160
1200
600
670
600
780
1132
2450
560
3
6
-25
12
-23
7
-3
-6
-16
4
9
-12
2
35.4 39.4
62.4 64.6
16.4 16.3
64.7 69.0
11.7 13.3
65.6 70.4
28.7 34.1
41.9 43.9
43.9 50.8
43.1 50.7
33.8 40.4
131.2 143.9
36.2 39.2
43.8
69.6
18.5
77.5
17.2
82.3
42.6
49.5
56.7
60.2
48.7
157.9
45.1
12 January 2018
17

Click excel icon
for detailed
valuation guide
CMP
(INR)
321
919
TP % Upside
EPS (INR)
EPS Gr. YoY (%)
(INR) Downside FY18E FY19E FY20E FY18E FY19E
280
-13
19.0 19.4
22.3
12.3
2.3
1020
11
52.5 68.2
80.9
0.7
30.0
1.4
5.6
680
430
120
780
32
17
12
15
3.0
16.6
-12.1
4.4
5.6
19.0
-11.8
16.0
9.0
21.0
-10.8
30.1
-73.1
12.0
Loss
-56.4
PL
23.7
71.7
4.8
-19.3
12.4
24.8
-0.5
16.8
-15.0
56.2
17.8
17.2
-3.5
45.1
85.4
11.2
45.7
-38.2
50.9
78.9
47.0
-9.3
21.9
3.6
122.1
153.2
-10.4
17.7
-10.7
-12.5
11.4
8.4
4.4
25.3
88.4
14.4
Loss
267.3
LP
45.0
14.7
-18.2
30.3
16.6
17.0
12.2
26.0
56.5
Valuation snapshot
P/E (x)
P/B (x)
FY18E FY19E FY18E FY19E
16.9 16.5
2.9
2.5
17.5 13.5
2.5
2.2
18.7 17.8
4.5
4.0
172.2 91.4
22.1 19.3
NM
NM
155.4 42.3
-902.8 209.6
16.7
13.2
23.7
13.5
12.9
11.4
13.5
14.0
44.7
11.5
11.5
29.0
10.4
11.0
9.7
12.0
11.1
28.6
71.2
38.9
17.0
29.3
19.7
39.5
25.4
16.3
12.6
52.8
12.9
31.7
31.7
20.6
16.4
15.3
39.0
27.9
25.0
18.4
28.3
35.5
9.8
45.4
39.7
3.0
4.4
1.8
13.4
3.1
7.4
1.3
1.5
1.1
1.4
1.8
2.1
2.1
3.2
17.8
6.5
1.9
29.0
5.0
5.4
8.9
7.2
2.6
7.6
3.8
4.5
3.6
7.7
4.8
2.9
5.9
7.0
2.6
3.2
4.8
8.6
1.5
10.0
12.9
2.9
4.3
2.3
10.2
3.1
7.0
1.2
1.4
1.1
1.3
1.6
1.8
1.9
3.0
15.1
ROE (%)
FY18E FY19E
16.9 16.2
15.2 17.4
24.2 22.6
1.8
3.3
20.0 22.7
-19.9 -22.3
8.2 27.4
-0.3
1.5
44.6
10.7
6.3
8.4
11.0
17.0
16.2
15.1
7.4
18.2
60.8
11.1
5.0
10.8
11.9
17.4
15.9
17.5
10.9
22.9
Company
Wipro
Zensar Tech
Aggregate
Telecom
Bharti Airtel
Bharti Infratel
Idea Cellular
Tata Comm
Aggregate
Utiltites
Coal India
CESC
JSW Energy
NHPC
NTPC
Power Grid
Tata Power
Aggregate
Others
Arvind
Avenue
Supermarts
Bata India
BSE
Castrol India
Coromandel Intl
Delta Corp
Eveready Inds.
Interglobe
Indo Count
Info Edge
Kaveri Seed
Manpasand
MCX
Monsanto
Navneet
Education
Oberoi Realty
Quess Corp
Reco
Neutral
Buy
Buy
Neutral
Buy
Buy
515
368
107
676
Buy
Buy
Sell
Buy
Buy
Buy
Sell
308
1174
95
32
173
198
100
356
1360
51
37
211
261
73
16
16
-46
15
22
32
-27
18.5
89.1
4.0
2.4
13.4
17.4
7.4
26.8
102.1
3.3
3.1
15.7
20.4
8.3
31.1
110.7
3.6
3.7
17.8
21.3
8.5
Neutral
Sell
Sell
Neutral
Buy
Buy
Under
Review
Buy
Neutral
Neutral
Buy
Buy
Buy
Buy
Buy
Buy
471
1243
749
941
192
571
318
442
1237
135
1385
527
483
935
2607
160
553
1057
995
2859
1933
289
2276
90
8004
236
431
873
578
1100
235
523
-
400
1306
128
1300
738
533
1300
3293
194
580
1170
-
3266
2202
327
2500
114
5281
167
-8
-30
-23
17
22
-8
10.5
12.0
15.9
48.0
6.6
24.1
5.7
16.5
17.5
19.3
55.4
6.6
29.0
8.0
23.2
24.1
22.4
65.4
6.7
30.3
10.3
22.1
109.8
12.4
30.5
48.1
20.2
33.9
149.9
11.4
42.3
34.3
40.3
146.7
132.7
12.3
86.3
11.6
203.2
6.7
45.6 103.7
21.0
15.3
0.3
20.4
42.1
21.6
20.5
32.9
10.9
20.2
63.1
30.7
20.6
28.4
46.3
17.7
19.0
34.1
36.7
61.1
48.4
28.1
27.8
32.9
47.1
19.6
29.4
23.7
56.1
30.9
19.6
16.7
58.6
15.5
51.7
41.5
24.8
21.1
22.3
45.9
33.2
33.5
25.2
45.5
52.6
12.6
58.1
52.7
5.7 14.6 15.7
1.6
9.8
9.6
26.5 103.8 94.6
4.3 22.5 23.4
4.8
7.2
6.9
2.1
6.9
3.3
4.0
3.4
6.6
4.1
2.5
5.0
5.9
2.3
2.8
4.3
6.9
1.4
8.9
10.3
12.1
32.1
46.7
17.0
13.7
23.3
7.7
8.6
32.5
23.9
13.9
21.8
23.0
9.1
13.2
10.9
17.7
12.6
18.0
26.9
12.9
31.5
43.3
18.5
13.7
27.4
13.4
11.0
34.5
26.9
17.8
16.6
22.9
10.1
16.3
15.9
21.5
14.5
20.7
28.8
-9
6
-5
-6
40
10
39
26
21
5
11
14.3 17.4
63.0 75.9
8.0
10.7
23.6 26.2
34.1 41.0
9.3
15.2
22.5 29.4
105.0 126.6
7.6
24.8
23.0
29.9
9.7
36.2
27.1
35.6
Buy
Buy
Under
PI Inds.
Review
Piramal Enterp. Buy
SRF
Buy
S H Kelkar
Buy
Team Lease Serv. Buy
Trident
Buy
TTK Prestige
Neutral
V-Guard
Neutral
14
14
13
10
26
-34
-29
85.4 114.5
76.7 104.9
6.3
10.2
43.2 64.2
7.2
9.2
137.8 176.1
4.5
6.0
12 January 2018
18

MOSL Universe stock performance
Company
Automobiles
Amara Raja
Ashok Ley.
Bajaj Auto
Bharat Forge
Bosch
CEAT
Eicher Mot.
Endurance Tech.
Escorts
Exide Ind
Hero Moto
M&M
Mahindra CIE
Maruti Suzuki
Motherson Sumi
Tata Motors
TVS Motor
Banks - Private
AU Small Fin. Bank
Axis Bank
DCB Bank
Equitas Hold.
Federal Bank
HDFC Bank
ICICI Bank
IDFC Bank
IndusInd
J&K Bank
Kotak Mah. Bk
RBL Bank
South Indian
Yes Bank
Banks - PSU
BOB
BOI
Canara
Indian Bk
PNB
SBI
Union Bk
NBFCs
Aditya Birla Cap
Bajaj Fin.
Capital First
Cholaman.Inv.&Fn
Dewan Hsg.
GRUH Fin.
HDFC
HDFC Stand. Life
Indiabulls Hsg
L&T Fin.Holdings
LIC Hsg Fin
M&M Fin.
Muthoot Fin
1 Day (%)
0.8
-0.7
-0.1
0.1
0.6
0.3
1.0
-0.4
3.5
0.7
-0.7
0.9
-0.3
-0.5
1.6
0.5
-1.6
1.6
-0.8
1.0
2.8
1.0
0.4
-0.8
8.3
-2.1
-1.9
1.6
0.9
0.9
0.8
0.4
0.7
0.2
-0.4
0.8
0.3
-1.8
0.8
-1.1
5.3
0.5
0.3
0.0
0.9
3.5
2.1
0.2
-1.0
0.9
-1.0
1M (%)
10.2
7.6
-0.3
3.9
0.3
12.4
-2.9
10.1
19.6
9.5
5.4
7.8
4.8
2.2
1.8
5.9
0.2
-0.4
2.7
7.4
14.0
5.5
1.1
-0.5
26.5
1.6
2.9
0.9
4.0
1.9
10.0
-2.7
-8.7
-3.1
-4.0
-0.3
-5.1
-9.9
-1.3
4.4
21.5
1.1
2.8
-0.4
1.7
16.8
2.5
6.0
1.1
0.6
3.1
12M (%)
-5.1
48.4
17.8
52.8
-5.9
60.2
22.5
133.9
125.8
20.3
20.1
24.5
28.2
62.4
75.3
-16.3
98.4
Company
PNB Housing
Repco Home
Shriram City Union
Shriram Trans.
Capital Goods
ABB
Bharat Elec.
BHEL
Blue Star
CG Cons. Elec.
CG Power & Inds Sol.
Cummins
GE T&D
Havells
K E C Intl
L&T
Siemens
Solar Ind
Thermax
Va Tech Wab.
Voltas
Cement
Ambuja Cem.
ACC
Birla Corp.
Dalmia Bharat
Grasim Inds.
India Cem
J K Cements
JK Lakshmi Ce
Ramco Cem
Orient Cem
Prism Cem
Sagar Cements
Sanghi Inds.
Shree Cem
Ultratech
Consumer
Asian Paints
Britannia
Colgate
Dabur
Emami
Godrej Cons.
GSK Cons.
HUL
ITC
Jyothy Lab
Marico
Nestle
Page Inds
Parag Milk
Pidilite Ind.
P&G Hygiene
Prabhat Dairy
1 Day (%)
-0.2
-1.8
0.1
-0.8
-1.2
-0.5
-0.4
-0.8
0.1
2.3
1.4
0.0
0.0
-1.0
-0.3
0.4
-0.2
-1.4
0.2
-0.6
-1.4
-0.6
0.2
0.0
0.8
-0.5
-0.9
0.6
-1.1
0.5
-0.5
-0.1
-1.3
0.2
0.1
1.0
0.8
0.7
0.6
-2.3
0.2
-1.6
0.9
0.2
-0.8
-1.7
0.4
0.4
0.6
-1.3
0.4
-0.5
1M (%)
-1.1
7.6
1.7
8.2
2.1
-2.5
12.6
-0.6
3.6
12.3
9.3
7.5
2.4
10.0
8.1
9.2
0.2
6.5
0.2
0.4
1.3
3.8
8.8
-1.3
9.8
11.5
14.2
8.7
14.2
4.3
21.7
31.9
12.8
13.5
3.7
5.4
-3.1
4.2
3.2
3.7
-3.7
3.0
4.4
1.6
0.1
1.1
0.0
-0.1
10.4
1.0
-3.1
10.1
12M (%)
63.2
8.6
16.0
55.8
23.7
29.0
20.2
60.5
73.4
55.9
11.5
40.5
48.9
161.6
40.2
10.3
67.3
57.9
25.5
82.5
26.1
33.5
73.1
89.2
73.8
43.8
62.4
24.9
29.4
32.1
49.5
60.4
134.5
29.8
31.2
27.3
58.9
25.7
29.7
26.2
25.1
24.9
64.1
9.1
11.3
21.1
33.1
61.9
9.0
42.2
36.6
113.4
23.1
74.0
6.6
57.7
51.7
28.5
8.6
37.7
29.7
40.1
44.7
68.8
30.0
2.0
45.4
32.4
49.5
39.3
19.9
-0.8
98.9
37.1
37.5
133.3
49.3
41.6
71.7
88.1
6.7
69.6
56.4
12 January 2018
19

MOSL Universe stock performance
Company
United Brew
United Spirits
Healthcare
Alembic Phar
Alkem Lab
Ajanta Pharma
Aurobindo
Biocon
Cadila
Cipla
Divis Lab
Dr Reddy’s
Fortis Health
Glenmark
Granules
GSK Pharma
IPCA Labs
Jubilant Life
Lupin
Sanofi India
Shilpa Medicare
Strides Shasun
Sun Pharma
Torrent Pharma
Infrastructure
Ashoka Buildcon
IRB Infra.Devl.
KNR Construct.
Sadbhav Engg.
Logistics
Allcargo Logistics
Concor
Gateway Distriparks
Media
Dish TV
D B Corp
Den Net.
Ent.Network
Hathway Cab.
Hind. Media
HT Media
Jagran Prak.
Music Broadcast
PVR
Prime Focus
Siti Net.
Sun TV
Zee Ent.
Metals
Hindalco
Hind. Zinc
JSPL
JSW Steel
Nalco
NMDC
1 Day (%)
4.2
-0.2
-1.8
-2.8
1.3
0.3
0.7
0.0
-0.9
1.7
0.3
-8.2
1.5
4.4
0.1
-1.4
4.2
0.3
-1.0
3.3
0.0
0.5
-1.1
-0.4
0.2
-1.0
-2.7
1.4
-2.9
0.2
-0.7
0.3
3.9
1.1
3.5
0.9
1.3
-0.2
-1.8
-0.5
0.0
0.2
1.9
-0.2
-0.5
0.1
2.0
-0.1
0.5
0.0
1M (%)
11.9
10.9
8.8
6.9
4.8
-2.1
4.2
5.8
1.5
5.1
10.8
7.3
15.4
11.3
1.1
7.4
18.5
10.8
1.0
0.0
2.0
11.3
3.8
-0.6
21.4
12.3
11.3
25.5
9.7
-0.1
2.0
8.9
0.0
9.0
-2.4
11.8
12.6
11.0
7.6
12.9
0.3
-1.0
15.1
2.4
12.5
9.2
62.2
12.8
9.2
18.3
12M (%)
44.0
99.4
-6.9
34.7
-16.1
-4.2
63.6
24.3
6.0
48.4
-20.3
-24.6
-30.9
40.3
-9.0
2.8
14.7
-38.9
11.5
-11.5
-29.7
-9.2
1.6
58.3
14.4
82.7
51.5
25.3
50.4
-2.7
-3.9
2.9
53.3
4.4
11.1
-3.4
51.3
3.7
19.7
55.4
-32.4
94.4
21.4
53.5
15.3
226.6
51.0
17.1
10.6
Company
Rain Industries
SAIL
Vedanta
Tata Steel
Oil & Gas
BPCL
GAIL
Gujarat Gas
Gujarat St. Pet.
HPCL
IOC
IGL
Mahanagar Gas
MRPL
Oil India
ONGC
PLNG
Reliance Ind.
Retail
Jubilant Food
PC Jeweller
Titan Co.
Technology
Cyient
HCL Tech.
Hexaware
Infosys
KPIT Tech
L&T Infotech
Mindtree
Mphasis
NIIT Tech
Persistent Sys
Tata Elxsi
TCS
Tech Mah
Wipro
Zensar Tech
Telecom
Bharti Airtel
Bharti Infratel
Idea Cellular
Tata Comm
Utiltites
Coal India
CESC
JSW Energy
NHPC Ltd
NTPC
Power Grid
Tata Power
Others
Arvind
Avenue Super.
Bata India
1 Day (%)
-0.3
-0.1
-0.3
0.0
-0.6
-0.3
0.8
0.9
-0.9
0.1
-1.0
0.1
-0.2
-0.1
0.2
-0.5
-0.5
0.2
1.3
-1.1
0.4
0.5
-0.3
2.3
1.2
-0.2
-0.4
0.9
-0.2
0.3
-0.4
-0.7
1.6
-1.5
2.8
1.7
-0.6
-0.3
0.5
-0.1
3.3
4.3
-0.9
-0.5
-0.6
1.3
1.6
-0.4
-0.6
1M (%)
21.3
21.0
14.6
10.2
-4.1
2.9
4.2
5.9
-2.6
-3.8
-1.8
-3.3
7.9
6.8
10.5
-0.2
2.3
14.9
24.6
10.6
0.6
4.3
9.9
7.2
20.8
13.9
13.9
1.1
12.0
15.8
9.4
5.0
9.9
11.0
8.2
-3.3
0.0
11.9
-5.3
14.1
16.2
16.3
11.2
-2.9
-2.8
6.4
5.6
10.2
1.9
12M (%)
686.2
75.1
40.7
72.2
11.7
48.5
60.7
61.1
28.8
11.3
72.6
29.8
19.6
5.9
0.1
36.1
72.9
127.1
166.4
151.8
18.5
10.2
81.1
11.0
50.6
65.5
27.2
35.0
67.3
18.5
48.3
20.0
16.1
34.9
-1.1
59.4
4.3
43.6
6.6
-2.8
76.1
48.0
17.5
5.3
4.5
29.2
29.7
57.3
12 January 2018
20

MOSL Universe stock performance
Company
Others
BSE
Castrol India
Coromandel Intl
Delta Corp
Eveready Inds.
Interglobe
Indo Count
Info Edge
Kaveri Seed
Manpasand
MCX
Monsanto
Navneet Educat.
Oberoi Realty
PI Inds.
Piramal Enterp.
Quess Corp
SRF
S H Kelkar
Team Lease Serv.
Trident
V-Guard
1 Day (%)
-0.2
0.7
0.1
5.6
-1.6
-0.2
0.2
-1.6
0.1
-0.4
-0.8
-1.3
-1.6
5.1
-2.1
0.3
-0.6
-0.4
0.6
-2.1
-0.1
-1.3
1M (%)
3.9
-4.6
10.6
23.3
2.7
3.7
17.6
14.5
-3.0
32.2
-4.6
6.0
0.8
21.3
5.6
-1.1
0.4
5.3
13.2
1.6
-1.3
0.6
12M (%)
-1.8
70.4
140.1
89.5
42.8
-18.7
62.4
20.8
78.6
-24.6
15.0
26.7
79.1
21.9
63.8
56.8
17.1
-10.9
152.9
45.6
94.9
12 January 2018
21

NOTES
12 January 2018
22

THEMATIC/STRATEGY RESEARCH GALLERY

REPORT GALLERY
RECENT INITIATING COVERAGE REPORTS
Rs

DIFFERENTIATED PRODUCT GALLERY

Disclosures:
The following Disclosures are being made in compliance with the SEBI Research Analyst Regulations 2014 (herein after referred to as the Regulations).
Motilal Oswal Securities Ltd. (MOSL) is a SEBI Registered Research Analyst having registration no. INH000000412. MOSL, the Research Entity (RE) as defined in the Regulations, is engaged in the business of providing Stock
broking services, Investment Advisory Services, Depository participant services & distribution of various financial products. MOSL is a subsidiary company of Motilal Oswal Financial Service Ltd. (MOFSL). MOFSL is a listed
public company, the details in respect of which are available on
www.motilaloswal.com.
MOSL is registered with the Securities & Exchange Board of India (SEBI) and is a registered Trading Member with National Stock
Exchange of India Ltd. (NSE) and Bombay Stock Exchange Limited (BSE), Metropolitan Stock Exchange Of India Ltd. (MSE) for its stock broking activities & is Depository participant with Central Depository Services Limited
(CDSL) & National Securities Depository Limited (NSDL) and is member of Association of Mutual Funds of India (AMFI) for distribution of financial products. Details of associate entities of Motilal Oswal Securities Limited are
available on the website at
http://onlinereports.motilaloswal.com/Dormant/documents/Associate%20Details.pdf
Pending Regulatory Enquiries against Motilal Oswal Securities Limited by SEBI:
SEBI pursuant to a complaint from client Shri C.R. Mohanraj alleging unauthorized trading, issued a letter dated 29th April 2014 to MOSL notifying appointment of an Adjudicating Officer as per SEBI regulations to hold
inquiry and adjudge violation of SEBI Regulations; MOSL requested SEBI to provide all documents, records, investigation report relied upon by SEBI which were referred in Show Cause Notice and also sought personal
hearing. The matter is currently pending.
MOSL, it’s associates, Research Analyst or their relative may have any financial interest in the subject company. MOSL and/or its associates and/or Research Analyst may have beneficial ownership of 1% or more securities in
the subject company at the end of the month immediately preceding the date of publication of the Research Report.
MOSL and its associate company(ies), their directors and Research Analyst and their relatives may; (a) from
time to time, have a long or short position in, act as principal in, and buy or sell the securities or derivatives thereof of companies mentioned herein. (b) be engaged in any other transaction involving such securities and earn
brokerage or other compensation or act as a market maker in the financial instruments of the company(ies) discussed herein or act as an advisor or lender/borrower to such company(ies) or may have any other potential
conflict of interests with respect to any recommendation and other related information and opinions.; however the same shall have no bearing whatsoever on the specific recommendations made by the analyst(s), as the
recommendations made by the analyst(s) are completely independent of the views of the associates of MOSL even though there might exist an inherent conflict of interest in some of the stocks mentioned in the research
report.
Research Analyst may have served as director/officer, etc. in the subject company in the last 12 month period. MOSL and/or its associates may have received any compensation from the subject company in the past
12 months.
In the last 12 months period ending on the last day of the month immediately preceding the date of publication of this research report, MOSL or any of its associates may have:
managed or co-managed public offering of securities from subject company of this research report,
received compensation for investment banking or merchant banking or brokerage services from subject company of this research report,
received compensation for products or services other than investment banking or merchant banking or brokerage services from the subject company of this research report.
Subject Company may have been a client of MOSL or its associates during twelve months preceding the date of distribution of the research report.
MOSL and it’s associates have not received any compensation or other benefits from the subject company or third party in connection with the research report. To enhance transparency, MOSL has incorporated a Disclosure
of Interest Statement in this document. This should, however, not be treated as endorsement of the views expressed in the report. MOSL and / or its affiliates do and seek to do business including investment banking with
companies covered in its research reports. As a result, the recipients of this report should be aware that MOSL may have a potential conflict of interest that may affect the objectivity of this report. Compensation of Research
Analysts is not based on any specific merchant banking, investment banking or brokerage service transactions.
Terms & Conditions:
This report has been prepared by MOSL and is meant for sole use by the recipient and not for circulation. The report and information contained herein is strictly confidential and may not be altered in any way, transmitted to,
copied or distributed, in part or in whole, to any other person or to the media or reproduced in any form, without prior written consent of MOSL. The report is based on the facts, figures and information that are considered
true, correct, reliable and accurate. The intent of this report is not recommendatory in nature. The information is obtained from publicly available media or other sources believed to be reliable. Such information has not
been independently verified and no guaranty, representation of warranty, express or implied, is made as to its accuracy, completeness or correctness. All such information and opinions are subject to change without notice.
The report is prepared solely for informational purpose and does not constitute an offer document or solicitation of offer to buy or sell or subscribe for securities or other financial instruments for the clients. Though
disseminated to all the customers simultaneously, not all customers may receive this report at the same time. MOSL will not treat recipients as customers by virtue of their receiving this report.
Analyst Certification
The views expressed in this research report accurately reflect the personal views of the analyst(s) about the subject securities or issues, and no part of the compensation of the research analyst(s) was, is, or will be directly or
indirectly related to the specific recommendations and views expressed by research analyst(s) in this report.
Disclosure of Interest Statement
Analyst ownership of the stock
Companies where there is interest
No
A graph of daily closing prices of securities is available at
www.nseindia.com, www.bseindia.com.
Research Analyst views on Subject Company may vary based on Fundamental research and Technical Research. Proprietary
trading desk of MOSL or its associates maintains arm’s length distance with Research Team as all the activities are segregated from MOSL research activity and therefore it can have an independent view with regards to
subject company for which Research Team have expressed their views.
Regional Disclosures (outside India)
This report is not directed or intended for distribution to or use by any person or entity resident in a state, country or any jurisdiction, where such distribution, publication, availability or use would be contrary to law,
regulation or which would subject MOSL & its group companies to registration or licensing requirements within such jurisdictions.
For Hong Kong:
This report is distributed in Hong Kong by Motilal Oswal capital Markets (Hong Kong) Private Limited, a licensed corporation (CE AYY-301) licensed and regulated by the Hong Kong Securities and Futures Commission (SFC)
pursuant to the Securities and Futures Ordinance (Chapter 571 of the Laws of Hong Kong) “SFO”. As per SEBI (Research Analyst Regulations) 2014 Motilal Oswal Securities (SEBI Reg No. INH000000412) has an agreement with
Motilal Oswal capital Markets (Hong Kong) Private Limited for distribution of research report in Hong Kong. This report is intended for distribution only to “Professional Investors” as defined in Part I of Schedule 1 to SFO. Any
investment or investment activity to which this document relates is only available to professional investor and will be engaged only with professional investors.” Nothing here is an offer or solicitation of these securities,
products and services in any jurisdiction where their offer or sale is not qualified or exempt from registration. The Indian Analyst(s) who compile this report is/are not located in Hong Kong & are not conducting Research
Analysis in Hong Kong.
For U.S.
Motilal Oswal Securities Limited (MOSL) is not a registered broker - dealer under the U.S. Securities Exchange Act of 1934, as amended (the"1934 act") and under applicable state laws in the United States. In addition MOSL is
not a registered investment adviser under the U.S. Investment Advisers Act of 1940, as amended (the "Advisers Act" and together with the 1934 Act, the "Acts), and under applicable state laws in the United States.
Accordingly, in the absence of specific exemption under the Acts, any brokerage and investment services provided by MOSL, including the products and services described herein are not available to or intended for U.S.
persons. This report is intended for distribution only to "Major Institutional Investors" as defined by Rule 15a-6(b)(4) of the Exchange Act and interpretations thereof by SEC (henceforth referred to as "major institutional
investors"). This document must not be acted on or relied on by persons who are not major institutional investors. Any investment or investment activity to which this document relates is only available to major institutional
investors and will be engaged in only with major institutional investors. In reliance on the exemption from registration provided by Rule 15a-6 of the U.S. Securities Exchange Act of 1934, as amended (the "Exchange Act") and
interpretations thereof by the U.S. Securities and Exchange Commission ("SEC") in order to conduct business with Institutional Investors based in the U.S., MOSL has entered into a chaperoning agreement with a U.S.
registered broker-dealer, Motilal Oswal Securities International Private Limited. ("MOSIPL"). Any business interaction pursuant to this report will have to be executed within the provisions of this chaperoning agreement.
The Research Analysts contributing to the report may not be registered /qualified as research analyst with FINRA. Such research analyst may not be associated persons of the U.S. registered broker-dealer, MOSIPL, and
therefore, may not be subject to NASD rule 2711 and NYSE Rule 472 restrictions on communication with a subject company, public appearances and trading securities held by a research analyst account.
For Singapore
Motilal Oswal Capital Markets Singapore Pte Limited is acting as an exempt financial advisor under section 23(1)(f) of the Financial Advisers Act(FAA) read with regulation 17(1)(d) of the Financial Advisors Regulations and is a
subsidiary of Motilal Oswal Securities Limited in India. This research is distributed in Singapore by Motilal Oswal Capital Markets Singapore Pte Limited and it is only directed in Singapore to accredited investors, as defined in
the Financial Advisers Regulations and the Securities and Futures Act (Chapter 289), as amended from time to time. In respect of any matter arising from or in connection with the research you could contact the following
representatives of Motilal Oswal Capital Markets Singapore Pte Limited:
Disclaimer:
The report and information contained herein is strictly confidential and meant solely for the selected recipient and may not be altered in any way, transmitted to, copied or distributed, in part or in whole, to any other person
or to the media or reproduced in any form, without prior written consent. This report and information herein is solely for informational purpose and may not be used or considered as an offer document or solicitation of
offer to buy or sell or subscribe for securities or other financial instruments. Nothing in this report constitutes investment, legal, accounting and tax advice or a representation that any investment or strategy is suitable or
appropriate to your specific circumstances. The securities discussed and opinions expressed in this report may not be suitable for all investors, who must make their own investment decisions, based on their own investment
objectives, financial positions and needs of specific recipient. This may not be taken in substitution for the exercise of independent judgment by any recipient. Each recipient of this document should make such investigations
as it deems necessary to arrive at an independent evaluation of an investment in the securities of companies referred to in this document (including the merits and risks involved), and should consult its own advisors to
determine the merits and risks of such an investment. The investment discussed or views expressed may not be suitable for all investors. Certain transactions -including those involving futures, options, another derivative
products as well as non-investment grade securities - involve substantial risk and are not suitable for all investors. No representation or warranty, express or implied, is made as to the accuracy, completeness or fairness of
the information and opinions contained in this document. The Disclosures of Interest Statement incorporated in this document is provided solely to enhance the transparency and should not be treated as endorsement of the
views expressed in the report. This information is subject to change without any prior notice. The Company reserves the right to make modifications and alternations to this statement as may be required from time to time
without any prior approval. MOSL, its associates, their directors and the employees may from time to time, effect or have effected an own account transaction in, or deal as principal or agent in or for the securities
mentioned in this document. They may perform or seek to perform investment banking or other services for, or solicit investment banking or other business from, any company referred to in this report. Each of these entities
functions as a separate, distinct and independent of each other. The recipient should take this into account before interpreting the document. This report has been prepared on the basis of information that is already
available in publicly accessible media or developed through analysis of MOSL. The views expressed are those of the analyst, and the Company may or may not subscribe to all the views expressed therein. This document is
being supplied to you solely for your information and may not be reproduced, redistributed or passed on, directly or indirectly, to any other person or published, copied, in whole or in part, for any purpose. This report is not
directed or intended for distribution to, or use by, any person or entity who is a citizen or resident of or located in any locality, state, country or other jurisdiction, where such distribution, publication, availability or use would
be contrary to law, regulation or which would subject MOSL to any registration or licensing requirement within such jurisdiction. The securities described herein may or may not be eligible for sale in all jurisdictions or to
certain category of investors. Persons in whose possession this document may come are required to inform themselves of and to observe such restriction. Neither the Firm, not its directors, employees, agents or
representatives shall be liable for any damages whether direct or indirect, incidental, special or consequential including lost revenue or lost profits that may arise from or in connection with the use of the information.
The
person accessing this information specifically agrees to exempt MOSL or any of its affiliates or employees from, any and all responsibility/liability arising from such misuse and agrees not to hold MOSL or any of its affiliates or
employees responsible for any such misuse and further agrees to hold MOSL or any of its affiliates or employees free and harmless from all losses, costs, damages, expenses that may be suffered by the person accessing this
information due to any errors and delays.
Registered Office Address: Motilal Oswal Tower, Rahimtullah Sayani Road, Opposite Parel ST Depot, Prabhadevi, Mumbai-400025; Tel No.: 022-3980 4263; www.motilaloswal.com. Correspondence Address: Palm Spring
Centre, 2nd Floor, Palm Court Complex, New Link Road, Malad (West), Mumbai- 400 064. Tel No: 022 3080 1000. Compliance Officer: Neeraj Agarwal, Email Id:
na@motilaloswal.com,
Contact No.:022-30801085.
Registration details of group entities.: MOSL: SEBI Registration: INZ000158836; CDSL: IN-DP-16-2015; NSDL: IN-DP-NSDL-152-2000; Research Analyst: INH000000412. AMFI: ARN 17397. Investment Adviser: INA000007100.
Motilal Oswal Asset Management Company Ltd. (MOAMC): PMS (Registration No.: INP000000670) offers PMS and Mutual Funds products. Motilal Oswal Wealth Management Ltd. (MOWML): PMS (Registration No.:
INP000004409) offers wealth management solutions. *Motilal Oswal Securities Ltd. is a distributor of Mutual Funds, PMS, Fixed Deposit, Bond, NCDs, Insurance and IPO products. * Motilal Oswal Commodities Broker Pvt. Ltd.
offers Commodities Products. * Motilal Oswal Real Estate Investment Advisors II Pvt. Ltd. offers Real Estate products. * Motilal Oswal Private Equity Investment Advisors Pvt. Ltd. offers Private Equity products
13 December 2016
28