11 January 2018
3QFY18 Results Update | Sector: Technology
TCS
BSE SENSEX
34,503
Bloomberg
Equity Shares (m)
M.Cap.(INRb)/(USDb)
52-Week Range (INR)
1, 6, 12 Rel. Per (%)
Avg Val, INRm
Free float (%)
S&P CNX
10,651
TCS IN
1,914
5,337.8 / 83.8
2820 / 2154
2/8/-7
2929
26.4
CMP: INR2,788 TP: INR2,700(-3%)
Neutral
Recovery in Retail offset by muted BFS outlook and margin risks
Counterbalancing forces keep us subdued:
After declining for three quarters
(YoY CC), Retail recovered with 3% YoY CC growth, and TCS expects this to
reach double-digits in FY19, a key positive from its 3Q earnings. However,
1.5% QoQ CC decline in BFSI (flat YoY CC), and limited likelihood of this
rebounding in the next few quarters offset the strength in Retail. Add to that
profitability risk that current levels of INR-USD bear, and the overhang to
earnings from potentially greater taxation liability arising out of BEAT, we
remain subdued on the near-to-medium-term triggers for TCS.
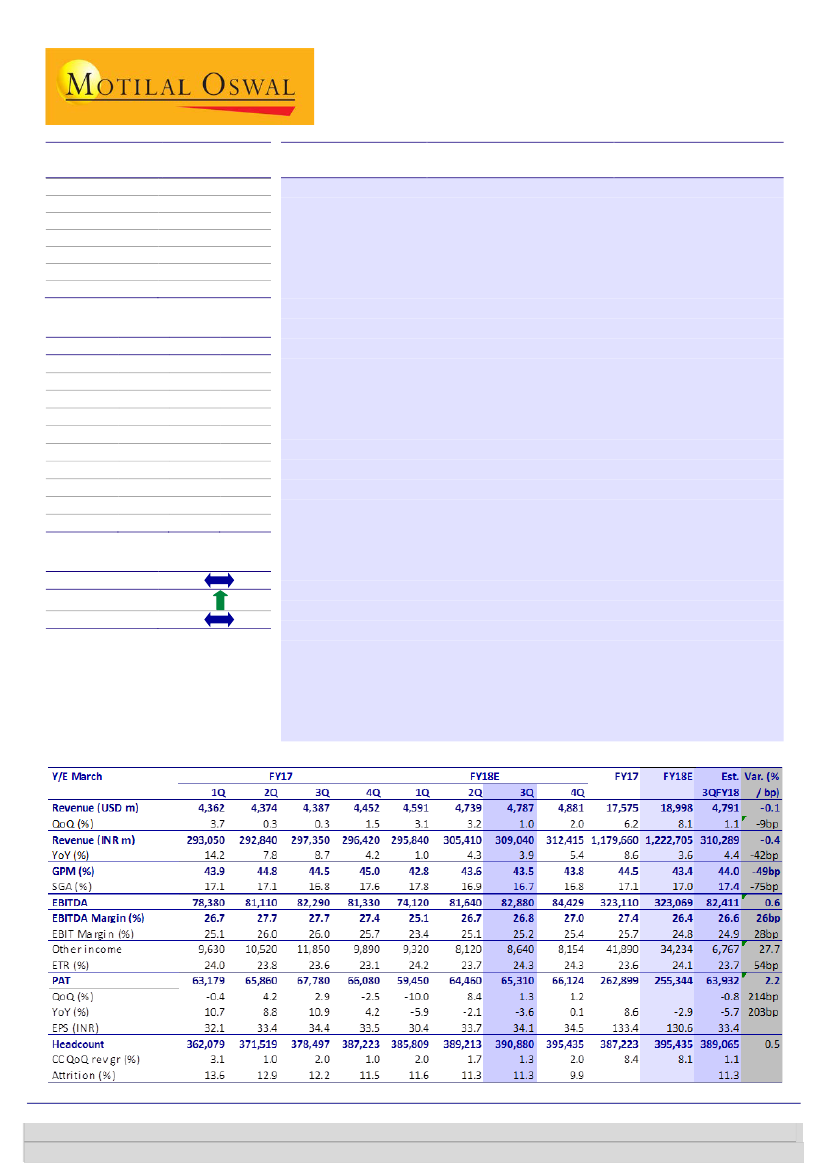
In-line operational performance:
TCS’ 3QFY18 CC revenue growth was 1.3%
QoQ, marginally ahead of our estimate of +0.9%. 9M YoY CC growth stands at
6.4%, compared to 6.2% in this quarter. EBIT margin expanded 10bp QoQ to
25.2%, as against our estimate of a 20bp contraction. PAT increased 1.3%
QoQ, but fell 3.6% YoY to INR65.3b (2% beat).
Deals getting larger in Digital:
Digital remained the key growth driver, up
39.6% YoY CC compared to overall company’s 6.2%. TCS announced its first-
ever USD50m+ deal in Digital, an indicator of the gradually increasing deal
sizes within the segment. While 39.6% CC growth of the current quarter may
not be tenable, TCS continues to witness deepening of Digital adoption
across Enterprises.
Valuation view:
Our numbers are largely unchanged post the earnings, as
Retail recovery was offset by continued expectation of a soft BFS.
Management cited that momentum pick-up in Retail leaves it with only BFS
as the segment where recovery is still WIP. We believe intermittent risks to
TCS’ valuations maybe three-fold: [1] BFS softness, [2] margin headwinds
from a strong INR and [3] likelihood of additional taxation burden under the
new US tax regime. Our price target of INR2,700 (3% downside to CMP),
based 17x forward earnings, keeps us
Neutral.
Financials & Valuations (INR b)
2017
2018E
Y/E Mar
1,179.7 1,222.7
Net Sales
323.1
323.1
EBITDA
262.9
255.3
PAT
133.4
130.6
EPS (INR)
8.3
-2.1
Gr. (%)
448.3
417.0
BV/Sh (INR)
32.6
30.4
RoE (%)
32.4
26.5
RoCE (%)
20.9
21.4
P/E (x)
6.2
6.7
P/BV (x)
2019E
1,358.2
358.8
282.0
147.3
12.8
481.0
32.9
25.3
18.9
5.8
Estimate change
TP change
Rating change
Quarterly Performance (Consolidated)
Investors are advised to refer through important disclosures made at the last page of the Research Report.
Motilal Oswal research is available on www.motilaloswal.com/Institutional-Equities, Bloomberg, Thomson Reuters, Factset and S&P Capital.
Ashish Chopra
– Research analyst
(Ashish.Chopra@MotilalOswal.com); +91 22 6129 1530
Sagar Lele
– Research analyst
(Sagar.Lele@MotilalOswal.com); +91 22 6129 1531

TCS
Momentum in Digital on an upward trajectory
USD revenue grew 1% QoQ to USD4,787m, in line with our estimate of
USD4,791m. In rupee terms, revenue at INR309b grew by 1.2% QoQ.
In CC terms growth of 1.3% QoQ was slightly ahead of our estimate of 0.9%.
Cross-currency headwinds for TCS were at 30bp compared to our expectation of
a tailwind of 20bp.
While the volume growth was 1.6% QoQ, realization declined 30bp QoQ in
constant currency.
YoY CC revenue growth during the quarter was 6.1% in 3QFY18 and 6.4% in
9MFY18.
Strength in Digital has been buoyant. Revenue from Digital grew by 13.9% QoQ
CC (40% YoY CC), and it now constitutes to 22.1% of total revenue. This
compares with contribution of 19.7% in 2QFY18 and 16.8% in 3QFY17.
Exhibit 1: YoY CC growth remains in single digits
CC revenue growth (QoQ, %)
CC revenue growth (YoY, %)
Source: MOSL, Company
Exhibit 2: Breakup of revenue growth
1QFY17: USD revenue growth impacts
Volume
Realization change
Cross currency movements
QoQ USD revenue growth (%)
Percentage
+1.6
-0.3
-0.3
+1.0
Source: Company, MOSL
Exhibit 3: Volume growth and realization pressures picking up
CC volume growth (YoY, %)
CC pricing growth (YoY, %)
0% 0% 1%
-1%
-1%
-1%
-2% -2%
-3% -3%
0%
-1%
-1%
-2%
-2%
-2%
-3%
-3%
-4%
Source: MOSL, Company
11 January 2018
2

TCS
Segmental Color – US dragged down by problem verticals
In the Americas, Latin America exhibited stronger growth (5.4% YoY CC)
compared to North America, which grew by 2.8% YoY CC.
Growth in Europe was driven by Continental Europe (22.3% YoY CC), while UK
grew by 8.2% YoY CC.
India seized the decline pressure seen in the previous quarter and exhibited
volatility growth of 0.5% QoQ CC. On a sequential basis, even Asia Pacific and
MEA exhibited flattish trends.
Exhibit 4: Growth lower because of North America
Geographies
North America
Latin America
UK
Continental Europe
India
APAC
MEA
Contr. to
overall rev (%)
CC QoQ
Gr. (%)
CC YoY
Gr. (%)
52.0
2.2
14.1
13.5
6.3
9.5
2.4
1.5
5.0
0.8
2.6
0.5
0.0
-0.2
2.8
5.4
8.2
22.3
4.1
6.2
3.7
Source: Company, MOSL
All verticals apart from BFSI (0.2% YoY CC), Retail (3.0% YoY CC) and Regional
Markets & Others (2.2% YoY CC) were strong, growing at >9.5% YoY CC.
Four verticals grew in double-digits, with Energy & Utilities and Travel &
Hospitality clocking growth of 29.4% YoY CC and 24.1% YoY CC respectively.
Exhibit 5: Robust growth seen in Energy & Utilities and Travel & Hospitality
Services
BFSI
Retail & CPG
Communication & Media
Manufacturing
Life Sciences & Healthcare
Energy & Utilities
Travel & Hospitality
Technology & Services
Regional Markets & Others
Contr. to
overall rev (%)
CC QoQ
Gr. (%)
CC YoY
Gr. (%)
32.1
12.5
7.4
7.6
7.3
4.5
3.8
8.0
16.8
-1.5
6.4
2.2
2.1
2.5
8.5
2.9
0.1
0.5
0.2
3.0
16.9
9.5
13.5
29.4
24.1
9.6
2.2
Source: Company, MOSL
Revenue from Digital grew by 13.9% QoQ CC and 39.6% YoY CC and now
constitutes to 22.1% of total revenue.
Revenue from Digital is now at a run-rate of USD4b and continues to be
supported by deal wins.
Stable profitability; PAT beat led by higher other income
EBIT margin expanded by 10bp QoQ to 25.2%, against our estimate of 24.9%.
PAT was INR65.3b, up 1.3% QoQ, above our estimate of INR63.9b, mainly led by
higher other income than we anticipated.
11 January 2018
3

TCS
Exhibit 6: SGA lower by 20bp QoQ
SGA (% of Revenues)
26.3 26.8 27.0 27.2
25.1
EBIT Margin (%)
25.1 25.2
27.1 26.6 26.1
25.1 26.0 26.0 25.7
23.4
17.6 17.8 16.9 16.7
17.5 17.0 17.3
16.3 17.1 16.7 17.3 17.0 17.1 17.1 16.8
Source: Company, MOSL
Takeaways from Management commentary
Robust growth in Digital:
Digital, now 22.1% of total revenue, continued
exhibiting strength having grown by 13.9% QoQ CC and 39.6% YoY.
Engagements have been increasing in size, and multiple customers have been in
discussions with TCS as they look at large transformational programmes. TCS
won a USD50m+ deal in Digital this quarter, which is indicative of Digital
becoming mainstream, and of TCS’ prowess.
BFS still soft:
BFSI in 3Q saw a decline of 1.5% QoQ and growth of 0.2% YoY, led
by furloughs and softened demand trends. In the stack, the situation is relatively
better in Europe and in Insurance. Weakness has been persistent in some large
BFS accounts in North America, which has been weighing on overall
performance. Strategic decisions of these customers should firm up over the
next couple of quarters, and only then reflect in better performance for TCS.
Turnaround in Retail:
Retail has been a troubled area in recent quarters, and
also saw a decline in 2QFY18, when it bottomed out. In 3Q, the vertical grew by
6.4% QoQ CC staging a comeback. While YoY CC growth is at 3.0%, the pick-up is
expected to lead to double-digit growth in FY19. An uptick has been seen in
technology spend by traditional retailers, post a strong holiday season. Visibility
from recent deal wins and a better situation with offline retailers feed into the
optimism.
Stable margins ex. currency:
EBIT margins for TCS expanded by 10bp QoQ in
3QFY18. Adjusted for currency, margins have been stable for TCS. It structurally
continues to believe profitability has a case for being maintained its target band
of 26-28%.
Awaiting clarity on BEAT:
There will be no financial impact of US tax reforms in
FY18. In the future, TCS will be impacted by lower tax rates and by the BEAT
provision. However, because of the lack of clarity in some areas, TCS is still
evaluating the likely impact (both direction and quantum).
Upping estimates by ~2%
Revenue growth for TCS was a tad above expectations on a constant currency
basis. A sharp rebound in Retail was a key contributor in the mild surprise.
Expectations of double-digit growth in Retail in FY19E and a possible
11 January 2018
4

TCS
improvement in BFS lead to our expectation of 9.1/7.9% growth in FY19/20E,
which is higher than our previous estimates by 0.4/1.1%.
Margins have bettered our expectations over the last couple of quarters.
Factoring this stability in we have adjusted our margin estimates upwards by
30/50bp for FY19/20E.
However, given the lack of material levers and recent INR appreciation, we
continue to maintain our flattish to negative trajectory expectations. We model
24.8/24.6% EBIT margin in FY19/20E.
The combination of the above factors leads to an EPS change of +2.4/2.2% for
FY19/20E.
Exhibit 7: Change in estimates
Revised
Earlier
Change
FY18E FY19E FY20E FY18E FY19E FY20E FY18E FY19E FY20E
64.4
65.5
66.4
64.8
65.5
66.4 -0.7% 0.0% 0.0%
18,998 20,737 22,379 18,992 20,662 22,142 0.0% 0.4% 1.1%
7.7
9.1
7.9
7.7
8.8
7.2
4bp 36bp 76bp
24.8
24.8
24.6
24.7
24.5
24.2
7bp 26bp 46bp
130.6 147.3 161.0 131.2 143.9 157.9 -0.5% 2.4% 2.0%
Source: Company, MOSL
INR/USD
USD Revenue - m
USD revenue growth (%)
EBIT Margin (%)
EPS - INR
Investment Thesis
A foreword on the long term industry view:
Growth for Indian IT should gradually
pick-up from current 6-7% as Digital services proliferate, which today are still small
to move the needle on overall performance. India will continue to remain the
hotbed for talent supply en masse, making a case for increasing shift of Digital
business from onsite. That said, with Automation the top priority of every Board,
without exceptions, delineation of revenue growth with headcount growth appears
obvious – and the only lever to stem the decline in profitability witnessed in recent
years.
TCS in that industry backdrop
Leading provider of Digital and Traditional Services:
TCS has long led the
industry growth and on the highest base, with USD revenues up between 15-
29% YoY over FY11-15. However, having breached the base of USD15b, that has
slowed down due to a combination of factors: [1] Slowing growth in traditional
and a small base in Digital, [2] sporadic soft segments at different points of time
– Japan, Latam, Diligenta, BFS, Retail and [3] Macro factors such as Brexit, US
elections. Digital has scaled up to annualized revenues of USD4b+, and as the
company continues to address that, its prowess should help it revert to industry
leading growth in a couple of years.
Best-in-class operational efficiency:
Amidst severe pricing pressure that the
industry has witnessed in the traditional services, TCS has managed to retain its
EBIT margins upwards of 25%, and is the only company in the IT Services
landscape to have managed the same. This has been a function of superior
operating efficiency execution despite an employee base nearing 400,000. That
said, the company has also leveraged most avenues on the margins, leaving it
vulnerable to a fresh set of headwinds such as currency.
11 January 2018
5

TCS
Basis the above, we expect TCS’ revenues to grow at least in line with the industry as
the heavy legacy exposure gradually withers down. In the absence of appreciating
trend of the Rupee, it should be able to hold on to its margins, which will be a
function of greater revenue per employee and lower headcount growth v/s revenue
growth. As a result, our roll forward earnings CAGR over the next three years for TCS
is at 10.5%.
Exhibit 8: TCS – Business Construct
Y/E March
USD revenue growth (%)
Employee growth (%)
Revenue per employee (USDk per annum)
EPS growth (%)
2012
24.2
20.1
46,528
22.5
2013
13.7
15.8
44,945
31.0
2014
16.2
8.8
46,623
37.1
2015
15.0
6.4
49,843
13.5
2016
7.1
10.7
49,128
11.2
2017
6.2
9.4
47,432
8.3
2018E
8.1
2.1
48,549
(2.1)
2019E
9.1
8.6
50,273
12.8
2020E
7.9
6.7
50,403
9.3
2021E
9.0
7.0
51,406
11.0
Source: Company, MOSL
Valuation and view
During the period of outperformance, TCS’ traction has been impressively
broad-based, unlike select pockets of stress across its peer group. However, on a
much higher base, troubled pockets – both secular and company-specific, have
been weighing on overall performance with greater consistency.
The growth outperformance to industry peers has waned, and the company’s
investments in building Digital prowess are pitted against the law of large
numbers in its quest to recoup relative growth advantage. We are factoring
growth in FY19 to improve over FY18 – led mainly by recovery in Retail, but still
to remain short of 10%, pending recovery in BFS.
Incremental improvements in BFS should be a key trigger for the stock. While
the company believes the situation in Retail has bottomed out, recovery in BFS
seems elusive for now.
We believe intermittent risks to TCS’ valuations maybe three-fold: [1] BFS
softness, [2] Margin headwinds from strong Rupee, and [3] Likelihood of
additional taxation burden under the new US tax regime. Our price target of
INR2,700 (3% downside to CMP) keeps us Neutral.
What it means for the target price
3-year view:
Leading revenue growth in the past, combined with industry
leading margins have led to a justified valuation premium for TCS over its peers.
Considering the Digital prowess building gradually on a high base, we expect this
trend to sustain. Valuation multiples have had a strong correlation to USD
revenue growth, and hence improvement in the same for TCS holds potential to
drive further re-rating. If we compare TCS with peers such as ACN and CTSH,
which command forward multiples of 19-20x, TCS, with its organic-dependent
growth, too can command the same, which is also in line with its long period
average. 19x FY22E earnings imply three-year price target of INR3,800, which
implies a returns CAGR of 11%.
1-year view:
Over the near term, we believe intermittent risks to TCS’ valuations
maybe three-fold: [1] BFS softness, [2] Margin headwinds from strong Rupee,
and [3] Likelihood of additional taxation burden under the new US tax regime.
Our price target of INR2,700 (3% downside to CMP) keeps us Neutral.
11 January 2018
6

TCS
Key triggers
Strong pickup in BFSI | Retail
Digital-led resurgence in growth leadership
Turnaround in margins trajectory in the near term
Key risk factors
Further deceleration in YoY CC growth from turbulent macro
Continued trend of Rupee strengthening
Impact from intense pricing pressure
Exhibit 10: TCS 1-year forward PB chart
23.4
Max (x)
-1SD
11.0
8.0
5.0
P/B (x)
Min (x)
Avg (x)
+1SD
Max (x)
-1SD
Exhibit 9: TCS 1 year forward PE chart
27.0
20.0
13.0
6.0
P/E (x)
Min (x)
Avg (x)
+1SD
20.8
17.4
13.9
7.0
18.1
8.2
7.0
5.8
4.6
2.3
5.7
2.0
Source: Company, MOSL
Exhibit 11: Comparative Valuation
Company
TCS
Infosys
Wipro
HCL Tech
TechM
Tier-I Agg
Mkt cap Rating
TP Upside
EPS (INR)
P/E (x)
(USD b)
(INR)
(%) FY18E FY19E FY20E FY18E FY19E
86.5
Neutral 2,700 -3.2 130.6 147.3 161.0 21.4 18.9
38.7
Buy 1,200 11.6
64.7 69.0 77.5 16.6 15.6
24.9
Neutral 315
-1.9
19.0 19.4 22.3 16.9 16.5
20.9
Neutral 970
5.7
62.4 64.6 69.6 14.7 14.2
8.5
Buy
600
9.2
36.7 39.7 45.7 15.0 13.8
179.6
16.9 15.8
FY20E FY18E
17.3 30.4
13.9 21.8
14.4 16.9
13.2 25.6
12.0 19.1
14.2 22.7
RoE (%)
FY19E
32.9
22.3
16.2
24.5
18.8
22.9
FY20E
31.3
22.6
16.6
24.0
19.0
22.7
FY18-20E CAGR (%)
USD rev.
EPS
8.5
11.0
8.2
9.4
7.4
8.3
7.9
5.6
9.3
11.7
Source: Company, MOSL
11 January 2018
7

TCS
Story in charts
Exhibit 12: Outperformance to peers has waned…
FY11
FY12
FY13
FY14
FY15
FY16
FY17
Exhibit 13: … amid fast decelerating revenues
CC revenue growth (YoY, %)
TCS
Infosys
Wipro (IT
Services)
HCL Tech
Source: Company, MOSL
*FY17 estimates; Source: Company, MOSL
Exhibit 14: Revenue growth getting delinked to headcount…
180
170
160
150
140
130
120
110
100
Headcount
USD revenues
Exhibit 15: ...as competitive intensity gradually pulls down
pricing
102
100
98
96
94
92
90
Picing indexed at 100
Source: Company, MOSL
Exhibit 16: Operating at peak efficiency, reflected in
utilization (assumed 4QFY16 onwards)…
Util Excl. Trainees (%)
86.7
85.484.986.084.984.984.986.084.984.9
85.386.2
84.984.9
Exhibit 17: ..Margins are now below the target range
SGA (% of Revenues)
EBIT Margin (%)
25.126.026.025.7
25.125.2
84.9
26.326.827.027.2
25.1
27.126.626.1
23.4
79.8
81.382.181.582.082.380.980.982.0
83.082.082.082.082.082.0
17.517.017.3
16.317.116.717.317.017.117.116.8
17.617.816.916.7
Source: Company, MOSL
11 January 2018
8

TCS
Operating metrics
2QFY16
Verticals (%)
BFSI
Retail & CPG
Communication & Media
Manufacturing
Life Sciences & Healthcare
Energy & Utilities
Travel & Hospitality
Technology & Services
Regional Markets & Others
Digital
Geographies (%)
America
UK
Rest of Europe
Europe
India
APAC
Latin America
MEA
Others
QoQ growth (%)
BFSI
Retail & CPG
Communication & Media
Manufacturing
Life Sciences & Healthcare
Energy & Utilities
Travel & Hospitality
Technology & Services
Regional Markets & Others
Digital
America
UK
Rest of Europe
Europe
India
APAC
Latin America
MEA
Others
Total Employees
Trainee Additions
Lateral Additions
Overseas Additions
Gross Additions
Net Additions
Attrition (LTM %)
3QFY16
4QFY16
1QFY17
33.3
13.5
7.0
7.3
6.8
3.6
3.2
7.8
17.5
15.9
52.7
16.4
10.8
27.2
6.5
9.4
1.8
2.4
20.1
53.5
15.9
10.9
26.8
6.0
9.4
2.1
2.2
19.7
54.0
14.9
11.2
26.1
5.9
9.6
2.0
2.4
19.9
53.5
14.8
11.5
26.3
6.2
9.6
2.0
2.4
20.2
2QFY17
33.6
13.0
7.2
7.3
7.0
3.7
3.3
7.8
17.1
16.1
54.0
13.8
11.8
25.6
5.8
10.2
2.0
2.4
20.4
3QFY17
33.9
13.0
6.7
7.4
6.9
3.6
3.2
7.8
17.5
16.8
55.0
13.3
11.1
24.4
6.3
9.6
2.2
2.5
20.6
4QFY17
32.9
12.3
7.2
7.4
6.9
3.7
3.4
7.8
18.4
17.9
53.3
13.7
11.8
25.5
6.8
9.7
2.1
2.6
21.2
1QFY18
32.9
12.2
7.3
7.5
7.1
4.0
3.5
7.9
17.6
18.9
52.5
13.9
12.5
26.4
7.0
9.5
2.1
2.5
21.1
2QFY18
33.0
11.9
7.3
7.5
7.2
4.2
3.8
8.1
17.0
19.7
51.9
14.0
13.4
27.4
6.3
9.8
2.2
2.4
20.7
3QFY18
32.1
12.5
7.4
7.6
7.3
4.5
3.8
8.0
16.8
22.1
52.0
14.1
13.5
27.6
6.3
9.5
2.2
2.4
20.4
2.8
1.2
2.5
4.9
-3.3
-4.9
1.1
0.6
4.3
3.3
-1.7
-1.1
4.6
-7.9
-0.2
0.8
-0.3
3.7
-2.5
16.3
-3.3
12.3
-8.6
10.7
3.0
-2.3
2.5
335,620 344,691 353,843
9,943
7,593
8,623
10,978 10,451 10,659
4,265
4,074
3,294
25,186 22,118 22,576
10,685
9,071
9,071
16.2
15.9
15.5
1.2
1.2
-1.5
3.1
3.5
-1.7
1.2
-3.4
0.3
-4.0
2.3
0.7
6.1
-3.4
3.1
-6.7
9.1
4.6
3.2
2.4
3.1
0.3
1.7
1.5
4.5
3.2
2.4
0.3
3.2
-1.1
1.5
6.1
4.7
2.4
3.2
3.1
-2.4
4.3
11.5
8.4
8.2
3.1
3.4
-2.7
7.8
6.2
12.1
1.0
3.4
0.3
0.3
1.5
4.4
5.8
-0.2
0.3
-2.0
2.6
6.7
-1.4
-0.3
-0.2
-2.0
1.5
4.7
8.1
8.9
7.6
13.3
1.5
2.7
1.2
2.2
-1.7
1.6
2.0
1.2
3.0
-6.5
-3.3
4.5
4.6
4.0
1.7
6.5
2.9
-5.7
7.9
9.2
10.7
1.8
4.5
-2.4
-4.4
6.1
6.8
7.1
1.8
9.0
-6.2
8.9
9.5
6.2
-7.1
1.0
3.7
6.5
-5.6
2.5
1.0
6.5
-2.1
3.7
0.3
10.3
-3.1
3.1
8.1
1.0
3.7
0.3
4.5
5.5
-0.8
-0.9
1.0
5.2
1.3
1.3
4.4
2.6
1.3
-0.5
362,079 371,519 378,497 378,223 385,809 389,213 390,880
5,038 11,884 10,950 11,556
1,659
6,722
5,933
9,877
7,486
4,804
5,733
6,289
5,421
3,672
2,877
3,295
2,608
2,804
3,254
3,725
2,929
17,792 22,665 18,362 20,093 11,202 15,868 12,534
9,071
9,440
6,978
8,726
-1,414
3,404
1,667
13.6
12.9
12.2
11.5
11.6
11.3
11.1
11 January 2018
9

TCS
Financials and Valuations
Key assumption
Y/E Mar
INR/USD Rate
Revenues (USD m)
Offshore Revenue (%)
Total Headcount
Net Addition
Per Capita Productivity
Util. excl. trainees (%)
Util. incl. trainees (%)
2013
54.4
11,568
49.3
276,196
37,613
44,945
81.7
68.3
2013
629,895
28.8
180,870
28.7
10,792
170,078
11,174
0
181,252
40,344
22.3
1,494
139,413
139,413
31.0
2013
1,957
407,524
409,481
1,000
6,561
10,894
427,936
135,587
53,644
81,944
33,765
403,836
172,366
79,035
152,435
91,609
91,609
312,228
427,936
2014
60.9
13,443
47.9
300,464
24,268
46,623
83.6
75.4
2014
818,094
29.9
251,322
30.7
13,243
238,079
15,891
0
253,969
60,712
23.9
2,089
191,168
191,168
37.1
2014
1,959
551,393
553,352
0
6,905
12,561
572,817
170,530
66,887
103,644
37,673
547,808
222,360
156,495
168,953
116,308
116,308
431,500
572,817
2015
61.2
15,454
46.2
319,656
19,192
49,843
85.9
82.0
2015
946,484
15.7
272,941
28.8
18,698
254,243
31,393
0
285,636
66,564
23.3
2,114
216,958
216,958
13.5
2015
1,959
572,808
574,767
0
9,136
19,004
602,907
201,300
85,585
115,716
7,283
626,539
242,670
197,713
186,157
146,630
146,630
479,909
602,907
2016
65.7
16,544
46.0
353,843
34,187
49,128
85.5
80.5
2016
1,086,462
14.8
306,780
28.2
18,879
287,901
30,498
0
318,399
75,026
23.6
1,227
242,146
242,146
11.6
2016
1,970
729,929
731,899
0
3,542
14,092
749,533
222,363
104,464
117,900
7,831
786,397
280,646
292,021
213,731
162,594
162,594
623,803
749,533
2017
67.1
17,575
46.0
387,223
33,380
47,432
85.2
81.4
2017
1,179,660
8.6
323,110
27.4
19,870
303,240
41,890
0
345,130
81,560
23.6
671
262,899
262,899
8.6
2017
1,970
881,180
883,150
0
3,660
13,070
899,880
241,744
124,334
117,410
3,440
932,680
280,350
456,630
195,700
153,650
153,650
779,030
899,880
2018E
64.4
18,998
46.0
395,435
8,212
48,549
84.8
82.7
2018E
1,222,705
3.6
323,069
26.4
20,148
302,922
34,234
0
337,155
81,341
24.1
470
255,344
255,344
-2.9
2018E
1,910
794,582
796,492
0
3,440
14,510
814,442
288,260
144,481
143,779
3,450
825,874
304,030
343,367
178,477
158,662
158,662
667,213
814,442
2019E
65.5
20,737
46.0
429,526
34,090
50,273
84.8
81.6
2019E
1,358,242
11.1
358,773
26.4
21,988
336,785
36,387
0
373,173
90,649
24.3
560
281,963
281,963
10.4
2020E
66.4
22,379
46.0
458,469
28,944
50,403
84.8
82.2
2020E
1,485,495
9.4
389,670
26.2
24,048
365,622
42,186
0
407,808
99,063
24.3
560
308,185
308,185
9.3
Income Statement
Y/E Mar
Net Sales
Change (%)
EBITDA
EBITDA Margin (%)
Depreciation
EBIT
Other Income
Extraordinary items
PBT
Tax
Tax Rate (%)
Min. Int. & Assoc. Share
Reported PAT
Adjusted PAT
Change (%)
(INR Million)
Balance Sheet
Y/E Mar
Share Capital
Reserves
Net Worth
Preference Shares
Minority Interest
Loans & Other Liabilities
Total Capital Employed
Gross Fixed Assets
Less: Acc Depreciation
Net Fixed Assets
Investments
Current Assets
Debtors
Cash & Bank
Loans & Adv, Others
Curr Liabs & Provns
Curr. Liabilities
Net Current Assets
Total Assets
(INR Million)
2019E
2020E
1,910
1,910
916,827 1,046,776
918,737 1,048,686
0
0
3,440
3,440
16,130
17,566
938,307 1,069,692
316,450 344,640
166,469 190,518
149,981 154,123
3,450
3,450
960,034 1,101,179
339,377 370,688
423,328 514,413
197,328 216,078
175,157 189,060
175,157 189,060
784,877 912,119
938,307 1,069,692
11 January 2018
10

TCS
Financials and Valuations
Ratios
Y/E Mar
Basic (INR)
EPS
Cash EPS
Book Value
DPS
Payout (incl. Div. Tax.)
Valuation(x)
P/E
Cash P/E
Price / Book Value
EV/Sales
EV/EBITDA
Dividend Yield (%)
Profitability Ratios (%)
RoE
RoCE
RoIC
Turnover Ratios (%)
Fixed Asset Turnover (x)
Debtors (No. of Days)
Leverage Ratios (%)
Net Debt/Equity (x)
2013
71.2
76.7
209.7
22.0
30.9
2014
97.6
104.4
282.5
32.0
32.8
2015
110.8
120.3
293.4
79.0
71.3
2016
123.2
132.5
371.4
43.4
35.2
2017
133.4
143.5
448.3
47.0
35.2
2018E
130.6
144.2
417.0
144.1
110.3
2019E
147.3
159.1
481.0
69.2
47.0
2020E
161.0
173.9
549.1
77.2
47.9
20.9
19.4
6.2
4.3
15.6
1.7
37.8
36.5
42.4
8.6
89.8
-0.2
2013
180,870
-30,664
-13,501
136,704
-6,733
129,971
-33,765
-40,498
0
-1,412
-50,377
-51,788
44,418
34,616
79,034
39.7
38.6
52.2
8.8
88.1
-0.3
2014
251,322
-46,910
12,834
217,246
-64,233
153,012
-3,909
-68,142
0
1,666
-73,310
-71,643
77,461
79,034
156,494
38.5
37.8
50.2
8.6
89.7
-0.3
2015
272,941
-57,762
25,257
240,437
-49,941
190,496
30,391
-19,550
0
6,444
-186,113
-179,670
41,217
156,494
197,712
37.1
36.8
51.9
9.3
87.9
-0.4
2016
306,780
-45,755
-32,355
228,670
-38,294
190,376
-548
-38,842
12,778
-4,913
-103,385
-95,519
94,309
197,712
292,020
32.6
32.4
52.1
10.0
86.8
-0.5
2017
323,110
-40,341
-17,705
265,064
7,707
272,771
4,391
12,097
453
-1,022
-111,984
-112,553
164,609
292,020
456,629
21.4
19.3
6.7
4.1
15.5
5.2
30.4
26.5
50.7
9.4
87.2
-0.4
2018E
323,069
-47,578
5,248
280,740
-53,210
227,530
-10
-53,220
-202,987
1,440
-139,235
-340,783
-113,263
456,629
343,366
18.9
17.5
5.8
3.6
13.7
2.5
32.9
25.3
52.1
9.2
86.5
-0.4
2019E
358,773
-54,822
-24,009
279,942
-41,884
238,058
0
-41,884
0
1,621
-159,718
-158,098
79,961
343,366
423,327
17.3
16.0
5.1
3.2
12.4
2.8
31.3
25.2
52.1
9.8
87.2
-0.5
2020E
389,670
-57,437
-21,976
310,257
-42,371
267,886
0
-42,371
0
1,436
-178,236
-176,801
91,085
423,327
514,412
Cash Flow Statement
Y/E Mar
Adjusted EBITDA
Non cash opr. exp (inc)
(Inc)/Dec in Wkg. Cap.
CF from Op. Activity
(Inc)/Dec in FA & CWIP
Free cash flows
(Pur)/Sale of Invt
CF from Inv. Activity
Inc/(Dec) in Net Worth
Inc / (Dec) in Debt
Divd Paid (incl Tax) & Others
CF from Fin. Activity
Inc/(Dec) in Cash
Add: Opening Balance
Closing Balance
(INR Million)
11 January 2018
11

TCS
Corporate profile
Company description
TCS is the largest IT services company in India, with
(LTM) revenue of over USD17.6b. It employs over
385,000 people and provides IT and BPO services to
over 1,000 global clients. It is one of the preferred
IT vendors for most Fortune 500/Global 1,000
companies.
Exhibit 1: Sensex rebased
Source: MOSL/Bloomberg
Exhibit 2: Shareholding pattern (%)
Sep-17
Promoter
DII
FII
Others
73.6
5.7
16.6
4.2
Jun-17
73.6
5.5
16.7
4.2
Sep-16
73.3
5.2
17.0
4.5
Source: Capitaline
Exhibit 3: Top holders
Holder Name
LIC of India
NA
NA
NA
NA
% Holding
4.0
0.0
0.0
0.0
0.0
Source: Capitaline
Note: FII Includes depository receipts
Exhibit 4: Top management
Name
N Chandrasekaran
Rajesh Gopinathan
N Ganapathy Subramaniam
Rajendra Moholkar
Designation
Chairman
Managing Director & CEO
Executive Director & COO
Company Secretary
Exhibit 5: Directors
Name
Aarthi Subramanian
Aman Mehta
O P Bhatt
V Thyagarajan
Name
Ishaat Hussain
Clayton M Christensen
Ron Sommer
Vijay Kelkar
Source: Capitaline
*Independent
Exhibit 6: Auditors
Name
B S R & Co LLP
Deloitte Haskins & Sells LLP
Type
Statutory
Statutory
Exhibit 7: MOSL forecast v/s consensus
EPS
(INR)
FY18
FY19
FY20
MOSL
forecast
130.6
147.3
161.0
Consensus
forecast
134.7
148.4
162.2
Variation (%)
-3.1
-0.7
-0.7
Source: Bloomberg
Source: Capitaline
11 January 2018
12

TCS
NOTES
11 January 2018
13

Disclosures:
The following Disclosures are being made in compliance with the SEBI Research Analyst Regulations 2014 (herein after referred to as the Regulations).
Motilal Oswal Securities Ltd. (MOSL) is a SEBI Registered Research Analyst having registration no. INH000000412. MOSL, the Research Entity (RE) as defined in the Regulations, is engaged in the business of providing Stock
broking services, Investment Advisory Services, Depository participant services & distribution of various financial products. MOSL is a subsidiary company of Motilal Oswal Financial Service Ltd. (MOFSL). MOFSL is a listed
public company, the details in respect of which are available on
www.motilaloswal.com.
MOSL is registered with the Securities & Exchange Board of India (SEBI) and is a registered Trading Member with National Stock
Exchange of India Ltd. (NSE) and Bombay Stock Exchange Limited (BSE), Metropolitan Stock Exchange Of India Ltd. (MSE) for its stock broking activities & is Depository participant with Central Depository Services Limited
(CDSL) & National Securities Depository Limited (NSDL) and is member of Association of Mutual Funds of India (AMFI) for distribution of financial products. Details of associate entities of Motilal Oswal Securities Limited are
available on the website at
http://onlinereports.motilaloswal.com/Dormant/documents/Associate%20Details.pdf
Pending Regulatory Enquiries against Motilal Oswal Securities Limited by SEBI:
SEBI pursuant to a complaint from client Shri C.R. Mohanraj alleging unauthorized trading, issued a letter dated 29th April 2014 to MOSL notifying appointment of an Adjudicating Officer as per SEBI regulations to hold
inquiry and adjudge violation of SEBI Regulations; MOSL requested SEBI to provide all documents, records, investigation report relied upon by SEBI which were referred in Show Cause Notice. The matter is currently
pending.
MOSL, it’s associates, Research Analyst or their relative may have any financial interest in the subject company. MOSL and/or its associates and/or Research Analyst may have beneficial ownership of 1% or more securities in
the subject company at the end of the month immediately preceding the date of publication of the Research Report.
MOSL and its associate company(ies), their directors and Research Analyst and their relatives may; (a)
from time to time, have a long or short position in, act as principal in, and buy or sell the securities or derivatives thereof of companies mentioned herein. (b) be engaged in any other transaction involving such securities and
earn brokerage or other compensation or act as a market maker in the financial instruments of the company(ies) discussed herein or act as an advisor or lender/borrower to such company(ies) or may have any other
potential conflict of interests with respect to any recommendation and other related information and opinions.; however the same shall have no bearing whatsoever on the specific recommendations made by the analyst(s),
as the recommendations made by the analyst(s) are completely independent of the views of the associates of MOSL even though there might exist an inherent conflict of interest in some of the stocks mentioned in the
research report.
Research Analyst may have served as director/officer, etc. in the subject company in the last 12 month period. MOSL and/or its associates may have received any compensation from the subject company in
the past 12 months.
In the last 12 months period ending on the last day of the month immediately preceding the date of publication of this research report, MOSL or any of its associates may have:
a)
managed or co-managed public offering of securities from subject company of this research report,
b)
received compensation for investment banking or merchant banking or brokerage services from subject company of this research report,
c)
received compensation for products or services other than investment banking or merchant banking or brokerage services from the subject company of this research report.
d)
Subject Company may have been a client of MOSL or its associates during twelve months preceding the date of distribution of the research report.
MOSL and it’s associates have not received any compensation or other benefits from the subject company or third party in connection with the research report. To enhance transparency, MOSL has incorporated a Disclosure
of Interest Statement in this document. This should, however, not be treated as endorsement of the views expressed in the report. MOSL and / or its affiliates do and seek to do business including investment banking with
companies covered in its research reports. As a result, the recipients of this report should be aware that MOSL may have a potential conflict of interest that may affect the objectivity of this report. Compensation of Research
Analysts is not based on any specific merchant banking, investment banking or brokerage service transactions.
Terms & Conditions:
This report has been prepared by MOSL and is meant for sole use by the recipient and not for circulation. The report and information contained herein is strictly confidential and may not be altered in any way, transmitted to,
copied or distributed, in part or in whole, to any other person or to the media or reproduced in any form, without prior written consent of MOSL. The report is based on the facts, figures and information that are considered
true, correct, reliable and accurate. The intent of this report is not recommendatory in nature. The information is obtained from publicly available media or other sources believed to be reliable. Such information has not
been independently verified and no guaranty, representation of warranty, express or implied, is made as to its accuracy, completeness or correctness. All such information and opinions are subject to change without notice.
The report is prepared solely for informational purpose and does not constitute an offer document or solicitation of offer to buy or sell or subscribe for securities or other financial instruments for the clients. Though
disseminated to all the customers simultaneously, not all customers may receive this report at the same time. MOSL will not treat recipients as customers by virtue of their receiving this report.
Analyst Certification
The views expressed in this research report accurately reflect the personal views of the analyst(s) about the subject securities or issues, and no part of the compensation of the research analyst(s) was, is, or will be directly or
indirectly related to the specific recommendations and views expressed by research analyst(s) in this report.
TCS
Disclosure of Interest Statement
Analyst ownership of the stock
TCS
No
A graph of daily closing prices of securities is available at
www.nseindia.com, www.bseindia.com.
Research Analyst views on Subject Company may vary based on Fundamental research and Technical Research. Proprietary
trading desk of MOSL or its associates maintains arm’s length distance with Research Team as all the activities are segregated from MOSL research activity and therefore it can have an independent view with regards to
subject company for which Research Team have expressed their views.
Regional Disclosures (outside India)
This report is not directed or intended for distribution to or use by any person or entity resident in a state, country or any jurisdiction, where such distribution, publication, availability or use would be contrary to law,
regulation or which would subject MOSL & its group companies to registration or licensing requirements within such jurisdictions.
For Hong Kong:
This report is distributed in Hong Kong by Motilal Oswal capital Markets (Hong Kong) Private Limited, a licensed corporation (CE AYY-301) licensed and regulated by the Hong Kong Securities and Futures Commission (SFC)
pursuant to the Securities and Futures Ordinance (Chapter 571 of the Laws of Hong Kong) “SFO”. As per SEBI (Research Analyst Regulations) 2014 Motilal Oswal Securities (SEBI Reg No. INH000000412) has an agreement with
Motilal Oswal capital Markets (Hong Kong) Private Limited for distribution of research report in Hong Kong. This report is intended for distribution only to “Professional Investors” as defined in Part I of Schedule 1 to SFO. Any
investment or investment activity to which this document relates is only available to professional investor and will be engaged only with professional investors.” Nothing here is an offer or solicitation of these securities,
products and services in any jurisdiction where their offer or sale is not qualified or exempt from registration. The Indian Analyst(s) who compile this report is/are not located in Hong Kong & are not conducting Research
Analysis in Hong Kong.
For U.S.
Motilal Oswal Securities Limited (MOSL) is not a registered broker - dealer under the U.S. Securities Exchange Act of 1934, as amended (the"1934 act") and under applicable state laws in the United States. In addition MOSL is
not a registered investment adviser under the U.S. Investment Advisers Act of 1940, as amended (the "Advisers Act" and together with the 1934 Act, the "Acts), and under applicable state laws in the United States.
Accordingly, in the absence of specific exemption under the Acts, any brokerage and investment services provided by MOSL, including the products and services described herein are not available to or intended for U.S.
persons. This report is intended for distribution only to "Major Institutional Investors" as defined by Rule 15a-6(b)(4) of the Exchange Act and interpretations thereof by SEC (henceforth referred to as "major institutional
investors"). This document must not be acted on or relied on by persons who are not major institutional investors. Any investment or investment activity to which this document relates is only available to major institutional
investors and will be engaged in only with major institutional investors. In reliance on the exemption from registration provided by Rule 15a-6 of the U.S. Securities Exchange Act of 1934, as amended (the "Exchange Act") and
interpretations thereof by the U.S. Securities and Exchange Commission ("SEC") in order to conduct business with Institutional Investors based in the U.S., MOSL has entered into a chaperoning agreement with a U.S.
registered broker-dealer, Motilal Oswal Securities International Private Limited. ("MOSIPL"). Any business interaction pursuant to this report will have to be executed within the provisions of this chaperoning agreement.
The Research Analysts contributing to the report may not be registered /qualified as research analyst with FINRA. Such research analyst may not be associated persons of the U.S. registered broker-dealer, MOSIPL, and
therefore, may not be subject to NASD rule 2711 and NYSE Rule 472 restrictions on communication with a subject company, public appearances and trading securities held by a research analyst account.
For Singapore
Motilal Oswal Capital Markets Singapore Pte Limited is acting as an exempt financial advisor under section 23(1)(f) of the Financial Advisers Act(FAA) read with regulation 17(1)(d) of the Financial Advisors Regulations and is a
subsidiary of Motilal Oswal Securities Limited in India. This research is distributed in Singapore by Motilal Oswal Capital Markets Singapore Pte Limited and it is only directed in Singapore to accredited investors, as defined in
the Financial Advisers Regulations and the Securities and Futures Act (Chapter 289), as amended from time to time. In respect of any matter arising from or in connection with the research you could contact the following
representatives of Motilal Oswal Capital Markets Singapore Pte Limited:
Disclaimer:
The report and information contained herein is strictly confidential and meant solely for the selected recipient and may not be altered in any way, transmitted to, copied or distributed, in part or in whole, to any other person
or to the media or reproduced in any form, without prior written consent. This report and information herein is solely for informational purpose and may not be used or considered as an offer document or solicitation of
offer to buy or sell or subscribe for securities or other financial instruments. Nothing in this report constitutes investment, legal, accounting and tax advice or a representation that any investment or strategy is suitable or
appropriate to your specific circumstances. The securities discussed and opinions expressed in this report may not be suitable for all investors, who must make their own investment decisions, based on their own investment
objectives, financial positions and needs of specific recipient. This may not be taken in substitution for the exercise of independent judgment by any recipient. Each recipient of this document should make such investigations
as it deems necessary to arrive at an independent evaluation of an investment in the securities of companies referred to in this document (including the merits and risks involved), and should consult its own advisors to
determine the merits and risks of such an investment. The investment discussed or views expressed may not be suitable for all investors. Certain transactions -including those involving futures, options, another derivative
products as well as non-investment grade securities - involve substantial risk and are not suitable for all investors. No representation or warranty, express or implied, is made as to the accuracy, completeness or fairness of
the information and opinions contained in this document. The Disclosures of Interest Statement incorporated in this document is provided solely to enhance the transparency and should not be treated as endorsement of the
views expressed in the report. This information is subject to change without any prior notice. The Company reserves the right to make modifications and alternations to this statement as may be required from time to time
without any prior approval. MOSL, its associates, their directors and the employees may from time to time, effect or have effected an own account transaction in, or deal as principal or agent in or for the securities
mentioned in this document. They may perform or seek to perform investment banking or other services for, or solicit investment banking or other business from, any company referred to in this report. Each of these entities
functions as a separate, distinct and independent of each other. The recipient should take this into account before interpreting the document. This report has been prepared on the basis of information that is already
available in publicly accessible media or developed through analysis of MOSL. The views expressed are those of the analyst, and the Company may or may not subscribe to all the views expressed therein. This document is
being supplied to you solely for your information and may not be reproduced, redistributed or passed on, directly or indirectly, to any other person or published, copied, in whole or in part, for any purpose. This report is not
directed or intended for distribution to, or use by, any person or entity who is a citizen or resident of or located in any locality, state, country or other jurisdiction, where such distribution, publication, availability or use would
be contrary to law, regulation or which would subject MOSL to any registration or licensing requirement within such jurisdiction. The securities described herein may or may not be eligible for sale in all jurisdictions or to
certain category of investors. Persons in whose possession this document may come are required to inform themselves of and to observe such restriction. Neither the Firm, not its directors, employees, agents or
representatives shall be liable for any damages whether direct or indirect, incidental, special or consequential including lost revenue or lost profits that may arise from or in connection with the use of the information.
The
person accessing this information specifically agrees to exempt MOSL or any of its affiliates or employees from, any and all responsibility/liability arising from such misuse and agrees not to hold MOSL or any of its affiliates or
employees responsible for any such misuse and further agrees to hold MOSL or any of its affiliates or employees free and harmless from all losses, costs, damages, expenses that may be suffered by the person accessing this
information due to any errors and delays.
Registered Office Address: Motilal Oswal Tower, Rahimtullah Sayani Road, Opposite Parel ST Depot, Prabhadevi, Mumbai-400025; Tel No.: 022-3980 4263; www.motilaloswal.com. Correspondence Address: Palm Spring
Centre, 2nd Floor, Palm Court Complex, New Link Road, Malad (West), Mumbai- 400 064. Tel No: 022 3080 1000. Compliance Officer: Neeraj Agarwal, Email Id:
na@motilaloswal.com,
Contact No.:022-30801085.
Registration details of group entities.: MOSL: SEBI Registration: INZ000158836 (BSE/NSE/MSE); CDSL: IN-DP-16-2015; NSDL: IN-DP-NSDL-152-2000; Research Analyst: INH000000412. AMFI: ARN 17397. Investment Adviser:
INA000007100. Motilal Oswal Asset Management Company Ltd. (MOAMC): PMS (Registration No.: INP000000670) offers PMS and Mutual Funds products. Motilal Oswal Wealth Management Ltd. (MOWML): PMS
(Registration No.: INP000004409) offers wealth management solutions. *Motilal Oswal Securities Ltd. is a distributor of Mutual Funds, PMS, Fixed Deposit, Bond, NCDs, Insurance and IPO products. * Motilal Oswal
Commodities Broker Pvt. Ltd. offers Commodities Products. * Motilal Oswal Real Estate Investment Advisors II Pvt. Ltd. offers Real Estate products. * Motilal Oswal Private Equity Investment Advisors Pvt. Ltd. offers Private
Equity products
11 January 2018
14