18 January 2018
Market snapshot
Equities - India
Close
Chg .%
Sensex
35,082
0.9
Nifty-50
10,789
0.8
Nifty-M 100
21,516
1.0
Equities-Global
Close
Chg .%
S&P 500
2,803
0.9
Nasdaq
7,298
1.0
FTSE 100
7,725
-0.4
DAX
13,184
-0.5
Hang Seng
12,869
0.6
Nikkei 225
23,868
-0.3
Commodities
Close
Chg .%
Brent (US$/Bbl)
69
0.1
Gold ($/OZ)
1,327
-0.8
Cu (US$/MT)
6,994
-0.6
Almn (US$/MT)
2,193
0.6
Currency
Close
Chg .%
USD/INR
63.9
-0.2
USD/EUR
1.2
-0.6
USD/JPY
111.3
0.8
YIELD (%)
Close
1MChg
10 Yrs G-Sec
7.2
-0.16
10 Yrs AAA Corp
7.9
-0.17
Flows (USD b)
17-Jan
MTD
FIIs
0.1
0.5
DIIs
0.0
0.2
Volumes (INRb)
17-Jan
MTD*
Cash
450
413
F&O
9,107
6,097
Note: YTD is calendar year, *Avg
CY17%
30.6
30.7
48.4
CY17%
24.0
34.2
8.6
15.4
36.1
25.3
CY17%
25.1
16.2
27.4
27.9
CY17%
-5.7
16.6
-5.6
CY17%
0.9
0.5
CY17
7.7
14.0
YTD*
413
6,097
Today’s top research idea
Hindustan Unilever: Impressive volumes
Strong margin expansion despite high adspend
HUVR’s 3QFY18 net sales rose 11.5% YoY to INR85.9b. Domestic consumer
business grew 17% YoY, with 11% underlying volume growth. EBITDA increased
by 23.9% YoY to INR16.8b (est. of INR16b) and PAT (bei) by 30.2% YoY to
INR12b (est. of INR10.9b).
We believe that four key trends are particularly relevant for HUL, which should
lead to an elevation in its earnings growth trajectory compared to the past – (i)
rapidly improving adaptability to market requirements, (ii) recognition of
Naturals as a key sub-segment across categories, (iii) continuing strong trend
toward premiumization and (iv) extensive plans to employ technology.
On a target multiple of 50x Dec’19 EPS (well-deserved 15% premium to three-
year average due to significantly improved business fundamentals), we get a
revised target price of INR1,585. Maintain
Buy.
Research covered
Cos/Sector
Hindustan Unilever
Larsen & Toubro
Bharti Infratel
Zee Entertainment
Jubilant Life
Mindtree
Delta Corp
Jyothy Labs
DCB Bank
S H Kelkar
Healthcare
Results Expectation
Key Highlights
Impressive volumes, strong margin expansion despite high adspend
The Monitorable Troika
Tenancy declines 3% QoQ, keeping rental revenue flat; EBITDA up 1% QoQ
Better growth to drive valuation
Life Science Ingredients segment drives earnings
Back in the game with 3Q beat and sanguine outlook
Robust performance; earnings drivers intact
Mixed performance; Growth outlook maintained
Income beat offset by elevated opex; advances growth picks up
Volume recovery leads to a strong quarter
IPM – growth picks up on higher volumes
ADSEZ | BHARTI | CYL | DBCL | HZ | UTCEM | YES | ZENT
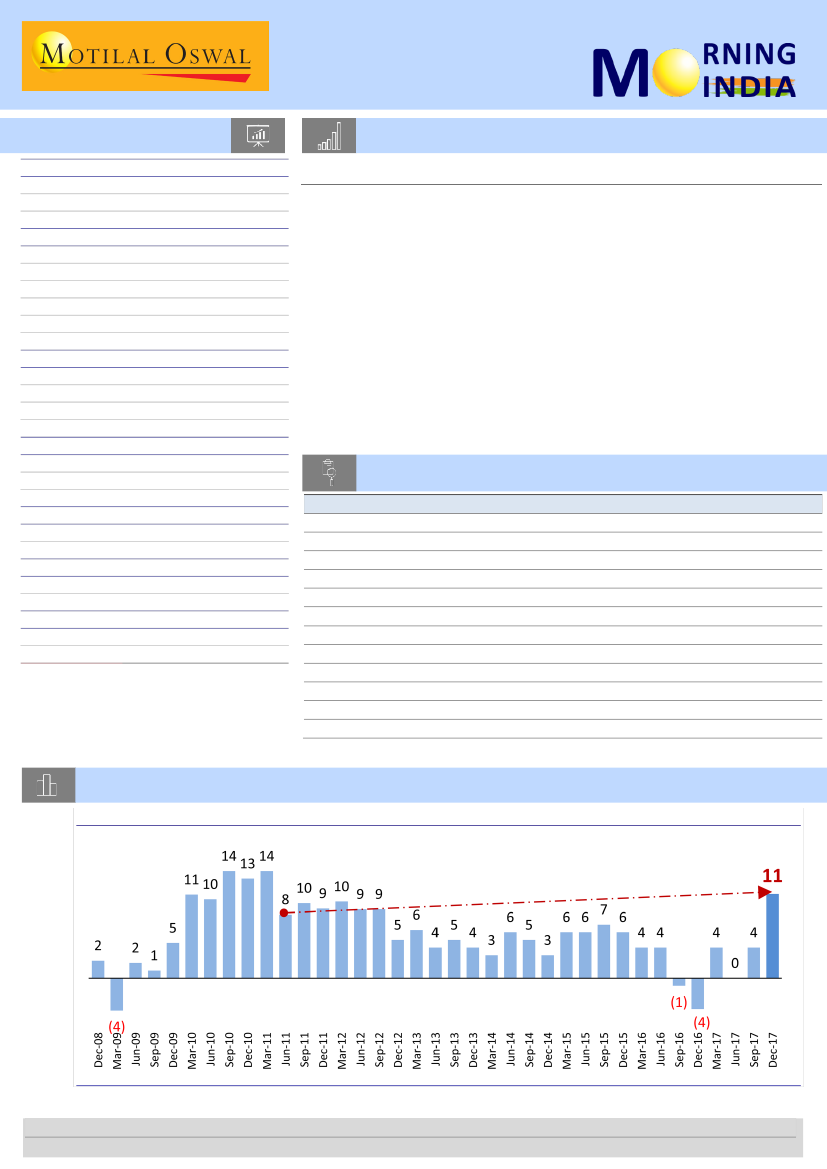
Chart of the Day: Hindustan Unilever – Impressive volumes
Underlying volumes grew 11% YoY in 3QFY18; highest in last 27 quarters
Research Team (Gautam.Duggad@MotilalOswal.com)
Investors are advised to refer through important disclosures made at the last page of the Research Report.
Motilal Oswal research is available on www.motilaloswal.com/Institutional-Equities, Bloomberg, Thomson Reuters, Factset and S&P Capital.

In the news today
Kindly click on textbox for the detailed news link
1
Centre mulls permitting 100%
foreign investment in private
banks
The Union government is holding
talks to increase foreign
investment limits in private sector
banks to 100%, from 74% at
present. It is also considering a
hike in the foreign investment cap
for public sector banks (PSBs),
from 20% to 49%, …
2
‘Direct tax collections jump 18.7% this fiscal’
Direct tax collections during the first nine-and-a-half months of the current
fiscal have risen by 18.7% to ₹6.89 lakh crore, the tax department said on
Wednesday. The collections till January 15, 2018, represent over 70% of
the ₹9.8 lakh crore revenue target from direct taxes, the Central Board of
Direct Taxes (CBDT) said in a statement. “The provisional figures of direct
tax collections up to January 15, 2018, show that net collections are at
₹6.89 lakh crore, which is 18.7% higher than the net collections for the
corresponding period last year,” it said.
3
Govt cuts additional borrowing
target to Rs20,000 crore for
FY18
Moving to limit the fiscal slippage
in 2017-18 ahead of the 1
February budget presentation, the
finance ministry on Wednesday
pared its additional borrowing
requirement before 31 March to
Rs20,000 crore from Rs50,000
crore. Bond prices rose, stock
indices surged to lifetime highs
and the rupee gained as …
4
HUL Offers To Pay Rs 119 Crore
After GST Profiteering Notice
Hindustan Unilever Ltd. has
offered to set aside Rs 119 crore
towards the consumer safeguard
fund, a day after receiving a notice
from the anti-profiteering body
for not passing on the benefits of
lower GST rates to the consumer.
The maker of Wheel detergent
said it has proactively disclosed an
estimated value of Rs 119 crore to
the CBEC on this count…
5
Viability report: Banks seek
RBI nod to upgrade JSPL
account to standard
Following a positive viability
assessment report for Jindal
Steel & Power (JSPL), lenders
have sought the Reserve Bank of
India’s (RBI) permission to allow
them to upgrade the company’s
loan account to standard from its
current non-performing asset
(NPA) category, bankers told FE.
If granted, this would lead to
reversal of provisions made by
banks following the account
turning NPA. Under RBI
guidelines, lenders need to set
aside at least 15% of the
outstanding loans as provisions…
6
SBI to raise Rs20,000 crore for
affordable housing,
infrastructure projects
State Bank of India (SBI) on
Wednesday said its board has
given nod to raise Rs20,000 crore
for financing affordable housing
and infrastructure projects through
long- term bonds. “The executive
committee of the Central Board in
its meeting held today has inter
alia approved, the proposal for
issuance of long term bonds …
18 January 2018
7
Axis Bank hikes lending rates
by 5 bps to 8.30%
Private lender Axis Bank has raised
lending rates, the first among the
commercial bank to hike the rates
after a span of three years,
signaling a turn in the interest rate
cycle. The bank has said that it has
raised lending rates by 5 basis
points across all maturity with
effect from January 18. With this,
Axis Bank would charge 8.30% on
loan having one year tenure. …
2

Hindustan Unilever
BSE SENSEX
35,082
Bloomberg
Equity Shares (m)
M.Cap.(INRb)/(USDb)
52-Week Range (INR)
1, 6, 12 Rel. Per (%)
Avg Val, INRm
Free float (%)
S&P CNX
10,789
HUVR IN
Impressive volumes, strong margin expansion despite high adspend
2,164
HUVR’s 3QFY18 net sales rose 11.5% YoY to INR85.9b.
Domestic consumer
2,969.3 / 46.5
business grew 17% YoY, with 11% underlying volume growth. EBITDA
1,390 / 827
increased by 23.9% YoY to INR16.8b (est. of INR16b) and PAT (bei) by 30.2%
-1/9/34
YoY to INR12b (est. of INR10.9b).
1419
32.8
Segmental performance:
Home care and Personal care revenues were up
17 January 2018
Q3FY18 Results Update | Sector: Consumer
CMP: INR1,372
TP: INR1,585(+16%)
Buy
Financials & Valuations (INR b)
Y/E Mar
2018E 2019E
337.2
386.7
Net Sales
70.7
84.6
EBITDA
50.0
60.3
PAT
23.1
27.9
EPS (INR)
17.6
20.7
Gr. (%)
30.4
30.6
BV/Sh (INR)
76.5
91.4
RoE (%)
101.2
121.0
RoCE (%)
59.4
49.2
P/E (x)
45.1
44.9
P/BV (x)
2020E
439.5
99.7
71.3
32.9
18.1
30.5
107.9
143.6
41.7
45.0
Estimate change
TP change
Rating change
1.9% and 2.8% YoY, respectively. Sales of Foods and Refreshments – the
relatively small segments – were up 7.5% and 7.2% YoY, respectively. EBIT
margin expanded by 420bp YoY for Home care and 150bp for Personal care,
while it contracted by 570bp for Foods and 110bp for Refreshment.
Gross margin expanded 320bp YoY to 52.7%.
High ad spends (+140bp YoY)
and a slight increase in employee costs (+40bp YoY) were partially offset by
lower other expenditure (-60bp YoY). Thus, EBITDA margin expanded 200bp
YoY to 20.2%.
Comparable margin expanded 110bp YoY.
Concall highlights:
(1)
Management stated it is still early to call out a big
recovery for the sector, but demand is picking up across segments.
(2)
3Q
was another quarter of rural growth being better than urban (base quarter
was weak for rural because of demonetization).
Valuation view:
As highlighted in our
Corner office note,
we believe that
four key trends are particularly relevant for HUL, which should lead to an
elevation in its earnings growth trajectory compared to the past – (i) rapidly
improving adaptability to market requirements, (ii) recognition of Naturals
as a key sub-segment across categories, (iii) continuing strong trend toward
premiumization and (iv) extensive plans to employ technology.
Consequently, we expect 18.8% EPS growth over FY17-FY20 compared to
6.1%/10.6%/10.7% CAGR over the last 3/5/10 years. On a target multiple of
50x Dec’19 EPS (well-deserved 15% premium to three-year average due to
significantly improved business fundamentals), we get a target price of
INR1,585 (INR 1,497 earlier). Maintain
Buy.
(
)
FY18
1Q
2Q
3Q
0.0
4.0
11.0
85,290 83,090 85,900
4.9
5.9
11.5
44,450 43,800 46,850
52.1
52.7
54.5
18,660 16,820 16,800
14.1
19.7
23.9
21.9
20.2
19.6
1,140
1,150
1,210
60
60
50
1,130
2,040
1,520
18,590 17,650 17,060
5,630
5,250
3,590
30.3
29.7
21.0
12,920 12,360 11,980
14.6
14.2
30.2
12,830 12,760 13,260
Ind AS
Ind AS
FY17
FY18
0.8
6.0
318,887 343,711
2.7
7.8
162,052 181,684
50.8
52.9
60,463
70,740
5.1
17.0
19.0
20.6
3,958
4,611
219
266
5,254
5,538
61,541
71,400
19,058
21,420
31.0
30.0
42,474
49,980
3.2
17.7
44,893
49,980
Est.
Variance
3QE
7.0
83,995
2.3%
9.0
44,866
53.4
16,040
4.7%
18.3
19.1
1,173
60
902
15,709
8.6%
4,791
30.5
10,918
9.7%
18.7
10,918
Quarterly Performance
yp
Y/E March
Domestic volume growth (%)
Net Sales
YoY Change (%)
Gross Profit
Margin %
EBITDA
YoY Change (%)
Margins (%)
Depreci a ti on
Interes t
Other Income
PBT
Ta x
Rate (%)
Adjusted PAT
YoY Change (%)
Reported Profit
E: MOSL Estimates
FY17
1Q
2Q
3Q
4.0
-1.0
-4.0
81,270 78,427 77,060
3.6
1.4
-0.7
41,715 38,807 39,620
51.3
49.5
51.4
16,347 14,046 13,560
8.1
5.1
-5.2
20.1
17.9
17.6
933
945
1,000
60
49
50
1,076
2,528
820
16,431 15,580 13,330
5,411
4,807
4,480
32.9
30.9
33.6
11,277 10,818
9,199
6.1
9.3
-10.2
11,727 10,956 10,380
4Q
4.0
82,130
6.4
41,910
51.0
16,510
12.2
20.1
1,080
60
830
16,200
4,360
26.9
11,180
7.6
11,830
4QE
9.0
89,431
8.9
46,584
52.1
18,460
11.8
20.6
1,111
96
848
18,100
6,950
38.4
11,150
-0.3
11,150
18 January 2018
3

Larsen & Toubro
BSE SENSEX
35,082
S&P CNX
10,789
17 January 2018
Update
| Sector:
Capital Goods
CMP: INR1,323
TP: INR1,540(+16%)
The Monitorable Troika
Order inflow, domestic execution and working capital are key
Buy
Stock Info
Bloomberg
Equity Shares (m)
52-Week Range (INR)
1, 6, 12 Rel. Per (%)
M.Cap. (INR b)
M.Cap. (USD b)
Avg Val, INRm
Free float (%)
LT IN
1,401
1,350/922
6/3/10
1,853.7
29.2
2,901
100.0
Financials Snapshot (INR b)
2017 2018E
Y/E Mar
Net Sales
1,192 1,337
EBITDA
131.1 157.1
PAT
67.4
80.3
EPS (INR)
48.1
57.4
Gr. (%)
13.8
19.3
BV/Sh (INR)
390.8 430.1
RoE (%)
12.8
14.0
RoCE (%)
8.1
9.6
P/E (x)
27.5
23.1
P/BV (x)
3.7
3.4
Larsen & Toubro (LT) appears to be on track to meet its guidance of zero-to-marginal
growth in FY18 orders, given the significant pick-up in 3QFY18 orders (announced
orders at INR373b). We estimate 5% growth in LT's FY18 order inflow, implying a
4QFY18 run-rate of INR480b (+2% YoY).
We note that domestic E&C execution growth had slowed down to 5% in 2QFY18 (v/s
15% in 1QFY18, 10% in 1HFY18), led by GST transition-related disruption. We,
however, build in domestic E&C execution growth of 10%/12% for FY18/19, as the
GST impact tapes off and execution picks up.
As LT increasingly focuses on its 'Lakshya' strategic plan, NWC should stabilize at 20%
of sales after bottoming out in 4QFY17 (18%).
2019E
1,453
171.2
95.5
68.2
18.8
477.4
15.0
10.1
19.4
3.1
Focus on the Troika – orders, execution and NWC puts LT in good stead
Shareholding pattern (%)
Sep-17 Jun-17 Sep-16
As On
Promoter
0.0
0.0
0.0
DII
39.5
39.0
38.6
FII
18.8
19.3
19.3
Others
41.7
41.8
42.2
FII Includes depository receipts
Stock Performance (1-year)
Larsen & Toubro
Sensex - Rebased
1,300
1,200
1,100
1,000
900
Orders:
Post a weak 1HFY18 (when orders declined 9% YoY to INR551b; E&C
orders fell 19% YoY), we expect strong order inflow growth in 3QFY18 (up 35%
YoY to INR470b; 9MFY18 order inflow up 7% YoY to INR1.02t). Orders
announced in 3QFY18 stood at a robust INR373b (INR70b in 3QFY17), led by
the B&F, Roads, T&D, hydrocarbons, water and power generation segments.
Our FY18 order growth estimate of 5% to INR1.5t implies a 4QFY18 run-rate of
+2%, which we believe is achievable, given the good pipeline of large-ticket
orders that are yet to be finalized in the domestic infrastructure and defense
segments (refer Exhibit 10 for the domestic pipeline). Historically, large orders
(>INR15b) inflow have been ~INR200b annually; for 9MFY18, LT has bagged
large orders of INR345b.
E&C execution:
Post a strong 1QFY18 where domestic E&C execution grew
15%, execution slowed down in 2QFY18 to 5% due to GST transition-related
hurdles. However, we expect domestic execution to pick up from 3QFY18 as
the impact of GST subsides, and then pick up further in 4QFY18. For FY18, we
expect revenue growth of 8% (10-12% guidance), driven by a revival in
execution of large domestic orders that LT has bagged over the past two years.
We build in domestic E&C growth of 10%/12% for FY18/FY19.
Working capital:
NWC was brought down from 25% at end-FY16 to 20% in
1HFY18 (up from 18% in 4QFY17). We expect working capital to remain at
similar levels in 3QFY18, given (a) longer time taken for input credit processing
under the new tax regime, and (b) higher working capital required to improve
domestic execution. LT intends to bring down NWC to 18% of sales by FY21
under its
Lakshya
strategic plan.
Maintaining Buy, TP of INR1,540.
We maintain our
Buy
rating with an SOTP-
based price target of INR1, 540 (E&C business at 23x FY20E EPS, to which we
add INR490 for subsidiaries). LT trades attractive at 22x/19x standalone EPS for
FY19/20 (ex-subsidiaries). Key risks to our rating include (a) a sharp slowdown
in government spending and (b) a sharp fall in oil prices in the Middle East.
18 January 2018
4

RESULTS
FLASH
Bharti Infratel
BSE SENSEX
35,082
S&P CNX
10,789
17 January 2018
Results Flash | Sector: Telecom
CMP: INR366
TP: INR430
Neutral
Tenancy declines 3% QoQ, keeping rental revenue flat; EBITDA up 1%
QoQ
Conference Call Details
Date:
17 Jan 2018
Time:
02:30pm IST
Dial-in details:
+91-11-4444 9999
th
Financials & Valuations (INR b)
2017 2018E
Y/E Mar
Net Sales
134.2 145.4
EBITDA
59.0
64.7
Adj NP
27.5
30.6
Adj EPS (INR)
14.9
16.5
EPS Gr. (%)
25.3
11.3
BV/Sh. (INR)
83.7
82.9
RoE (%)
16.2
19.8
RoCE (%)
13.2
14.9
P/E (x)
24.6
22.1
P/BV (x)
4.4
4.4
EV/EBITDA (x)
10.5
9.4
2019E
156.3
68.8
35.5
19.2
16.0
84.6
22.9
16.6
19.1
4.3
8.6
Pro forma consol. revenue was flat QoQ (+8% YoY) at INR36.6b (in-line).
Pro forma consol. rental revenue too was flat QoQ (+7% YoY) at INR22.6b (in-
line).
Energy revenue rose 1% QoQ (+9% YoY) to INR14.0b (in-line).
Consol. co-locations were down 3% QoQ (+4% YoY) at 2,13,476 (3% miss).
Average sharing factor stood at 2.38 (-1% QoQ).
Gross co-location adds stood at 1,950 v/s 4,398 in 2QFY18. However, led by
8,652 exits, net co-location adds stood at -6,612 (est. of -710) v/s 1,687 in
2QFY18 due to consolidation in the telecom sector, which will continue in the
coming few quarters.
Rental revenue sharing rate was up 1% QoQ at INR34,748.
Total towers stood at 91,007 (flat QoQ).
Pro forma consol. EBITDA of INR16.0b was down 1% QoQ (+8% YoY; 1.4%
beat). EBITDA margin of 43.7% shrunk 50bp QoQ (+20bp YoY; 70bp beat).
Rental EBITDA rose 1% QoQ (+8% YoY) to INR15.0b, with the margin
expanding 60bp QoQ to 66.4% (in-line).
Energy EBITDA declined 22% QoQ (+8% YoY) to INR1.0b. Energy margin shrunk
210bp QoQ to 6.9% (flat YoY) due to a 3% QoQ rise in power & fuel cost.
Net finance cost of INR15m (v/s net finance income of INR510m in 2QFY18)
led to a sharp 8% QoQ (6% YoY) decline in PAT to INR5.9b.
Capex stood at INR6.3b v/s INR4b in the previous quarter.
Valuation and view:
At CMP of INR366, the stock trades at 9.4x/8.6x FY18/19E
EBITDA. We have a
Neutral
rating on the stock with a TP of INR430.
(INR m)
FY18
2Q
3QE
36,482 36,553
10.8
7.5
20,336 20,571
16,146 15,982
44.3
43.7
5,941 5,895
-109
510
401
495
10,715 10,072
0
0
10,715 10,072
4,331 4,218
40.4
41.9
6,384 5,854
6,384 5,854
-17.5
-5.6
17.5
16.0
FY17
4QE
37,086 1,34,237
5.3
8.9
20,276 75,268
16,810 58,969
45.3
43.9
6,045 22,626
-6,968
-4,414
0
1,455
17,732 42,212
0
0
17,732 42,212
6,029 14,742
34.0
34.9
11,703 27,470
11,703 27,470
96.2
22.2
31.6
20.5
FY18E
1,45,360
8.3
80,672
64,688
44.5
23,786
-7,194
1,370
49,465
0
49,465
18,885
38.2
30,580
30,580
11.3
21.0
3QFY18E Var (%)
36,634
-0.2
7.7
20,877
-1.5
15,758
1.4
43.0 71bps
6,054
-3,183
0
12,887
-21.8
0
12,887
-21.8
4,382
34.0
8,505
-31.2
8,505
-31.2
37.1
23.2
Quarterly Performance
Y/E March
(Consolidated)
Revenue from operations
YoY Change (%)
Total Expenditure
EBITDA
Margins (%)
Depreciation
Interest
Other Income
PBT before EO expense
Extra-Ord expense
PBT
Tax
Rate (%)
Reported PAT
Adj PAT
YoY Change (%)
Margins (%)
1Q
32,106
6.9
18,159
13,947
43.4
5,648
-1,281
352
9,932
0
9,932
2,369
23.9
7,563
7,563
71.0
23.6
FY17
2Q
3Q
32,919 34,007
8.3
9.5
18,421 19,206
14,498 14,801
44.0
43.5
5,629 5,664
-2,472
-947
333
357
11,674 10,441
0
0
11,674 10,441
3,936 4,237
33.7
40.6
7,738 6,204
7,738 6,204
30.8
25.3
23.5
18.2
4Q
35,204
10.6
19,481
15,723
44.7
5,684
287
414
10,166
0
10,166
4,200
41.3
5,966
5,966
-17.0
16.9
1Q
35,239
9.8
19,489
15,750
44.7
5,905
-627
474
10,946
0
10,946
4,307
39.3
6,639
6,639
-12.2
18.8
18 January 2018
5

Zee Entertainment
BSE SENSEX
35,082
Bloomberg
Equity Shares (m)
M.Cap.(INRb)/(USDb)
52-Week Range (INR)
1, 6, 12 Rel. Per (%)
Avg Val, INRm
Free float (%)
S&P CNX
10,789
Z IN
960.4
569.5/8.8
619/465
-1/0/-5
1087
56.9
2020E
87.7
29.7
20.2
21.0
19.3
112.2
28.3
5.3
18.1
6.1
20.3
20.3
18 January 2018
3QFY18 Results Update | Sector: Media
CMP: INR593
TP: INR705 (+19%)
Buy
Better growth to drive valuation
Ex-sports revenue rebounds with 23% growth, EBITDA up 17%:
Ex-sports
revenue rebounded (+23% YoY) to INR18.4b on a low base (3QFY17 was
impacted by demonetization). Consolidated revenue grew 12% YoY (7.6% beat).
EBITDA expanded 15% YoY to INR5.9b (8% beat). Ex-sports EBITDA increased
17% YoY – lower than revenue growth due to higher SG&A related to a) an
increase in original number of hours of content, b) three movie releases and c)
INR400m of one-off expense related to Zee’s 25-year branding. EBITDA margin
improved 90bp YoY to 32.3% (in-line). PAT rose 29% YoY to INR3.2b. Investment
in secured NCD of INR1.67b is overdue, while Zee is pursuing recovery options.
Ad revenue propels growth; subscription revenue delayed:
Domestic ad
revenue jumped 26% YoY (adj. for sale of sports business and acquisition of
RBL), with healthy ad spends across categories. Ex-sports domestic subscription
revenue grew at a muted 7.5% due to longer time taken for contract renewal
negotiations on account of the TRAI’s tariff order.
Upbeat ad/subscription outlook:
Improving ad market outlook with broad-
based ad spends across sectors and healthy viewership should lead to steady
15% ad revenue growth in 4QFY18 and 16% CAGR over FY18-19E. Domestic
subscription revenue (ex-sports) led by closure of content contracts is expected
to grow 16% in 4QFY18 and at 14% CAGR over FY18-19E.
Maintain Buy with a revised TP of INR705:
We have revised up FY19-20E PAT
by 2% on better-than-expected results. Subsequently, our TP is revised up to
INR705 (v/s INR680 earlier) on 35x P/E on Dec’19 EPS. Premium valuation is
justified by steady 24% EPS CAGR over FY18-20E and improving RoIC above
30%. Our high EPS growth estimate is driven by 200bp EBITDA margin
expansion over FY18-20E to 33.9%, above the company’s guidance of 30%+. We
believe steady revenue growth (ex-sports) should offer buffer for higher
operating cost toward the upcoming re-launch of Zee’s digital platform – Z5.
FY17
2Q
3Q
4Q
16,954 16,391 15,280
23.0
3.4
0.4
12,062 11,233 10,593
4,892 5,158 4,688
28.9 31.5
30.7
336
249
316
86
90 1,122
432
525
549
-829
4,074
0
4,074
1,634
40.1
56
2,383
2,383
-9.9
-714
470
4,630 4,269
0 -12,234
4,630 16,504
2,081 1,464
44.9
8.9
41 -116
2,508 15,156
2,508 4,006
-6.1 180.1
(INR m)
FY18
v/s est
FY17
FY18E 3QFY18E
(%)
2Q
3Q
4QE
15,821 18,381 16,462 64,342 66,065 17,085
7.6
-6.7 12.1
7.7
10.7
2.7
0.8
10,909 12,437 11,118 45,073 45,023 11,593
7.3
4,912 5,944 5,343 19,269 21,042
5,492
8.2
31.0 32.3
32.5
29.9
31.9
32.1 19bp
411
505
453 1,152
1,679
376
34.1
3
24 1,089 1,372
1,262
556
-95.8
2,031
480
123 2,240
3,646
302
59.2
-148
6,381
-1,346
7,727
1,832
23.7
-16
5,912
4,885
104.9
-419
5,477
0
5,477
2,260
41.3
-4
3,222
3,222
28.5
0
3,925
0
3,925
1,592
40.6
0
2,333
2,333
-41.8
-2,205
16,780
-12,234
29,014
6,805
23.5
-7
22,216
12,851
52.3
-1,099
20,647
-1,346
21,993
8,028
36.5
-16
13,982
13,127
2.1
0
4,862
0
4,862
1,653
34.0
0
3,209
3,209
34.6
12.7
12.7
36.7
0.4
0.4
Financials & Valuations (INR b)
Y/E MARCH
2018E 2019E
Sales
66.1
76.5
EBITDA
21.0
25.3
NP
13.1
16.9
EPS (Rs)
13.7
17.6
EPS Growth (%)
2.1
28.7
BV/Share (Rs)
80.9
94.9
P/E (x)
43.4
33.7
P/BV (x)
7.3
6.3
EV/EBITDA (x)
26.5
21.8
EV/Sales (x)
8.4
7.2
RoE (%)
18.2
20.0
RoCE (%)
16.4
18.7
Estimate change
TP change
Rating change
Consolidated - Quarterly Earning Model
Y/E March
Total Revenue from Operations
YoY Change (%)
Total Expenditure
EBITDA
Margins (%)
Depreciation
Interest
Other Income
Fair Value through P&L
gain/(loss)
PBT before EO expense
Extra-Ord expense
PBT
Tax
Rate (%)
MI & P/L of Asso. Cos.
Reported PAT
Adj PAT
YoY Change (%)
1Q
15,717
18.5
11,185
4,532
28.8
251
75
734
-1,132
3,808
0
3,808
1,626
42.7
13
2,169
2,169
-9.0
1Q
15,402
-2.0
10,559
4,844
31.4
311
147
1,011
-532
4,864
0
4,864
2,344
48.2
4
2,516
2,516
16.0
18 January 2018
6

Jubilant Life Sciences
BSE SENSEX
35,082
Bloomberg
Equity Shares (m)
M.Cap.(INRb)/(USDb)
52-Week Range (INR)
1, 6, 12 Rel. Per (%)
Avg Val, INRm
Free float (%)
S&P CNX
10,789
JUBILANT IN
159
146.7 / 2.3
Highest ever quarterly EBITDA delivered by the company
950 / 600
Jubilant Life Sciences (JLS) delivered strong Q3FY18 with beat on sales,
31/15/4
EBITDA as well as PAT. JLS had sales of INR20.7b (our est: INR19.9b), EBITDA
466.1
of INR4.2b (our est: INR3.8b) and PAT of INR2.1b (our est: INR1.7b). The
46.0
17 January 2018
Q3FY18 Results Update | Sector: Healthcare
CMP: INR921
TP: INR1,110(+20%)
Buy
Life Science Ingredients drive earnings
Financials & Valuations (INR b)
FY18E FY19E
Y/E Mar
Net Sales
72.5
85.8
EBITDA
15.5
18.7
PAT
7.5
9.8
EPS (INR)
47.8
62.6
Gr. (%)
29.5
30.9
BV/Sh (INR)
264.4
321.8
RoE (%)
19.7
21.4
RoCE (%)
12.4
14.3
P/E (x)
19.3
14.7
P/BV (x)
3.5
2.9
FY20E
95.2
20.9
11.3
72.5
15.8
388.3
20.4
14.7
12.7
2.4
Estimate change
TP change
Rating change
performance for the quarter was led by improved business from Life Science
Ingredient (LSI) segment, full quarter impact of Triad acquisition and lower
tax rate.
Strong show in LSI segment for the quarter:
LSI sales at INR9.3b grew by
39.6% YoY, led by higher demand for JLS’ products. In addition, better
pricing led JLS to achieve highest ever quarterly EBITDA of INR2b (EBITDA
margin of 22.3%) in this segment for the quarter.
Ex-Triad, though Revenue dipped in pharma segment, EBITDA margin back
on track:
Pharmaceutical segment had subdued performance with sales
dipping 1% YoY, adjusting for revenue from triad acquisition to INR7.8b.
However, superior product mix led sequential improvement in EBITDA
margin to 31.6% in this segment.
Valuation and view:
We raise FY18, FY19 and FY20 earnings estimates by
8.2%, 13.8% and 12.6%, respectively, to factor strong Q3FY18 performance,
incorporate better margins in LSI segment and lower tax outgo. On better
outlook in LSI segment we have raised EV/EBITDA multiple from 4.5x to 6x.
We have also raised EV/EBITDA multiple for pharmaceutical business from
11x to 12x to factor better increased better growth as well as profitability in
specialty pharmaceutical segment. Accordingly, we revise our SOTP-based
target price to INR1,110 (from 957 earlier). Re-iterate Buy
FY17
2Q
3Q
4Q
14,193 14,916 16,414
-2.2
9.1
10.5
10,790 11,598 13,364
3,403
3,318
3,050
24.0
22.2
18.6
720
727
752
800
982
802
51
51
105
1,934
1,661
1,601
0
0
0
1,934
1,661
1,601
497
480
111
25.7
28.9
6.9
-11
0
0
1,448
1,181
1,490
1,448
1,181
1,490
14.5
-4.0 1,272.3
10.2
7.9
9.1
FY18
2Q
3Q
16,420 20,678
15.7
38.6
13,359 16,509
3,061
4,168
18.6
20.2
790
818
660
771
71
32
1,682
2,612
0
0
1,682
2,612
427
483
25.4
18.5
-27
3
1,282
2,125
1,282
2,125
-11.4
80.0
7.8
10.3
FY17
4QE
21,257
29.5
16,347
4,910
23.1
846
612
83
3,535
0
3,535
961
27.2
3
2,571
2,571
72.5
12.1
60,063
4.5
46,610
13,453
22.4
2,914
3,411
251
7,379
0
7,379
1,630
22.1
-14
5,757
5,757
46.8
9.6
FY18E
74,315
23.7
58,799
15,520
20.9
3,179
2,730
254
9,864
0
9,864
2,466
25.0
-55
7,453
7,453
29.5
10.0
Quarterly Performance (Consolidated)
Y/E March
Net Sales
YoY Change (%)
Total Expenditure
EBITDA
Margins (%)
Depreciation
Interest
Other Income
PBT before EO expense
Extra-Ord expense
PBT
Tax
Rate (%)
Minority Interest & P&Lof Asso. Cos.
Reported PAT
Adj PAT
YoY Change (%)
Margins (%)
1Q
14,539
0.6
10,858
3,681
25.3
715
828
44
2,182
0
2,182
542
24.9
24
1,616
1,616
22.5
11.1
1Q
15,961
9.8
12,584
3,376
21.2
725
687
68
2,032
0
2,032
595
29.3
-34
1,471
1,471
-9.0
9.2
18 January 2018
7

MindTree Consulting
BSE SENSEX
35,082
Bloomberg
Equity Shares (m)
M.Cap.(INRb)/(USDb)
52-Week Range (INR)
1, 6, 12 Rel. Per (%)
Avg Val, INRm
Free float (%)
S&P CNX
10,789
MTCL IN
Back in the game with 3Q beat and sanguine outlook
168
Upward growth trajectory:
3Q revenue growth of 3.8% QoQ exceeded our
104.8 / 1.6
estimate by 130bp. Ramp-up in several engagements led to 8.3% QoQ
644 / 433
growth in top customers, contributing 90% of incremental dollars.
5/19/0
Continued strength in deal wins, high visibility in top accounts and a strong
310
exit rate (expectations of continued momentum in 4Q) would ensure
86.4
17 January 2018
Q3FY18 Results Update | Sector: Technology
CMP: INR623
TP: INR725(16%)
Buy
Financials & Valuations (INR b)
2018E 2019E
Y/E Mar
Sales
54.3
62.1
EBITDA
7.2
9.2
PAT
5.1
6.7
EPS (INR)
32.7
40.8
EPS Gr. (%)
31.5
24.6
BV/Sh. (INR)
158.5
181.2
RoE (%)
19.9
24.0
RoCE (%)
20.2
25.8
P/E (x)
19.0
15.3
P/BV (x)
3.9
3.4
2020E
69.4
10.8
7.9
47.8
17.2
207.3
24.6
27.3
13.0
3.0
Estimate change
TP change
Rating change
acceleration from 8% growth in FY18E to 12.6% in FY19E, without much of
an ask (2.6% CQGR in FY19E v/s 3.1% in FY18E).
Significant beat on profitability:
EBITDA margin expanded by 350bp QoQ in
3Q v/s our estimate of +110bp QoQ, primarily led by [1] 5.8% sequential
pricing growth, as projects moved from a transition phase to a steady state,
[2] SGA optimization and [3] absence of one-time expenses from 2Q. PAT at
INR1.4b was higher by 13.5% QoQ and beat estimate by 33%, primarily led
by operational beat and one-time tax reversal of INR249m.
Margin levers still intact:
Margin uptick in 3Q was led by factors other than
utilization, offshoring and an improvement in margins of acquired entities.
Our change in stance on MTCL in Nov’17, apart from improved organic
growth, had factored in an improvement in these factors, but they have only
remained steady sequentially, and would only add to expansion already
seen in 3Q. Moreover, revival of growth would only aid the effective use of
levers toward profitability resurrection.
Valuation view:
Revenue for FY19/20E has increased by 2.6/3.4% on 3Q
beat, deal wins and optimistic guidance. We are baking in cumulative 230bp
margin expansion over this period, of which 100bp will come plainly from
acquisitions turning around. This has led us to raise FY19/20E EPS by
20/12%. For revenue/earnings CAGR of 11/21% over FY18/20E, and given a
stark improvement in trajectory, a re-rating is warranted. Our TP of INR725
discounts forward earnings by 16x, and implies 16% upside. Maintain
Buy.
FY18E
2Q
3Q
206
214
3.0
3.9
13,316 13,777
2.8
6.4
32.4
35.1
20.8
20.0
1,541
2,074
11.6
15.1
8.0
11.7
598
59
24.9
15.2
1,247
1,415
34.0
13.5
31.5
37.2
7.4
8.6
16,910 17,200
73.2
72.8
13.0
42.4
42.1
55.5
FY17
4Q
221
3.3
14,277
8.3
35.9
20.9
2,148
15.0
11.7
368
24.0
1,554
9.8
59.9
9.5
17,625
74.0
42.3
780
9.0
52,364
11.7
34.8
21.1
7,181
13.7
9.8
417
24.6
4,186
-30.6
24.9
16,470
71.3
40.2
FY18E
842
8.0
54,265
3.6
34.6
21.3
7,198
13.3
9.7
1,393
22.9
5,147
23.0
32.7
17,625
73.3
42.2
Est. Var. (% /
bp)
3QFY18
212
1.3
2.6 128bp
13,700
0.6
5.8
59bp
32.2
291bp
20.0
1bp
1,666
24.5
12.2
289bp
8.6 308bp
225
-73.8
24.0
1,066
32.7
-14.5 2795bp
3.4 3381bp
6.5
17,340
-0.8
74.0 -120bp
42.8
-74bp
Quarterly Performance (Consolidated)
Y/E March
Revenue (USD m)
QoQ (%)
Revenue (INR m)
YoY (%)
GPM (%)
SGA (%)
EBITDA
EBITDA Margin (%)
EBIT Ma rgi n (%)
Other i ncome
ETR (%)
Adj. PAT
QoQ (%)
YoY (%)
EPS (INR)
Headcount
Uti l i ncl . tra i nees (%)
Attri ti on (%)
Offs hore rev. (%)
Fi xed Pri ce (%)
1Q
199
2.1
13,276
35.8
37.0
22.3
1,951
14.7
10.8
198
24.2
1,235
-7.1
-3.7
7.4
16,110
71.4
16.5
40.5
48.7
FY17
2Q
3Q
193
192
-3.0
-0.4
12,954 12,953
10.8
6.7
34.2
34.1
21.7
20.7
1,621 1,740
12.5
13.4
8.6
9.5
170
144
26.0
25.2
948 1,031
-23.2
8.8
-40.1 -31.7
5.6
6.1
16,219 16,099
71.4
71.3
16.4
16.1
40.8
39.8
50.6
52.5
4Q
196
1.8
13,181
-0.2
34.0
19.8
1,869
14.2
10.3
-95
22.8
972
-5.7
-26.9
5.8
16,470
70.9
15.1
39.5
52.8
1Q
200
2.3
12,895
-2.9
34.9
23.8
1,435
11.1
7.3
368
28.6
931
-4.2
-24.6
7.2
16,561
73.2
14.0
42.0
52.9
18 January 2018
8

17 January 2018
3QFY18 Results Update | Sector: Others
Delta Corp
Buy
BSE SENSEX
35,082
Bloomberg
Equity Shares (m)
M.Cap.(INRb)/(USDb)
52-Week Range (INR)
1, 6, 12 Rel. Per (%)
Avg Val, INRm
Free float (%)
S&P CNX
10,789
DELTA IN
Robust performance; earnings drivers intact
267.1
Revenue above estimate; EBITDA and PAT in-line:
DELTA’s revenue
84.9/1.3
increased 56.6% YoY to INR1,622m (est. INR1,502m) in 3QFY18. EBITDA
344/112
margin expanded 1,220bp YoY to 42.4% (est. of 45%), but was still slightly
22/94/117
895.0
off from the sustainable high, as the quarter witnessed one-off
64.7
advertisement expense of ~INR80m on account of World Poker Tour and
CMP: INR333
TP: INR382(+15%)
Financials & Valuations (INR b)
2018E 2019E
Y/E Mar
Net Sales
5.9
7.8
EBITDA
2.6
3.5
PAT
1.6
2.2
EPS (INR)
5.9
8.3
Gr. (%)
93.7
40.7
BV/Sh (INR)
59.6
66.3
RoE (%)
12.6
13.2
RoCE (%)
12.1
13.2
P/E (x)
56.3
40.0
P/BV (x)
5.6
5.0
2020E
9.8
4.7
3.0
11.2
34.0
75.8
15.7
23.4
29.9
4.4
Estimate change
TP change
Rating change
World Gaming Festival organized by the company. EBITDA grew 119.5% YoY
to INR687m (est. INR676m). Consequently, adjusted PAT rose 327.8% YoY to
INR447m (est. INR433m) in 3QFY18. Casino gaming revenue grew 73% YoY
to INR1,560m, whereas Hospitality revenue rose 28% YoY to INR233m.
Online gaming revenue stood at INR284m.
Staying ahead of the curve:
The change in Goa casino policy is on the verge
of becoming a reality, with the cabinet expected to come up with a new
policy in early-2018. Total project cost is expected to be in the range of
USD250-300m, of which Delta has committed to invest ~INR7-8b in acquiring
land, building casino and a 300-room hotel. Balance investment for the
construction of ecosystem (multiplex, convention center, retail and water
park) will be evaluated through various structures. The shift to land would
not just lead to a multifold rise in visitations, but also in cost reduction of
~15% on account of lower power & fuel cost and reduced marine staff.
Valuation and view:
DELTA is well poised to benefit from multiple factors:
increased traction in rummy, change in Goa casino policy and
commencement of Sikkim airport, which would collectively result in a
multifold increase in visitations. We thus raise our revenue estimate by
4%/7% and PAT estimate by 6%/6% for FY19E/20E. We expect the company
to deliver sales/PAT CAGR of 29%/37% over FY18-20E, and value the stock at
34x FY20E EPS to arrive at a TP of INR382. Maintain
Buy.
18 January 2018
9

Jyothy Laboratories
BSE SENSEX
35,082
Bloomberg
Equity Shares (m)
M.Cap.(INRb)/(USDb)
52-Week Range (INR)
1, 6, 12 Rel. Per (%)
Avg Val, INRm/ Vol m
Free float (%)
17 January 2018
3QFY18 Results Update | Sector: Consumer
Consol. net sales grew 12.3% YoY to INR4.3b.
Reported power brand sales
grew just 9.3% YoY. EBITDA rose 36.8% YoY to INR693m (est. of INR610m). Adj.
PAT after non-controlling interest (NCI) grew 61.5% YoY to INR347m (est. of
INR347m). Fabric care, Dishwashing and Personal care grew 9%, 12.4% and
30.9%, respectively, while Household Insecticides fell 17.1% YoY.
Consol. gross margin expanded 270bp YoY to 48.3%.
Other expenses declined
Financials & Valuations (INR b)
Y/E Mar
2018E 2019E 2020E
by 80bp YoY, while staff costs and A&P rose 10bp and 50bp, respectively. Thus,
Net Sales
17.2
20.4
23.7
consolidated EBITDA margin expanded 290bp YoY to 16.1%.
EBITDA
2.6
3.1
3.7
Concall highlights:
(1)
Management reiterated positive rural growth outlook
PAT
1.5
1.9
2.4
stated by them in the 2QFY18 call.
(2)
Volume growth of 8-10% is sustainable
EPS (INR)
8.1
10.7
13.3
Gr. (%)
-27.7
32.0
24.2
for JYL, going forward.
(3)
Wholesale trade has largely stabilized; only some
BV/Sh (INR)
57.8
59.3
63.5
parts of UP, Bihar and West Bengal are seeing some wholesale trade pressure.
RoE (%)
13.8
18.3
21.7
Valuation and view:
Changes to the model have not resulted in material
RoCE (%)
11.1
14.1
16.6
changes in FY18/FY19/FY20E EPS. Pace of earnings growth (for FY17-20E)
P/E (x)
44.7
33.8
27.2
EV/EBITDA
26.7
21.8
18.3
appears moderate for a company that is much smaller in terms of size
compared to mid-cap peers. RoE is also at a discount to peers at ~18% and
21.7% for FY19E and FY20E, respectively. Given these worries, valuation of
Estimate change
21.8x FY19E EV/ EBITDA and 33.8x FY19E EPS does not offer scope for a
TP change
significant upside. Targeting 20x Dec’19E EV/ EBITDA (20% discount to staples
Rating change
peers’ average), we get a TP of INR380 (INR375 earlier). Maintain
Neutral.
Quarterly Performance
Y/E March
Net Sales
YoY Cha nge (%)
Total Sales
COGS
Gross Profit
Ma rgi ns (%)
EBITDA
EBITDA Growth %
Ma rgi ns (%)
Depreci a ti on
Interes t
Other Income
PBT
Ta x
Ra te (%)
Adjusted PAT after NCI
YoY Cha nge (%)
E: MOSL Es ti ma tes
1Q
4,244
5.1
4,248
2,199
2,049
48.2
807
38.8
19.0
133
143
25
555
120
21.6
445
72.6
FY17
2Q
3Q
4,121 3,839
5.9
3.4
4,121 3,839
2,101 2,089
2,020 1,750
49.0
45.6
637
507
28.0
-1.3
15.5
13.2
73
73
164
144
31
26
430
314
119
108
27.7
34.3
320
215
61.2
6.6
FY18
2Q
3Q
4,299 4,312
4.3
12.3
4,299 4,312
2,229 2,230
2,070 2,083
48.1
48.3
709
693
11.3
36.8
16.5
16.1
74
78
119
120
39
23
555
517
98
188
17.7
36.4
476
347
48.5
61.5
FY17
FY18E
(INR Million)
FY18
Var.
3QE
(%)
4,294
0.4
12.0
4,300
0.3
2,257
2,043
1.9
47.5
610
13.5
20.5
14.2
81
113
28
445
16.3
98
22.0
347
0.1
61.3
S&P CNX
10,789
JYL IN
181.7
66.7 / 1.0
441 / 325
-8/-14/-24
61
33.1
CMP: INR363
TP: INR380(+5%)
Neutral
Mixed performance; Growth outlook maintained
4Q
4,457
4.1
4,462
2,502
1,960
43.9
606
-3.5
13.6
83
99
21
446
-629
-141.1
1,087
778.6
1Q
3,559
-16.1
3,567
1,728
1,840
51.6
437
-45.9
12.2
141
86
18
228
22
9.5
206
-53.6
4QE
5,008 16,662 17,179
12.4
4.6
3.1
5,021 16,671 17,199
2,842 8,891 9,029
2,178 7,779 8,170
43.4
46.7
47.6
714 2,557 2,553
17.7
15.1
-0.2
14.2
15.3
14.9
92
363
384
98
551
424
43
103
123
567 1,746 1,867
84
-281
392
14.8
-16.1
21.0
483 2,067 1,475
-55.6 164.4
-28.6
18 January 2018
10

RESULTS
FLASH
BSE SENSEX
35,082
S&P CNX
10,789
17 January 2018
3QFY18 Results Update | Sector: Financials
DCB Bank
Neutral
CMP: INR194
TP: INR198 (+2%)
Income beat offset by elevated opex; advances growth picks up
DCB Bank reported PPoP growth of 12% YoY (1% above estimate), as 8% beat
on total income was offset by 12% growth in opex. NII growth of 20% YoY was
led by 17bp expansion in reported NIM, while other income grew 17% YoY
(core fee income rose 41% YoY).
However, total income growth trailed opex growth (+20% YoY adjusted for
INR50m of bond issue-related expenses). Adjusted for the one-off expense, CI
ratio stood at 60.8% v/s 60.3% in 2Q and 57.2% in 1Q. Provisions at INR343m
(+12% YoY) were 4% below estimates, while higher-than-expected taxes
resulted in PAT of INR570m (+11% YoY, 5% miss)
Strong growth in corporate (+35%), MSME (+39%) and AIB (+28%) books led to
7%/28% QoQ/YoY growth in loan book to INR186b. Other smaller categories
such as CV/CE (+59%), gold (+28%) and construction finance (+91%) also
showed strong growth.
Elevated slippages of INR1b (2.8%) were led by one restructured corporate
account and a 9% sequential increase in LAP GNPA. Healthy recoveries and
upgrades at INR576m led to a 12% QoQ increase in GNPA to INR3.5b. NNPA
increased 3% QoQ to INR1.6b, reflecting a 410bp increase in PCR to 54.3%.
GNPA/NNPA (%) increased 12bp/-3bp to 1.89%/0.87%.
Other highlights:
a) CASA ratio was largely flat QoQ at 26%. b) Tier I ratio stood
at 12.54%, with CAR of 15.77% c) During the quarter, the bank raised INR3b of
Tier II bonds.
Valuation view:
While we expect loan growth to stay ahead of system loan
growth, operating leverage is likely to take time to play out, weighing down on
return ratios in the near term.
Financials & Valuations (INR b)
Y/E MARCH
2018E 2019E 2020E
NII
9.6
11.4
13.4
OP
5.1
6.2
7.4
NP
2.5
3.0
3.5
EPS (INR)
8.1
9.8
11.5
EPS Gr. (%)
16.2
20.5
17.2
BV/Sh. (INR)
83.4
92.8 103.8
RoE (%)
11.1
11.1
11.7
RoA (%)
0.9
0.9
0.9
P/E (x)
23.8
19.7
16.8
P/BV (x)
2.3
2.1
1.9
18 January 2018
11

S H Kelkar and Co.
BSE SENSEX
35,082
Bloomberg
Equity Shares (m)
M.Cap.(INRb)/(USDb)
52-Week Range (INR)
1, 6, 12 Rel. Per (%)
Avg Val, INRm
Free float (%)
S&P CNX
10,789
SHKL IN
Volume recovery leads to a strong quarter
145
Robust performance led by a recovery in FMCG growth trend:
SHKL’s
37.5 / 0.6
revenue increased 13.5% YoY to INR2,831m (est. of INR2,551m) in 3QFY18
333 / 237
(22% YoY growth post netting off GST from the base quarter). Fragrance
9/-4/-38
52
business reported growth of 16.5% YoY to INR2,546m, while Flavors
42.4
business reported de-growth of 8.4% YoY to INR272m. EBITDA rose 46% YoY
17 January 2018
Q3FY18 Results Update | Sector: Others
CMP: INR289
TP: INR343(+19%)
Buy
Financials & Valuations (INR b)
2018E 2019E
Y/E Mar
Net Sales
10.6
12.3
EBITDA
1.9
2.4
PAT
1.1
1.5
EPS (INR)
7.9
10.4
Gr. (%)
9.1
31.6
BV/Sh (INR)
61.4
68.8
RoE (%)
13.4
16.0
RoCE (%)
19.8
23.4
P/E (x)
36.6
27.8
P/BV (x)
4.7
4.2
2020E
14.1
2.9
1.8
12.2
17.7
77.5
16.7
24.6
23.6
3.7
Estimate change
TP change
Rating change
to INR576m (est. of INR459m post excise adjustment), with the margin
expanding by 440bp YoY to 20.3% (est. of 18% post excise adjustment).
Gross margin contracted sharply by 600bp YoY to 46.1%, while other
expenses declined 180bp YoY to 14.1% of sales. Fragrance PBIT margin came
in at 15.5% (v/s 13.6% in 3QFY17), while Flavors PBIT margin stood at 25.5%
(v/s 30.8% in 3QFY17). Consequently, adj. PAT grew 33% to INR338m (est. of
INR286m post excise adjustment) from INR254m in the year-ago period.
Strategy to strengthen fine fragrance presence in Europe:
SHKL launched its
first collection of perfumes from the recently established fine fragrance
development center in Amsterdam. The company also acquired Italy-based
Creative Flavors & Fragrances (CFF), which has a strong presence in fine
fragrance and fabric in Italy. With the acquisition, SHKL has now strengthened
its presence in Europe with facilities in Milan and Amsterdam, and is well on
track to achieve its target of ~10% revenue contribution from fine fragrances
over three years (as of now, it contributes 2% of Fragrance revenue).
Valuation view:
With a recovery in FMCG growth, SHKL appears set to step
into the growth phase. Additionally, it has been evaluating cost-saving
measures like shifting of the ingredients business from high-cost
Netherlands, which should aid margin expansion. We largely maintain our
earnings estimates, and value the stock at 28x FY20E EPS. Maintain
Buy
with
a target price of INR343.
18 January 2018
12

Sector Update | 18 January 2018
Healthcare
Performance of top
companies: Dec-17, %)
Company
IPM
Sun Pharma
Abbott India
Cipla
Zydus Cadila
Mankind
Alkem
Lupin
Torrent Pharma
Pfizer
Glenmark
Pharma
Sanofi
Dr Reddy Labs
GSK Pharma
Alembic Pharma
Ipca Labs
Natco
Ajanta Pharma
Merck
Biocon
MAT gr Dec-17
5.5
7.8
7.6
8.1
7.4
7.1
3.2
10.2
9.5
8.6
5.4
19.9
3.7
12.4
7.9
12.7
5.9
1.6
(3.5)
(0.6)
9.3
9.2
3.9
7.6
(1.7)
(4.4)
(7.4)
9.1
5.0
10.6
10.5
8.6
7.0
9.3
(2.0)
(4.3)
14.8
8.5
(0.3)
11.4
IPM – growth picks up on higher volumes
Indian pharmaceutical market's (IPM) secondary sales continued to grow at a
healthy rate in December, led by strong volume growth, while price growth
continued its downtrend during the month. IPM grew by 7.8% YoY in December
2017 and 7.2% YoY in 3QFY18.
After declining trend in YoY quarterly growth till 2QFY18, industry volumes grew
by 5.9% in 3QFY18. Growth in new products was 2.8% in 3QFY18, as compared
to 2.7% in 2QFY18. After declining 2.1% in 2QFY18, prices further reduced YoY in
3QFY18 as well (-1.5%).
Moving annual total (MAT) growth for December was 5.5% as against 5.6% YoY
in November.
Natco’s secondary sales (+24.5%) posted robust growth for 3QFY18 YoY,
followed by Mankind (+14.1%) and Alkem (+13.1%). More than 65% of the
companies posted improvement in YoY growth in 3QFY18 compared to previous
three quarters.
Exceptionally, IPCA’ secondary sales continued to decline (-7.1%) in 3QFY18 YoY,
followed by Pfizer, which declined 3.4% during the quarter.
Ophthal & Vaccines (1.9% each of IPM) posted robust growth of 13.2% YoY in
3QFY18, followed by Respiratory (+12.3%; 7.5% of IPM) and Derma (+11.5%;
6.4% of IPM). Although all therapies reported growth in December, ~40% of
them underperformed the IPMs.
In value terms, secondary sales of DPCO-listed products increased by 3% YoY
and non-DPCO products by 8.7% YoY.
FDC-banned drugs (~2.4% of IPM) grew 4% in December, while non-banned
drugs grew by 8.7% YoY. Secondary sales for Indian companies increased 8.2%
YoY, while those of MNC companies grew by 6.3% YoY.
Price Growth (%)
New Product Growth (%)
Total Growth (%)
Natco, Mankind and Alkem witness highest YoY growth for the quarter
Ophthal & Vaccine, Respiratory and Derma lead among therapies
DPCO v/s non-DPCO market (December-17)
FDC ban impact (December-17)
Exhibit 1: Volume-led high industry growth
13.9
Volume Growth (%)
9.9
7.8
4
2.1
4.7
3.8
1.4
8.2
3.7
3.4
1.1
6.7
3.1
1.8
1.8
1QFY18
0.7
0.1
-2.1
2QFY18
2.7
7.2
5.9
2.8
-1.5
3QFY18
Source: AIOCD, MOSL
2QFY17
3QFY17
4QFY17
18 January 2018
13

December 2017 Results Preview | Sector: Telecom
Bharti Airtel
Bloomberg
Equity Shares (m)
M. Cap. (INR b)/(USD b)
52-Week Range (INR)
1,6,12 Rel Perf. (%)
BHARTI IN
3997.3
2072 / 33
565 / 300
4 / 28 / 44
CMP: INR518
TP: INR680 (+31%)
Buy
Financial Snapshot (INR Billion)
Y/E March
2017 2018E 2019E 2020E
Net Sales
954.7 855.3 916.0 1,019.
6
EBITDA
353.3 305.6 338.7 392.7
Adj. NP
44.4 12.0 22.5 35.9
AdjEPS(INR)
AdjEPS Gr(%)
BV/Sh (INR)
RoE (%)
RoCE (%)
Payout (%)
Valuations
P/E (x)
P/BV (x)
EV/EBITDA x
Div. Yld (%)
46.7 173.4
3.1
8.9
0.2
3.0
10.4
0.2
92.0
3.0
9.1
0.2
57.7
2.8
7.5
0.2
11.1
-6.4
3.0
-73.1
5.6
88.4
9.0
59.5
168.8 170.3 174.7 182.5
6.7
1.8
3.3
5.0
5.4
3.5
4.6
5.8
12.7 44.6 21.4 13.4
We expect consolidated revenue to decline 5.1% QoQ (and 11.4%
YoY) to INR206.6b. We expect India wireless revenue to decline
10.8% QoQ (and 21% YoY) to INR109.2b and Africa revenue to
decline 1% QoQ to INR51.6b.
Consolidated EBITDA margin is likely to contract 90bp QoQ to
35.5%, led by 190bp contraction in India wireless margin to
32.4%, partly offset by 60bp expansion in Africa EBITDA margin to
32.2%.
Consolidated net profit is expected to fall 58% QoQ (and 71% YoY)
to INR1.5b.
We expect India wireless ARPU to decline 12% QoQ (and 26%
YoY) to INR127.
Bharti trades at an EV/EBITDA of 10.4x FY18E and 9.1x FY19E.
Maintain Buy.
Key monitorables
Consolidated revenue (expect 5.1% decline QoQ).
India wireless revenue (expected to decline 10.8% QoQ).
Consolidated EBITDA margin (expected at 35.5%; -90bp QoQ).
India wireless EBITDA margin (expected at 32.4%; -190bp QoQ)
.
Consolidated - Quarterly Earning Model
Y/E March
Revenue from operations
YoY Change (%)
Total Expenditure
EBITDA
Margins (%)
Depreciation
Interest
Other Income
PBT before EO expense
Extra-Ord expense
PBT
Tax
Rate (%)
MI & P/L of Asso. Cos.
Reported PAT
Adj PAT
YoY Change (%)
Margins (%)
E: MOSL Estimates
1Q
2,55,465
7.9
1,59,985
95,480
37.4
50,402
19,399
2,787
28,466
3,536
24,930
10,089
40.5
222
14,619
16,724
70.7
6.5
FY17
FY18
FY17
2Q
3Q
4Q
1Q
2Q
3QE
4QE
2,46,515 2,33,357 2,19,346 2,19,581 2,17,769 2,06,642 2,11,314 9,54,683 8,55,306
3.4
-3.0
-12.1
-14.0
-11.7
-11.4
-3.7
-1.1
-10.4
1,52,113 1,48,542 1,40,746 1,41,997 1,38,549 1,33,265 1,35,902 6,01,386 5,49,713
94,402 84,815 78,600 77,584 79,220 73,377 75,412 3,53,297 3,05,593
38.3
36.3
35.8
35.3
36.4
35.5
35.7
37.0
35.7
49,560 48,350 49,418 48,192 46,873 53,083 53,083 1,97,730 2,01,230
19,057 19,356 19,162 18,274 23,266 19,985 19,742 76,974 81,267
1,568
3,487
2,494
3,698
3,907
3,907
3,907 10,336 15,419
27,353 20,596 12,514 14,816 12,988
4,216
6,495 88,929 38,515
66
2,040
6,055
503
1,786
0
0 11,697
2,289
27,287 18,556
6,459 14,313 11,202
4,216
6,495 77,232 36,226
11,136 11,841
1,753
8,136
5,341
1,771
2,728 34,819 17,976
40.8
63.8
27.1
56.8
47.7
42.0
42.0
45.1
49.6
1,544
1,678
972
2,504
2,431
991
1,527
4,416
7,453
14,607
5,037
3,734
3,673
3,430
1,454
2,240 37,997 10,797
14,646
5,775
8,146
3,890
4,364
1,454
2,240 44,421 11,950
25.9
-54.6
-45.5
-76.7
-70.2
-74.8
-72.5
-9.5
-73.1
5.9
2.5
3.7
1.8
2.0
0.7
1.1
4.7
1.4
(INR m)
FY18E
18 January 2018
14

December 2017 Results Preview | Sector: Technology
Cyient
Bloomberg
Equity Shares (m)
M. Cap. (INR b)/(USD b)
52-Week Range (INR)
1,6,12 Rel Perf. (%)
CYL IN
113.0
65 / 1
605 / 435
-1 / 4 / -10
CMP: INR573
TP: INR600 (+5%)
Buy
Financial Snapshot (INR b)
Y/E JUNE
2017 2018E 2019E 2020E
Sales
EBITDA
PAT
EPS (INR)
EPS Gr. (%)
BV/Sh. (INR)
RoE (%)
RoCE (%)
Payout (%)
Valuation
P/E (x)
P/BV (x)
EV/EBITDA (x)
Div yld (%)
18.7
3.0
11.7
1.8
16.2
2.8
10.4
3.0
14.6
2.5
8.7
3.3
13.1
2.3
7.4
3.7
36.1
4.9
3.7
30.6
(0.2)
188.7
16.2
15.9
34.3
38.6
5.3
4.0
35.4
15.4
207.0
17.1
16.1
48.0
43.8
6.1
4.4
39.4
11.3
227.5
17.3
16.4
48.0
49.4
7.0
4.9
43.8
11.3
250.3
17.5
16.6
48.0
We expect CYL’s USD revenue to decline by 1.9% QoQ in 3QFY18.
In the core services business, CYL’s revenue is expected to decrease
by 0.7% QoQ. Due to depreciation in AUD/USD, we expect a cross-
currency headwind of 20bp for CYL.
Rangsons is expected to see a decline in revenue, making the ask
rate for 4Q steeper in order for it to achieve its FY18 growth
guidance.
Margins are expected to contract by 90bp QoQ to 13.7% on account
of the seasonal decline in revenue in the Services business and
pressure in Rangsons.
The overall margin impact is a cumulative of 80bp contraction in
Services margins and a slight decline in Rangsons too.
PAT estimate for the quarter is INR904m (-19% QoQ). The sharp
decline stems out of translation losses and the absence of profits
from the consolidation of IASI.
The stock trades at 14.6x FY19E and 13.1x FY20E EPS. Maintain Buy.
Key issues to watch for
Update on trajectory of top customer.
Changes to revenue guidance for the DLM business.
Health and performance expectations of top customers.
Quarterly Performance
Y/E March
1Q
Revenue (USD m)
QoQ (%)
Revenue (INR m)
YoY (%)
GPM (%)
SGA (%)
EBITDA
EBITDA Margin (%)
EBIT Margin (%)
Other income
ETR (%)
PAT
QoQ (%)
YoY (%)
EPS (INR)
Headcount
Util incl. trainees (%)
Attrition (%)
Offshore rev. (%)
E: MOSL Estimates
125
3.1
8,349
15.0
35.0
22.0
1,090
13.1
10.4
116
25.5
740
-12.3
-1.1
6.6
12,082
73.5
19.9
40.7
FY17
2Q
137
9.5
9,136
18.4
34.4
20.4
1,283
14.0
11.5
184
22.6
973
31.5
-1.2
8.7
12,286
78.0
22.7
40.1
3Q
136
-0.5
9,171
17.3
34.0
20.6
1,228
13.4
10.7
309
25.8
940
-3.4
8.3
8.4
12,155
78.3
22.6
40.4
4Q
141
3.8
9,410
15.3
34.4
21.1
1,249
13.3
10.6
264
18.1
785
-16.5
-7.0
7.0
12,048
77.4
15.6
39.2
1Q
141
0.0
9,070
8.6
34.9
22.1
1,160
12.8
9.9
350
31.2
876
11.6
18.4
7.8
12,048
74.1
16.6
40.4
FY18E
2Q
150
6.5
9,654
5.7
35.4
20.8
1,410
14.6
11.9
407
28.0
1,116
27.4
14.7
9.9
12,201
74.1
14.2
40.4
3QE
147
-1.9
9,540
4.0
35.1
21.3
1,310
13.7
11.3
175
26.0
904
-19.0
-3.8
8.1
12,537
75.9
41.2
4QE
157
6.6
10,288
9.3
34.6
21.1
1,392
13.5
11.2
325
26.0
1,072
18.5
36.5
9.5
12,512
74.5
41.0
FY17
538
14.0
36,065
16.5
34.4
21.0
4,848
13.4
10.8
874
24.2
3,699
7.4
32.9
12,048
(INR m)
FY18E
595
10.7
38,552
6.9
35.0
21.3
5,272
13.7
11.1
1,257
27.7
3,968
7.3
35.4
12,712
18 January 2018
15

December 2017 Results Preview | Sector: Media
D B Corp
Bloomberg
Equity Shares (m)
M. Cap. (INR b)/(USD b)
52-Week Range (INR)
1,6,12 Rel Perf. (%)
DBCL IN
183.7
65 / 1
395 / 338
-5 / -16 / -31
CMP: INR354
TP: INR430 (+21%)
Buy
Financial Snapshot (INR Billion)
Y/E MARCH
2017 2018E 2019E 2020E
Net Sales
EBITDA
Adj. Net Profit
Adj. EPS (INR)
Adj. EPS Gr. (%)
BV/Sh (INR)
RoE (%)
RoCE (%)
Div. Payout (%)
Valuations
P/E (x)
P/BV (x)
EV/EBITDA (x)
Div. Yield (%)
17.4
4.1
10.0
2.3
17.1
3.5
9.4
1.1
14.1
2.9
7.7
1.1
12.1
2.4
6.4
1.1
22.6
6.4
3.7
20.4
28.3
86.7
25.1
23.7
48.7
23.7
6.5
3.8
20.7
1.8
21.9
21.2
23.2
25.9
7.5
4.6
25.2
21.5
22.3
21.7
19.1
27.8
8.3
5.4
29.3
16.4
21.7
21.2
16.4
We expect print ad revenue to grow 3% YoY to INR4.1b.
Circulation revenue is likely to grow 8% YoY to INR1.3b, led by the
circulation drive.
DBCL’s aggregate revenue is likely to grow 4% to INR6.5b, as print
ads, which account for 60-65% of overall revenue, are expected to
be slow-moving in the quarter.
We expect EBITDA to reach INR2.1b (+4% YoY) and margin to
remain flat YoY at 31.6%.
We estimate net profit at INR1.2b, up 6% YoY.
The stock trades at 17.1x FY18E and 14.1x FY19E EPS. Maintain
Buy.
102.6 123.0 147.5
Key things to watch for
Ad revenue (we expect 3% YoY growth).
EBITDA margin (we expect 31.6%).
Consolidated - Quarterly Earning Model
Y/E March
Net Sales
YoY Change (%)
Total Expenditure
EBITDA
Margins (%)
Depreciation
Interest
Other Income
PBT before EO expense
Extra-Ord expense
PBT
Tax
Rate (%)
Minority Interest & P&L of Asso. Cos.
Reported PAT
Adj PAT
YoY Change (%)
Margins (%)
E: MOSL Estimates
1Q
5,746
21.4
3,934
1,812
31.5
211
34
41
1,608
0
1,608
568
35.3
0
1,040
1,040
62.0
18.1
FY17
2Q
5,391
12.7
3,885
1,505
27.9
216
6
41
1,325
0
1,325
440
33.2
0
885
816
43.8
15.1
3Q
6,273
6.3
4,290
1,982
31.6
218
30
36
1,771
0
1,771
590
33.3
0
1,181
1,181
6.6
18.8
4Q
5,171
1.5
4,049
1,122
21.7
218
5
51
950
0
950
309
32.5
0
642
642
6.2
12.4
1Q
5,943
3.4
4,079
1,864
31.4
220
16
70
1,698
0
1,698
597
35.1
0
1,101
1,101
5.9
18.5
FY18
2Q
5,683
5.4
4,284
1,399
24.6
229
20
57
1,207
0
1,207
421
34.8
0
787
749
-8.3
13.2
FY17
3QE
6,515
3.9
4,458
2,057
31.6
226
16
78
1,893
0
1,893
646
34.2
0
1,246
1,246
5.5
19.1
4QE
5,567
7.7
4,369
1,198
21.5
224
29
78
1,024
0
1,024
345
33.7
0
679
679
5.8
12.2
22,580
10.1
16,158
6,422
28.4
863
74
170
5,654
0
5,654
1,907
33.7
0
3,748
3,748
28.3
16.6
(INR m)
FY18E
23,708
5.0
17,190
6,518
27.5
898
81
283
5,822
0
5,822
2,009
34.5
0
3,813
3,813
1.8
16.1
18 January 2018
16

December 2017 Results Preview | Sector: Metals
Hindustan Zinc
Bloomberg
Equity Shares (m)
M. Cap. (INR b)/(USD b)
52-Week Range (INR)
1,6,12 Rel Perf. (%)
Financial Snapshot (INR Billion)
Y/E March
2017 2018E
Sales
173.0 217
EBITDA
0.0
0.0
NP
83.2 92.5
Adj. EPS (INR)
19.7 21.9
EPS Gr(%)
11.2
BV/Sh. (INR)
72.9 67.5
RoE (%)
24.4 31.2
RoCE (%)
29.4 39.1
Payout (%)
179.3 36.0
Valuations
P/E (x)
17.4 15.6
P/BV (x)
14.3 13.1
EV/EBITDA (x)
0.0
9.2
Div. Yield (%)
8.6
1.9
HZ IN
4225.3
1318 / 21
331 / 227
2/9/5
CMP:INR312
TP: INR354 (+13%)
Neutral
2019E 2020E
295
285
0.0
0.0
139.8 134.4
33.1 31.8
51.1
-3.9
88.7 109.1
42.3 32.2
57.4 42.6
36.0 36.0
10.3
9.0
5.7
2.9
10.7
9.2
5.5
2.8
We expect HZL’s EBITDA to increase 5% QoQ / 16% YoY to
INR31.7b, driven by higher LME, partly offset by lower cost and
premiums.
LME zinc is up 28% YoY / 9% QoQ to USD3,229/t. Lead is up 16%
YoY / 7% QoQ to USD2,491/t.
Refined zinc sales are expected to decline 5% QoQ to 202kt. Lead
is expected to decline 2% QoQ to 39kt.
PAT is expected to decrease 6% QoQ / increase 3% YoY to
INR23.9b on lower other income.
Key issues to watch for
Decline in global zinc prices.
Production issues.
Quarterly Performance
Y/E March
Zinc refined (kt)
Lead refined (kt)
Silver (tonnes)
Zinc LME (USD/t)
Net Sales
Change (YoY %)
EBITDA
Change (YoY %)
As % of Net Sales
Finance cost
DD&A
Other Income
PBT (before EO item)
EO exp. (income)
PBT (after EO item)
Total Tax
% Tax
Reported PAT
Adjusted PAT
Change (YoY %)
E=Estimate
1Q
120
23
88
1,918
25,306
-30.3
11,309
-42.5
44.7
712
3,644
6,101
13,053
-5
13,059
2,680
20.5
10,379
10,374
-53.4
FY17
2Q
3Q
148
211
32
36
107
117
2,252
2,518
35,257 49,799
-12.6
45.2
20,767 27,834
2.6
88.3
58.9
55.9
712
451
4,317
4,589
7,702
5,882
23,440 28,676
0
0
23,440 28,676
4,421
5,477
18.9
19.1
19,019 23,199
19,019 23,199
-11.4
28.1
4Q
217
47
135
2,777
62,602
99.9
37,480
186.5
59.9
142
5,321
4,811
36,829
0
36,829
6,259
17.0
30,570
30,570
42.2
1Q
190
34
110
2,589
45,760
80.8
23,840
110.8
52.1
1,370
3,600
5,300
24,170
0
24,170
5,410
22.4
18,760
18,760
80.8
FY18
2Q
3QE
193
203
40
39
146
120
2,950
3,229
53,090 56,254
50.6
13.0
30,240 31,702
45.6
13.9
57.0
56.4
840
0
3,940
5,054
4,870
3,636
30,330 30,283
-2,910
0
33,240 30,283
7,790
6,359
23.4
21.0
25,450 23,923
22,540 23,923
18.5
3.1
4QE
209
41
124
3,200
62,227
-0.6
36,372
-3.0
58.4
0
5,105
3,233
34,500
0
34,500
7,245
21.0
27,255
27,255
-10.8
(INR Million)
FY17
696
138
447
2,366
172,964
21.6
97,390
43.7
56.3
2,017
17,871
24,496
101,998
-5
102,003
18,837
18.5
83,166
83,161
-0.7
FY18E
795
154
499
2,992
217,331
25.7
122,153
25.4
56.2
2,210
17,699
17,039
119,282
-2,910
122,192
26,804
21.9
95,388
92,478
11.2
18 January 2018
17

December 2017 Results Preview | Sector: Cement
UltraTech Cement
Bloomberg
Equity Shares (m)
M. Cap. (INR b)/(USD b)
52-Week Range (INR)
1,6,12 Rel Perf. (%)
UTCEM IN
274.4
1179 / 19
4531 / 3262
0 / -1 / 2
CMP: INR4,294 TP: INR4,914
(+15%)
Buy
Financial Snapshot (INR Billion)
Y/E March
2017 2018E 2019E 2020E
Sales
EBITDA
NP
Adj. EPS (INR)
EPS Gr. (%)
BV/Share (INR)
RoE (%)
RoCE (%)
Payout (%)
Valuation
P/E (x)
P/BV (x)
EV/EBITDA (x)
EV/Ton (USD)
40.6
4.5
21.1
243
41.8
4.4
19.5
225
29.1
3.9
14.0
211
23.2
3.4
11.7
202
238.9 297.6 378.4 427.0
49.7
26.4
96.1
11.3
11.6
9.7
12.1
64.0
28.1
6.4
11.1
9.0
17.1
86.0
40.4
43.9
14.2
10.1
15.8
102.2
50.5
25.1
102.2 147.1 184.0
872.1 975.8 1,096 1,241
15.7
11.3
15.8
3QFY18 cement volumes are estimated at 14.02mt, including
volumes of JPA’s assets. Standalone volumes for Ultratech are
likely to grow by 7.2% YoY. JPA is expected to operate at
utilization of 42% for 3QFY18. Realizations are estimated to
increase 7.3% YoY (2.6% QoQ) to INR5,132/ton.
We estimate grey cement EBITDA/ton at INR891 (-INR48/ton
QoQ) due to cost push. EBITDA margin is expected to shrink 1.4pp
QoQ to 19.2%.
EBITDA is estimated to increase 27% YoY to INR14.2b, while PAT is
estimated to decline 18% YoY to INR4.63b due to higher interest
cost and depreciation related to JPA’s acquisition.
The stock trades at a P/E of 29.1x (FY19E) and 23.2x (FY20E),
EV/EBITDA of 14x (FY19E) and 11.7x (FY20E), and EV/ton of
USD211 (FY19E) and USD202 (FY20E). Maintain Buy.
Key issues to watch for
Volume growth recovery and outlook.
Cement pricing outlook and sustainability.
Update on JPA acquisition.
Quarterly Performance
Y/E March
Sales (m ton)
YoY Change (%)
Blended Realn.(INR/ton) *
YoY Change (%)
QoQ Change (%)
Net Sales
EBITDA
Margins (%)
Depreciation
Interest
Other Income
PBT before EO expense
Tax
Rate (%)
Reported PAT
Adj PAT
YoY Change (%)
1Q
12.91
6.3
4,723
-1.5
3.9
62,295
14,225
22.8
3,027
1,525
1,504
11,177
3,428
30.7
7,749
7,749
28.3
FY17
2Q
3Q
10.87
11.40
0.6
-0.6
4,827
4,781
-2.9
-0.1
2.2
-0.9
53,966 56,091
10,938 11,135
20.3
19.9
3,139
3,156
1,367
1,293
2,335
970
8,767
7,655
2,757
2,021
31.4
26.4
6,011
5,634
6,011
5,634
31.4
6.7
4Q
13.68
-0.2
4,689
3.2
-1.9
65,953
12,782
19.4
3,357
1,529
2,401
10,297
3,276
32.2
6,883
6,976
-10.7
1Q
12.90
-0.1
5,025
6.4
7.2
66,265
15,601
23.5
3,098
1,285
1,652
12,870
3,963
30.8
8,906
8,906
14.9
FY18
2Q
3QE
12.84
14.02
18.1
23.0
5,001
5,132
3.6
7.3
-0.5
2.6
65,713 73,754
13,513 14,160
20.6
19.2
4,988
4,900
3,759
3,800
1,680
1,500
6,447
6,960
2,135
2,332
33.1
33.5
4,312
4,628
4,312
4,628
-28.3
-17.9
4QE
16.94
23.8
5,297
13.0
3.2
91,868
20,714
22.5
3,803
3,990
1,468
14,388
4,176
29.0
10,212
10,212
46.4
(INR Million)
FY17
48.9
1.6
4,762
-0.8
238,914
49,690
20.8
12,679
5,714
6,600
37,896
11,482
30.4
26,277
26,372
11.3
FY18E
56.7
16.1
5,127
7.7
297,600
63,987
21.5
16,789
12,834
6,300
40,664
12,606
31.0
28,058
28,058
6.4
E: MOSL Estimates; YoY not comparable as financials includes JPA numbers for 3QFY18 and not for 3QFY17
18 January 2018
18

December 2017 Results Preview | Sector: Financials
Yes Bank
Bloomberg
Equity Shares (m)
M. Cap. (INR b)/(USD b)
52-Week Range (INR)
1,6,12 Rel Perf. (%)
Financial Snapshot (INR b)
Y/E March
2017 2018E
NII
58.0 78.3
OP
58.4 78.5
NP
33.3 40.7
NIM (%)
3.4
3.6
EPS (INR)
14.6 17.8
EPS Gr. (%)
20.8 22.1
BV/Sh. (INR)
93.7 109.7
ABV/Sh. (INR)
78.5 103.3
RoE (%)
18.9 17.3
RoA (%)
1.8
1.7
Valuations
P/E(X)
21.6 17.7
P/BV (X)
3.4
2.9
P/ABV (X)
4.0
3.1
Div. Yield (%)
0.8
0.6
YES IN
2282.4
721 / 11
383 / 228
0 / -3 / 9
CMP: INR316
TP: INR382 (+21%)
Buy
2019E
100.8
100.3
53.2
3.8
23.3
30.9
129.2
123.9
19.5
1.8
13.5
2.4
2.5
1.2
2020E
125.7
125.8
67.4
3.9
29.5
26.6
154.4
148.3
20.8
1.9
10.7
2.0
2.1
1.4
We expect loan growth to be significantly ahead of system
average at 34% YoY on the back of refinancing opportunities and
strong growth in retail banking.
We expect NIM to improve YoY, helped by lower cost of funds on
account of CASA inflows post demonetization and re-pricing of
bulk deposits. Consequently, NII growth is expected to be healthy
at 34% YoY, one of the best among peers.
Non-interest income growth is likely to be ~32% YoY, led by
strong growth from third-party distribution and processing fees.
We expect opex growth to be 27%, as the bank invests in
technology to leverage retail base.
Asset quality performance so far has been significantly better
than industry; we expect this trend to continue. YES trades at 2.4x
FY19E BV and 13.5x FY19E EPS. Return ratios also remain strong
(RoA of 1.8% and RoE of 19.5%). Maintain Buy.
Key issues to watch for
Implementation of retail strategy on assets and liabilities sides.
Performance on asset quality and quantum of loans rescheduled
under 5:25 scheme/sale to ARCs.
Quarterly Performance
1Q
12,516
18.1
9,655
22,171
9,103
13,068
43.9
2,066
11,001
3,683
7,318
32.8
3.3
28.6
33.0
86.4
8.4
0.8
FY17
2Q
14,122
27.4
9,219
23,340
9,481
13,860
36.0
1,617
12,243
4,228
8,015
31.3
3.62
28.9
37.7
86.1
9.2
0.8
3Q
14,893
28.7
10,165
25,059
10,520
14,538
26.5
1,154
13,384
4,558
8,826
30.6
3.6
30.5
38.8
88.5
10.1
0.9
4Q
16,397
32.1
12,574
28,971
12,061
16,910
38.0
3,097
13,813
4,671
9,141
30.2
3.8
27.9
34.7
92.6
20.2
1.5
1Q
18,089
44.5
11,322
29,411
12,369
17,042
30.4
2,858
14,184
4,529
9,655
31.9
3.9
22.6
32.1
93.2
13.6
1.0
FY18E
2Q
18,851
33.5
12,484
31,335
12,269
19,067
37.6
4,471
14,596
4,569
10,027
25.1
3.8
23.4
34.9
94.1
27.2
1.8
FY17
3Q
19,944
33.9
13,144
33,088
13,369
19,719
35.6
3,509
16,210
5,268
10,942
24.0
3.8
25.4
34.0
94.5
25.3
0.0
4Q
21,496
31.1
16,153
37,649
15,630
22,019
30.2
5,433
16,587
5,681
10,905
19.3
3.9
28.1
32.0
95.4
34.7
2.0
(INR M)
FY18E
Net Interest Income
% Change (Y-o-Y)
Other Income
Net Income
Operating Expenses
Operating Profit
% Change (Y-o-Y)
Other Provisions
Profit before Tax
Tax Provisions
Net Profit
% Change (Y-o-Y)
Operating Parameters
NIM (Cal, %)
Deposit Growth (%)
Loan Growth (%)
CD Ratio (%)
Asset Quality
Gross NPA (INR B)
Gross NPA (%)
E: MOSL Estimates
57,973
78,280
26.9
35.0
41,568
54,869
99,541 1,33,149
41,165
54,695
58,375
78,453
35.7
34.4
7,934
17,776
50,441
60,678
17,140
20,024
33,301
40,654
31.1
22.1
3.6
27.9
34.7
92.6
20.2
1.5
3.8
28.1
32.0
0.0
34.7
2.0
18 January 2018
19

December 2017 Results Preview | Sector: Technology
Zensar Technologies
Bloomberg
Equity Shares (m)
M. Cap. (INR b)/(USD b)
52-Week Range (INR)
1,6,12 Rel Perf. (%)
ZENT IN
45.4
39 / 1
958 / 736
-2 / -4 / -36
Financial Snapshot (INR b)
Y/E Mar
2017 2018E 2019E 2020E
Sales
30.6
30.8
34.9
39.6
EBITDA
3.8
3.6
4.6
5.5
PAT
2.3
2.4
3.1
3.7
EPS (INR)
52.1
52.5
68.2
80.9
EPS Gr. (%)
BV/Sh. (INR)
RoE (%)
RoCE (%)
Payout (%)
Valuations
P/E (x)
P/BV (x)
EV/EBITDA (x)
Div Yld (%)
-24.1
325.9
17.2
23.2
23.0
16.5
2.6
9.3
1.4
0.7
365.5
15.2
17.4
21.0
16.4
2.4
9.5
1.3
30.0
418.1
17.4
21.1
19.5
12.6
2.1
6.9
1.5
18.7
481.6
18.0
22.1
18.5
10.6
1.8
5.4
1.7
CMP: INR 861
TP: INR1,020 (18%)
Buy
We expect revenue of USD120m, representing growth of 1.5% QoQ.
This would translate into 1.2% QoQ CC growth, a cross-currency
tailwind of 30bp for ZENT.
Sluggish growth is expected in ZENT’s organic business, led by
rationalization of tail accounts, pressure from the Oracle ATG
ecosystem and seasonal weakness.
We expect EBITDA margin to expand by 50bp QoQ to 12.1%. Over
the last couple of quarters before 2Q, several one-off factors had
impacted profitability.
Continued investments and a lack of organic growth pick-up would
keep margin expansion under check, despite higher potential.
Our PAT estimate is INR549m, -9.7% QoQ, on account of translation
losses.
The stock trades at 12.6x FY19E and 10.6x FY20E earnings. Buy.
Key issues to watch for
Traction in Digital, large deals and other new initiatives.
Margin outlook, given the shock in 4Q and investments required
in the business.
Progress on restructuring.
(INR m)
FY18E
476
3.6
30,828
0.9
28.3
16.8
3,564
11.6
9.3
760
28.5
2,367
0.7
52.5
8,814
83.0
36.4
Quarterly Performance (IFRS)
Y/E March
Revenue (USD m)
QoQ (%)
Revenue (INR m)
YoY (%)
GPM (%)
SGA (%)
EBITDA
EBITDA Margin (%)
EBIT Margin (%)
Other income
ETR (%)
PAT
QoQ (%)
YoY (%)
EPS (INR)
Headcount
Utilization (%)
Offshore rev. (%)
E: MOSL Estimates
1Q
114
3.1
7,554
7.2
29.1
15.4
1,037
13.7
12.3
198
32.6
741
5.4
-2.8
16.4
8,238
79.8
31.2
FY17
2Q
3Q
116
118
1.8
1.3
7,703
7,865
1.8
3.9
30.1
30.2
15.6
16.4
1,111
1,085
14.4
13.8
12.8
12.3
70
201
29.6
30.2
704
800
-5.0
13.7
-22.9
11.9
15.6
17.7
8,316
8,564
80.1
79.5
33.8
33.5
4Q
112
-4.9
7,433
-0.4
27.7
19.9
585
7.9
6.2
-228
45.5
104
-87.0
-85.2
2.3
8,524
79.2
34.5
1Q
114
2.2
7,367
-2.5
27.6
17.4
748
10.2
7.7
203
32.0
472
354.7
-36.3
10.5
8,567
83.2
37.5
FY18E
2Q
3QE
119
120
3.8
1.5
7,626
7,794
-1.0
-0.9
28.8
28.6
17.2
16.5
884
941
11.6
12.1
9.3
9.8
194
75
26.8
28.0
608
549
29.0
-9.7
-13.6
-31.4
13.5
12.2
8,414
8,764
85.9
82.0
37.5
35.7
FY17
4QE
123
2.0
8,041
8.2
28.3
16.0
991
12.3
10.1
289
28.0
737
34.2
610.5
16.3
8,814
81.0
35.0
459
1.4
30,556
3.1
29.3
16.8
3,819
12.5
10.9
241
31.6
2,349
-24.1
52.1
8,524
79.7
33.2
18 January 2018
20

In conversation
1. MCX: Looking to launch crude, zinc, copper & silver in F&O;
Mrugank Paranjpe, MD & CEO
Overall turnover down at 9 percent; Q3 usually a subdued quarter. However,
metals have shown a healthy growth.
Working to ensure that cost base remains flat.
Saw 10-12 percent rise in volumes in first ten days of 2018.
Looking to launch crude, zinc, copper and silver in Futures and Options (F&O).
Hopeful that the Budget this year will re-introduce benefits under section 88E
for members. Will go long way in terms of boosting both the volumes and the
confidence in the overall commodity markets in terms of volume as well.
2. HPCL: Target to complete Barmer refinery by 2022-2023; MK
Surana, CMD
Barmer refinery a 9 million metric tonne capacity refinery which will have a
petrochemical of around 2 million metric tonne. The investment is around Rs
43,129 crore and targeting the completion by the financial year 2022-2023.
Will be the first integrated refinery complex, which will be coming along with
the petrochemical right from the inception.
Crude has shown an upswing in the last few days. Higher crude prices do impact
the gross refining margins (GRMs) to some extent.
Crude prices showing resistance around USD 70 per barrel.
3. RELIANCE NIPPON: Flows into equities, debt funds to
continue; focusing on small towns; Sundeep Sikka, ED & CEO
Saw a positive growth in Mutual Funds and alternate investment funds.
Company saw a huge inflow of retail funds post demonetization.
Overall assets have grown to Rs 3.8 lakh crore.
The company has been focusing on tier 2 and tier 3 cities, and there is lot of
interest from retail investors from these cities and small towns. Going forward,
expect the flows into equities and debt funds to continue as other assets are not
so attractive.
In terms of financial assets, India remains still underpenetrated. Only 2 percent
of population is investing in Mutual Funds.
The more matured investors are expected to move to ETFs.
4. JYOTHY LABS: Expect margin to sustain between 15-16% for
next few quarters; Ullas Kamath, Joint MD
Off take post goods and services tax (GST) has improved. Strong in rural market
historically.
Household insecticides business will improve in Q4.
Seeing strong growth in Margo brand.
Focusing on growing the dish-wash segment consistently going forward.
18 January 2018
21

5. DEN NETWORKS: Will be adding 80,000 subscribers every
month going ahead; SN Sharma, CEO
Have registered an EBITDA of Rs 81 crore, last quarter it was Rs 82 crore, vis-à-
vis previous year, and it is a growth of 54 percent. Going forward, quarter-on-
quarter revenues will keep on increasing in the range of 6-7 percent.
Subscription rate varies from area to area. Currently operate in the universe of
13 million subscribers and have already digitalised 11.5 million subscribers.
In coming quarters on monthly basis, will be adding around 80,000 subscribers
to digital kitty.
6. AMBER ENTERPRISES: Expect to do better than the industry
growth rate; Jasbir Singh, Chairman & CEO
Company is a large original design manufacturing (ODM); 72 percent is ODM
category and remaining is original equipment manufacturing (OEM) category.
Have historically outnumbered the industry growth.
Current utilisation at 45 percent and current borrowing rate at 9.5 percent.
Expect to do better than the industry growth rate.
Focused on expanding product portfolio currently.
18 January 2018
22

From the think tank
1. Succour or slap? India’s bond market needs a bit of both
India’s banks were hoping the regulator would feel the pain of their bond-market
losses and maybe offer a palliative. What they got instead from the Reserve Bank
of India (RBI) was tough love. Condemnation by deputy governor Viral Acharya
may be correct, but it won’t resolve the mess. In a speech in Mumbai on Monday,
Acharya revisited the nexus between the government and banks, a topic close to
his heart even when he was a New York University professor and an adviser to the
European Systemic Risk Board. Then, most of his criticism was directed at “myopic
governments” leaning on domestic banks as a low-cost funding option for their
deficits. Now, he’s pointing the sharp end of his stick at the lenders themselves: It
appears that for most banks investment activity essentially consists of two steps—
buying and hoping for the best. But hope should not be a treasury desk’s primary
trading strategy.
2. The great Indian fiscal dilemma
The state of the economy and the possibility that the government will miss the
current year’s fiscal deficit target of 3.2% of gross domestic product (GDP) has
put the spotlight on how it manages its finances. The details, of course, will be
known when Union finance minister Arun Jaitley presents the last full budget of
this government in about a fortnight. The debate on whether it should stick to
fiscal consolidation or run a higher deficit to push growth is likely to intensify as
we get closer to the budget. To be sure, there are strong arguments on both
sides, as economists Deepak Nayyar and Vivek Dehejia have shown. Decision
making will not be easy for the government; naturally, it will want economic
growth to pick up before crucial assembly elections later in the year and the
general election next year. But it would be well advised to remain on the path of
fiscal prudence for a number of reasons.
3. The economic challenges of 2018
Global economic winds have begun to shift. What does this mean for the Indian
economy? Take a look around. Global crude oil prices have climbed to around $70
a barrel. This is higher than what most Indian policy makers seem to have assumed
in their models. US interest rates have also begun to tighten. The yield on the two-
year US treasury note is now at its highest level since September 2008, the month
when Lehman Brothers collapsed. The yield curve has become steeper on
expectations of higher inflation. The underlying reason for higher oil prices and US
bond yields is that the global economy is in the midst of its best synchronized
expansion since 2011. The Indian data is also very different from what it was six
months ago. Economic growth has recovered from the depths it plunged to after
the demonetisation shock .
18 January 2018
23

4. Why India’s corporate tax rate should be cut
Many of India’s sectors have projected appreciable growth over the last financial
year. This brings into further focus the key expectations corporate India has from
Union budget 2018-19. Globally, there have been significant developments in the
international tax landscape, such as cooperation in addressing base erosion and
profit shifting (BEPS) concerns. There have also been a number of developments
when it comes to countries implementing changes through their domestic laws or
tax treaty networks. India has played a crucial role as part of the BEPS
implementation process and has been a pioneer while implementing the
“equalization levy” in line with the BEPS’ “Action Plan 1: Addressing the tax
challenges of the digital economy”.
International
5. Opec needs a long-term plan
The battle between Opec (Organization of the Petroleum Exporting Countries)
and shale oil producers can be characterized as a two-round fight. In the first
round, shale producers gained market share and the price of crude crashed. In
the second, Opec curbed output as shale producers adapted to the lower prices.
Now, get ready for round three, as Opec and Russia try to plot a way out of their
production cuts but likely get stymied by market twists and turns that upset
their calculations. The approach of Opec and its allies for the coming year is
clear. Brent crude has just risen above $70 per barrel, apparently confirming the
success of Opec’s plan. Production cuts have been extended until the end of
2018, and excess inventories are being drawn down. But as usual, demand in
the first half of the year looks to be relatively weak, meaning any reduction in
inventories will have to come in the second half.
18 January 2018
24

Click excel icon
for detailed
valuation guide
CMP
(INR)
850
124
3185
735
19879
1923
28194
1312
796
227
3566
745
244
9312
384
423
731
Valuation snapshot
Company
Automobiles
Amara Raja
Ashok Ley.
Bajaj Auto
Bharat Forge
Bosch
CEAT
Eicher Mot.
Endurance Tech.
Escorts
Exide Ind
Hero Moto
M&M
Mahindra CIE
Maruti Suzuki
Motherson Sumi
Tata Motors
TVS Motor
Aggregate
Banks - Private
AU Small Finance
Axis Bank
DCB Bank
Equitas Hold.
Federal Bank
HDFC Bank
ICICI Bank
IDFC Bank
IndusInd
J&K Bank
Kotak Mah. Bk
RBL Bank
South Indian
Yes Bank
Aggregate
Banks - PSU
BOB
BOI
Canara
Indian Bk
PNB
SBI
Union Bk
Aggregate
NBFCs
Aditya Birla Cap
Bajaj Fin.
Capital First
Cholaman.Inv.&F
n
Dewan Hsg.
GRUH Fin.
HDFC
HDFC Stand. Life
Indiabulls Hsg
Reco
Buy
Buy
Buy
Buy
Neutral
Buy
Buy
Buy
Sell
Buy
Neutral
Buy
Buy
Buy
Buy
Buy
Neutral
TP % Upside
EPS (INR)
EPS Gr. YoY (%)
P/E (x)
P/B (x)
ROE (%)
(INR) Downside FY18E FY19E FY20E FY18E FY19E FY18E FY19E FY18E FY19E FY18E FY19E
984
156
4023
859
20025
2221
34678
1554
688
265
3922
858
297
11026
458
593
756
16
25
26
17
1
15
23
18
-14
17
10
15
22
18
19
40
3
28.7
4.7
149.7
19.4
454.9
82.5
823.8
27.6
35.8
7.8
181.3
37.6
9.0
286.5
10.0
32.8
14.2
34.2
6.2
179.6
26.3
604.8
116.9
1,071.3
38.5
45.9
9.8
193.9
44.3
12.0
380.0
14.4
60.7
25.6
41.1
2.6
7.7
2.3
208.4
6.1
34.4
48.1
730.1
-3.9
140.6 -11.6
1,343.8 33.6
51.8
17.5
57.6
79.5
11.6
-4.3
214.2
7.2
48.8
37.5
14.9
94.3
482.9 15.2
18.3
30.0
66.3
65.5
34.4
21.0
26.2
21.7
40.2
12.8
9.9
8.2
105.4
21.8
3.9
101.4
17.2
51.9
30.2
4.9
29.5
-41.8
19.7
21.5
-65.7
13.3
21.0
-11.1
0.4
27.0
LP
19.4
35.0
-22.6
22.1
19.2
199.6
Loss
51.0
17.6
69.4
3,751.8
128.4
323.3
NA
42.8
33.1
28.5
25.5
21.1
40.4
5.4
22.0
18.9
33.9
20.0
35.9
33.0
41.7
30.1
39.6
28.0
25.8
6.9
17.6
33.0
32.6
43.9
85.2
80.4
42.3
42.4
67.4
23.2
231.4
19.1
23.2
25.2
7.0
29.2
59.1
29.7
40.8
97.1
30.9
31.5
26.2
LP
138.9
11.4
79.1
70.8
59.5
79.8
46.5
39.3
33.4
16.3
29.6
26.7
21.3
37.9
43.7
23.3
34.2
47.6
22.2
29.2
19.7
19.8
27.2
32.5
38.3
12.9
51.4
24.9
65.3
31.8
22.8
88.6
19.3
27.5
25.2
20.2
27.1
9.3
32.0
32.7
16.7
19.2
26.6
9.2
NM
12.5
11.2
16.6
26.7
7.6
20.6
49.0
37.2
24.1
22.7
24.9
20.0
17.7
27.9
32.9
16.5
26.3
34.1
17.3
23.2
18.4
16.8
20.4
24.5
26.6
7.0
28.5
17.5
45.8
19.0
18.5
26.7
16.2
22.3
20.2
18.8
21.0
5.8
24.7
23.2
8.5
14.7
20.3
7.3
33.6
5.2
10.1
9.3
15.7
4.8
11.4
33.4
26.7
18.1
19.6
13.4
46.6
31.3
89.1
11.4
4.8
5.4
4.9
7.2
6.3
2.9
10.8
9.0
3.5
3.6
6.2
3.1
2.6
6.8
8.3
2.0
11.9
4.6
8.7
2.2
2.3
2.3
1.7
5.0
2.6
1.3
4.3
0.8
4.4
3.4
1.2
3.1
3.2
1.0
0.7
0.7
1.2
0.9
1.2
0.5
0.9
4.7
6.0
3.0
4.1
2.2
16.5
6.3
3.2
3.8
4.2
4.7
4.4
6.0
5.7
2.5
8.1
7.4
3.0
3.2
5.4
2.8
2.3
5.8
6.8
1.5
8.9
3.9
7.3
2.0
2.1
2.1
1.5
4.2
2.5
1.3
3.7
0.7
3.8
3.0
1.1
2.7
2.8
0.9
0.7
0.7
1.1
0.9
1.1
0.4
0.8
3.6
5.0
2.6
3.5
1.9
13.6
5.3
2.7
3.3
17.6
21.1
24.2
20.3
15.1
13.0
36.0
20.5
16.8
12.3
33.4
14.1
9.9
20.4
23.4
17.0
25.4
18.7
14.3
7.3
11.5
2.6
9.4
18.8
8.8
6.8
17.0
8.4
14.8
12.4
6.9
17.3
12.1
6.4
-0.4
5.0
10.9
5.3
5.3
5.9
4.4
12.5
20.2
13.2
19.6
13.9
32.7
19.1
20.0
27.6
18.1
25.0
26.0
23.4
18.2
16.2
35.2
23.8
18.4
13.9
31.2
14.6
11.8
23.1
28.1
24.8
35.8
22.1
17.3
10.8
11.8
8.2
9.8
20.4
10.5
6.9
19.1
12.3
16.5
13.7
12.7
19.5
13.9
9.4
1.8
11.3
11.2
9.0
8.0
9.1
7.3
12.3
20.4
15.4
19.2
15.2
32.1
18.3
19.1
31.0
Buy
Buy
Neutral
Buy
Buy
Buy
Buy
Neutral
Buy
Buy
Buy
Buy
Buy
Buy
706
585
194
153
105
1891
343
61
1657
78
1027
525
32
343
705
680
197
209
149
2150
370
65
2076
100
1179
665
38
382
0
16
2
36
42
14
8
7
25
29
15
27
18
12
10.8
18.4
8.5
1.7
5.5
68.7
13.6
3.0
61.1
8.4
32.1
16.0
1.9
17.8
15.4
30.8
10.5
5.7
6.5
84.7
17.0
3.2
78.9
13.4
41.6
22.6
3.8
23.3
Buy
Neutral
Neutral
Buy
Buy
Buy
Neutral
165
165
354
387
175
306
141
217
175
366
438
250
415
153
32
6
3
13
43
35
9
17.9
-1.2
28.4
34.4
10.5
11.5
18.4
22.6
4.9
67.8
38.3
18.9
19.6
29.4
29.7
10.3
99.7
42.3
24.1
34.9
45.0
Buy
Buy
Buy
Buy
Buy
Neutral
Buy
Buy
Buy
182
1702
790
1344
609
547
1860
478
1208
231
2300
960
1500
710
500
2182
370
1550
27
35
22
12
17
-9
17
-23
28
3.7
45.7
32.8
59.1
37.2
9.9
65.8
4.7
83.7
5.4
63.7
43.7
68.7
45.5
11.7
59.3
5.4
106.3
7.8
87.0
56.5
84.2
56.5
14.6
68.9
6.7
132.7
22.4 16.4
19.1 55.5
-9.8 28.3
13.9 101.5
27.1 14.4
18 January 2018
25

Click excel icon
for detailed
valuation guide
CMP
(INR)
174
558
626
487
433
1277
672
2050
1503
TP % Upside
(INR) Downside
240
38
640
15
740
18
562
15
515
19
1750
37
800
19
2700
1700
32
13
EPS (INR)
EPS Gr. YoY (%)
FY18E FY19E FY20E FY18E FY19E
7.4
10.9
13.5
41.8 47.4
39.7 45.5
53.9
3.9
14.4
18.3 24.1
29.6
21.9 31.3
13.5 18.7
23.1
90.5 38.5
42.6 42.0
48.1
44.4
-1.4
52.5 66.5
88.8
66.2 26.6
36.0 41.9
50.0
23.5 16.5
115.6 145.3
80.6
106.2
173.7
127.6
37.1
44.9
35.3
-3.4
12.7
119.0
28.0
10.9
-64.9
-4.4
64.4
20.5
20.5
13.8
10.9
27.3
-1.7
15.2
13.4
15.3
25.6
31.8
15.0
48.7
13.3
-19.9
48.3
25.2
57.4
32.2
19.4
23.9
23.3
19.3
56.9
19.5
16.3
8.0
12.0
19.4
Valuation snapshot
P/E (x)
P/B (x)
FY18E FY19E FY18E FY19E
23.4 15.9
3.4
2.9
14.0 12.3
2.2
1.9
34.1 26.0
4.7
4.2
36.1 26.0
3.3
3.1
10.1 10.3
2.2
1.9
24.3 19.2
3.4
3.0
18.7 16.0
3.1
2.6
17.7
18.7
26.8
81.2
24.6
34.0
45.2
51.9
67.2
36.8
44.3
48.4
25.7
28.1
66.4
43.8
44.1
18.0
35.8
34.4
14.1
14.2
23.3
54.6
21.7
42.5
30.5
41.5
42.7
27.9
37.1
39.1
20.8
23.6
42.4
36.6
37.9
16.7
32.0
28.8
36.0
27.2
21.2
37.5
10.7
18.7
18.6
23.4
22.5
18.7
29.1
20.7
14.5
43.4
30.9
24.5
46.2
44.4
40.6
38.6
37.3
40.7
35.6
49.7
2.4
2.7
4.8
8.9
4.4
1.1
8.8
22.9
1.4
6.4
9.0
9.5
5.0
3.5
6.1
8.6
5.4
2.9
5.6
3.8
2.7
3.8
2.7
5.1
1.7
1.2
3.9
3.5
4.4
3.1
6.9
2.6
2.3
7.3
4.7
3.5
14.7
17.4
23.2
11.2
13.7
10.0
8.0
45.5
2.1
2.3
4.1
7.9
3.9
1.1
8.1
18.8
1.4
5.9
7.8
8.3
4.2
3.1
5.6
7.3
4.9
2.6
4.9
3.5
2.6
3.6
2.4
4.5
1.4
1.1
3.3
3.1
3.7
2.7
5.7
2.3
2.0
6.4
4.1
3.1
12.6
14.1
21.7
10.0
11.8
8.7
7.3
42.1
ROE (%)
FY18E FY19E
15.8 19.6
16.9 16.9
19.8 17.0
10.7 12.2
23.8 19.9
15.0 16.7
18.1 17.9
14.3
15.1
17.9
10.9
17.9
3.3
20.2
51.0
2.1
18.1
21.8
19.5
19.5
12.8
9.1
21.4
12.8
17.5
16.5
10.9
6.2
10.3
7.3
10.3
11.5
3.5
17.5
9.9
16.0
12.3
13.7
6.5
10.8
17.6
11.1
10.3
26.9
34.0
48.8
26.0
31.7
23.8
20.7
75.9
15.9
17.4
17.5
14.5
18.1
2.6
27.8
49.8
3.3
22.2
22.6
21.2
20.2
14.0
13.1
21.5
13.5
16.4
16.3
12.0
7.4
13.7
12.0
12.7
14.5
6.0
19.2
13.9
17.9
15.6
21.3
12.0
14.6
15.7
14.2
12.7
29.4
35.2
55.2
27.3
34.0
22.9
21.4
88.0
Company
Reco
L&T Fin Holdings Buy
LIC Hsg Fin
Neutral
MAS Financial
Buy
M&M Fin.
Buy
Muthoot Fin
Neutral
PNB Housing
Buy
Repco Home
Buy
Shriram City
Buy
Union
Shriram Trans.
Buy
Aggregate
Capital Goods
ABB
Sell
Bharat Elec.
Buy
BHEL
Sell
Blue Star
Neutral
CG Cons. Elec.
Buy
CG Power & Indu. Neutral
Cummins
Buy
GE T&D
Neutral
Havells
Buy
K E C Intl
Neutral
L&T
Buy
Siemens
Neutral
Solar Ind
Neutral
Thermax
Neutral
Va Tech Wab.
Buy
Voltas
Neutral
Aggregate
Cement
Ambuja Cem.
Neutral
ACC
Neutral
Birla Corp.
Buy
Dalmia Bharat
Buy
Grasim Inds.
Neutral
India Cem
Neutral
J K Cements
Buy
JK Lakshmi Ce
Buy
Ramco Cem
Buy
Orient Cem
Buy
Prism Cem
Buy
Sagar Cements Not Rated
Sanghi Inds.
Buy
Shree Cem
Buy
Ultratech
Buy
Aggregate
Consumer
Asian Paints
Neutral
Britannia
Buy
Colgate
Buy
Dabur
Buy
Emami
Buy
Godrej Cons.
Neutral
GSK Cons.
Neutral
HUL
Buy
1544
174
100
745
269
97
933
417
558
367
1352
1312
1149
1335
620
628
1230
210
78
685
315
90
1150
440
590
350
1540
1313
1120
1150
745
580
-20
20
-22
-8
17
-7
23
5
6
-5
14
0
-3
-14
20
-8
19.0
7.1
2.9
16.5
5.2
1.4
25.3
9.4
11.5
14.3
48.1
19.8
26.2
30.3
34.5
17.5
28.3
8.0
2.3
24.4
6.5
2.3
33.5
11.2
14.3
17.6
57.4
31.0
31.3
35.2
37.2
19.6
34.1
8.6
3.5
31.0
7.8
3.0
39.6
14.0
17.7
21.7
68.2
35.3
39.3
38.4
41.9
22.4
276
1840
1199
3134
1246
198
1148
446
789
169
145
1044
129
18933
4543
275
1795
1435
3568
1286
188
1324
512
913
205
130
-
157
22424
4914
-1
-2
20
14
3
-5
15
15
16
21
-10
22
18
8
6.1
7.7
48.6 67.8
32.2 56.7
60.8 83.7
81.9 116.8
5.8
10.5
47.8 61.8
12.1 19.1
27.1 35.1
6.3
9.1
2.7
5.0
25.2 50.6
5.8
8.9
423.0 435.8
102.2 147.1
9.8
80.4
61.6
111.7
133.5
12.1
79.1
25.2
44.7
15.2
6.6
70.6
12.0
724.2
184.0
25.5 25.3 45.1
34.5 39.5 37.9
12.8 76.1 37.3
56.8 37.6 51.6
20.8 42.5 15.2
3.9
80.4 33.8
41.7 29.5 24.0
74.3 57.2 36.8
-0.5
29.3 29.1
LP
44.0 26.9
905.1 81.3 52.8
LP
101.0 41.5
102.0 53.5 22.2
10.0
3.0 44.8
6.4
43.9 44.4
21.2 37.3 33.6
2.6
14.7
10.3
6.8
0.2
11.9
3.0
16.2
19.8
26.4
19.8
20.0
25.0
15.8
13.4
21.0
55.4
56.1
48.6
46.4
46.6
47.1
40.4
60.1
1194
4742
1139
359
1239
997
6490
1372
1282
6098
1357
410
1655
1042
5785
1497
7
29
19
14
34
4
-11
9
21.6 25.8
84.5 106.9
23.4 28.1
7.7
9.3
26.6 33.2
21.2 24.5
160.8 182.3
22.8 27.6
31.1
133.8
33.7
10.9
38.6
27.4
206.5
32.4
18 January 2018
26

Click excel icon
for detailed
valuation guide
CMP
(INR)
266
363
310
7759
22228
278
896
9379
221
1130
3687
TP % Upside
(INR) Downside
276
4
375
3
355
14
8173
5
28650
29
314
13
1044
17
9461
1
-
1320
17
3449
-6
EPS (INR)
EPS Gr. YoY (%)
FY18E FY19E FY20E FY18E FY19E
9.1
10.0
11.4
8.5
10.2
8.4
10.5
13.1
-25.0 25.2
6.2
7.7
9.3
-1.2
24.3
128.6 146.9 177.7
4.0
14.2
296.6 413.1 544.5 24.3 39.3
8.9
12.4
16.8 147.7 38.7
17.2 20.8
24.0
2.9
20.7
151.5 176.7 209.4 14.0 16.6
3.5
6.4
9.7
-2.0
83.8
14.7 18.0
22.3
68.9 22.4
36.5 56.0
76.9
36.5 53.5
9.7
17.2
21.6 24.9
68.0 89.5
52.7 64.1
44.6 50.3
6.5
9.9
17.5 23.7
22.6 27.0
32.4 43.7
60.8 115.7
1.9
4.9
37.9 42.8
6.8
9.0
44.2 54.9
17.8 26.2
44.2 55.0
21.0 31.3
37.6 42.7
140.1 157.4
18.1 29.9
36.3 62.5
14.5 22.1
49.7 61.4
29.7
109.1
79.2
55.3
18.3
26.4
33.3
52.4
144.6
8.4
50.5
13.0
60.6
35.2
64.4
37.8
57.1
180.5
37.8
77.9
27.5
78.5
0.3
-8.9
-8.1
13.5
-36.7
23.0
42.3
-18.9
-16.2
-81.8
-3.4
-5.4
28.6
10.9
19.7
17.8
-33.6
8.5
29.3
12.6
-44.5
-9.9
-14.4
LP
12.5
11.5
29.3
15.1
31.7
21.7
12.8
53.0
35.8
19.5
35.0
90.1
160.8
12.9
31.1
24.3
47.0
24.4
49.4
13.7
12.4
65.1
71.9
52.0
23.6
33.4
Valuation snapshot
P/E (x)
P/B (x)
FY18E FY19E FY18E FY19E
29.2 26.5
6.5
6.0
43.1 34.4
6.2
6.1
50.0 40.2 15.2 14.4
60.3 52.8 22.5 20.3
74.9 53.8 29.8 23.9
31.1 22.4
3.2
2.8
52.1 43.1 11.5 9.4
61.9 53.1 36.7 30.6
63.5 34.6
3.0
2.8
77.1 63.0 11.2 9.7
101.1 65.9 19.1 14.2
45.8 39.1 12.4 11.1
25.4
33.2
29.1
14.8
85.4
25.2
26.8
34.1
40.9
76.5
16.6
20.4
56.0
32.8
20.8
26.1
24.4
33.4
32.5
22.1
40.2
28.2
29.2
22.1
25.2
23.9
13.1
55.8
18.5
22.4
25.3
21.5
29.3
14.7
15.6
45.1
22.3
16.7
17.5
21.5
29.7
19.7
12.9
26.4
22.8
21.9
32.3
10.6
21.4
28.3
17.4
15.3
25.9
13.1
22.5
4.7
5.3
6.9
3.3
6.5
5.4
3.4
5.7
3.2
1.2
3.3
2.5
12.3
2.8
3.5
3.7
2.8
5.7
4.5
2.4
3.7
4.9
3.8
2.3
1.4
4.1
3.8
2.3
2.5
3.8
2.5
3.4
4.1
4.6
5.5
2.6
6.0
4.4
3.0
5.0
2.9
1.1
2.7
2.3
14.1
2.5
3.0
3.1
2.6
5.3
3.7
2.0
3.3
4.3
3.3
2.2
1.3
3.5
3.4
2.0
2.2
3.5
2.3
3.2
10.1
3.0
3.0
3.8
ROE (%)
FY18E FY19E
23.2 23.4
14.3 17.9
32.3 36.8
39.1 40.4
39.8 44.4
10.8 13.3
24.1 23.9
64.8 62.9
4.9
8.5
15.5 16.5
18.9 21.5
27.0 28.3
19.9
17.0
26.4
24.6
7.6
23.4
12.8
16.3
8.2
1.6
19.6
14.2
22.0
8.8
18.4
15.4
12.0
17.2
14.7
11.4
9.3
18.2
12.9
1.9
14.1
19.1
13.7
11.8
14.1
11.5
9.2
11.4
13.3
21.9
-6.3
4.9
19.8
19.4
25.7
22.3
10.7
26.1
13.5
21.2
14.1
3.9
18.4
15.4
31.4
11.9
19.2
19.4
12.5
17.7
20.5
17.0
13.2
19.9
15.2
7.0
12.9
17.5
12.6
11.7
15.4
14.1
18.2
14.2
34.9
22.3
0.2
10.1
Company
ITC
Jyothy Lab
Marico
Nestle
Page Inds
Parag Milk
Pidilite Ind.
P&G Hygiene
Prabhat Dairy
United Brew
United Spirits
Aggregate
Healthcare
Alembic Phar
Alkem Lab
Ajanta Pharma
Aurobindo
Biocon
Cadila
Cipla
Divis Lab
Dr Reddy’s
Fortis Health
Glenmark
Granules
GSK Pharma
IPCA Labs
Jubilant Life
Laurus Labs
Lupin
Sanofi India
Shilpa Medicare
Strides Shasun
Sun Pharma
Torrent Pharma
Aggregate
Infrastructure
Ashoka Buildcon
IRB Infra
KNR
Constructions
Sadbhav
Engineering
Aggregate
Logistics
Allcargo Logistics
Concor
Gateway
Distriparks
Aggregate
Media
Dish TV
D B Corp
Den Net.
Ent.Network
Reco
Neutral
Neutral
Neutral
Neutral
Buy
Neutral
Buy
Neutral
Not Rated
Buy
Neutral
Neutral
Buy
Buy
Buy
Neutral
Buy
Neutral
Neutral
Neutral
Buy
Neutral
Buy
Neutral
Neutral
Buy
Buy
Buy
Buy
Buy
Buy
Buy
Neutral
550
2257
1531
659
551
440
606
1105
2489
144
630
140
2476
585
921
547
917
4674
588
804
583
1401
540
2500
1791
900
485
555
600
1100
2575
185
650
200
2500
550
957
651
1000
5000
797
1074
610
1400
-2
11
17
37
-12
26
-1
0
3
28
3
43
1
-6
4
19
9
7
35
34
5
0
Buy
Neutral
Buy
Buy
228
247
311
414
275
240
325
445
21
-3
5
7
1.8
22.9
13.3
14.2
7.1
23.2
14.5
14.6
16.0
19.7
16.0
17.0
290.2 126.1
1.4 10.8
9.0
3.5
23.3
29.3
19.2
Buy
Neutral
Buy
204
1430
242
242
1496
282
19
5
16
10.9
42.7
8.8
13.3
55.2
18.4
15.3
68.1
21.3
10.7
12.4
29.6
13.1
22.0
29.3
18.7
33.5
109.2 27.5
33.4
30.0
Buy
Buy
Neutral
Buy
75
369
134
791
106
430
90
910
41
17
-33
15
0.7
20.7
-2.9
9.0
2.2
25.2
0.1
20.0
3.8
29.3
4.0
31.7
-36.4
1.8
Loss
-21.5
237.6 115.2 34.1 14.4
21.5 17.8 14.6
3.6
LP
NM 1,880.1 3.0
122.7 88.2 39.6
4.2
18 January 2018
27

Click excel icon
for detailed
valuation guide
CMP
(INR)
44
259
111
178
410
1473
116
25
1060
593
TP % Upside
(INR) Downside
47
7
305
18
117
5
225
26
469
14
1638
11
148
28
27
8
1155
9
690
16
EPS (INR)
EPS Gr. YoY (%)
FY18E FY19E FY20E FY18E FY19E
-0.2
0.8
2.0
Loss
LP
25.9 28.8
32.4
0.2
11.3
11.8 12.1
12.7
59.3
2.6
11.0 13.4
16.1
2.5
22.2
8.1
14.1
17.8
26.0 74.5
25.4 43.0
57.3
23.7 69.1
3.2
6.1
9.2
164.0 90.5
-0.8
0.1
0.6
Loss
LP
28.1 35.7
41.8
13.0 27.0
14.4 17.3
20.6
7.9
20.0
22.4 35.7
18.6
21.9
-18.0
19.7
4.6
13.7
-2.7
25.5
24.5
53.8
25.9
33.1
-0.6
24.9
5.3
12.7
3.1
38.9
43.8
48.8
26.3
31.8
3.3
22.9
5.4
13.2
4.4
43.0
45.6
59.2
117.2
11.2
Loss
33.3
24.8
37.4
Loss
165.2
61.9
41.7
57.3
-15.3
15.8
27.2
41.4
-12.8
-7.4
14.4
23.6
-29.6
-11.7
16.7
32.3
15.3
5.0
114.2
41.0
37.7
42.7
15.4
4.2
20.1
2.6
-1.8
18.2
15.4
7.6
15.4
14.4
20.2
39.1
51.1
Loss
26.2
13.1
-7.0
LP
52.3
78.6
-9.2
51.7
25.0
19.3
58.5
4.2
20.2
5.8
15.2
-1.1
25.0
37.7
21.8
11.3
14.2
16.5
28.0
22.3
27.7
26.0
11.3
3.6
-1.1
9.7
13.8
7.3
18.9
4.9
15.8
17.5
19.5
Valuation snapshot
P/E (x)
P/B (x)
FY18E FY19E FY18E FY19E
NM
57.9
3.1
2.9
10.0
9.0
1.4
1.2
9.5
9.2
1.0
0.9
16.2 13.3
2.8
2.4
50.7 29.0
3.9
3.5
58.0 34.3
6.4
5.4
35.8 18.8
5.3
4.1
NM 197.1 4.7
4.6
37.7 29.7
9.6
8.7
41.1 34.2
7.3
6.2
38.4 28.3
5.8
5.1
14.1
14.8
NM
14.4
17.3
10.9
NM
17.3
13.6
14.4
16.7
11.7
18.4
43.2
17.8
11.8
9.9
31.3
19.6
12.3
12.8
10.2
15.6
15.9
13.1
88.3
39.0
71.9
62.1
16.7
15.3
21.8
17.9
17.2
17.0
21.7
18.1
16.1
17.8
30.9
10.2
9.8
NM
11.4
15.3
11.8
31.7
11.3
7.6
15.9
11.0
9.4
15.4
27.3
17.0
9.8
9.4
27.2
19.8
9.8
9.3
8.4
14.0
13.9
11.3
69.0
31.9
56.3
49.3
15.0
14.7
22.0
16.3
15.1
15.9
18.3
17.3
13.9
15.2
25.9
1.8
4.8
0.9
2.6
1.5
1.9
1.1
3.9
1.9
2.2
1.9
2.6
2.0
6.5
2.5
2.7
1.6
6.4
5.1
2.0
1.0
1.1
3.6
1.9
1.7
14.6
6.0
15.1
11.5
2.8
3.8
5.4
4.2
2.2
4.9
4.0
3.0
2.4
3.0
9.4
1.5
3.6
0.9
2.1
1.4
1.8
1.1
3.0
1.7
1.9
1.7
2.2
1.8
5.4
2.2
2.3
1.4
5.4
4.6
1.7
0.9
1.0
3.1
1.7
1.6
14.4
5.2
13.7
10.3
2.6
3.5
4.6
3.6
2.0
3.9
3.6
2.8
2.2
2.9
7.6
ROE (%)
FY18E FY19E
-1.2
5.2
15.1 14.6
11.5 10.6
16.8 19.4
8.1 12.7
11.6 17.2
15.9 24.7
-14.2 2.4
26.4 30.7
19.1 19.6
15.1 17.9
13.4
31.2
-5.7
19.3
8.6
18.4
-3.0
25.2
14.5
15.6
11.5
24.0
11.2
16.0
14.7
24.5
16.9
22.0
27.3
16.9
8.0
10.9
25.3
12.4
13.0
16.5
16.5
23.2
18.5
17.1
25.6
26.6
24.3
13.9
32.1
17.4
14.6
15.2
17.8
33.6
16.2
42.3
-0.2
20.3
9.2
15.8
3.5
29.7
23.5
12.9
15.6
25.4
12.4
21.7
13.7
25.1
16.0
21.4
24.4
18.5
10.5
12.8
23.6
12.9
13.8
20.9
17.5
25.6
20.9
17.3
24.5
22.4
23.1
13.8
27.5
20.7
16.6
16.5
20.1
32.5
Company
Hathway Cable
Hind. Media
HT Media
Jagran Prak.
Music Broadcast
PVR
Prime Focus
Siti Net.
Sun TV
Zee Ent.
Aggregate
Metals
Hindalco
Hind. Zinc
JSPL
JSW Steel
Nalco
NMDC
SAIL
Rain Industries
Vedanta
Tata Steel
Aggregate
Oil & Gas
BPCL
GAIL
Gujarat Gas
Gujarat St. Pet.
HPCL
IOC
IGL
Mahanagar Gas
MRPL
Oil India
ONGC
PLNG
Reliance Ind.
Aggregate
Retail
Jubilant Food
PC Jeweller
Titan Co.
Aggregate
Technology
Cyient
HCL Tech.
Hexaware
Infosys
KPIT Tech
L&T Infotech
Mindtree
Mphasis
NIIT Tech
Persistent Sys
Tata Elxsi
Reco
Buy
Buy
Neutral
Buy
Buy
Buy
Buy
Neutral
Buy
Buy
Buy
Neutral
Buy
Buy
Neutral
Buy
Sell
Buy
Buy
Neutral
263
323
270
284
80
150
97
441
334
774
321
354
198
296
81
187
44
492
386
656
22
10
-27
4
1
25
-54
12
16
-15
Buy
Sell
Buy
Neutral
Buy
Buy
Buy
Neutral
Sell
Buy
Buy
Buy
Buy
479
481
883
221
420
385
315
1068
128
379
196
235
925
632
371
1000
183
576
545
416
1219
113
420
234
312
1069
32
-23
13
-17
37
42
32
14
-12
11
20
33
16
40.9
26.1
20.4
12.5
35.5
38.8
10.1
54.4
10.4
29.8
19.2
15.0
58.3
51.2
31.2
32.4
13.0
42.7
41.0
11.6
53.8
13.0
41.0
23.4
16.7
66.5
54.1
32.7
41.7
14.0
45.3
43.6
13.5
54.5
13.7
42.3
22.6
20.3
77.0
Sell
Buy
Buy
1892
587
894
1359
645
973
-28
10
9
21.4
15.1
12.4
27.4
18.4
15.9
36.2
23.5
19.8
Buy
Neutral
Neutral
Buy
Neutral
Buy
Buy
Neutral
Neutral
Buy
Buy
590
952
358
1152
201
1117
623
760
707
770
1045
600
970
270
1250
160
1200
600
670
600
780
1132
2
2
-25
8
-20
7
-4
-12
-15
1
8
35.4
62.4
16.4
64.4
11.7
65.6
28.7
41.9
43.9
43.1
33.8
39.4
64.6
16.3
70.7
13.3
70.4
34.1
43.9
50.8
50.7
40.4
43.8
69.6
18.5
78.6
17.2
82.3
42.6
49.5
56.7
60.2
48.7
18 January 2018
28

Click excel icon
for detailed
valuation guide
CMP
(INR)
2889
553
326
904
TP % Upside
(INR) Downside
2700
-7
560
1
280
-14
1020
13
EPS (INR)
EPS Gr. YoY (%)
FY18E FY19E FY20E FY18E FY19E
130.6 147.3 161.0
-2.1
12.8
36.2 39.2
45.1
17.2
8.4
19.0 19.4
22.3
12.3
2.3
52.5 68.2
80.9
0.7
30.0
3.5
4.8
3.0
16.6
-12.1
4.4
5.6
19.0
-11.8
16.0
9.0
21.0
-10.8
30.1
-73.1
12.0
Loss
-56.4
PL
23.7
71.7
4.8
-19.3
12.4
24.8
-0.5
16.8
-15.0
56.2
17.8
17.2
-3.5
45.1
85.4
11.2
45.7
-38.2
50.9
78.9
47.0
-16.0
21.9
3.6
122.1
153.2
-10.4
17.7
-10.7
-12.5
11.4
8.4
4.4
25.3
88.4
14.4
Loss
267.3
LP
45.0
14.7
-18.2
30.3
16.6
17.0
12.2
26.0
56.5
45.6
21.0
15.3
0.3
20.4
42.1
21.6
20.5
32.9
10.9
20.2
63.1
41.1
20.6
28.4
46.3
17.7
19.0
34.1
36.7
61.1
48.4
28.1
27.8
32.9
Valuation snapshot
P/E (x)
P/B (x)
FY18E FY19E FY18E FY19E
22.1 19.6
6.9
6.0
15.3 14.1
2.8
2.5
17.1 16.8
3.0
2.5
17.2 13.3
2.5
2.2
18.9 18.0
4.7
4.1
167.4 88.8
22.0 19.2
NM
NM
148.1 40.3
-884.3 205.3
15.8
12.8
23.4
12.9
12.9
11.3
12.6
13.5
43.4
97.5
46.0
19.5
29.0
23.1
58.7
31.3
19.0
15.0
58.7
15.3
47.8
40.8
24.4
20.8
20.9
45.7
33.1
33.3
25.5
45.6
52.1
12.1
62.3
54.2
10.9
11.2
28.6
9.9
11.1
9.7
11.3
10.8
27.7
67.0
38.1
16.9
28.9
19.2
41.3
25.7
15.8
11.3
52.9
12.7
29.3
28.9
20.3
16.2
14.3
38.8
27.8
24.8
18.6
28.3
35.1
9.5
48.8
40.8
2.9
4.4
1.8
12.8
3.0
7.0
1.3
1.5
1.1
1.4
1.8
2.0
2.0
3.2
16.7
6.4
1.9
28.6
4.8
5.6
9.1
7.0
2.3
7.6
3.7
4.1
3.3
7.6
4.7
2.7
5.9
7.0
2.6
3.2
4.8
8.5
1.5
10.7
13.2
2.9
4.3
2.2
9.7
3.1
6.6
1.2
1.4
1.1
1.3
1.6
1.7
1.9
2.9
14.2
ROE (%)
FY18E FY19E
30.4 32.9
19.1 18.8
16.9 16.2
15.2 17.4
24.9 22.9
1.8
3.3
20.0 22.7
-19.9 -22.3
8.2 27.4
-0.3
1.5
44.6
10.7
6.3
8.4
11.0
17.0
16.2
15.1
7.4
18.2
60.8
11.1
5.0
10.8
11.9
17.4
15.9
17.5
10.9
22.9
Company
TCS
Tech Mah
Wipro
Zensar Tech
Aggregate
Telecom
Bharti Airtel
Bharti Infratel
Idea Cellular
Tata Comm
Aggregate
Utiltites
Coal India
CESC
JSW Energy
NHPC
NTPC
Power Grid
Tata Power
Aggregate
Others
Arvind
Avenue
Supermarts
Bata India
BSE
Castrol India
Coromandel Intl
Delta Corp
Eveready Inds.
Interglobe
Indo Count
Info Edge
Kaveri Seed
Manpasand
MCX
Monsanto
Navneet
Education
Oberoi Realty
Quess Corp
Reco
Neutral
Buy
Neutral
Buy
Buy
Neutral
Buy
Buy
500
366
103
644
680
430
120
780
36
17
16
21
Buy
Buy
Sell
Buy
Buy
Buy
Sell
291
1142
94
31
173
197
93
356
1360
51
37
211
261
73
22
19
-46
20
22
32
-22
18.5
89.1
4.0
2.4
13.4
17.4
7.4
26.8
102.1
3.3
3.1
15.7
20.4
8.3
31.1
110.7
3.6
3.7
17.8
21.3
8.5
Neutral
Sell
Sell
Neutral
Buy
Buy
Buy
Buy
Neutral
Neutral
Buy
Buy
Buy
Buy
Buy
Buy
457
1169
733
935
190
557
333
448
1196
121
1388
522
446
851
2566
157
518
1052
990
2842
1953
289
2251
87
8592
243
431
873
578
1100
235
523
382
400
1306
128
1300
738
533
1100
3293
194
580
1170
-
3266
2202
327
2500
114
5281
167
-6
-25
-21
18
24
-6
15
-11
9
6
-6
42
19
29
28
23
12
11
10.5
12.0
15.9
48.0
6.6
24.1
5.9
16.5
17.5
19.3
55.4
6.6
29.0
8.0
23.2
24.1
22.4
65.4
6.7
30.3
10.3
22.1
109.8
12.4
30.5
48.1
20.2
34.9
149.9
11.4
42.3
34.3
40.3
146.7
132.7
12.3
86.3
11.6
203.2
6.7
5.6 14.6 15.7
1.6
9.8
9.6
26.1 103.8 94.6
4.2 22.5 23.4
5.1
7.3
6.7
1.9
6.9
3.3
3.7
3.1
6.5
4.1
2.4
5.0
5.9
2.3
2.9
4.3
6.8
1.3
9.5
10.5
12.1
32.1
46.7
17.0
13.7
23.3
7.7
7.9
32.5
23.9
13.9
21.8
23.0
9.1
13.2
10.9
17.7
12.6
18.0
26.9
12.9
31.5
43.3
18.5
13.7
27.4
13.4
11.0
34.5
26.9
17.8
16.6
22.9
10.1
16.3
15.9
21.5
14.5
20.7
28.8
14.3 17.4
63.0 75.9
8.0
10.7
23.6 26.2
34.1 41.0
9.3
15.2
20.8 29.4
105.0 126.6
7.6
24.8
23.0
29.9
9.7
36.2
27.1
35.6
Buy
Buy
Under
PI Inds.
Review
Piramal Enterp. Buy
SRF
Buy
S H Kelkar
Buy
Team Lease Serv. Buy
Trident
Buy
TTK Prestige
Neutral
V-Guard
Neutral
15
13
13
11
31
-39
-31
85.4 114.5
76.7 104.9
6.3
10.2
43.2 64.2
7.2
9.2
137.8 176.1
4.5
6.0
18 January 2018
29

MOSL Universe stock performance
Company
Automobiles
Amara Raja
Ashok Ley.
Bajaj Auto
Bharat Forge
Bosch
CEAT
Eicher Mot.
Endurance Tech.
Escorts
Exide Ind
Hero Moto
M&M
Mahindra CIE
Maruti Suzuki
Motherson Sumi
Tata Motors
TVS Motor
Banks - Private
AU Small Fin. Bank
Axis Bank
DCB Bank
Equitas Hold.
Federal Bank
HDFC Bank
ICICI Bank
IDFC Bank
IndusInd
J&K Bank
Kotak Mah. Bk
RBL Bank
South Indian
Yes Bank
Banks - PSU
BOB
BOI
Canara
Indian Bk
PNB
SBI
Union Bk
NBFCs
Aditya Birla Cap
Bajaj Fin.
Capital First
Cholaman.Inv.&Fn
Dewan Hsg.
GRUH Fin.
HDFC
HDFC Stand. Life
Indiabulls Hsg
L&T Fin.Holdings
LIC Hsg Fin
M&M Fin.
Muthoot Fin
1 Day (%)
-0.6
1.8
0.8
2.7
0.4
0.8
1.0
-1.1
0.6
-0.2
-0.8
-0.5
-0.8
-0.1
1.5
0.2
1.1
0.7
4.7
-0.2
1.0
0.4
-0.7
2.7
1.2
-0.5
-0.2
-0.5
0.5
0.9
2.6
5.1
5.2
4.4
4.5
5.8
3.4
3.1
0.6
0.9
0.6
0.9
1.2
2.6
0.6
-0.9
0.3
-0.1
0.7
1.5
-1.5
1M (%)
9.0
10.2
-0.6
5.4
0.6
8.2
-4.4
3.5
14.4
11.0
1.8
0.5
2.6
1.6
2.0
4.3
-3.7
5.5
6.7
1.8
9.9
-2.3
1.0
13.1
15.5
-1.4
6.1
-0.2
3.1
3.5
8.4
-0.3
-6.7
-0.4
1.2
2.1
-2.0
-5.2
-1.7
-1.6
16.4
4.2
2.8
7.6
8.0
25.4
0.3
3.4
0.3
5.5
0.9
12M (%)
-6.2
45.0
16.7
57.2
-7.2
60.5
26.5
124.9
117.1
24.8
13.9
23.6
23.6
64.3
76.5
-19.2
92.7
Company
MAS Financial Serv.
PNB Housing
Repco Home
Shriram City Union
Shriram Trans.
Capital Goods
ABB
Bharat Elec.
BHEL
Blue Star
CG Cons. Elec.
CG Power & Inds Sol.
Cummins
GE T&D
Havells
K E C Intl
L&T
Siemens
Solar Ind
Thermax
Va Tech Wab.
Voltas
Cement
Ambuja Cem.
ACC
Birla Corp.
Dalmia Bharat
Grasim Inds.
India Cem
J K Cements
JK Lakshmi Ce
Ramco Cem
Orient Cem
Prism Cem
Sagar Cements
Sanghi Inds.
Shree Cem
Ultratech
Consumer
Asian Paints
Britannia
Colgate
Dabur
Emami
Godrej Cons.
GSK Cons.
HUL
ITC
Jyothy Lab
Marico
Nestle
Page Inds
Parag Milk
Pidilite Ind.
P&G Hygiene
1 Day (%)
0.1
-0.2
0.8
-0.8
-0.3
2.5
0.5
1.1
-1.6
-1.8
1.9
-0.4
-2.1
0.4
-1.6
2.2
1.8
-0.8
2.7
0.6
1.0
-0.1
-0.5
1.5
0.5
1.3
1.1
0.7
0.2
0.6
-1.3
-2.3
-1.5
-0.9
-0.8
0.0
0.3
1.5
1.0
0.4
-2.9
-0.5
-0.4
-0.7
1.6
-1.5
-1.1
0.0
-1.1
1.7
0.0
0.6
1M (%)
-2.1
-4.5
3.2
0.0
6.8
12.0
-3.1
11.1
-6.8
4.1
14.2
10.4
0.9
0.3
6.9
12.4
12.8
-1.4
12.9
2.0
-0.5
4.7
8.3
7.6
-1.7
9.3
18.9
6.8
1.9
11.8
5.8
27.4
27.2
10.0
6.4
5.1
6.6
0.8
6.4
4.7
-3.1
0.8
2.4
3.5
0.4
-2.9
1.1
-1.4
-1.6
-5.3
3.6
-0.2
12M (%)
54.5
0.8
10.5
57.5
40.0
26.7
17.1
42.5
64.5
48.7
11.2
34.1
49.4
145.7
40.2
11.9
62.5
58.7
26.4
82.5
29.8
38.3
72.5
79.0
76.6
47.0
63.6
21.2
29.7
34.2
62.1
49.6
108.6
26.6
34.2
24.4
57.5
25.4
29.3
18.1
26.0
29.8
63.2
5.6
4.9
20.7
31.9
58.3
4.3
42.7
39.4
20.2
64.9
-1.1
39.2
52.7
40.6
-6.0
36.5
24.6
41.5
37.5
66.8
29.3
3.6
43.7
28.1
56.7
34.5
19.6
1.4
86.6
29.4
40.8
113.5
61.2
49.6
55.5
79.5
4.8
64.2
39.3
18 January 2018
30

MOSL Universe stock performance
Company
Prabhat Dairy
United Brew
United Spirits
Healthcare
Alembic Phar
Alkem Lab
Ajanta Pharma
Aurobindo
Biocon
Cadila
Cipla
Divis Lab
Dr Reddy’s
Fortis Health
Glenmark
Granules
GSK Pharma
IPCA Labs
Jubilant Life
Lupin
Laurus Labs
Sanofi India
Shilpa Medicare
Strides Shasun
Sun Pharma
Torrent Pharma
Infrastructure
Ashoka Buildcon
IRB Infra.Devl.
KNR Construct.
Sadbhav Engg.
Logistics
Allcargo Logistics
Concor
Gateway Distriparks
Media
Dish TV
D B Corp
Den Net.
Ent.Network
Hathway Cab.
Hind. Media
HT Media
Jagran Prak.
Music Broadcast
PVR
Prime Focus
Siti Net.
Sun TV
Zee Ent.
Metals
Hindalco
Hind. Zinc
JSPL
JSW Steel
1 Day (%)
1.7
4.1
-0.3
2.1
-0.7
0.5
2.6
3.3
1.0
0.8
1.0
1.1
2.7
0.7
0.2
0.6
1.9
14.0
1.2
2.5
-0.7
-1.1
-0.5
0.9
0.1
-3.2
1.8
-0.8
0.5
-0.9
1.2
0.1
3.6
-1.0
2.9
1.7
-3.0
-2.6
3.1
-0.8
-0.7
2.4
-1.8
0.2
-1.6
-3.3
0.8
2.2
-0.1
0.9
1M (%)
-5.4
10.5
9.6
5.4
7.3
6.5
-1.3
5.9
7.2
5.3
5.2
4.9
6.2
17.3
10.2
4.4
3.4
35.7
6.7
4.4
1.5
-6.5
1.8
12.6
4.4
-4.4
14.5
16.3
15.8
12.3
10.0
1.7
-6.1
6.6
28.1
4.1
8.5
8.2
14.2
6.8
9.6
13.1
8.6
-3.5
13.3
3.8
8.2
10.5
63.5
13.0
12M (%)
102.5
36.7
77.3
-8.6
35.2
-14.6
-6.8
66.2
25.8
3.4
49.9
-16.4
-23.0
-28.7
25.3
-8.9
7.0
33.1
-38.7
14.7
13.1
-17.6
-29.2
-10.0
5.4
37.2
11.8
79.6
47.0
11.3
48.8
1.7
-13.5
3.0
53.8
5.7
19.7
-3.7
33.1
-1.0
18.7
55.3
-32.7
101.3
23.5
53.7
13.6
248.6
52.1
Company
Nalco
NMDC
Rain Industries
SAIL
Vedanta
Tata Steel
Oil & Gas
BPCL
GAIL
Gujarat Gas
Gujarat St. Pet.
HPCL
IOC
IGL
Mahanagar Gas
MRPL
Oil India
ONGC
PLNG
Reliance Ind.
Retail
Jubilant Food
PC Jeweller
Titan Co.
Technology
Cyient
HCL Tech.
Hexaware
Infosys
KPIT Tech
L&T Infotech
Mindtree
Mphasis
NIIT Tech
Persistent Sys
Tata Elxsi
TCS
Tech Mah
Wipro
Zensar Tech
Telecom
Bharti Airtel
Bharti Infratel
Idea Cellular
Tata Comm
Utiltites
Coal India
CESC
JSW Energy
NHPC Ltd
NTPC
Power Grid
Tata Power
1 Day (%)
1.1
0.8
5.0
2.7
1.3
1.0
0.2
0.6
-2.2
2.6
2.4
-0.1
-0.7
-1.5
-1.3
0.4
-0.7
-1.6
0.1
-0.4
1.7
0.4
1.2
0.4
0.1
2.6
-0.3
2.1
0.5
3.4
-0.3
0.9
0.0
1.4
-0.8
-1.9
1.0
0.7
-0.2
0.8
-0.9
-0.1
0.7
2.8
1.5
0.4
0.6
-0.5
1M (%)
3.2
14.4
18.7
23.5
12.1
11.4
-8.2
-1.1
5.5
8.2
-5.4
-6.9
-1.5
-3.3
2.0
6.6
7.0
-5.2
0.5
10.3
31.9
7.4
6.5
6.8
11.4
12.6
20.2
7.1
10.2
7.6
14.9
18.9
13.1
13.4
10.4
12.4
11.0
-3.6
3.3
10.1
-6.3
7.5
12.6
16.5
7.9
-2.2
-1.2
2.2
12M (%)
16.9
4.5
679.1
63.0
41.3
70.5
8.2
43.8
66.5
52.5
30.5
9.6
71.5
27.8
16.6
11.0
0.4
30.4
77.6
127.3
200.2
148.5
20.6
13.9
78.9
20.5
40.1
64.5
28.5
46.5
69.8
22.7
46.9
26.9
13.6
35.5
-0.3
57.6
3.7
49.5
-3.9
-5.1
67.9
46.9
2.7
-1.3
-0.3
20.2
18 January 2018
31

MOSL Universe stock performance
Company
Others
Arvind
Avenue Super.
Bata India
BSE
Castrol India
Coromandel Intl
Delta Corp
Eveready Inds.
Interglobe
Indo Count
Info Edge
Kaveri Seed
Manpasand
MCX
Monsanto
Navneet Educat.
Oberoi Realty
PI Inds.
Piramal Enterp.
Quess Corp
SRF
S H Kelkar
Team Lease Serv.
Trident
V-Guard
1 Day (%)
-0.4
-1.1
0.6
-0.5
0.3
-0.7
1.0
0.1
1.2
-0.2
-1.2
1.4
-3.1
-5.1
-0.3
-0.9
-0.8
-0.8
1.6
1.1
-0.6
1.8
2.1
-1.0
4.5
1M (%)
5.9
4.2
0.2
3.9
-8.7
8.9
27.3
3.3
5.5
8.6
12.1
-3.4
11.0
-12.9
4.2
-1.4
8.9
5.5
2.5
1.6
4.5
13.7
9.4
0.4
5.6
12M (%)
23.0
55.2
-3.9
71.8
145.6
88.8
36.4
-32.9
60.5
10.8
60.7
-27.9
13.8
34.4
63.0
20.6
58.7
57.2
17.9
-9.2
149.9
28.2
109.1
18 January 2018
32

THEMATIC/STRATEGY RESEARCH GALLERY

REPORT GALLERY
RECENT INITIATING COVERAGE REPORTS
Rs

DIFFERENTIATED PRODUCT GALLERY

Disclosures:
The following Disclosures are being made in compliance with the SEBI Research Analyst Regulations 2014 (herein after referred to as the Regulations).
Motilal Oswal Securities Ltd. (MOSL) is a SEBI Registered Research Analyst having registration no. INH000000412. MOSL, the Research Entity (RE) as defined in the Regulations, is engaged in the business of providing Stock
broking services, Investment Advisory Services, Depository participant services & distribution of various financial products. MOSL is a subsidiary company of Motilal Oswal Financial Service Ltd. (MOFSL). MOFSL is a listed
public company, the details in respect of which are available on
www.motilaloswal.com.
MOSL is registered with the Securities & Exchange Board of India (SEBI) and is a registered Trading Member with National Stock
Exchange of India Ltd. (NSE) and Bombay Stock Exchange Limited (BSE), Metropolitan Stock Exchange Of India Ltd. (MSE) for its stock broking activities & is Depository participant with Central Depository Services Limited
(CDSL) & National Securities Depository Limited (NSDL) and is member of Association of Mutual Funds of India (AMFI) for distribution of financial products. Details of associate entities of Motilal Oswal Securities Limited are
available on the website at
http://onlinereports.motilaloswal.com/Dormant/documents/Associate%20Details.pdf
Pending Regulatory Enquiries against Motilal Oswal Securities Limited by SEBI:
SEBI pursuant to a complaint from client Shri C.R. Mohanraj alleging unauthorized trading, issued a letter dated 29th April 2014 to MOSL notifying appointment of an Adjudicating Officer as per SEBI regulations to hold
inquiry and adjudge violation of SEBI Regulations; MOSL requested SEBI to provide all documents, records, investigation report relied upon by SEBI which were referred in Show Cause Notice and also sought personal
hearing. The matter is currently pending.
MOSL, it’s associates, Research Analyst or their relative may have any financial interest in the subject company. MOSL and/or its associates and/or Research Analyst may have beneficial ownership of 1% or more securities in
the subject company at the end of the month immediately preceding the date of publication of the Research Report.
MOSL and its associate company(ies), their directors and Research Analyst and their relatives may; (a)
from time to time, have a long or short position in, act as principal in, and buy or sell the securities or derivatives thereof of companies mentioned herein. (b) be engaged in any other transaction involving such securities and
earn brokerage or other compensation or act as a market maker in the financial instruments of the company(ies) discussed herein or act as an advisor or lender/borrower to such company(ies) or may have any other
potential conflict of interests with respect to any recommendation and other related information and opinions.; however the same shall have no bearing whatsoever on the specific recommendations made by the analyst(s),
as the recommendations made by the analyst(s) are completely independent of the views of the associates of MOSL even though there might exist an inherent conflict of interest in some of the stocks mentioned in the
research report.
Research Analyst may have served as director/officer, etc. in the subject company in the last 12 month period. MOSL and/or its associates may have received any compensation from the subject company in
the past 12 months.
In the last 12 months period ending on the last day of the month immediately preceding the date of publication of this research report, MOSL or any of its associates may have:
a)
managed or co-managed public offering of securities from subject company of this research report,
b)
received compensation for investment banking or merchant banking or brokerage services from subject company of this research report,
c)
received compensation for products or services other than investment banking or merchant banking or brokerage services from the subject company of this research report.
d)
Subject Company may have been a client of MOSL or its associates during twelve months preceding the date of distribution of the research report.
MOSL and it’s associates have not received any compensation or other benefits from the subject company or third party in connection with the research report. To enhance transparency, MOSL has incorporated a Disclosure
of Interest Statement in this document. This should, however, not be treated as endorsement of the views expressed in the report. MOSL and / or its affiliates do and seek to do business including investment banking with
companies covered in its research reports. As a result, the recipients of this report should be aware that MOSL may have a potential conflict of interest that may affect the objectivity of this report. Compensation of Research
Analysts is not based on any specific merchant banking, investment banking or brokerage service transactions.
Terms & Conditions:
This report has been prepared by MOSL and is meant for sole use by the recipient and not for circulation. The report and information contained herein is strictly confidential and may not be altered in any way, transmitted to,
copied or distributed, in part or in whole, to any other person or to the media or reproduced in any form, without prior written consent of MOSL. The report is based on the facts, figures and information that are considered
true, correct, reliable and accurate. The intent of this report is not recommendatory in nature. The information is obtained from publicly available media or other sources believed to be reliable. Such information has not
been independently verified and no guaranty, representation of warranty, express or implied, is made as to its accuracy, completeness or correctness. All such information and opinions are subject to change without notice.
The report is prepared solely for informational purpose and does not constitute an offer document or solicitation of offer to buy or sell or subscribe for securities or other financial instruments for the clients. Though
disseminated to all the customers simultaneously, not all customers may receive this report at the same time. MOSL will not treat recipients as customers by virtue of their receiving this report.
Analyst Certification
The views expressed in this research report accurately reflect the personal views of the analyst(s) about the subject securities or issues, and no part of the compensation of the research analyst(s) was, is, or will be directly or
indirectly related to the specific recommendations and views expressed by research analyst(s) in this report.
Automobiles
Disclosure of Interest Statement
Analyst ownership of the stock
Companies where there is interest
No
A graph of daily closing prices of securities is available at
www.nseindia.com, www.bseindia.com.
Research Analyst views on Subject Company may vary based on Fundamental research and Technical Research. Proprietary
trading desk of MOSL or its associates maintains arm’s length distance with Research Team as all the activities are segregated from MOSL research activity and therefore it can have an independent view with regards to
subject company for which Research Team have expressed their views.
Regional Disclosures (outside India)
This report is not directed or intended for distribution to or use by any person or entity resident in a state, country or any jurisdiction, where such distribution, publication, availability or use would be contrary to law,
regulation or which would subject MOSL & its group companies to registration or licensing requirements within such jurisdictions.
For Hong Kong:
This report is distributed in Hong Kong by Motilal Oswal capital Markets (Hong Kong) Private Limited, a licensed corporation (CE AYY-301) licensed and regulated by the Hong Kong Securities and Futures Commission (SFC)
pursuant to the Securities and Futures Ordinance (Chapter 571 of the Laws of Hong Kong) “SFO”. As per SEBI (Research Analyst Regulations) 2014 Motilal Oswal Securities (SEBI Reg No. INH000000412) has an agreement with
Motilal Oswal capital Markets (Hong Kong) Private Limited for distribution of research report in Hong Kong. This report is intended for distribution only to “Professional Investors” as defined in Part I of Schedule 1 to SFO. Any
investment or investment activity to which this document relates is only available to professional investor and will be engaged only with professional investors.” Nothing here is an offer or solicitation of these securities,
products and services in any jurisdiction where their offer or sale is not qualified or exempt from registration. The Indian Analyst(s) who compile this report is/are not located in Hong Kong & are not conducting Research
Analysis in Hong Kong.
For U.S.
Motilal Oswal Securities Limited (MOSL) is not a registered broker - dealer under the U.S. Securities Exchange Act of 1934, as amended (the"1934 act") and under applicable state laws in the United States. In addition MOSL is
not a registered investment adviser under the U.S. Investment Advisers Act of 1940, as amended (the "Advisers Act" and together with the 1934 Act, the "Acts), and under applicable state laws in the United States.
Accordingly, in the absence of specific exemption under the Acts, any brokerage and investment services provided by MOSL, including the products and services described herein are not available to or intended for U.S.
persons. This report is intended for distribution only to "Major Institutional Investors" as defined by Rule 15a-6(b)(4) of the Exchange Act and interpretations thereof by SEC (henceforth referred to as "major institutional
investors"). This document must not be acted on or relied on by persons who are not major institutional investors. Any investment or investment activity to which this document relates is only available to major institutional
investors and will be engaged in only with major institutional investors. In reliance on the exemption from registration provided by Rule 15a-6 of the U.S. Securities Exchange Act of 1934, as amended (the "Exchange Act") and
interpretations thereof by the U.S. Securities and Exchange Commission ("SEC") in order to conduct business with Institutional Investors based in the U.S., MOSL has entered into a chaperoning agreement with a U.S.
registered broker-dealer, Motilal Oswal Securities International Private Limited. ("MOSIPL"). Any business interaction pursuant to this report will have to be executed within the provisions of this chaperoning agreement.
The Research Analysts contributing to the report may not be registered /qualified as research analyst with FINRA. Such research analyst may not be associated persons of the U.S. registered broker-dealer, MOSIPL, and
therefore, may not be subject to NASD rule 2711 and NYSE Rule 472 restrictions on communication with a subject company, public appearances and trading securities held by a research analyst account.
For Singapore
Motilal Oswal Capital Markets Singapore Pte Limited is acting as an exempt financial advisor under section 23(1)(f) of the Financial Advisers Act(FAA) read with regulation 17(1)(d) of the Financial Advisors Regulations and is a
subsidiary of Motilal Oswal Securities Limited in India. This research is distributed in Singapore by Motilal Oswal Capital Markets Singapore Pte Limited and it is only directed in Singapore to accredited investors, as defined in
the Financial Advisers Regulations and the Securities and Futures Act (Chapter 289), as amended from time to time. In respect of any matter arising from or in connection with the research you could contact the following
representatives of Motilal Oswal Capital Markets Singapore Pte Limited:
Disclaimer:
The report and information contained herein is strictly confidential and meant solely for the selected recipient and may not be altered in any way, transmitted to, copied or distributed, in part or in whole, to any other person
or to the media or reproduced in any form, without prior written consent. This report and information herein is solely for informational purpose and may not be used or considered as an offer document or solicitation of
offer to buy or sell or subscribe for securities or other financial instruments. Nothing in this report constitutes investment, legal, accounting and tax advice or a representation that any investment or strategy is suitable or
appropriate to your specific circumstances. The securities discussed and opinions expressed in this report may not be suitable for all investors, who must make their own investment decisions, based on their own investment
objectives, financial positions and needs of specific recipient. This may not be taken in substitution for the exercise of independent judgment by any recipient. Each recipient of this document should make such investigations
as it deems necessary to arrive at an independent evaluation of an investment in the securities of companies referred to in this document (including the merits and risks involved), and should consult its own advisors to
determine the merits and risks of such an investment. The investment discussed or views expressed may not be suitable for all investors. Certain transactions -including those involving futures, options, another derivative
products as well as non-investment grade securities - involve substantial risk and are not suitable for all investors. No representation or warranty, express or implied, is made as to the accuracy, completeness or fairness of
the information and opinions contained in this document. The Disclosures of Interest Statement incorporated in this document is provided solely to enhance the transparency and should not be treated as endorsement of the
views expressed in the report. This information is subject to change without any prior notice. The Company reserves the right to make modifications and alternations to this statement as may be required from time to time
without any prior approval. MOSL, its associates, their directors and the employees may from time to time, effect or have effected an own account transaction in, or deal as principal or agent in or for the securities
mentioned in this document. They may perform or seek to perform investment banking or other services for, or solicit investment banking or other business from, any company referred to in this report. Each of these entities
functions as a separate, distinct and independent of each other. The recipient should take this into account before interpreting the document. This report has been prepared on the basis of information that is already
available in publicly accessible media or developed through analysis of MOSL. The views expressed are those of the analyst, and the Company may or may not subscribe to all the views expressed therein. This document is
being supplied to you solely for your information and may not be reproduced, redistributed or passed on, directly or indirectly, to any other person or published, copied, in whole or in part, for any purpose. This report is not
directed or intended for distribution to, or use by, any person or entity who is a citizen or resident of or located in any locality, state, country or other jurisdiction, where such distribution, publication, availability or use would
be contrary to law, regulation or which would subject MOSL to any registration or licensing requirement within such jurisdiction. The securities described herein may or may not be eligible for sale in all jurisdictions or to
certain category of investors. Persons in whose possession this document may come are required to inform themselves of and to observe such restriction. Neither the Firm, not its directors, employees, agents or
representatives shall be liable for any damages whether direct or indirect, incidental, special or consequential including lost revenue or lost profits that may arise from or in connection with the use of the information.
The
person accessing this information specifically agrees to exempt MOSL or any of its affiliates or employees from, any and all responsibility/liability arising from such misuse and agrees not to hold MOSL or any of its affiliates or
employees responsible for any such misuse and further agrees to hold MOSL or any of its affiliates or employees free and harmless from all losses, costs, damages, expenses that may be suffered by the person accessing this
information due to any errors and delays.
Registered Office Address: Motilal Oswal Tower, Rahimtullah Sayani Road, Opposite Parel ST Depot, Prabhadevi, Mumbai-400025; Tel No.: 022-3980 4263; www.motilaloswal.com. Correspondence Address: Palm Spring
Centre, 2nd Floor, Palm Court Complex, New Link Road, Malad (West), Mumbai- 400 064. Tel No: 022 3080 1000. Compliance Officer: Neeraj Agarwal, Email Id:
na@motilaloswal.com,
Contact No.:022-30801085.
Registration details of group entities.: MOSL: SEBI Registration: INZ000158836; CDSL: IN-DP-16-2015; NSDL: IN-DP-NSDL-152-2000; Research Analyst: INH000000412. AMFI: ARN 17397. Investment Adviser: INA000007100.
Motilal Oswal Asset Management Company Ltd. (MOAMC): PMS (Registration No.: INP000000670) offers PMS and Mutual Funds products. Motilal Oswal Wealth Management Ltd. (MOWML): PMS (Registration No.:
INP000004409) offers wealth management solutions. *Motilal Oswal Securities Ltd. is a distributor of Mutual Funds, PMS, Fixed Deposit, Bond, NCDs, Insurance and IPO products. * Motilal Oswal Commodities Broker Pvt. Ltd.
offers Commodities Products. * Motilal Oswal Real Estate Investment Advisors II Pvt. Ltd. offers Real Estate products. * Motilal Oswal Private Equity Investment Advisors Pvt. Ltd. offers Private Equity products
15 January 2018
6