Sector Update |
Update| Healthcare
Sector
17 January 2018
Healthcare
Performance of top
companies: Dec-17, %)
Company
IPM
Sun Pharma
Abbott India
Cipla
Zydus Cadila
Mankind
Alkem
Lupin
Torrent Pharma
Pfizer
Glenmark
Pharma
Sanofi
Dr Reddy Labs
GSK Pharma
Alembic Pharma
Ipca Labs
Natco
Ajanta Pharma
Merck
Biocon
MAT gr Dec-17
5.5
7.8
7.6
8.1
7.4
7.1
3.2
10.2
9.5
8.6
5.4
19.9
3.7
12.4
7.9
12.7
5.9
1.6
(3.5)
(0.6)
9.3
9.2
3.9
7.6
(1.7)
(4.4)
(7.4)
9.1
5.0
10.6
10.5
8.6
7.0
9.3
(2.0)
(4.3)
14.8
8.5
(0.3)
11.4
IPM – growth picks up on higher volumes
Indian pharmaceutical market's (IPM) secondary sales continued to grow at a
healthy rate in December, led by strong volume growth, while price growth
continued its downtrend during the month. IPM grew by 7.8% YoY in December
2017 and 7.2% YoY in 3QFY18.
After declining trend in YoY quarterly growth till 2QFY18, industry volumes grew
by 5.9% in 3QFY18. Growth in new products was 2.8% in 3QFY18, as compared
to 2.7% in 2QFY18. After declining 2.1% in 2QFY18, prices further reduced YoY in
3QFY18 as well (-1.5%).
Moving annual total (MAT) growth for December was 5.5% as against 5.6% YoY
in November.
Natco’s secondary sales (+24.5%) posted robust growth for 3QFY18 YoY,
followed by Mankind (+14.1%) and Alkem (+13.1%). More than 65% of the
companies posted improvement in YoY growth in 3QFY18 compared to previous
three quarters.
Exceptionally, IPCA’ secondary sales continued to decline (-7.1%) in 3QFY18 YoY,
followed by Pfizer, which declined 3.4% during the quarter.
Ophthal & Vaccines (1.9% each of IPM) posted robust growth of 13.2% YoY in
3QFY18, followed by Respiratory (+12.3%; 7.5% of IPM) and Derma (+11.5%;
6.4% of IPM). Although all therapies reported growth in December, ~40% of
them underperformed the IPMs.
In value terms, secondary sales of DPCO-listed products increased by 3% YoY
and non-DPCO products by 8.7% YoY.
FDC-banned drugs (~2.4% of IPM) grew 4% in December, while non-banned
drugs grew by 8.7% YoY. Secondary sales for Indian companies increased 8.2%
YoY, while those of MNC companies grew by 6.3% YoY.
Natco, Mankind and Alkem witness highest YoY growth for the quarter
Ophthal & Vaccine, Respiratory and Derma lead among therapies
DPCO v/s non-DPCO market (December-17)
FDC ban impact (December-17)
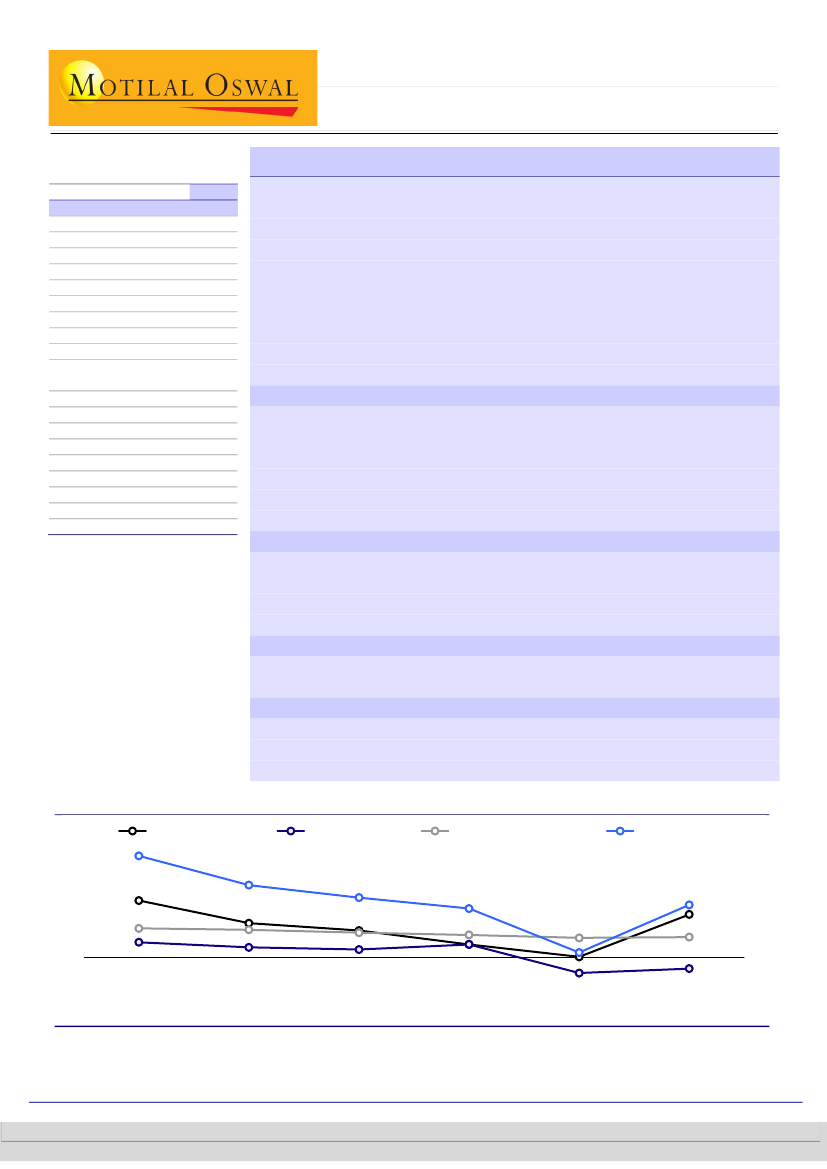
Exhibit 1: Volume-led high industry growth
13.9
Volume Growth (%)
9.9
7.8
4
2.1
4.7
3.8
1.4
Price Growth (%)
New Product Growth (%)
Total Growth (%)
8.2
3.7
3.4
1.1
6.7
3.1
1.8
1.8
1QFY18
0.7
0.1
-2.1
2QFY18
2.7
7.2
5.9
2.8
-1.5
3QFY18
Source: AIOCD, MOSL
2QFY17
3QFY17
4QFY17
Kumar Saurabh – Research analyst
(Kumar.Saurabh@MotilalOswal.com); +91 22 6129 1519
Ankeet Pandya – Research analyst
(Ankeet.Pandya@MotilalOswal.com)
18 August 2017
Investors are advised to refer through important disclosures made at the last page of the Research Report.
Motilal Oswal research is available on www.motilaloswal.com/Institutional-Equities, Bloomberg, Thomson Reuters, Factset and S&P Capital.
1

Sector Update| Healthcare
Indian Pharma Market - December 2017
Exhibit 2: Performance of top companies: December 2017
Company
MAT Dec -17
Value
Market Growth
(INR m)
Share (%)
(%)
1,163,899
100.0
5.5
99,131
72,541
53,822
49,380
42,228
40,095
38,866
37,098
27,462
27,994
26,411
25,918
35,430
14,649
15,549
10,189
7,373
6,772
3,963
8.5
6.2
4.6
4.2
3.6
3.4
3.3
3.2
2.4
2.4
2.3
2.2
3.0
1.3
1.3
0.9
0.6
0.6
0.3
7.6
7.4
3.2
9.5
5.4
3.7
7.9
5.9
(3.5)
9.3
9.2
3.9
7.6
(1.7)
(4.4)
(7.4)
9.1
5.0
10.6
Last 8 Quarters in Growth (%)
Mar-16
14.4
13.5
5.9
8.2
10.1
21.6
11.1
17.3
53.5
(2.3)
16.3
(6.1)
21.0
3.9
15.5
22.7
48.1
(4.8)
9.8
(29.2)
Jun-16
9.8
4.0
8.3
5.6
6.1
16.0
15.5
7.9
44.3
(1.5)
6.0
0.3
(1.2)
(4.8)
10.4
13.4
20.4
13.2
9.5
(19.2)
Sep-16
14.6
14.8
10.0
14.7
11.4
16.9
25.1
14.5
60.3
4.3
14.1
14.1
15.0
1.2
19.7
20.6
2.0
12.8
4.7
7.4
Dec-16
10.0
13.9
13.4
5.5
13.9
1.7
10.4
14.6
60.8
1.4
11.3
14.7
2.9
(6.0)
5.1
9.2
6.1
11.5
8.3
12.5
1M
Mar-17 Jun-17 Sep-17 Dec-17 Dec-17
8.1
8.9
8.9
3.3
15.6
3.3
7.2
8.1
11.0
(1.3)
15.4
11.6
2.4
6.2
2.6
9.6
(29.4)
13.8
5.9
5.8
6.7
7.0
6.5
1.6
11.3
6.3
(1.3)
12.8
6.7
(2.9)
9.5
15.3
7.9
8.0
1.8
2.5
(9.0)
6.5
9.8
17.8
0.7
1.5
6.4
(1.1)
4.3
(1.2)
(2.9)
2.6
2.0
(6.1)
5.4
4.7
(0.2)
4.9
(10.6)
(16.9)
(4.8)
6.3
4.5
9.7
7.2
6.8
8.0
9.0
7.7
14.1
13.1
8.8
4.6
(3.4)
7.7
6.3
5.9
11.2
0.9
(7.1)
24.5
10.1
0.2
9.2
7.8
8.1
7.1
10.2
8.6
19.9
12.4
12.7
1.6
(0.6)
10.5
8.6
7.0
9.3
(2.0)
(4.3)
14.8
8.5
(0.3)
11.4
IPM
Sun Pharma
Abbott India
Cipla
Zydus Cadila
Mankind
Alkem
Lupin
Torrent Pharma
Pfizer
Glenmark Pharma
Sanofi
Dr Reddy Labs
GSK Pharma
Alembic Pharma
Ipca Labs
Natco
Ajanta Pharma
Merck
Biocon
Exhibit 3: Performance of top therapies: December 2017
Therapy
MAT Dec -17
Last 8 Quarters in Growth (%)
1M
Value
Market Growth
Mar-16 Jun-16 Sep-16 Dec-16 Mar-17 Jun-17 Sep-17 Dec-17 Dec-17
(INR m) Share (%) (%)
1,163,899
100.0
5.5
14.4
9.8
14.6
10.0
8.1
6.7
0.7
7.2
7.8
160,217
143,086
136,044
101,199
106,391
86,955
79,228
74,129
71,239
59,139
24,056
22,328
21,999
20,269
13.8
12.3
11.7
8.7
9.1
7.5
6.8
6.4
6.1
5.1
2.1
1.9
1.9
1.7
(2.6)
6.7
6.8
4.2
14.0
3.2
4.1
12.3
5.7
5.8
4.1
18.2
7.8
6.8
11.6
13.4
15.0
12.4
18.0
8.5
13.1
18.4
18.6
14.1
45.0
(1.3)
18.5
17.5
7.5
9.5
9.5
10.2
16.6
3.4
8.6
12.4
12.5
9.6
9.3
2.7
13.3
9.0
18.9
11.6
13.7
11.8
18.1
27.2
15.9
13.0
13.0
9.5
(3.2)
9.6
7.4
11.4
0.9
14.3
9.2
11.2
21.3
4.4
9.6
13.5
11.6
11.7
15.5
12.5
7.4
9.9
(4.0)
10.1
10.2
7.9
19.8
2.6
8.1
16.0
6.6
11.5
7.1
25.4
5.6
5.4
(1.1)
8.1
7.3
3.7
17.2
3.5
5.6
11.0
5.2
7.6
5.9
28.7
6.6
9.8
(9.3)
4.8
1.9
0.1
11.2
(5.8)
(2.2)
11.1
3.4
0.8
1.4
8.7
5.8
4.9
5.2
4.3
8.6
6.1
9.0
12.3
6.0
11.5
7.4
3.9
2.4
13.2
13.2
7.4
8.2
4.4
7.6
6.5
10.4
14.9
6.0
9.6
8.4
3.6
(0.2)
10.8
15.0
8.1
IPM
Anti-Infectives
Cardiac
Gastro Intestinal
Vitamins / Minerals / Nutrients
Anti Diabetic
Respiratory
Pain / Analgesics
Derma
Neuro / Cns
Gynaecological
Anti-Neoplastics
Vaccines
Ophthal
Hormones
Source: AIOCD, MOSL
17 January 2018
2

Sector Update| Healthcare
Sun Pharma + Ranbaxy
Exhibit 4: Top 10 drugs
MAT Dec 17
Drug
Therapy
Growth (%)
Mkt
Value Growth
Last 3M Dec-17
Share
(INR m) (%)
(%)
Sun Pharma Laboratories
99,131
5.9
100.0
6.8
8.1
Volini
Pain / Analgesics
2,363
(3.4)
2.4
2.3
1.9
Istamet
Anti Diabetic
2,253
13.8
2.3
2.9
10.1
Rosuvas
Cardiac
2,198
9.6
2.2
(1.5)
(4.2)
Levipil
Neuro / Cns
1,997
18.6
2.0
30.1
37.5
Gemer
Anti Diabetic
1,965
5.6
2.0
(6.6)
(2.3)
Susten
Gynaecological
1,630
5.2
1.6
11.6
11.7
Pantocid
Gastro Intestinal
1,488
3.9
1.5
16.9
13.0
Pantocid Dsr
Gastro Intestinal
1,359
8.6
1.4
13.3
14.0
Revital H
Vitamins / Minerals / Nutrients 1,131 (16.6)
1.1
(13.8) (17.6)
Storvas
Cardiac
1,092
(4.5)
1.1
(1.4)
(12.2)
*3M: Oct-Dec 2017
Source: AIOCD, MOSL
Sun Pharma’s domestic
business increased 8.1%
YoY in December 2017
Exhibit 5: Therapy mix (%)
Share
Total
Cardiac
Neuro / Cns
Gastro Intestinal
Anti-Infectives
Anti Diabetic
Pain / Analgesics
*3M: Oct-Dec2017
100.0
18.7
17.6
11.9
9.9
9.4
6.7
MAT Gr.(%)
5.9
5.7
7.9
6.4
(3.9)
7.5
(0.7)
3M*
6.8
0.1
10.6
9.7
1.5
0.1
1.6
Dec 17 Gr (%)
8.1
0.7
14.6
9.8
(1.0)
2.7
1.3
Source: AIOCD, MOSL
Sun’s largest portfolio, its
Cardiac segment, which
declined in November 2017,
saw a marginal growth of
0.7% in December 2017
Exhibit 6: Brand-wise growth distribution
% of sales
Total
Top 10 Brands
11 to 25 Brands
26 to 50 Brands
Above 50 Brands
100.0
26.6
16.6
15.4
41.4
MAT Gr. (%)
6.0
7.5
6.6
11.7
2.7
Growth Contribution (%)
100.0
33.3
18.3
28.6
19.7
Source: AIOCD, MOSL
Chronic portfolio grew
faster at 6.8% YoY on
MAT basis
Exhibit 7: Acute v/s Chronic (MAT growth)
MATVALUE_DEC_16
MATVALUE_GR_DEC_17
6.8
Exhibit 8: Growth distribution (%) (MAT Dec-17)
5.2
5.0
(0.9)
1.9
NP GR
50.4
43.2
CHRONIC
Source: AIOCD, MOSL
Vol GR
Price GR
ACUTE
Source: AIOCD, MOSL
17 January 2018
3

Sector Update| Healthcare
Cipla
Exhibit 9: Top 10 drugs
Drug
Therapy
Value
(INR m)
53,822
Respiratory
Respiratory
Respiratory
Respiratory
Respiratory
Respiratory
Respiratory
Anti-Infectives
Cardiac
Urology
2,535
2,056
1,583
1,562
1,474
1,105
1,072
906
885
844
MAT Dec 17
Growth
(%)
3.2
17.5
33.7
(2.1)
8.7
3.8
14.3
5.4
1.5
8.6
13.8
Growth (%)
Mkt
Sh. (%)
100.0
4.7
3.8
2.9
2.9
2.7
2.1
2.0
1.7
1.6
1.6
Last 3M
9.0
23.2
32.2
40.2
5.8
15.3
22.2
4.5
34.0
3.1
Dec-17
10.2
25.1
26.6
53.2
9.0
16.5
27.6
(2.1)
32.8
0.6
Cipla’s secondary sales
increased by 10.2% YoY in
December 2017
Total
Foracort
Duolin
Budecort
Seroflo
Asthalin
Montair Lc
Aerocort
Azee
Dytor
Urimax D
5.9
2.3
Source: AIOCD, MOSL
Dec 17 Gr.
10.2
19.8
6.2
3.1
6.1
9.0
(9.5)
Source: AIOCD, MOSL
Exhibit 10: Therapy mix (%)
Total
Respiratory
Anti-Infectives
Cardiac
Gastro Intestinal
Urology
Neuro / Cns
Share
100.0
33.0
23.5
12.3
7.6
5.2
3.6
MAT Gr. (%)
3.2
9.0
(4.1)
4.6
3.2
10.4
(0.4)
3M*
9.0
17.3
6.7
2.6
10.5
6.1
(6.9)
Respiratory segment posted
highest growth of 19.8%
YoY December 2017
Exhibit 11: Brand-wise growth distribution
Total
Top 10 Brands
11 to 25 Brands
26 to 50 Brands
Above 50 Brands
% of sales
100.0
26.1
16.5
15.3
42.2
MAT gr. (%)
3.2
11.3
6.7
1.7
(2.0)
Gr. Contribution (%)
100.0
85.7
33.4
8.3
(27.4)
Source: AIOCD, MOSL
Exhibit 12: Acute v/s Chronic (MAT growth)
MATVALUE_DEC_16
MATVALUE_GR_DEC_17
7.1
Exhibit 13: Growth distribution (%) (MAT Dec 17)
4.4
1.3
30.3
0.3
ACUTE
21.9
-2.5
CHRONIC
Source: AIOCD, MOSL
Vol GR
Price GR
NP GR
Source: AIOCD, MOSL
17 January 2018
4

Sector Update| Healthcare
Cadila Healthcare
Exhibit 14: Top 10 drugs
MAT Dec 17
Growth (%)
Mkt
Share (%)
100.0
4.1
2.4
2.3
2.2
2.1
1.7
1.6
1.6
1.5
1.4
Last 3M
7.7
15.0
20.9
7.9
(7.3)
(7.0)
(14.4)
24.0
N/A
16.2
Dec-17
8.6
5.9
23.1
12.6
(10.2)
(8.0)
(2.9)
35.7
N/A
9.0
Zydus’ secondary sales grew
8.6% YoY in December 2017
Drug
Zydus + Biochem
Skinlite
Deriphyllin
Mifegest Kit
Pantodac
Atorva
Zyrop
Amicin
Deca Durabolin
Thrombophob
Formonide
Therapy
Value
(INR m)
49,380
2,012
1,198
1,122
1,111
1,057
816
777
777
750
716
Growth
(%)
9.5
7.6
6.0
0.4
(0.6)
(10.9)
7.3
36.7
0.0
18.6
9.9
Derma
Respiratory
Gynecological
Gastro Intestinal
Cardiac
Blood Related
Anti-Infectives
Hormones
Pain / Analgesics
Respiratory
16.4
14.9
Source: AIOCD, MOSL
Dec 17 Gr (%)
8.6
23.8
(2.1)
1.3
14.7
(5.4)
12.6
Source: AIOCD, MOSL
Exhibit 15: Therapy mix (%)
Zydus’ largest therapy, Anti-
Infectives saw significant
growth of 23.8% YoY,
followed by Respiratory
(+14.7%) and Gynecological
(+12.6%) in December 2017
Total
Anti-Infectives
Cardiac
Gastro Intestinal
Respiratory
Pain / Analgesics
Gynaecological
Share
100.0
15.1
13.8
11.2
10.1
9.5
8.3
MAT Gr. (%)
9.5
7.4
2.3
5.8
8.1
13.8
(1.7)
3M*
7.7
9.4
0.4
4.9
14.4
2.5
6.6
Volume growth of 7% and
new product growth of 4.9%
offset decline in price
growth
Exhibit 16: Brand-wise growth distribution
Total
Top 10 Brands
11 to 25 Brands
26 to 50 Brands
Above 50 Brands
% of sales
100.0
20.9
17.3
16.1
45.7
MAT growth (%)
9.5
14.4
5.6
22.9
4.8
Gr. Contribution (%)
100.0
30.5
10.6
34.6
24.3
Source: AIOCD, MOSL
Exhibit 17: Acute v/s Chronic (MAT growth)
MATVALUE_DEC_16
10.8
MATVALUE_GR_DEC_17
Exhibit 18: Growth distribution (%) (MAT Dec-17)
7.0
6.8
30.4
14.7
ACUTE
CHRONIC
Source: AIOCD, MOSL
Vol GR
-2.4
Price GR
4.9
NP GR
Source: AIOCD, MOSL
17 January 2018
5

Sector Update| Healthcare
Alkem
Exhibit 19: Top 10 drugs
Alkem’s secondary sales
continued to post double
digit growth (+12.4% YoY) in
December 2017
MAT Dec 17
Drug
Total
Clavam
Pan
Pan D
Taxim O
Taxim
A To Z Ns
Xone
Gemcal
Ondem
Sumo
Therapy
Value
(INR m)
40,095
2,939
2,565
2,299
1,922
1,279
1,179
1,020
958
913
838
Growth
(%)
3.7
7.8
5.9
15.9
(5.9)
(14.3)
17.2
(4.7)
(4.9)
1.1
(15.1)
Mkt
Sh. (%)
100.0
7.3
6.4
5.7
4.8
3.2
2.9
2.5
2.4
2.3
2.1
Growth (%)
Dec-17
3M
13.1
12.4
22.0
20.1
3.7
(1.6)
13.9
14.7
14.5
10.4
1.1
(6.1)
11.4
3.3
11.5
6.6
(6.7)
(9.2)
14.5
1.3
(14.6)
(11.8)
Source: AIOCD, MOSL
Dec 17 Gr (%)
12.4
13.1
8.9
9.5
5.8
27.8
24.9
Source: AIOCD, MOSL
Gr. Contribution (%)
100.0
19.0
22.9
21.7
36.3
Source: AIOCD, MOSL
Last
Anti-Infectives
Gastro Intestinal
Gastro Intestinal
Anti-Infectives
Anti-Infectives
Vitamins / Minerals / Nutrients
Anti-Infectives
Vitamins / Minerals / Nutrients
Gastro Intestinal
Pain / Analgesics
Therapy mix (%)
Neuro / CNS (+27.8%) saw
the highest growth amongst
the therapies of Alkem,
followed by Anti-Diabetic
(+24.9%)
Total
Anti-Infectives
Gastro Intestinal
Vitamins / Minerals / Nutrients
Pain / Analgesics
Neuro / Cns
Anti Diabetic
Share
100.0
39.4
18.7
13.6
7.3
5.0
3.3
MAT Gr. (%)
3.7
(2.3)
10.1
8.7
(1.9)
16.6
35.6
3M*
13.1
12.5
12.0
14.3
0.7
30.0
31.3
Exhibit 20: Brand-wise growth distribution
Total
Top 10 Brands
11 to 25 Brands
26 to 50 Brands
Above 50 Brands
% of sales
100.0
39.7
17.7
12.1
30.5
MAT growth (%)
3.7
1.7
4.8
6.8
4.4
Exhibit 21: Acute v/s Chronic (MAT growth)
MATVALUE_DEC_16
34.6
MATVALUE_GR_DEC_17
17.4
Exhibit 22: Growth distribution (%) (MAT Dec 17)
3.1
-2.0
Vol GR
Price GR
2.7
NP GR
2.1
ACUTE
4.1
CHRONIC
Source: AIOCD, MOSL
Source: AIOCD, MOSL
17 January 2018
6

Sector Update| Healthcare
Lupin
Exhibit 23: Top 10 drugs
Drug
Therapy
Value
(INR m)
38,866
1,937
1,063
886
672
536
535
520
502
501
443
MAT Dec 17
Gr.
(%)
7.9
11.7
8.3
(8.3)
10.4
4.7
1.7
30.5
80.4
4.5
1159.2
Gr. (%)
Mkt
Sh. (%)
100.0
5.0
2.7
2.3
1.7
1.4
1.4
1.3
1.3
1.3
1.1
Last 3M
8.8
5.9
6.4
(9.7)
12.2
6.8
(5.5)
25.3
55.6
(1.5)
317.2
Dec-17
12.7
13.2
10.6
(4.7)
10.3
3.6
(13.7)
32.0
59.8
(0.7)
281.9
Lupin continued to post
double-digit growth
(+12.7% YoY) in December
2017
Lupin Ltd
Gluconorm-G
Budamate
Tonact
Rablet-D
Esiflo
Rablet
Ivabrad
Ondero
Telekast-L
Gibtulio
Anti Diabetic
Respiratory
Cardiac
Gastro Intestinal
Respiratory
Gastro Intestinal
Cardiac
Anti Diabetic
Respiratory
Anti Diabetic
Source: AIOCD, MOSL
Exhibit 24: Therapy mix (%)
Most of the therapies that
posted low single-
digit/decline in growth,
posted strong double-digit
growth in December 2017
Total
Cardiac
Anti-Infectives
Anti Diabetic
Respiratory
Gastro Intestinal
Vitamins / Minerals / Nutrients
Share
100.0
24.2
17.2
15.4
13.1
8.1
4.8
MAT Gr. (%)
7.9
6.5
(6.2)
32.3
10.9
8.8
2.5
3M*
8.8
5.7
2.6
25.9
12.7
8.2
5.2
Dec 17 Gr. (%)
12.7
9.4
8.6
29.4
18.2
10.2
8.7
Source: AIOCD, MOSL
Exhibit 25: Brand-wise growth distribution
Total
Top 10 Brands
11 to 25 Brands
26 to 50 Brands
Above 50 Brands
% of sales
100.0
19.5
15.0
15.9
49.5
MAT Gr. (%)
7.9
16.5
5.9
(1.9)
8.9
Gr. Contribution (%)
100.0
37.8
11.3
(4.2)
55.1
Source: AIOCD, MOSL
Lupin witnessed 4.7% new
product growth
Exhibit 26: Acute v/s Chronic (MAT growth)
MATVALUE_DEC_16
18.3
MATVALUE_GR_DEC_17
13.4
Exhibit 27: Growth distribution (%) (MAT Dec 17)
4.7
17.7
2.5
0.7
2.5
ACUTE
CHRONIC
Source: AIOCD, MOSL
Vol GR
Price GR
NP GR
Source: AIOCD, MOSL
17 January 2018
7

Sector Update| Healthcare
GSK Pharma
Exhibit 28: Top 10 drugs
After growing marginally
(0.7%) in November 2017,
GSK secondary sales posted
robust growth of 9.3% YoY
in December 2017
Drug
Total
Augmentin
Synflorix
Calpol
Zinetac
Betnovate C
Betnovate N
Eltroxin
Ceftum
Betnesol
Rotarix
Anti-Infectives
Vaccines
Pain / Analgesics
Gastro Intestinal
Derma
Derma
Hormones
Anti-Infectives
Hormones
Vaccines
Therapy
Value
(INR m)
35,430
3,343
2,811
1,877
1,767
1,753
1,743
1,518
1,361
1,030
892
MAT Dec 17
Growth
(%)
7.6
16.1
29.3
(7.3)
7.4
20.9
26.7
6.3
4.9
1.1
(14.6)
Growth (%)
Mkt
Sh. (%)
100.0
9.4
7.9
5.3
5.0
4.9
4.9
4.3
3.8
2.9
2.5
Last 3M
11.2
23.4
26.9
(1.4)
14.7
9.9
25.9
(0.3)
4.1
11.2
Dec-17
9.3
21.2
9.9
10.8
9.8
6.0
16.1
(4.8)
8.2
4.6
GSK’s highest contributing
therapy, Anti-infectives,
grew 6.4% YoY in December
2017 (0.4% in November
2017); Derma, which
contributes 21%, grew
28.2% YoY in December
2017
(11.8)
(14.5)
Source: AIOCD, MOSL
Exhibit 29: Therapy mix (%)
Share
Total
Anti-Infectives
Derma
Vaccines
Pain / Analgesics
Vitamins / Minerals / Nutrients
Hormones
100.0
21.4
21.1
18.0
8.2
7.8
7.4
MAT Gr. (%)
7.6
4.1
35.0
7.4
(9.4)
8.2
4.5
3M*
11.2
7.4
40.0
11.3
(1.7)
(14.3)
5.8
Dec 17 Gr. (%)
9.3
6.4
28.2
9.0
4.6
(10.5)
0.0
Source: AIOCD, MOSL
Gr. Contribution (%)
100.0
70.7
50.3
(9.6)
(11.4)
Source: AIOCD, MOSL
GSK witnessed price decline
of 1.2% and volume growth
of 7.7%
Exhibit 30: Brand-wise growth distribution
Total
Top 10 Brands
11 to 25 Brands
26 to 50 Brands
Above 50 Brands
% of sales
100.0
51.1
21.0
15.4
12.5
MAT Growth (%)
7.6
10.8
20.3
(4.2)
(6.0)
Exhibit 31: Acute v/s Chronic (MAT growth)
MATVALUE_DEC_16
28.8
7.9
5.3
4.1
ACUTE
CHRONIC
Source: AIOCD, MOSL
MATVALUE_GR_DEC_17
Exhibit 32: Growth distribution (%) (MAT Dec 17)
7.7
-1.2
Vol GR
Price GR
1.0
NP GR
Source: AIOCD, MOSL
17 January 2018
8

Sector Update| Healthcare
Glenmark Pharma
Exhibit 33: Top 10 drugs
Glenmark’s secondary sales
saw healthy growth of
10.5% YoY in December
2017
Drug
Glenmark Pharmaceuticals
Telma
Telma H
Ascoril Plus
Candid
Telma Am
Candid-B
Ascoril Ls
Zitamet Plus
Canditral
Onabet
Cardiac
Cardiac
Respiratory
Derma
Cardiac
Derma
Respiratory
Anti Diabetic
Anti-Infectives
Derma
Therapy
MAT Dec 17
Value
Growth
Mkt
(INR m)
(%)
Sh. (%)
27,994
9.3
100.0
1,829
1,730
1,148
1,141
962
956
621
525
490
453
6.7
12.1
(1.4)
12.5
17.4
(2.5)
11.9
32.0
43.7
(1.7)
6.5
6.2
4.1
4.1
3.4
3.4
2.2
1.9
1.8
1.6
Growth (%)
Last 3M
7.7
10.3
3.8
(4.9)
6.2
18.8
0.1
26.0
16.5
48.0
Dec-17
10.5
7.5
8.0
(5.1)
1.7
26.2
0.4
23.2
13.1
43.1
(7.0)
5.8
Source: AIOCD, MOSL
Dec 17 Gr.
10.5
6.1
13.7
10.8
8.5
11.0
3.8
Source: AIOCD, MOSL
Gr. Contribution (%)
100.0
36.4
35.9
10.3
17.4
Source: AIOCD, MOSL
Exhibit 34: Therapy mix (%)
Total
Derma
Cardiac
Respiratory
Anti-Infectives
Anti Diabetic
Gastro Intestinal
Share
100.0
27.7
23.0
15.7
13.6
6.4
3.4
MAT Gr. (%)
9.3
5.6
12.8
9.0
11.0
2.8
20.9
3M*
7.7
3.7
11.9
10.0
5.4
9.7
(4.1)
New product growth and
volume growth are the key
growth drivers for
Glenmark
Exhibit 35: Brand-wise growth distribution
% of sales
Total
Top 10 Brands
11 to 25 Brands
26 to 50 Brands
Above 50 Brands
100.0
35.2
17.0
18.0
29.7
MAT Growth (%)
9.3
9.6
21.9
5.1
5.2
Exhibit 36: Acute v/s Chronic (MAT growth)
MATVALUE_DEC_16
16.5
MATVALUE_GR_DEC_17
9.5
Exhibit 37: Growth distribution (%) (MAT Dec 17)
9.1
9.2
ACUTE
CHRONIC
Source: AIOCD, MOSL
4.6
-0.7
Vol GR
Price GR
5.4
NP GR
Source: AIOCD, MOSL
17 January 2018
9

Sector Update| Healthcare
Dr Reddy’s Labs
Exhibit 38: Top 10 drugs
Dr Reddy’s Labs’ secondary
sales slowed down in
December 2017, growing
7% YoY (+9.5% in November
2017)
Drug
Total
Omez
Omez D
Econorm
Atarax
Razo D
Razo
Nise
Stamlo
Stamlo Beta
Ketorol
Gastro Intestinal
Gastro Intestinal
Gastro Intestinal
Respiratory
Gastro Intestinal
Gastro Intestinal
Pain / Analgesics
Cardiac
Cardiac
Pain / Analgesics
Therapy
Value
(INR m)
25,918
1,137
1,013
792
764
675
604
594
567
515
493
MAT Dec 17
Growth
(%)
3.9
(4.2)
(1.8)
16.1
32.8
16.7
13.1
(5.3)
(10.3)
5.1
13.8
Growth (%)
Mkt
Sh. (%)
100.0
4.4
3.9
3.1
2.9
2.6
2.3
2.3
2.2
2.0
1.9
Last 3M
5.9
12.7
(7.5)
60.8
33.4
20.6
15.5
7.0
(18.0)
3.3
Dec-17
7.0
17.2
6.1
58.2
34.0
12.9
19.2
(7.5)
(23.7)
3.3
27.2
45.7
Source: AIOCD, MOSL
Exhibit 39: Therapy mix (%)
Anti-Neoplastics declined
significantly by 40.6% YoY in
December 2017
Total
Gastro Intestinal
Cardiac
Respiratory
Anti-Neoplastics
Anti-Infectives
Anti Diabetic
Share
100.0
21.4
13.6
10.1
9.6
8.4
7.0
MAT Gr. (%)
3.9
6.7
2.9
15.4
(27.0)
15.8
11.3
3M*
5.9
13.8
0.8
20.3
(44.5)
38.9
9.4
Dec 17 Gr. (%)
7.0
17.2
(1.5)
24.3
(40.6)
34.4
4.2
Source: AIOCD, MOSL
Decline in price was offset
by volume and new product
growth
Exhibit 40: Brand-wise growth distribution
Total
Top 10 Brands
11 to 25 Brands
26 to 50 Brands
Above 50 Brands
% of sales
100.0
27.6
20.1
17.3
35.1
MAT Gr. (%)
3.9
5.7
0.6
12.3
0.7
Gr. Contribution (%)
100.0
39.6
3.3
50.6
6.5
Source: AIOCD, MOSL
Exhibit 41: Acute v/s Chronic (MAT growth)
MATVALUE_DEC_16
17.9
MATVALUE_GR_DEC_17
3.9
Exhibit 42: Growth distribution (%) (MAT Dec 17)
2.9
3.9
7.1
Vol GR
ACUTE
CHRONIC
Source: AIOCD, MOSL
Source: AIOCD, MOSL
10
-0.7
Price GR
1.7
NP GR
17 January 2018

Sector Update| Healthcare
Sanofi India
Exhibit 43: Top 10 drugs
Sanofi’s portfolio increased
by 8.6% YoY in December
2017
Drug
Sanofi India
Lantus
Combiflam
Hexaxim
Allegra
Amaryl M
Clexane
Avil
Vaxigrip
Enterogermina
Cardace
Anti Diabetic
Pain / Analgesics
Vaccines
Respiratory
Anti Diabetic
Cardiac
Respiratory
Vaccines
Gastro Intestinal
Cardiac
Therapy
Value
(INR m)
26,411
3,632
1,778
1,681
1,505
1,352
1,098
1,044
906
890
838
MAT Dec 17
Growth
(%)
9.2
18.5
(8.0)
488.2
17.0
29.0
6.0
7.4
25.5
(4.1)
(4.3)
Growth (%)
Mkt
Sh. (%)
100.0
13.8
6.7
6.4
5.7
5.1
4.2
4.0
3.4
3.4
3.2
Last 3M
6.3
3.3
(20.5)
67.9
20.2
4.6
0.3
21.8
16.1
9.9
Dec-17
8.6
25.3
(26.1)
43.3
12.6
(4.1)
(1.1)
52.8
18.3
14.2
2.5
4.5
Source: AIOCD, MOSL
Dec 17 Gr. (%)
8.6
15.9
1.3
13.9
26.6
(16.5)
(3.4)
Source: AIOCD, MOSL
Gr. Contribution (%)
100.0
115.4
(0.3)
17.5
(32.6)
Source: AIOCD, MOSL
Exhibit 44: Therapy mix (%)
Total
Anti Diabetic
Cardiac
Vaccines
Respiratory
Share
100.0
26.5
15.3
13.9
10.9
9.5
7.1
MAT Gr. (%)
9.2
17.3
(0.0)
24.7
13.1
(4.7)
2.5
3M*
6.3
6.2
2.2
11.7
20.3
(11.7)
4.2
Top 10 brands account for
more than 100% of growth
for Sanofi
Pain / Analgesics
Neuro / Cns
Exhibit 45: Brand-wise growth distribution
Total
Top 10 Brands
% of sales
100.0
55.8
23.7
14.0
6.5
MAT growth (%)
9.2
21.2
(0.1)
11.8
(29.9)
New product introductions
is the key driver for Sanofi
11 to 25 Brands
26 to 50 Brands
Above 50 Brands
Exhibit 46: Acute v/s Chronic (MAT growth)
MATVALUE_DEC_16
12.3
9.4
MATVALUE_GR_DEC_17
Exhibit 47: Growth distribution (%) (MAT Dec 17)
11.8
9.0
1.3
Vol GR
ACUTE
CHRONIC
Source: AIOCD, MOSL
0.0
Price GR
7.9
NP GR
Source: AIOCD, MOSL
11
17 January 2018

Sector Update| Healthcare
Torrent Pharma
Exhibit 48: Top 10 drugs
.
Torrent Pharma’s secondary
sales growth slowed down
(+1.6% YoY) in December
2017, after growing 8.4% in
November 2017
Drug
Torrent Pharma.
Shelcal
Chymoral Forte
Losar H
Nikoran
Azulix-Mf
Nebicard
Nexpro Rd
Dilzem
Losar
Ampoxin
Vitamins / Minerals / Nutrients
Pain / Analgesics
Cardiac
Cardiac
Anti Diabetic
Cardiac
Gastro Intestinal
Cardiac
Cardiac
Anti-Infectives
Therapy
MAT Dec 17
Value Growth
Mkt
(INR m)
(%)
Sh. (%)
37,098
1,889
1,169
1,002
937
872
813
786
761
726
615
5.9
6.2
19.5
1.9
(5.6)
18.6
20.6
18.8
3.0
4.6
(15.6)
100.0
5.1
3.2
2.7
2.5
2.4
2.2
2.1
2.1
2.0
1.7
Growth (%)
Last
Dec-17
3M
4.6
5.8
20.2
(5.6)
(9.8)
(0.9)
3.3
16.3
1.2
(8.1)
1.6
8.9
14.8
(8.6)
(12.0)
0.7
2.0
17.4
2.4
(15.0)
(34.6)
(44.8)
Source: AIOCD, MOSL
Dec 17 Gr. (%)
1.6
(3.4)
6.2
9.3
11.3
9.8
8.6
Source: AIOCD, MOSL
Gr. Contribution (%)
100.0
29.4
10.2
20.7
39.7
Source: AIOCD, MOSL
Exhibit 49: Therapy mix (%)
Share
Total
Cardiac
Neuro / Cns
Gastro Intestinal
Vitamins / Minerals / Nutrients
Anti Diabetic
Pain / Analgesics
100.0
32.3
16.5
14.5
11.0
7.2
6.3
MAT Gr. (%)
5.9
3.0
10.9
8.2
7.8
23.6
10.9
3M*
4.6
(0.7)
10.7
9.2
10.7
11.5
14.0
Vitamins / Minerals /
Nutrients therapeutic
products posted highest
growth of 11.3% YoY in
December 2017
Exhibit 50: Brand-wise growth distribution
% of sales
Total
100.0
25.8
16.3
14.4
43.5
Top 10 Brands
11 to 25 Brands
26 to 50 Brands
Above 50 Brands
MAT Gr. (%)
5.9
6.7
3.6
8.7
5.3
Volume growth declined to
1.6% in December 2017
from 3.8% in November
2017
Exhibit 51: Acute v/s Chronic (MAT growth)
MATVALUE_DEC_16
MATVALUE_GR_DEC_17
7.1
4.5
19.0
16.0
ACUTE
CHRONIC
Source: AIOCD, MOSL
Exhibit 52: Growth distribution (%) (MAT Dec 17)
2.8
1.6
1.5
Vol GR
Price GR
NP GR
Source: AIOCD, MOSL
12
17 January 2018

Sector Update| Healthcare
Alembic Pharma
Exhibit 53: Top 10 drugs
After posting 3.9% growth
in the previous month,
Alembic’s secondary sales
declined 2% YoY in
December 2017
Drug
Total
Azithral
Althrocin
Wikoryl
Gestofit
Roxid
Rekool D
Ulgel
Richar
Glisen Mf
Tellzy Ch
Anti-Infectives
Anti-Infectives
Respiratory
Gynaecological
Anti-Infectives
Gastro Intestinal
Gastro Intestinal
Gynaecological
Anti Diabetic
Cardiac
Therapy
MAT Dec 17
Value
Growth
(INR m)
(%)
14,649
(1.7)
1,490
761
586
526
494
317
283
262
233
217
(1.4)
(1.9)
2.0
(15.0)
(6.0)
(10.6)
(3.9)
(15.3)
(12.3)
3.0
Growth (%)
Mkt
Sh. (%)
100.0
10.2
5.2
4.0
3.6
3.4
2.2
1.9
1.8
1.6
1.5
Last 3M
0.9
9.3
4.9
7.2
(16.1)
6.2
(9.4)
3.4
(13.5)
(18.6)
Dec-17
(2.0)
0.4
(5.9)
5.7
(15.0)
4.5
(10.3)
3.8
(7.5)
(19.8)
(15.1)
(29.0)
Source: AIOCD, MOSL
3M*
0.9
9.0
(5.2)
2.8
(3.6)
(2.2)
(0.7)
Dec 17 Gr. (%)
(2.0)
2.4
(10.3)
1.0
(8.8)
2.7
(0.5)
Source: AIOCD, MOSL
Gr. Contribution (%)
100.0
105.6
4.2
(49.4)
39.6
Source: AIOCD, MOSL
Exhibit 54: Therapy mix (%)
Total
Share
100.0
22.3
14.8
12.7
12.5
11.4
7.7
MAT Gr (%)
(1.7)
(2.6)
2.7
(3.3)
(5.8)
(2.9)
(5.2)
Alembic’s largest portfolio,
Anti-Infectives posted
growth of 2.4% YoY in
December 2017 after 13.8%
in November 2017; its
second-largest portfolio,
Cardiac declined 10.3% in
December 2017 after 2.8%
decline in November 2017
Anti-Infectives
Cardiac
Respiratory
Gastro Intestinal
Gynaecological
Vitamins / Minerals / Nutrients
Exhibit 55: Brand-wise growth distribution
Total
Top 10 Brands
11 to 25 Brands
26 to 50 Brands
Above 50 Brands
% of sales
100.0
35.3
18.7
18.2
27.8
MAT growth (%)
(1.7)
(5.0)
(0.4)
5.0
(2.4)
Exhibit 56: Acute v/s Chronic (MAT growth)
MATVALUE_DEC_16
MATVALUE_GR_DEC_17
1.9
Exhibit 57: Growth distribution (%) (MAT Dec 17)
2.5
2.6
-6.8
(2.8)
11.5
ACUTE
3.4
CHRONIC
Source: AIOCD, MOSL
Vol GR
Price GR
NP GR
Source: AIOCD, MOSL
17 January 2018
13

Sector Update| Healthcare
IPCA Labs
Exhibit 58: Top 10 drugs
Drug
Therapy
MAT Dec 17
Value
Growth
(INR m)
(%)
15,549
(4.4)
1,222
959
844
509
447
445
371
355
326
321
5.5
2.1
8.3
(18.7)
11.4
(3.5)
(38.3)
17.3
(28.6)
6.6
Growth (%)
Mkt
Sh. (%)
100.0
7.9
6.2
5.4
3.3
2.9
2.9
2.4
2.3
2.1
2.1
Last 3M
(7.1)
3.1
8.9
(0.4)
(24.5)
20.7
(17.4)
(29.1)
1.5
(7.9)
Dec-17
(4.3)
3.3
19.5
(1.8)
(22.4)
22.3
(23.4)
(19.7)
1.3
1.9
Ipca’s secondary sales
declined 4.3% YoY in
December 2017
Ipca Laboratories
Zerodol Sp
Zerodol P
Hcqs
Larinate
Folitrax
Glycinorm M
Rapither-Ab
Zerodol Th
Lariago
Ctd
Pain / Analgesics
Pain / Analgesics
Anti Malarials
Anti Malarials
Anti-Neoplastics
Anti Diabetic
Anti Malarials
Pain / Analgesics
Anti Malarials
Cardiac
9.8
10.1
Source: AIOCD, MOSL
Dec 17 Gr. (%)
(4.3)
4.4
(8.8)
(9.3)
(6.7)
(2.0)
(18.5)
Source: AIOCD, MOSL
Gr. Contribution (%)
100.0
32.2
29.1
13.7
25.0
Source: AIOCD, MOSL
Exhibit 59: Therapy mix (%)
IPCA’s largest portfolio,
Pain-Analgesics (27% share)
posted growth of 4.4%;
other therapies continued
to decline during the month
Total
Pain / Analgesics
Cardiac
Anti Malarials
Gastro Intestinal
Anti-Infectives
Anti Diabetic
Share
100.0
27.4
16.7
16.4
7.6
6.0
5.2
MAT Gr. (%)
(4.4)
2.3
(4.7)
(19.6)
(4.5)
(4.2)
(3.8)
3M*
(7.1)
1.3
(9.5)
(17.4)
(6.6)
(9.8)
(14.7)
Volume and price both
declined in December 2017,
while new product growth
was flat
Exhibit 60: Brand-wise growth distribution
Total
Top 10 Brands
11 to 25 Brands
26 to 50 Brands
Above 50 Brands
% of sales
100.0
37.3
22.1
17.9
22.7
MAT growth (%)
(4.4)
(3.8)
(5.7)
(3.4)
(4.8)
Exhibit 61: Acute v/s Chronic (MAT growth)
MATVALUE_DEC_16
11.8
MATVALUE_GR_DEC_17
Exhibit 62: Growth distribution (%) (MAT Dec 17)
-1.4
Vol GR
(3.2)
-3.4
Price GR
0.4
NP GR
(4.8)
4.5
ACUTE
CHRONIC
Source: AIOCD, MOSL
Source: AIOCD, MOSL
17 January 2018
14

Sector Update| Healthcare
Biocon
Exhibit 63: Top 10 drugs
Secondary sales of Biocon
posted robust growth of
11.4% YoY in December
2017
Drug
Total
Insugen
Basalog
Canmab
Insugen R
Erypro
Blisto Mf
Psorid
Biomab Egfr
Insugen N
Metadoze-Ipr
Anti Diabetic
Anti Diabetic
Anti-Neoplastics
Anti Diabetic
Blood Related
Anti Diabetic
Anti-Neoplastics
Anti-Neoplastics
Anti Diabetic
Anti Diabetic
Therapy
Value
(INR m)
3,963
1,124
794
380
247
166
163
110
102
85
63
MAT Dec 17
Growth
(%)
10.6
27.8
27.1
64.4
39.1
(47.3)
3.7
36.1
(15.4)
18.3
28.9
Growth (%)
Mkt
Sh. (%)
100.0
28.4
20.0
9.6
6.2
4.2
4.1
2.8
2.6
2.1
1.6
Last 3M
9.2
25.1
30.3
53.0
39.3
(86.3)
22.4
35.7
1.3
6.0
Dec-17
11.4
11.5
25.9
39.5
39.4
(83.7)
26.9
59.2
(44.8)
(0.3)
37.1
35.8
Source: AIOCD, MOSL
Dec 17 Gr. (%)
11.4
21.5
0.8
(81.7)
5.9
130.6
47.3
Source: AIOCD, MOSL
Gr. Contribution (%)
100.0
138.6
3.8
1.7
(44.2)
Source: AIOCD, MOSL
Exhibit 64: Therapy mix (%)
Biocon’s blood-related
portfolio saw a massive
decline of 81% while its
cardiac portfolio recovered
significantly, growing 5.9%
in December after declining
30.3% in November
Total
Anti Diabetic
Anti-Neoplastics
Blood Related
Cardiac
Anti-Infectives
Derma
Share
100.0
65.2
18.4
4.4
3.6
3.1
2.3
MAT Gr. (%)
10.6
26.1
(10.1)
(46.1)
(15.0)
62.2
3.4
3M*
9.2
28.7
0.4
(84.6)
(17.9)
48.4
10.9
Exhibit 65: Brand-wise growth distribution
% of sales
MAT growth (%)
10.6
19.5
4.1
2.4
(68.7)
Total
Top 10 Brands
11 to 25 Brands
26 to 50 Brands
Above 50 Brands
100.0
81.6
9.3
7.1
1.9
Top 10 products are the
primary growth drivers
for Biocon; the company
saw significant volume
growth in December 2017
Exhibit 66: Acute v/s Chronic (MAT growth)
MATVALUE_DEC_16
MATVALUE_GR_DEC_17
2.5
Exhibit 67: Growth distribution (%) (MAT Dec 17)
9.7
1.8
1.0
ACUTE
CHRONIC
Source: AIOCD, MOSL
Source: AIOCD, MOSL
15
14.3
Vol GR
-0.5
Price GR
1.4
NP GR
17 January 2018

Sector Update| Healthcare
Abbott India
Exhibit 68: Top 10 drugs
Abbott’s secondary sales
grew 7.1% YoY for
December 2017, 8% for 3M,
and 7.4% on MAT basis
Drug
Therapy
MAT Dec 17
Growth (%)
Value Growth Mkt
Last 3M Dec-17
(INR m)
(%)
Sh. (%)
72,541
7.4
100.0
8.0
7.1
5,022
0.4
6.9
(4.4)
8.6
2,735
13.8
3.8
(9.3)
(3.4)
2,490
6.9
3.4
54.8
23.9
2,444
23.8
3.4
20.8
22.0
2,328
21.9
3.2
44.2
42.7
1,807
21.4
2.5
10.8
8.3
1,402
7.2
1.9
(5.1)
(11.1)
1,279
5.2
1.8
(4.2)
(7.5)
14.5
26.0
1.5
1.4
(0.5)
10.4
9.2
13.3
Total
Mixtard
Anti Diabetic
Novomix
Anti Diabetic
Phensedyl Cough LinctusRespiratory
Duphaston
Gynaecological
Thyronorm
Hormones
Udiliv
Gastro Intestinal
Vertin
Neuro / Cns
Duphalac
Gastro Intestinal
Actrapid
Similac
Anti Diabetic
1,118
Vitamins / Minerals / Nutrients 1,039
Source: AIOCD, MOSL
Exhibit 69: Therapy mix
Total
Share
100.0
20.9
16.3
10.8
8.8
8.1
7.4
MAT Gr. (%)
7.4
6.2
10.3
9.6
3.1
1.2
(12.7)
3M*
8.0
(2.6)
7.1
9.3
8.8
0.2
0.9
Dec 17 Gr. (%)
7.1
5.2
3.2
8.6
4.4
(0.8)
3.2
Source: AIOCD, MOSL
Gr. Contribution (%)
100.0
44.6
34.2
17.6
3.5
Source: AIOCD, MOSL
Abbot’s Anti-Diabetic
portfolio grew 5.2% YoY in
December 2017 after 11.8%
decline in November 2017
Anti Diabetic
Gastro Intestinal
Vitamins / Minerals / Nutrients
Neuro / Cns
Cardiac
Anti-Infectives
Exhibit 70: Brand-wise growth distribution
Total
% of sales
100.0
29.9
16.5
15.7
38.0
MAT growth (%)
7.4
11.5
16.7
8.4
0.6
Abbot’s chronic segment
grew 5.5% YoY on MAT
basis
Top 10 Brands
11 to 25 Brands
26 to 50 Brands
Above 50 Brands
Exhibit 71: Acute v/s Chronic (MAT growth)
MATVALUE_DEC_16
Exhibit 72: Growth distribution (%) (MAT Dec 17)
8.8
MATVALUE_GR_DEC_17
5.5
5.3
39.5
ACUTE
28.0
CHRONIC
Source: AIOCD, MOSL
Vol GR
1.4
Price GR
0.7
NP GR
Source: AIOCD, MOSL
17 January 2018
16

Sector Update| Healthcare
Mankind
Exhibit 73: Top 10 drugs
Mankind’s secondary sales
increased 19.9% YoY for
December 2017, 14.1% YoY
for 3M and 5.4% YoY on
MAT basis
Drug
Mankind Pharma.
Manforce
Moxikind Cv
Unwanted Kit
Glimestar M
Amlokind-At
Prega News
Candiforce
Nurokind Lc
Telmikind H
Gudcef
Sex Stimulants / Rejuvenators
Anti-Infectives
Gynaecological
Anti Diabetic
Cardiac
Others
Anti-Infectives
Vitamins / Minerals / Nutrients
Cardiac
Anti-Infectives
Therapy
MAT Dec 17
Growth (%)
Value Growth
Mkt
Last 3M Dec-17
(INR m)
(%)
Share (%)
42,228
5.4
100.0
14.1
19.9
1,985
1,676
960
892
792
694
693
645
618
610
6.7
(8.4)
(10.7)
(2.0)
(3.4)
(2.1)
17.6
27.9
30.5
(16.2)
4.7
4.0
2.3
2.1
1.9
1.6
1.6
1.5
1.5
1.4
(3.9)
(9.1)
43.1
20.8
1.8
1.0
(12.7)
27.5
55.4
(7.8)
(4.7)
32.3
38.8
(2.8)
4.6
(30.2)
42.1
64.1
(18.4)
(5.9)
Source: AIOCD, MOSL
Dec 17 Gr. (%)
19.9
11.5
23.7
19.2
23.9
49.3
31.6
Source: AIOCD, MOSL
Exhibit 74: Therapy mix (%)
Mankind’s Respiratory
therapy saw robust growth
of 49.3% YoY in December
2017, followed by Anti-
diabetic (+31.6%) and
Cardiac (+23.9%)
Total
Anti-Infectives
Vitamins / Minerals / Nutrients
Gastro Intestinal
Cardiac
Respiratory
Anti Diabetic
Share
100.0
21.5
15.2
11.0
9.9
6.6
6.2
MAT Gr. (%)
5.4
(2.1)
7.4
5.7
14.0
11.9
13.5
3M*
14.1
6.9
13.9
12.9
18.6
37.6
21.4
Exhibit 75: Brand-wise growth distribution
Total
Top 10 Brands
11 to 25 Brands
26 to 50 Brands
Above 50 Brands
% of sales
100.0
22.7
15.7
15.9
45.7
MAT gr. (%)
5.4
0.7
8.1
8.6
5.8
Gr. Contribution (%)
100.0
3.1
23.1
24.6
49.2
Source: AIOCD, MOSL
Exhibit 76: Acute v/s Chronic (MAT growth)
MATVALUE_DEC_16
30.5
MATVALUE_GR_DEC_17
10.8
Exhibit 77: Growth distribution (%) (MAT Dec 17)
3.5
9.6
3.7
ACUTE
CHRONIC
Source: AIOCD, MOSL
Vol GR
0.7
Price GR
1.2
NP GR
Source: AIOCD, MOSL
17 January 2018
17

Sector Update| Healthcare
Pfizer
Exhibit 78: Top 10 drugs
Pfizer’s secondary sales
declined marginally by 0.6%
YoY in December 2017
Drug
Pfizer + Wyeth
Becosules
Magnex
Dolonex
Minipress Xl
Gelusil Mps
Prevenar 13
Mucaine
Wysolone
Corex Dx
Folvite
Vitamins / Minerals / Nutrients
Anti-Infectives
Pain / Analgesics
Cardiac
Gastro Intestinal
Vaccines
Gastro Intestinal
Hormones
Respiratory
Blood Related
Therapy
MAT Dec 17
Value
Growth
Mkt
(INR m)
(%)
Sh. (%)
27,462
(3.5)
100.0
2,243
1,523
1,435
1,425
1,349
1,248
1,171
1,010
862
761
0.9
11.5
2.1
3.4
(0.4)
62.6
3.1
(8.7)
15.3
(1.4)
8.2
5.5
5.2
5.2
4.9
4.5
4.3
3.7
3.1
2.8
Growth (%)
Last
Dec-17
3M
(3.4)
(0.6)
0.4
2.2
(8.7)
(0.3)
2.2
0.8
7.4
(23.5)
10.2
4.2
5.4
(2.9)
4.0
0.7
9.6
3.8
(19.7)
14.3
1.0
(4.6)
Source: AIOCD, MOSL
Dec 17 Gr. (%)
(0.6)
11.2
(0.2)
4.1
(10.0)
(3.1)
0.1
Source: AIOCD, MOSL
Gr. Contribution (%)
100.0
(76.9)
(42.1)
183.0
36.0
Source: AIOCD, MOSL
Exhibit 79: Therapy Mix (%)
While growth in Anti-
Infectives continued, Gastro
therapy saw a fall in growth
to 0.2% YoY (+8.1% in
November 2017)
Total
Anti-Infectives
Gastro Intestinal
Vitamins / Minerals / Nutrients
Hormones
Gynaecological
Cardiac
Share
100.0
14.6
10.8
10.2
9.8
9.6
7.4
MAT Gr. (%)
(3.5)
4.5
(0.8)
(1.4)
(1.7)
11.6
(1.4)
3M*
(3.4)
6.5
2.0
(0.0)
(13.6)
5.3
(5.3)
Decline in sales can be
attributed to decline in
volumes and prices, and
muted new product growth
in December 2017
Exhibit 80: Brand-wise growth distribution
Total
Top 10 Brands
11 to 25 Brands
26 to 50 Brands
Above 50 Brands
% of sales
100.0
47.4
26.3
16.0
10.3
MAT growth (%)
(3.5)
6.3
6.2
(29.5)
(11.3)
Exhibit 81: Acute v/s Chronic (MAT growth)
MATVALUE_DEC_16
24.0
MATVALUE_GR_DEC_17
2.9
Exhibit 82: Growth distribution (%) (MAT Dec 17)
-0.7
Vol GR
-3.2
4.4
Price GR
0.4
NP GR
(4.7)
ACUTE
CHRONIC
Source: AIOCD, MOSL
Source: AIOCD, MOSL
17 January 2018
18

Sector Update| Healthcare
Merck
Exhibit 83: Top 10 drugs
Merck secondary sales posted
marginal decline of 0.3% in Dec-
17
Drug
Merck Ltd
Neurobion Forte
Polybion
Livogen
Livogen Z
Concor
Evion Lc
Polybion Sf
Polybion Lc
Concor Am
Vitamins / Minerals / Nutrients
Gynaecological
Gynaecological
Cardiac
Vitamins / Minerals / Nutrients
Cardiac
Therapy
MAT Dec 17
Value
Growth
Mkt
(INR m)
(%)
Sh. (%)
6,772
5.0
100.0
812
573
465
407
400
346
300
280
253
248
3.0
3.9
5.3
8.6
22.0
20.4
2.3
(5.2)
(5.5)
17.2
12.0
8.5
6.9
6.0
5.9
5.1
4.4
4.1
3.7
3.7
Growth (%)
Last 3M Dec-17
0.2
(9.8)
8.3
(4.2)
0.6
9.0
(1.4)
(5.8)
(21.7)
(3.2)
(0.3)
(8.8)
(9.0)
(11.2)
(1.3)
11.3
7.4
(7.9)
(29.1)
(2.6)
Neurobion Forte Rf Vitamins / Minerals / Nutrients
11.9
12.1
Source: AIOCD, MOSL
Dec 17 Gr (%)
(0.3)
(3.9)
0.1
5.9
(8.1)
(9.2)
852.5
Source: AIOCD, MOSL
Exhibit 84: Therapy mix (%)
Merck’s Gynaecological
portfolio recovered
significantly in December
(+0.1%) after 15.8% decline
in November 2017
Total
Vitamins / Minerals / Nutrients
Gynaecological
Cardiac
Derma
Anti Diabetic
Anti-Neoplastics
Share
100.0
48.1
17.5
17.4
6.4
3.5
1.8
MAT Gr. (%)
5.0
4.4
0.5
16.5
17.7
2.5
123.8
3M*
0.2
(2.7)
(6.3)
5.8
15.2
(9.8)
759.4
Exhibit 85: Brand-wise growth distribution
% of sales
Total
Top 10 Brands
100.0
60.3
25.7
11.4
2.6
MAT Gr. (%)
5.0
6.4
15.5
(8.8)
(31.2)
Gr. Contribution (%)
100.0
75.8
72.1
(22.9)
(25.0)
Source: AIOCD, MOSL
Merck saw significant price
growth of 2.9% in
December 2017
11 to 25 Brands
26 to 50 Brands
Above 50 Brands
Exhibit 86: Acute v/s Chronic (MAT growth)
MATVALUE_DEC_16
5.2
MATVALUE_GR_DEC_17
13.9
Exhibit 87: Growth distribution (%) (MAT Dec 17)
2.2
1.3
2.8
ACUTE
Vol GR
CHRONIC
Source: AIOCD, MOSL
2.9
-0.1
Price GR
NP GR
Source: AIOCD, MOSL
17 January 2018
19

Sector Update| Healthcare
Ajanta Pharma
Exhibit 88: Top 10 drugs
Ajanta Pharma’s secondary
sales grew 8.5% YoY for
December 2017, 10.1% YoY
for 3M, and 9.1% YoY on
MAT basis
Drug
Ajanta Pharma
Met Xl
Atorfit Cv
Melacare
Feburic
Met Xl Am
Rosufit Cv
Rosutor Gold
Soft Drops
Cinod
Olopat
Cardiac
Cardiac
Derma
Pain / Analgesics
Cardiac
Cardiac
Cardiac
Ophthal / Otologicals
Cardiac
Ophthal / Otologicals
Therapy
MAT Dec 17
Value
Growth
(INR m)
(%)
7,373
9.1
858
514
495
259
215
211
195
184
183
113
11.9
4.7
0.2
25.0
14.5
1.7
29.6
1.9
33.2
8.4
Growth (%)
Mkt
Sh. (%)
100.0
11.6
7.0
6.7
3.5
2.9
2.9
2.6
2.5
2.5
1.5
Last 3M
10.1
9.9
6.6
4.1
45.7
27.1
(10.2)
28.3
2.8
36.8
Dec-17
8.5
(2.5)
3.1
17.2
55.6
21.2
(13.9)
18.6
11.9
35.8
28.2
26.2
Source: AIOCD, MOSL
Dec 17 Gr. (%)
8.5
6.8
23.3
1.9
34.7
(8.3)
18.9
Source: AIOCD, MOSL
Gr. Contribution (%)
100.0
48.8
20.0
18.3
12.8
Source: AIOCD, MOSL
Exhibit 89: Therapy mix (%)
Share
Total
Cardiac
Ophthal / Otologicals
Derma
Pain / Analgesics
Vitamins / Minerals / Nutrients
Anti Diabetic
100.0
38.8
24.8
17.1
5.0
4.0
2.2
MAT Gr.(%)
9.1
14.1
16.1
(2.9)
13.0
(13.9)
37.9
3M*
10.1
13.3
17.9
(0.4)
29.0
(8.7)
20.6
Price increase and new
product growth are the key
growth drivers for Ajanta
Pharma on
MAT basis
Exhibit 90: Brand-wise growth distribution
Total
Top 10 Brands
11 to 25 Brands
26 to 50 Brands
Above 50 Brands
% of sales
100.0
43.7
15.5
16.4
24.4
MAT Growth (%)
9.1
10.2
12.1
10.3
4.6
Exhibit 91: Acute v/s Chronic (MAT growth)
MATVALUE_DEC_16
MATVALUE_GR_DEC_17
9.5
Exhibit 92: Growth distribution (%) (MAT Dec 17)
8.6
2.4
3.3
ACUTE
3.4
CHRONIC
Source: AIOCD, MOSL
0.9
Vol GR
Price GR
5.8
NP GR
Source: AIOCD, MOSL
17 January 2018
20

Sector Update| Healthcare
NOTES
16 January 2018
21

Disclosures:
The following Disclosures are being made in compliance with the SEBI Research Analyst Regulations 2014 (herein after referred to as the Regulations).
Motilal Oswal Securities Ltd. (MOSL) is a SEBI Registered Research Analyst having registration no. INH000000412. MOSL, the Research Entity (RE) as defined in the Regulations, is engaged in the business of providing Stock
Sector Update| Healthcare
broking services, Investment Advisory Services, Depository participant services & distribution of various financial products. MOSL is a subsidiary company of Motilal Oswal Financial Service Ltd. (MOFSL). MOFSL is a listed
public company, the details in respect of which are available on
www.motilaloswal.com.
MOSL is registered with the Securities & Exchange Board of India (SEBI) and is a registered Trading Member with National Stock
Exchange of India Ltd. (NSE) and Bombay Stock Exchange Limited (BSE), Metropolitan Stock Exchange Of India Ltd. (MSE) for its stock broking activities & is Depository participant with Central Depository Services Limited
(CDSL) & National Securities Depository Limited (NSDL) and is member of Association of Mutual Funds of India (AMFI) for distribution of financial products. Details of associate entities of Motilal Oswal Securities Limited are
available on the website at
http://onlinereports.motilaloswal.com/Dormant/documents/Associate%20Details.pdf
Pending Regulatory Enquiries against Motilal Oswal Securities Limited by SEBI:
SEBI pursuant to a complaint from client Shri C.R. Mohanraj alleging unauthorized trading, issued a letter dated 29th April 2014 to MOSL notifying appointment of an Adjudicating Officer as per SEBI regulations to hold
inquiry and adjudge violation of SEBI Regulations; MOSL requested SEBI to provide all documents, records, investigation report relied upon by SEBI which were referred in Show Cause Notice and also sought personal
hearing. The matter is currently pending.
MOSL, it’s associates, Research Analyst or their relative may have any financial interest in the subject company. MOSL and/or its associates and/or Research Analyst may have beneficial ownership of 1% or more securities in
the subject company at the end of the month immediately preceding the date of publication of the Research Report.
MOSL and its associate company(ies), their directors and Research Analyst and their relatives may; (a)
from time to time, have a long or short position in, act as principal in, and buy or sell the securities or derivatives thereof of companies mentioned herein. (b) be engaged in any other transaction involving such securities and
earn brokerage or other compensation or act as a market maker in the financial instruments of the company(ies) discussed herein or act as an advisor or lender/borrower to such company(ies) or may have any other
potential conflict of interests with respect to any recommendation and other related information and opinions.; however the same shall have no bearing whatsoever on the specific recommendations made by the analyst(s),
as the recommendations made by the analyst(s) are completely independent of the views of the associates of MOSL even though there might exist an inherent conflict of interest in some of the stocks mentioned in the
research report.
Research Analyst may have served as director/officer, etc. in the subject company in the last 12 month period. MOSL and/or its associates may have received any compensation from the subject company in
the past 12 months.
In the last 12 months period ending on the last day of the month immediately preceding the date of publication of this research report, MOSL or any of its associates may have:
a)
managed or co-managed public offering of securities from subject company of this research report,
b)
received compensation for investment banking or merchant banking or brokerage services from subject company of this research report,
c)
received compensation for products or services other than investment banking or merchant banking or brokerage services from the subject company of this research report.
d)
Subject Company may have been a client of MOSL or its associates during twelve months preceding the date of distribution of the research report.
MOSL and it’s associates have not received any compensation or other benefits from the subject company or third party in connection with the research report. To enhance transparency, MOSL has incorporated a Disclosure
of Interest Statement in this document. This should, however, not be treated as endorsement of the views expressed in the report. MOSL and / or its affiliates do and seek to do business including investment banking with
companies covered in its research reports. As a result, the recipients of this report should be aware that MOSL may have a potential conflict of interest that may affect the objectivity of this report. Compensation of Research
Analysts is not based on any specific merchant banking, investment banking or brokerage service transactions.
Terms & Conditions:
This report has been prepared by MOSL and is meant for sole use by the recipient and not for circulation. The report and information contained herein is strictly confidential and may not be altered in any way, transmitted to,
copied or distributed, in part or in whole, to any other person or to the media or reproduced in any form, without prior written consent of MOSL. The report is based on the facts, figures and information that are considered
true, correct, reliable and accurate. The intent of this report is not recommendatory in nature. The information is obtained from publicly available media or other sources believed to be reliable. Such information has not
been independently verified and no guaranty, representation of warranty, express or implied, is made as to its accuracy, completeness or correctness. All such information and opinions are subject to change without notice.
The report is prepared solely for informational purpose and does not constitute an offer document or solicitation of offer to buy or sell or subscribe for securities or other financial instruments for the clients. Though
disseminated to all the customers simultaneously, not all customers may receive this report at the same time. MOSL will not treat recipients as customers by virtue of their receiving this report.
Analyst Certification
The views expressed in this research report accurately reflect the personal views of the analyst(s) about the subject securities or issues, and no part of the compensation of the research analyst(s) was, is, or will be directly or
indirectly related to the specific recommendations and views expressed by research analyst(s) in this report.
Disclosure of Interest Statement
Analyst ownership of the stock
Companies where there is interest
No
A graph of daily closing prices of securities is available at
www.nseindia.com, www.bseindia.com.
Research Analyst views on Subject Company may vary based on Fundamental research and Technical Research. Proprietary
trading desk of MOSL or its associates maintains arm’s length distance with Research Team as all the activities are segregated from MOSL research activity and therefore it can have an independent view with regards to
subject company for which Research Team have expressed their views.
Regional Disclosures (outside India)
This report is not directed or intended for distribution to or use by any person or entity resident in a state, country or any jurisdiction, where such distribution, publication, availability or use would be contrary to law,
regulation or which would subject MOSL & its group companies to registration or licensing requirements within such jurisdictions.
For Hong Kong:
This report is distributed in Hong Kong by Motilal Oswal capital Markets (Hong Kong) Private Limited, a licensed corporation (CE AYY-301) licensed and regulated by the Hong Kong Securities and Futures Commission (SFC)
pursuant to the Securities and Futures Ordinance (Chapter 571 of the Laws of Hong Kong) “SFO”. As per SEBI (Research Analyst Regulations) 2014 Motilal Oswal Securities (SEBI Reg No. INH000000412) has an agreement with
Motilal Oswal capital Markets (Hong Kong) Private Limited for distribution of research report in Hong Kong. This report is intended for distribution only to “Professional Investors” as defined in Part I of Schedule 1 to SFO. Any
investment or investment activity to which this document relates is only available to professional investor and will be engaged only with professional investors.” Nothing here is an offer or solicitation of these securities,
products and services in any jurisdiction where their offer or sale is not qualified or exempt from registration. The Indian Analyst(s) who compile this report is/are not located in Hong Kong & are not conducting Research
Analysis in Hong Kong.
For U.S.
Motilal Oswal Securities Limited (MOSL) is not a registered broker - dealer under the U.S. Securities Exchange Act of 1934, as amended (the"1934 act") and under applicable state laws in the United States. In addition MOSL is
not a registered investment adviser under the U.S. Investment Advisers Act of 1940, as amended (the "Advisers Act" and together with the 1934 Act, the "Acts), and under applicable state laws in the United States.
Accordingly, in the absence of specific exemption under the Acts, any brokerage and investment services provided by MOSL, including the products and services described herein are not available to or intended for U.S.
persons. This report is intended for distribution only to "Major Institutional Investors" as defined by Rule 15a-6(b)(4) of the Exchange Act and interpretations thereof by SEC (henceforth referred to as "major institutional
investors"). This document must not be acted on or relied on by persons who are not major institutional investors. Any investment or investment activity to which this document relates is only available to major institutional
investors and will be engaged in only with major institutional investors. In reliance on the exemption from registration provided by Rule 15a-6 of the U.S. Securities Exchange Act of 1934, as amended (the "Exchange Act") and
interpretations thereof by the U.S. Securities and Exchange Commission ("SEC") in order to conduct business with Institutional Investors based in the U.S., MOSL has entered into a chaperoning agreement with a U.S.
registered broker-dealer, Motilal Oswal Securities International Private Limited. ("MOSIPL"). Any business interaction pursuant to this report will have to be executed within the provisions of this chaperoning agreement.
The Research Analysts contributing to the report may not be registered /qualified as research analyst with FINRA. Such research analyst may not be associated persons of the U.S. registered broker-dealer, MOSIPL, and
therefore, may not be subject to NASD rule 2711 and NYSE Rule 472 restrictions on communication with a subject company, public appearances and trading securities held by a research analyst account.
For Singapore
Motilal Oswal Capital Markets Singapore Pte Limited is acting as an exempt financial advisor under section 23(1)(f) of the Financial Advisers Act(FAA) read with regulation 17(1)(d) of the Financial Advisors Regulations and is a
subsidiary of Motilal Oswal Securities Limited in India. This research is distributed in Singapore by Motilal Oswal Capital Markets Singapore Pte Limited and it is only directed in Singapore to accredited investors, as defined in
the Financial Advisers Regulations and the Securities and Futures Act (Chapter 289), as amended from time to time. In respect of any matter arising from or in connection with the research you could contact the following
representatives of Motilal Oswal Capital Markets Singapore Pte Limited:
Disclaimer:
The report and information contained herein is strictly confidential and meant solely for the selected recipient and may not be altered in any way, transmitted to, copied or distributed, in part or in whole, to any other person
or to the media or reproduced in any form, without prior written consent. This report and information herein is solely for informational purpose and may not be used or considered as an offer document or solicitation of
offer to buy or sell or subscribe for securities or other financial instruments. Nothing in this report constitutes investment, legal, accounting and tax advice or a representation that any investment or strategy is suitable or
appropriate to your specific circumstances. The securities discussed and opinions expressed in this report may not be suitable for all investors, who must make their own investment decisions, based on their own investment
objectives, financial positions and needs of specific recipient. This may not be taken in substitution for the exercise of independent judgment by any recipient. Each recipient of this document should make such investigations
as it deems necessary to arrive at an independent evaluation of an investment in the securities of companies referred to in this document (including the merits and risks involved), and should consult its own advisors to
determine the merits and risks of such an investment. The investment discussed or views expressed may not be suitable for all investors. Certain transactions -including those involving futures, options, another derivative
products as well as non-investment grade securities - involve substantial risk and are not suitable for all investors. No representation or warranty, express or implied, is made as to the accuracy, completeness or fairness of
the information and opinions contained in this document. The Disclosures of Interest Statement incorporated in this document is provided solely to enhance the transparency and should not be treated as endorsement of the
views expressed in the report. This information is subject to change without any prior notice. The Company reserves the right to make modifications and alternations to this statement as may be required from time to time
without any prior approval. MOSL, its associates, their directors and the employees may from time to time, effect or have effected an own account transaction in, or deal as principal or agent in or for the securities
mentioned in this document. They may perform or seek to perform investment banking or other services for, or solicit investment banking or other business from, any company referred to in this report. Each of these entities
functions as a separate, distinct and independent of each other. The recipient should take this into account before interpreting the document. This report has been prepared on the basis of information that is already
available in publicly accessible media or developed through analysis of MOSL. The views expressed are those of the analyst, and the Company may or may not subscribe to all the views expressed therein. This document is
being supplied to you solely for your information and may not be reproduced, redistributed or passed on, directly or indirectly, to any other person or published, copied, in whole or in part, for any purpose. This report is not
directed or intended for distribution to, or use by, any person or entity who is a citizen or resident of or located in any locality, state, country or other jurisdiction, where such distribution, publication, availability or use would
be contrary to law, regulation or which would subject MOSL to any registration or licensing requirement within such jurisdiction. The securities described herein may or may not be eligible for sale in all jurisdictions or to
certain category of investors. Persons in whose possession this document may come are required to inform themselves of and to observe such restriction. Neither the Firm, not its directors, employees, agents or
representatives shall be liable for any damages whether direct or indirect, incidental, special or consequential including lost revenue or lost profits that may arise from or in connection with the use of the information.
The
person accessing this information specifically agrees to exempt MOSL or any of its affiliates or employees from, any and all responsibility/liability arising from such misuse and agrees not to hold MOSL or any of its affiliates or
employees responsible for any such misuse and further agrees to hold MOSL or any of its affiliates or employees free and harmless from all losses, costs, damages, expenses that may be suffered by the person accessing this
information due to any errors and delays.
Registered Office Address: Motilal Oswal Tower, Rahimtullah Sayani Road, Opposite Parel ST Depot, Prabhadevi, Mumbai-400025; Tel No.: 022-3980 4263; www.motilaloswal.com. Correspondence Address: Palm Spring
Centre, 2nd Floor, Palm Court Complex, New Link Road, Malad (West), Mumbai- 400 064. Tel No: 022 3080 1000. Compliance Officer: Neeraj Agarwal, Email Id:
na@motilaloswal.com,
Contact No.:022-30801085.
Registration details of group entities.: MOSL: SEBI Registration: INZ000158836; CDSL: IN-DP-16-2015; NSDL: IN-DP-NSDL-152-2000; Research Analyst: INH000000412. AMFI: ARN 17397. Investment Adviser: INA000007100.
Motilal Oswal Asset Management Company Ltd. (MOAMC): PMS (Registration No.: INP000000670) offers PMS and Mutual Funds products. Motilal Oswal Wealth Management Ltd. (MOWML): PMS (Registration No.:
INP000004409) offers wealth management solutions. *Motilal Oswal Securities Ltd. is a distributor of Mutual Funds, PMS, Fixed Deposit, Bond, NCDs, Insurance and IPO products. * Motilal Oswal Commodities Broker Pvt. Ltd.
offers Commodities Products. * Motilal Oswal Real Estate Investment Advisors II Pvt. Ltd. offers Real Estate products. * Motilal Oswal Private Equity Investment Advisors Pvt. Ltd. offers Private Equity products
16 January 2018
22