Piramal Enterprises
BSE SENSEX
35,798
S&P CNX
10,966
22 January 2018
Update
|
Sector
:
Financials - Pharmaceuticals
CMP: INR2,822
TP: INR3,500 (+24%)
Strong growth led by new products
Factoring recent capital raise in estimates
Buy
Stock Info
Bloomberg
Equity Shares (m)
52-Week Range (INR)
1, 6, 12 Rel. Per (%)
M.Cap. (INR b)
M.Cap. (USD b)
Avg Val, INRm
Free float (%)
PIEL IN
173
3083 / 1670
-8/-15/22
486.9
7.6
528
48.6
Financials Snapshot (INR b)
Y/E March
2018E 2019E
Revenues
108.9 140.2
EBITDA
31.0
41.9
PAT
13.8
19.6
EPS (INR)
85.4 114.5
EPS Gr. (%)
17.7
34.1
BV/Sh. (INR)
1,095 1,225
Payout (%)
34.0
34.0
Valuations
P/E (x)
33.0
24.6
P/BV (x)
2.6
2.3
Div. Yield (%)
1.0
1.4
2020E
174.3
50.9
25.4
146.7
28.1
1,320
35.0
19.2
2.1
1.8
FY18 is likely to be another strong year for Piramal Enterprises (PIEL). In 1HFY18, the
loan book grew ~70% YoY driven by all segments, especially non-real estate
corporate financing. The healthcare business too witnessed improving traction.
Consolidated PAT was up 28% YoY in 1HFY18. We expect 2HFY18 to be as strong,
with 28% PAT YoY growth to INR9.5b.
On account of a strong growth outlook for FY19 and FY20 (35% CAGR in our view),
PIEL recently raised INR50b via Compulsorily Convertible Debentures (CCDs) and also
plans to raise additional INR20b via rights issue, of which the promoters have agreed
to underwrite 90%. We believe much of this capital will be used to support growth in
the financing business.
Having proved its mettle in real estate wholesale financing, PIEL is now targeting
other segments such as infrastructure, auto components and renewables to grow its
wholesale financing piece. This book (corporate finance) has doubled in 1HFY18 to
INR62b. Also, it has forayed directly into retail housing finance in September 2017. Its
forays into new products have helped diversify as well as de-risk the loan book.
Pharma business has shown strong improvement post demonetization and GST
implementation. Strong growth in existing business and inorganic methods should
drive healthy revenue CAGR of 12% over FY17-20E.
After incorporating both capital raises in our numbers, our BVPS estimates for
FY18/19E are upgraded by 17%/19%. We roll over our target multiple to FY20 to
arrive at a TP of INR3,500 (SOTP-based). Buy.
INR50b raised through CCDs; INR20b rights issue to follow soon
PIEL issued CCDs of face value of INR107,600 per CCD, which will convert into 40
equity shares (translating into INR2,690 per share) in April 2019. The CCDs bear an
interest of 7.8% per year. The cumulative value of the CCDs is INR50b. In addition,
the company has approved a rights issue at a price of INR2,380 per share
amounting to INR20b. This is expected to come up in the next few months. The
promoter has committed to subscribe up to 90% of the equity shares offered in the
rights issue. Post the capital raise, net worth of the company is likely to increase to
INR195/230b (ex gains on Shriram investments) in FY18/19 – the second highest in
the private NBFC space. We have assumed rights issue to complete in FY19.
Shareholding pattern (%)
As On
Dec-17 Sep-17 Dec-16
Promoter
51.3
51.4
51.4
DII
4.1
3.9
3.5
FII
27.7
28.0
28.5
Others
16.9
16.7
16.5
FII Includes depository receipts
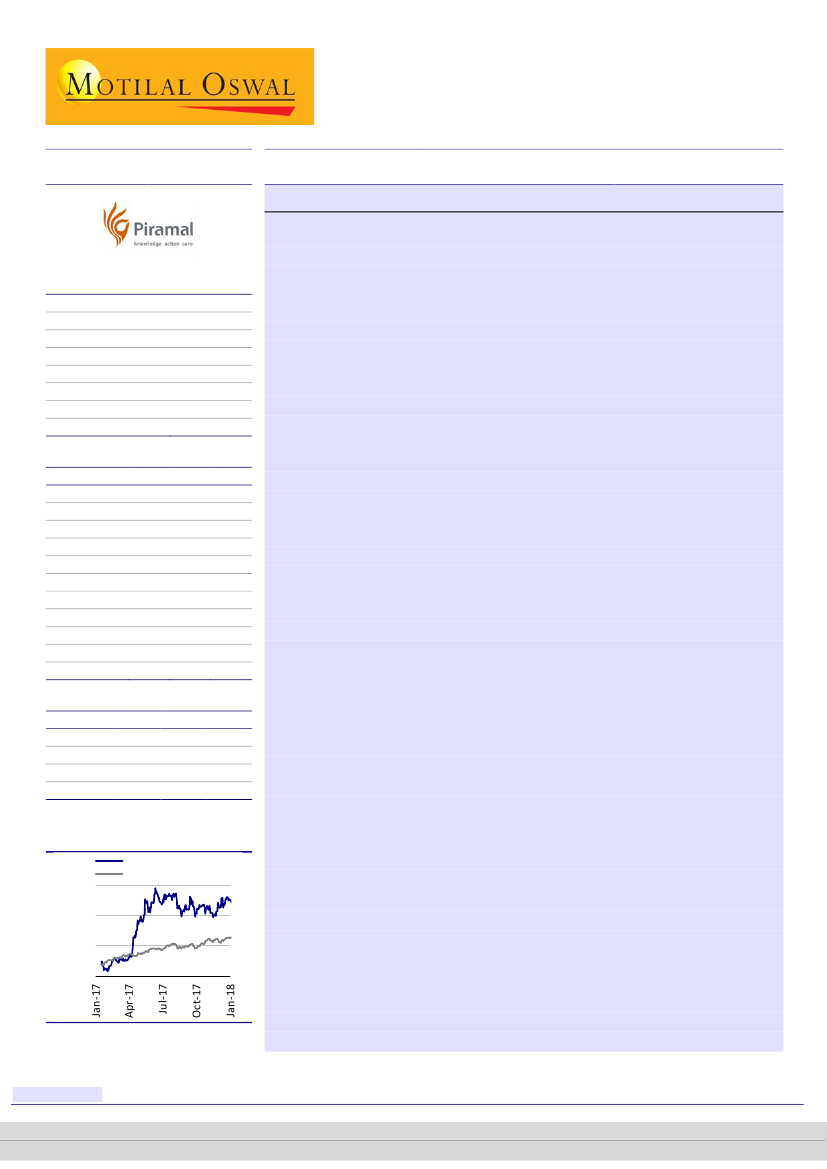
Stock Performance (1-year)
Piramal Enterp.
Sensex - Rebased
3,100
2,600
2,100
1,600
Expanding the product suite in wholesale financing
Over the past three years, PIEL has moved aggressively into new lines of business
such as construction finance (both residential and commercial), lease rental
discounting and corporate finance (across multiple sectors like infra, auto
components, etc).
Construction finance, which was negligible three years ago,
now accounts for almost half the total loan book while non-real estate lending
(corporate finance) accounts for about 20% of the total loan book.
We believe
there is much more scope for PIEL to grow in the non-real-estate, corporate
finance segment, as the loan book is barely ~INR60b.
Research Analyst:
Alpesh Mehta
(Alpesh.Mehta@MotilalOswal.com); +91 22 6129 1526 /
Kumar Saurabh
(Kumar.Saurabh @MotilalOswal.com); +91 22 6129 1519
Piran Engineer
(Piran.Engineer@MotilalOswal.com); +91 22 3980 4393 /
Ashish Chopra
(Ashish.Chopra@MotilalOswal.com); +91 22 6129 1530
Investors are advised to refer through important disclosures made at the last page of the Research Report.
Motilal Oswal research is available on www.motilaloswal.com/Institutional-Equities, Bloomberg, Thomson Reuters, Factset and S&P Capital.

Piramal Enterprises
Gaining traction in home loans with a unique sourcing strategy
The home loan book is being sourced from multiple sources such as (a) ‘B2B2C’ –
giving loans to home buyers of projects financed by them, (b) Leveraging Brickex, a
B2B aggregation platform launched by PIEL, which has over 10,000 distributors
across tier-I cities, (c) DSAs. With the B2B2C model, the company is off to a good
start and had already built an AUM of INR2b in the first month of operations with
customers coming from 30 residential projects funded by the company. It has
innovative repayment structures – for example, low EMI for the first five years and
then increasing. With Brickex, the company is able to source loans at a cost lower
than that of DSAs and with better customer stickiness.
Investments in the Shriram Group to yield good returns going ahead
PIEL purchased stakes in Shriram group companies as a means to enter into the
retail financing domain. While there had been headwinds in the first few years
following the stake purchase, most headwinds have faded away. With the impact of
RBI’s mandated migration of NPL recognition to 90dpd ending in FY18, both Shriram
Transport Finance (SHTF) and Shriram City Union Finance (SCUF) are expected to
deliver robust earnings growth in the medium term.
We expect 32%/27% PAT CAGR
over FY17-20E for SHTF and SCUF respectively. PIEL’s investment in SHTF has more
than doubled in less than five years, while that in SCUF has given 75% returns in 3-
4 years.
Consequently, the value of PIEL’s stake in the parent, Shriram Capital, has
also increased – although it may be hard to quantify. Nevertheless, PIEL has
managed to generate a good return on a large investment (INR45b) over the past 4-
5 years and is expected to further yield better returns.
Note that the amount
invested in the Shriram Group was equal to roughly half of the market cap of PIEL
at that time.
Valuation and view
PIEL has the distinction of being one of the few companies in India to generate 25%+
book value CAGR over the past 25+ years. We believe it has the DNA to incubate and
grow businesses in niche segments. Introduction of the retail home loan product
completes as well as complements its real estate lending suite. At the same time,
the company has ramped up its lending in the corporate finance space and also
targets some distressed assets in partnership with Bain Capital.
We expect the loan
book to grow at 35% CAGR over FY18-20E – the recent capital infusion will help
support this growth. After incorporating both capital raises in our numbers, our
BVPS estimates for FY18/19 are upgraded by 17%/19%.
We roll over our target
multiple to FY20 to arrive at a TP of INR3,500 (SOTP-based). Buy.
Exhibit 1: SOTP (FY20E based)
Lending Business
Shriram Investments
Pharma, IT and Others
Target Value
Current market cap.
Upside (%)
Value
(INR B)
437
96
165
698
569
22.7
Value
(USD B)
6.7
1.5
2.5
10.7
8.8
22.7
INR per
share
2,193
481
826
3,500
2,853
22.7
% To Total
63
14
24
100
Rationale
3.2x PBV; ROA/ROE of ~3%/20%+ - Loan CAGR of 40% FY17-20
Based on our Target Multiple; Implied 1.8x of invested capital
Pharma EV/EBITDA 14x; IT EV/Sales of 4x
Implied 2.6x Consolidated BV
Source: MOSL, Company
22 January 2018
2

Piramal Enterprises
35% AUM CAGR in the lending business…
..driven by increased share of non-real estate financing
Real estate lending
accounts for 81% of the
total loan book, down from
88% in FY16
Presence across multiple business segments
Within the financing business alone, PIEL is present in multiple business
segments including real estate lending, alternative asset management,
corporate finance and retail housing finance.
In addition, it holds a significant stake in the Shriram Group, thus giving it
exposure to retail lending to the bottom of the pyramid.
Recently joint ventures with entities like Bain Capital provide further streams of
diversification for the company.
Exhibit 2: Financial services business – Presence across multiple business segments
FINANCIAL
SERVICES
LENDING (INR333b)
ALTERNATIVE AUM
(INR68b)
INVESTMENT
IN SHRIRAM
(INR46b*)
HOUSING FINANCE
(INR2b)
REAL ESTATE
(INR269b)
WHOLESALE
LENDING
(INR62b)
MEZZANINE (INR
96b)
CONSTRUCTION
FINANCE (INR159b)
LRD (INR 17b)
MEZZANINE
SENIOR
LENDING
RESIDENTIAL
(INR126b)
COMMERCIAL
(INR30b)
ACQUISITION
FUNDING
LAS
Source: MOSL, Company; *Shriram investment mentioned at cost
Growth driven by new
products, and not be over-
exposure to a single
product or geography
Growth driven by new products and new segments
While PIEL’s loan book grew at a scorching pace (100%+ CAGR) over the past
three years,
it is important to note that this was driven by expansion in
products offered and clients serviced, and not by over-exposure to a particular
set of clients, asset class or geography. For example, the construction finance
book, which was negligible three years ago, now stands at ~INR160b.
The company has widened its gamut of wholesale finance offerings by focusing
on other sectors such as renewables, cement and auto components. Within the
corporate finance book, the company has increased the share of its senior
secured portfolio, in a bid to mitigate risk. Senior lending accounts for roughly
half of the total corporate finance book.
22 January 2018
3

Piramal Enterprises
Exhibit 3: Loan book mix has completely evolved in the past 3 years
FY15
6
8
5
86
19
1HFY18
29
Mezzanine RE
CF
Other RE finance
Corp Finance &
others
Source: MOSL, Company
47
Exhibit 4: Loan book growth over the years
Loan book (INR b)
150
181
174
110
118
105
87
Growth (%)
Exhibit 5: Share of mezzanine financing declining (%)
86
59
79
286
69
333
44
38
29
29
90
111
130
160
196
227
244
Source: Company, MOSL
Exhibit 6: Construction finance – key growth driver
CF - Loan book (INR b)
56
Share of RE lending book (%)
57
59
59
Exhibit 7: Slowly growing the non-RE lending book
Corp fin book (INR b)
15
9
10
9
12
12
Share of total book (%)
19
15
11
12
13
42
48
46
65
52
87
113
122
147
159
4
8
14
11
15
20
29
25
30
37
62
Source: Company, MOSL
With strong growth of 69% YoY in 1HFY18, we believe the company is on track
to achieve 60% YoY growth for FY18. Post the current fiscal, we expect a
slowdown in growth as the base catches up. We estimate 35% AUM CAGR over
FY18-20E. However, there could be upside to our growth estimates with better-
than-expected scale up of the retail housing loan book.
22 January 2018
4

Piramal Enterprises
Exhibit 8: 35% AUM CAGR over FY18-20E
Loan book (INRb)
174
Growth (%)
42
29
FY14
67
87
60
40
547
FY19E
30
711
FY20E
48
FY15
130
FY16
244
FY17
390
FY18E
Source: MOSL, Company
31% repayment rate in FY17
– in line for a loan tenure of
three years
Superior underwriting key to high RoE
Wholesale financing, as a business, offers superior yields with lower opex as
compared to retail financing. However, it carries with itself greater risk too.
As a result, risk management is of paramount importance.
As long as credit
costs are contained, return ratios in wholesale finance are better than those in
retail finance.
Note that cumulative repayments since inception (up to FY17) have been
~INR185b that is 75% of loan book outstanding, implying a good track record in
collections by the company.
Repayment rate in FY17 was ~31% - in line for a
loan tenure of three years.
Exhibit 9: Best-in-class financial metrics (%)
Loan Yield
C/I ratio
GNPA
RoA
RoE
Leverage
FY16
17%
7%
0.9%
7%
25%
3.5x
FY17
16%
9.7%
0.4%
5.3%
25%+
5.0x
20%+ RoE in RE financing
possible with contained
credit costs
Exhibit 10: DuPont analysis of PIEL’s financing business v/s retail home loan business
%
Loan Yield (incl fees)
Cost of funds
Margins
Opex
PPoP
Credit costs
PBT
Tax
RoA
Leverage (x)
RoE
PIEL - NBFC
15.0
8.5
7.9
1.0
6.9
1.2
5.7
2.0
3.7
6.0
22.1
Retail HFC
9.8
7.8
2.6
0.5
2.1
0.2
1.9
0.7
1.3
12.0
15.0
Source: MOSL, Company
22 January 2018
5

Piramal Enterprises
Exhibit 11: 30%+ PAT CAGR over FY17-20E
PAT (INR b)
74
Growth (%)
Exhibit 12: RoA to remain in excess of 3%
RoA (%)
30.5
21.1
22
21.6
RoE (%)
38
24
4.3
FY15
5.3
FY16
9.2
FY17
12.8
FY18E
40
18.9
19.1
17.9
FY19E
21.8
FY20E
5.6
FY16
4.6
FY17
3.7
FY18E
3.6
FY19E
3.2
FY20E
Source: Company, MOSL
Finding opportunities for
shareholder value creation
Partnerships to capitalize on several untapped opportunities
Special situations:
PIEL has a strategic alliance with APG for mezzanine lending
in special situations in the infrastructure segment. Both entities have committed
to USD375m under this alliance. Total outstanding disbursements under this
fund are INR10b (for each entity) as of September 2017.
Real estate financing:
The company entered into a joint venture with CPPIB in
FY14 to provide INR debt financing to residential projects in urban geographies.
It also entered into an alliance with Ivanhoe Cambridge in February 2017 for
providing equity financing to tier-I residential developers across the top five
metros in India.
Distressed asset investing:
PIEL has also partnered with Bain Capital Credit to
make debt/equity investments in restructuring/distressed situations (barring
real estate) in India. Each party has committed to an initial contribution of
USD200m. Investments are expected to generate an IRR of 16-18% over a period
of 4-5 years. PIEL has made several key hires for this JV.
Leverage ratio would drop
to less than 3x post the
capital raise
Well capitalized for growth; ratios favorable compared to peers
With capital infusion of INR50b plus an additional INR20b coming up soon, PIEL
will be well-capitalized to support growth in the financing business. Its
assets/equity ratio in the lending business (assuming INR40b of capital raised
will be deployed in this business) will decline from 5.6x currently to less than
3.0x. We believe PIEL will have enough equity buffer to last till ~2020.
In addition,
a comparison of key return ratios of PIEL to NBFCs engaged in
wholesale lending suggests that PIEL has a superior return profile.
Return ratios better than
most peers
Exhibit 13: PIEL has better RoA/RoE compared to peers in the lending business (FY17)
PIEL
Edelweiss
JM Financial
ABCL
Loan book (INR b)
244
276
113
333
RoA (%)
4%+
2.1
5.0
1.9
RoE (%)
25%+
18.3
18.3
14.0
Source: MOSL, Company
22 January 2018
6

Piramal Enterprises
Healthcare business on a steady path
Improvement in margin profile underway
12% sales CAGR in the
healthcare segment over
FY17-20E
Healthcare – next leg of growth
Post the sale of its domestic formulations business to Abbott in FY11, PIEL has re-
built its healthcare business. Over the last five years, healthcare revenue has grown
at a CAGR of 14% to INR38.9b (~46% of total revenue) in FY17. PIEL operates under
two broad divisions in the healthcare segment: (1) Global Pharma, which constitutes
pharma solutions & critical care (~90% of pharma revenues) and (2) Consumer
Products (~10% of pharma revenues).
Exhibit 14: Healthcare business to grow at CAGR 12% from FY17-20E
22.8
15.5
10.7
11.1
12.3
9.5
Sales (INR m)
Growth (%)
13.7
13.8
19,870
FY12
24,410
FY13
28,200
FY14
31,210
FY15
34,670
FY16
38,920
FY17
42,625
FY18E
48,445
FY19E
55,116
FY20E
Source: MOSL, Company
Global pharma margins to
expand 500bp
Recent acquisitions to boost growth
In the last two years, PIEL has invested heavily in the pharma business, spending
~INR30b to acquire seven assets across geographies. It acquired two pharma
businesses (Injectables and High Potency API; both of these are in the US), two
pharma product portfolios that contain differentiated branded generic products
from Janssen and the latest one from Mallinckrodt. In the consumer products
portfolio in India, it acquired four brands from Pfizer, five brands from Organon
India & MSD, and the baby-care brand
Little’s.
Because of these acquisitions,
proforma revenue for FY16 would go up to INR43b from ~INR39b currently.
Similarly, EBITDA margins of global pharma business (ex-India) will jump to ~21% v/s
~16% in FY16.
Exhibit 16: Pro-forma EBITDA margin increase led by seven
acquisitions
43.2
17%
9%
10%
11%
12%
16%
20%
21%
Exhibit 15: Pro-forma revenue increase led by seven
acquisitions (INR b)
32.06
35.17
14.09
17.68
21.69
25.06
27.65
Source: Company, MOSL
22 January 2018
7

Piramal Enterprises
Global Pharma
In 2QFY18, PIEL posted robust 24% YoY growth to INR11.1b on the back of healthy
24% YoY growth in Global Pharma business and 20% YoY growth in India Consumer
business to INR1.2b. In the Global Pharma business, it has successfully completed
integration of products acquired from Mallinckrodt & Janssen and of Ash Stevens
facility. PIEL is expected to launch Desflurane in the next few months, which has a
USD200m market in the USA. Currently, there is no generic substitute for the
product in the US. PIEL’s three other inhalation products, Isoflurane, Sevoflurane
and Halothane, have three global competitors and some emerging market
competitors, and PIEL is the 3rd largest player (IMS data). Sevofluran is the largest
contributor in the segment, followed by Isoflurane and Halothane.
Exhibit 17: Global Pharma capacity expansion plans
Amount
(million)
USD55
USD4
USD25
Expansion plan
API manufacturing capabilities & capacities in North America and Asia. To support commercialization of 80+ products which
are in phase II or beyond
Sanctioned capex at Ahmedabad's formulation facility to carter to big pharma companies
Phase I expansion plan at Lexington on track and expect new high speed filing line for liquid injectables
Source: Company, MOSL
PIEL has reported 15% CAGR in the last five years in its Global Pharma business and
we expect this growth to continue going forward. We expect this business to deliver
~12% CAGR over FY17-20 on the back of recent acquisition (leading to an increase in
the addressable market size to USD20b in FY18 from USD1b in FY16), launch of
Desflurane and ramp-up in CRAMs business. The company’s EBITDA margin is also
expected to improve from ~20% in FY17 to ~24% in FY20.
Consumer Products
PIEL’s Consumer Products business is the seventh largest among OTC companies in
India. The India Consumer business reported strong growth of 24% YoY in 2QFY18,
having recovered from the impact of GST, which had led to channel de-stocking in
1QFY18. Despite the hiccups of demonetization and GST, consumer offtake across
categories remained robust over the past six quarters. Though most of the channel
re-filling is complete post GST, inventory is yet to recover to pre-GST levels.
PIEL has broken even in its Consumer business in FY16 and has grown at a CAGR of
11% over FY12-17. PIEL has used the cash generated from this business to increase
its distribution network and brand creation to achieve its target of INR10b revenue
in the next three years, up from current revenue of ~INR4b.
We expect margins in this business to expand, led by positive operating leverage
(distribution expansion largely done) and sales force automation (to facilitate
efficient productivity). PIEL should deliver ~18% CAGR over FY17-20 along with
significant margin expansion to mid-teens from current low single digit EBITDA
margin.
22 January 2018
8

Piramal Enterprises
Information Management and analytics
Large underpenetrated market opportunity
Clientele includes most of
the top 50 pharma
companies
Healthcare Insight and Analytics
In CY12, PIEL acquired Decision Resources Group (DRG), primarily a provider of
syndicated content to life sciences customers. DRG provides insights to lifescience
companies, and healthcare providers and payers, through data and analytics,
research reports and knowledge-based services.
As of last year, DRG had revenue of USD182m. Its revenue has grown at a CAGR of
7% over the last five years and at 14% over the last 10 years. With over 70% of
revenue being recurring in nature, the business is characterized by strong revenue
visibility. Its clients already include most of the top 50 pharma companies.
Performance in FY17 and beyond
DRG registered 6% YoY growth in FY17, which has been modest because of a shift in
customer demand from traditional syndicated market research toward data and
analytics-driven, technology-enabled offerings. It has been heavily investing in
technology, offering enhancement, data assets and analytics capabilities. The impact
of investments is being offset by leveraging India presence, going up the value-chain
with customers and realizing cost efficiencies.
Exhibit 18: Revenue growth has averaged 7% over the last five years
Revenue (INR m)
10,196
11,563
12,224
8,993
4,827
5,227
6,462
6,496
FY10
FY11
FY12
FY13
FY14
FY15
FY16
FY17
Source: MOSL, Company
PIEL has been making
progress on all fronts
Progress made on each of the strategy legs
In the last year, DRG has taken action on each of the legs of its stated strategy.
[1] Expanding market size and geographical presence:
PIEL announced the
acquisition of Walnut Medical, a UK-based data company that will provide access to
key European hospital-level data.
[2] Continued development of cost and operational synergies:
DRG added 250+
positions in its India offices. Leveraging the India offices and reviewing the cost
structure to identify margin enhancement opportunities was a key actionable.
[3] Inorganic growth opportunities:
DRG has made four acquisitions since 2015 that
have bolstered presence in analytics, provider and payer and data capabilities.
22 January 2018
9

Piramal Enterprises
[4] Product innovation:
DRG has been making significant investments to upgrade
infrastructure across its sites and strengthen its core business applications. It
intends to embark on a digital transformation journey that would help leverage the
emerging technologies of IoT, mobile, analytics and cloud to transform operations,
enhance customer experience, improve partner and vendor relationships and
generate new revenue models.
Future roadmap
PIEL’s broad agenda for the DRG business is to grow the business further and
improve margins from current levels. It would drive revenue growth through a
broadening of addressable market into the payer/provider space in addition to its
core life sciences customer base.
Exhibit 19: Addressable market significantly higher compared to the USD2b when acquired
Healthcare services /
Solution areas
Market research
Consulting services
Data and analytics
Total
Life sciences
3.0
2.7
4.5
10.2
Provider
0.3
0.6
2.4
3.3
Payer
0.5
0.8
1.5
2.8
Total
3.8
4.1
8.4
16.3
Source: MOSL, Company
Addressable market significantly higher compared to the USD2b when
acquired
Organically, it will continue transforming its offerings towards higher-end value-
added solutions by leveraging proprietary data and analytics tools; and further
invest in developing its consulting skills and talent pool.
On the profitability front, it intend to continue leveraging India to improve the
overall cost structure. Of the 1,083 employees it has, 250+ are located in India, in
DRG’s Bengaluru and Gurugram offices.
22 January 2018
10

Piramal Enterprises
Valuation and view
Increasing TP to factor in capital raise and roll-over to FY20E
Post the sale of its domestic formulations business, PIEL has invested in fast-growing,
profitable businesses. Starting with wholesale lending from scratch, it has now grown
to become one of the top players in real estate financing. It is now diversifying its loan
book to support growth as well as mitigate risk on the balance sheet.
With cumulative capital infusion of INR70b over FY17-19 (CCD + rights issue), PIEL will
be very well-capitalized to deliver 35% loan book CAGR over FY18-20E. At the same
time, with a net-worth of INR240b+ by FY19, PIEL would have among the largest net-
worths among NBFCs.
The investments in the Shriram group have started yielding fruit. The value of the
investment in SHTF is up ~2x over the past five years while that in SCUF is up ~75%.
We use SOTP to value the business. We value the lending business at 3.2x BVPS and
the Shriram Investments at our target prices. The healthcare business and the
information management business are valued at 14x EV/EBITDA and 4x EV/sales
respectively. BUY with a TP of INR3,500.
Exhibit 20: Path to ~2x networth over FY17-19E
50
16
133
Core
Networth -
FY17
Ind-AS
adjustment
PAT - FY18
CCD issue
Dividend -
FY18
Networth - Rights issue
FY18
PAT - FY19
Dividend -
FY19
Networth -
FY19
16
6
209
244
20
23
8
Source: MOSL, Company
Exhibit 21: Networth (FY19E) of some of the largest NBFCs
537
244
195
155
146
145
121
HDFC
PIEL
BAF
IHFL
SHTF
LICHF
LTFH
Source: MOSL, Company
Exhibit 22: SOTP (FY20E based)
Lending Business
Shriram Investments
Pharma, IT and Others
Target Value
Current market cap.
Upside (%)
Value
(INR B)
437
96
165
698
569
22.7
Value
(USD B)
6.7
1.5
2.5
10.7
8.8
22.7
INR per
share
2,193
481
826
3,500
2,853
22.7
% to
Total
63
14
24
100
Rationale
3.2x PBV; ROA/ROE of ~3%/20%+ - Loan CAGR of 40% FY17-20
Based on our Target Multiple; Implied 1.8x of invested capital
Pharma EV/EBITDA 14x; IT EV/Sales of 4x
Implied 2.6x Consolidated BV
Source: MOSL, Company
22 January 2018
11

Piramal Enterprises
Valuation Matrix
Rating
66
ICICIBC*
HDFCB
AXSB
KMB*
YES
IIB
IDFC Bk
FB
DCBB
JKBK
SIB
Equitas
RBL
Private Aggregate
SBIN (cons)*
PNB
BOI
BOB
CBK
UNBK
INBK
Public Aggregate
Banks Aggregate
HDFC*
LICHF
IHFL
PNBHF
GRHF
REPCO
DEWH
Housing Finance
SHTF
MMFS
BAF
CIFC
SCUF
LTFH
MUTH
CAFL
Asset Finance
FY20E
Buy
Buy
Buy
Buy
Buy
Buy
Neutral
Buy
Neutral
Buy
Buy
Buy
Buy
Buy
Buy
Neutral
Buy
Neutral
Neutral
Buy
CMP
Mcap
P/E (x)
P/BV (x)
RoA (%)
RoE (%)
(INR) (USDb) FY18E FY19E FY20E FY18E FY19E FY20E FY18E FY19E FY20E FY18E FY19E FY20E
354
35.5
19.5 14.7 11.5
2.0
1.8
1.6
1.1
1.2
1.4
8.8
10.5 12.4
1,951 78.4
29.1 24.2 19.3
4.3
3.8
3.3
1.8
1.9
2.0
16.7 16.6 18.1
590
22.2
32.1 19.2 14.7
2.2
2.0
1.8
0.7
1.1
1.2
7.3
10.8 12.7
1,060 30.6
32.4 25.5 19.6
4.3
3.7
3.1
1.6
1.7
1.8
13.2 14.3 15.8
348
12.5
19.1 14.6 11.3
3.2
2.7
2.2
1.7
1.7
1.8
17.6 19.9 21.5
1,683 15.8
27.6 21.3 16.6
4.4
3.7
3.1
1.8
1.9
1.9
17.0 19.1 20.7
59
3.1
19.5 18.2 14.9
1.3
1.2
1.1
0.8
0.8
0.9
6.8
6.9
7.9
103
2.8
18.9 15.8 12.6
1.6
1.5
1.3
0.8
0.8
0.9
9.4
9.8
11.3
189
0.9
25.7 21.0 17.3
2.3
2.1
1.9
0.8
0.9
0.9
10.1 10.4 11.3
76
0.6
9.1
5.7
4.4
0.7
0.7
0.6
0.5
0.7
0.7
8.4
12.3 14.2
32
0.9
16.7
8.5
6.5
1.2
1.1
0.9
0.4
0.8
0.9
6.9
12.7 14.8
155
0.8
89.5 27.0 15.7
2.3
2.1
1.9
0.6
1.6
2.0
2.6
8.2
12.8
525
3.1
32.7 23.2 17.4
3.4
3.0
2.6
1.2
1.3
1.3
12.4 13.7 16.1
309
176
165
166
362
141
381
41.8
5.9
2.7
6.0
3.1
1.5
2.9
24.2 14.0
16.7
9.3
-139.3 33.5
9.2
7.3
12.8
5.3
7.7
4.8
11.1
9.9
8.2
7.3
16.1
5.6
3.6
3.1
9.0
1.1
1.0
0.7
1.0
0.8
0.5
1.2
1.0
0.9
0.7
0.9
0.7
0.4
1.1
1.0
0.8
0.7
0.8
0.6
0.4
1.0
0.3
0.3
0.0
0.4
0.3
0.3
0.7
0.5
0.5
0.1
0.5
0.6
0.4
0.7
0.8
0.5
0.2
0.6
0.8
0.6
0.7
5.3
5.3
-0.4
6.4
5.0
5.9
10.9
8.0
9.0
1.8
9.4
11.3
9.1
11.2
13.1
10.4
3.6
10.9
14.7
12.6
11.3
Buy
Neutral
Buy
Buy
Neutral
Buy
Buy
Buy
Buy
Buy
Buy
Buy
Buy
Neutral
Buy
1,900
562
1,301
1,303
691
682
612
1,428
469
1,702
1,320
2,041
172
434
765
46.9
4.4
8.6
3.4
4.0
0.7
3.0
5.1
4.5
15.3
3.2
2.1
4.9
2.7
1.2
28.1
14.1
15.6
24.8
70.1
19.0
16.5
17.7
34.8
37.2
22.3
17.6
23.2
10.2
23.3
21.7
12.4
12.2
19.6
58.9
16.3
13.5
13.4
25.1
26.7
19.2
14.0
15.7
10.3
17.5
18.5
10.4
9.8
14.7
47.4
13.6
10.8
11.2
20.3
19.6
15.7
11.7
12.8
9.0
13.5
4.9
2.2
4.1
3.5
20.9
3.2
2.2
2.5
3.2
6.0
4.0
2.4
3.4
2.2
2.9
3.5
2.0
3.6
3.1
17.2
2.7
1.9
2.2
3.0
5.0
3.4
2.1
2.9
1.9
2.5
3.1
1.7
3.1
2.6
14.1
2.3
1.7
1.9
2.7
4.1
2.9
1.8
2.4
1.6
2.2
1.9
1.4
3.2
1.7
2.4
2.3
1.2
2.7
1.8
3.5
3.0
3.3
1.7
5.4
1.7
1.9
1.4
3.1
1.5
2.4
2.3
1.2
3.1
2.1
3.6
3.0
3.6
2.2
5.0
1.8
1.9
1.5
3.1
1.5
2.4
2.3
1.2
3.3
2.2
3.7
3.1
3.7
2.3
5.1
1.9
19.1
16.9
27.6
15.0
32.7
18.1
13.9
15.1
10.7
20.2
19.6
14.3
15.8
23.8
13.2
18.3
16.9
31.0
16.7
32.1
17.9
15.2
17.4
12.2
20.4
19.2
15.9
19.6
19.9
15.4
18.0
17.4
33.8
19.4
32.7
18.0
16.5
18.3
13.9
23.1
19.8
16.6
20.4
19.6
17.2
22 January 2018
12

Piramal Enterprises
Financials and valuations - Consolidated
INCOME STATEMENT
FY13
FY14
FY15
Revenues
35,440
45,030
51,230
Change (%)
50.7
27.1
13.8
HealthCare
24,410
28,200
31,210
Financial Services
3,930
7,260
9,371
HFC Business
0
0
0
Info Mgmt
6,510
8,900
10,196
Others
590
670
453
EBITDA*
4,523
4,300
8,698
Change (%)
33.8
-4.9
102.3
HealthCare
100
933
299
Financial Services #
2,796
2,110
6,575
HFC Business #
0
0
0
Info Mgmt
1,628
1,257
1,824
Depreciation
2,096
2,469
2,899
HealthCare
1,457
1,560
1,927
Financial Services
6
14
17
Info Mgmt
633
896
954
EBIT*
2,427
1,831
5,799
Change (%)
16.2
-24.6
216.7
HealthCare
-1,358
-626
-1,628
Financial Services #
2,790
2,096
6,557
HFC Business #
0
0
0
Info Mgmt
995
361
870
Unallocated Inc/(Exp)
-4,001
-6,192
-2,407
Core PBT
-1,574
-4,361
3,392
Change (%)
-224.3
177.2
-177.8
Exceptional Items
-191
14
26,962
Reported PBT
-1,765
-4,348
30,354
Taxes
248
628
3,450
Tax Rate (%)
-14.0
-14.4
11.4
PAT
-2,013
-4,975
26,904
Change (%)
-274.6
147.2
-640.8
Minority Interest
56
8
-3
Share from Asso. Co
-42
-31
1,593
PAT Post MI
-2,111
-5,014
28,500
Change (%)
-289.3
137.6
-668.4
Dividend (Including Tax)
3,533
10,599
4,154
* Ex Exceptional, # Post interest expenses; FY16 & FY17 nos based on IND AS
BALANCE SHEET
Y/E MARCH
Equity Share Capital
Reserves and Surplus
Networth
Borrowings
Change (%)
Other liabilities
Change (%)
Total Liabilities
Loans+Investments
Change (%)
Goodwill
Fixed Assets
Other assets
Change (%)
Total Assets
FY13
345
106,891
107,236
76,881
275.6
18,404
26.0
202,521
114,613
-2.6
40,045
20,768
27,094
204.4
202,521
FY14
345
92,866
93,211
95,519
24.2
26,316
43.0
215,045
111,406
-2.8
44,236
22,585
36,818
35.9
215,045
FY15
345
133,910
134,255
71,863
-24.8
13,908
-47.2
220,026
125,696
12.8
49,437
18,298
26,595
-27.8
220,026
FY16
63,815
24.6
34,670
17,397
0
11,559
188
13,726
57.8
3,266
8,185
0
2,276
2,554
2,115
26
414
11,172
92.6
1,151
8,159
0
1,862
-4,028
7,144
110.6
457
7,600
495
6.5
7,105
-73.6
0
1,942
9,047
-68.3
3,635
FY17E
85,468
33.9
38,920
33,515
0
12,224
809
22,506
64.0
6,338
14,239
0
1,929
3,817
2,904
24
889
18,689
67.3
3,434
14,216
0
1,040
-5,487
13,202
84.8
-100
13,103
2,281
17.4
10,821
52.3
-3
1,699
12,523
38.4
4,227
FY18E
108,856
27.4
42,625
50,007
1,725
13,691
809
31,009
37.8
8,341
19,681
523
2,464
5,118
4,154
25
939
25,891
38.5
4,187
19,656
523
1,525
-7,429
18,462
39.8
0
18,462
4,615
25.0
13,846
28.0
0
2,463
16,309
30.2
5,545
FY19E
140,159
28.8
48,445
71,035
4,538
15,334
809
41,918
35.2
10,502
27,505
1,150
2,760
5,418
4,404
25
989
36,499
41.0
6,098
27,480
1,150
1,771
-7,629
28,870
56.4
0
28,870
9,239
32.0
19,632
41.8
0
3,195
22,827
40.0
7,761
(INR M)
FY20E
174,318
24.4
55,116
93,370
7,850
17,174
809
50,921
21.5
12,489
33,534
1,807
3,091
5,718
4,654
25
1,039
45,203
23.8
7,835
33,509
1,807
2,052
-7,829
37,374
29.5
0
37,374
11,960
32.0
25,415
29.5
0
3,828
29,243
28.1
10,235
(INR M)
FY19E
399
262,764
263,163
776,766
31.4
51,686
24.2
1,091,615
880,514
29.7
54,272
72,209
84,620
8.0
1,091,615
FY16
345
129,138
129,484
162,788
126.5
17,526
26.0
309,798
198,500
57.9
54,854
23,949
32,495
22.2
309,798
FY17E
345
148,481
148,826
304,510
87.1
29,058
65.8
482,394
325,163
63.8
54,272
54,251
48,707
49.9
482,394
FY18E
382
208,708
209,090
423,524
39.1
34,133
17.5
666,746
497,563
53.0
54,272
59,677
55,235
13.4
666,746
FY19E
399
243,756
244,155
591,326
39.6
41,629
22.0
877,110
678,873
36.4
54,272
65,644
78,320
41.8
877,110
22 January 2018
13

Piramal Enterprises
Financials and valuations – NBFC business
INCOME STATEMENT
Y/E MARCH
Interest Income
Interest Expense
Net interest income
Change (%)
AMC Fees
Fee income
Other income
Net Income
Change (%)
Operating Expenses
Change (%)
Operating Profits
Change (%)
Total Provisions
% to operating income
PBT
Tax
Tax Rate (%)
PAT
Change (%)
BALANCE SHEET
Y/E MARCH
Networth
Borrowings
Change (%)
Other liabilities
Change (%)
Total Liabilities
Customer assets
Change (%)
Other assets
Change (%)
Total Assets
RATIOS
Y/E MARCH
Spreads Analysis (%)
Avg. Yield on loans
Avg. Cost of funds
Interest Spreads
Net Interest Margins
Profitability Ratios (%)
RoE
RoA
Cost to Income Ratio
2015
7,505
505
7,000
1,201
381
284
8,866
1,836
7,030
473
6.7
6,557
2,295
35.0
4,262
2016
14,894
5,857
9,037
29.1
1,287
891
326
11,540
30.2
1,849
0.7
9,691
37.8
1,532
15.8
8,159
2,856
35.0
5,303
24.4
2017E
30,116
15,945
14,171
56.8
1,191
1,872
336
17,570
52.3
1,469
-20.6
16,101
66.2
1,886
11.7
14,216
4,975
35.0
9,240
74.2
2018E
45,201
23,125
22,076
55.8
1,155
3,172
479
26,882
53.0
2,151
46.4
24,732
53.6
5,075
20.5
19,656
6,880
35.0
12,777
38.3
2019E
64,416
33,018
31,398
42.2
1,328
4,685
606
38,017
41.4
3,041
41.4
34,975
41.4
7,496
21.4
27,480
9,618
35.0
17,862
39.8
(INR Million)
2020E
84,853
46,016
38,837
23.7
1,527
6,285
704
47,354
24.6
3,788
24.6
43,566
24.6
10,057
23.1
33,509
11,728
35.0
21,781
21.9
2015
22,507
31,078
0
53,585
47,660
5,925
53,585
2016
27,811
109,052
250.9
0
136,862
130,480
173.8
6,382
7.7
136,862
2017E
32,784
231,789
112.5
0
264,574
244,000
87.0
20,574
222.4
264,574
2018E
85,561
312,320
34.7
19,847
417,728
390,400
60.0
27,328
32.8
417,728
2019E
103,423
464,576
48.8
16,820
-15.2
584,819
546,560
40.0
38,259
40.0
584,819
2020E
125,204
618,159
33.1
16,902
0.5
760,265
710,528
30.0
49,737
30.0
760,265
2015
2016
2017E
16.1
9.4
6.7
7.6
2018E
14.3
8.5
5.8
7.0
2019E
13.8
8.5
5.3
6.7
2020E
13.5
8.5
5.0
6.2
30.5
4.6
8.4
21.6
3.7
8.0
18.9
3.6
8.0
19.1
3.2
8.0
22 January 2018
14

Disclosures:
The following Disclosures are being made in compliance with the SEBI Research Analyst Regulations 2014 (herein after referred to as the Regulations).
Motilal Oswal Securities Ltd. (MOSL) is a SEBI Registered Research Analyst having registration no. INH000000412. MOSL, the Research Entity (RE) as defined in the Regulations, is engaged in the business of providing Stock
broking services, Investment Advisory Services, Depository participant services & distribution of various financial products. MOSL is a subsidiary company of Motilal Oswal Financial Service Ltd. (MOFSL). MOFSL is a listed
public company, the details in respect of which are available on
www.motilaloswal.com.
MOSL is registered with the Securities & Exchange Board of India (SEBI) and is a registered Trading Member with National Stock
Exchange of India Ltd. (NSE) and Bombay Stock Exchange Limited (BSE), Metropolitan Stock Exchange Of India Ltd. (MSE) for its stock broking activities & is Depository participant with Central Depository Services Limited
(CDSL) & National Securities Depository Limited (NSDL) and is member of Association of Mutual Funds of India (AMFI) for distribution of financial products. Details of associate entities of Motilal Oswal Securities Limited are
available on the website at
http://onlinereports.motilaloswal.com/Dormant/documents/Associate%20Details.pdf
Pending Regulatory Enquiries against Motilal Oswal Securities Limited by SEBI:
SEBI pursuant to a complaint from client Shri C.R. Mohanraj alleging unauthorized trading, issued a letter dated 29th April 2014 to MOSL notifying appointment of an Adjudicating Officer as per SEBI regulations to hold
inquiry and adjudge violation of SEBI Regulations; MOSL requested SEBI to provide all documents, records, investigation report relied upon by SEBI which were referred in Show Cause Notice. The matter is currently
pending.
MOSL, it’s associates, Research Analyst or their relative may have any financial interest in the subject company. MOSL and/or its associates and/or Research Analyst may have beneficial ownership of 1% or more securities in
the subject company at the end of the month immediately preceding the date of publication of the Research Report.
MOSL and its associate company(ies), their directors and Research Analyst and their relatives may; (a)
from time to time, have a long or short position in, act as principal in, and buy or sell the securities or derivatives thereof of companies mentioned herein. (b) be engaged in any other transaction involving such securities and
earn brokerage or other compensation or act as a market maker in the financial instruments of the company(ies) discussed herein or act as an advisor or lender/borrower to such company(ies) or may have any other
potential conflict of interests with respect to any recommendation and other related information and opinions.; however the same shall have no bearing whatsoever on the specific recommendations made by the analyst(s),
as the recommendations made by the analyst(s) are completely independent of the views of the associates of MOSL even though there might exist an inherent conflict of interest in some of the stocks mentioned in the
research report.
Research Analyst may have served as director/officer, etc. in the subject company in the last 12 month period. MOSL and/or its associates may have received any compensation from the subject company in
the past 12 months.
In the last 12 months period ending on the last day of the month immediately preceding the date of publication of this research report, MOSL or any of its associates may have:
a)
managed or co-managed public offering of securities from subject company of this research report,
b)
received compensation for investment banking or merchant banking or brokerage services from subject company of this research report,
c)
received compensation for products or services other than investment banking or merchant banking or brokerage services from the subject company of this research report.
d)
Subject Company may have been a client of MOSL or its associates during twelve months preceding the date of distribution of the research report.
MOSL and it’s associates have not received any compensation or other benefits from the subject company or third party in connection with the research report. To enhance transparency, MOSL has incorporated a Disclosure
of Interest Statement in this document. This should, however, not be treated as endorsement of the views expressed in the report. MOSL and / or its affiliates do and seek to do business including investment banking with
companies covered in its research reports. As a result, the recipients of this report should be aware that MOSL may have a potential conflict of interest that may affect the objectivity of this report. Compensation of Research
Analysts is not based on any specific merchant banking, investment banking or brokerage service transactions.
Terms & Conditions:
This report has been prepared by MOSL and is meant for sole use by the recipient and not for circulation. The report and information contained herein is strictly confidential and may not be altered in any way, transmitted to,
copied or distributed, in part or in whole, to any other person or to the media or reproduced in any form, without prior written consent of MOSL. The report is based on the facts, figures and information that are considered
true, correct, reliable and accurate. The intent of this report is not recommendatory in nature. The information is obtained from publicly available media or other sources believed to be reliable. Such information has not
been independently verified and no guaranty, representation of warranty, express or implied, is made as to its accuracy, completeness or correctness. All such information and opinions are subject to change without notice.
The report is prepared solely for informational purpose and does not constitute an offer document or solicitation of offer to buy or sell or subscribe for securities or other financial instruments for the clients. Though
disseminated to all the customers simultaneously, not all customers may receive this report at the same time. MOSL will not treat recipients as customers by virtue of their receiving this report.
Analyst Certification
The views expressed in this research report accurately reflect the personal views of the analyst(s) about the subject securities or issues, and no part of the compensation of the research analyst(s) was, is, or will be directly or
indirectly related to the specific recommendations and views expressed by research analyst(s) in this report.
Piramal Enterprises
Disclosure of Interest Statement
Analyst ownership of the stock
Piramal Enterprises
No
A graph of daily closing prices of securities is available at
www.nseindia.com, www.bseindia.com.
Research Analyst views on Subject Company may vary based on Fundamental research and Technical Research. Proprietary
trading desk of MOSL or its associates maintains arm’s length distance with Research Team as all the activities are segregated from MOSL research activity and therefore it can have an independent view with regards to
subject company for which Research Team have expressed their views.
Regional Disclosures (outside India)
This report is not directed or intended for distribution to or use by any person or entity resident in a state, country or any jurisdiction, where such distribution, publication, availability or use would be contrary to law,
regulation or which would subject MOSL & its group companies to registration or licensing requirements within such jurisdictions.
For Hong Kong:
This report is distributed in Hong Kong by Motilal Oswal capital Markets (Hong Kong) Private Limited, a licensed corporation (CE AYY-301) licensed and regulated by the Hong Kong Securities and Futures Commission (SFC)
pursuant to the Securities and Futures Ordinance (Chapter 571 of the Laws of Hong Kong) “SFO”. As per SEBI (Research Analyst Regulations) 2014 Motilal Oswal Securities (SEBI Reg No. INH000000412) has an agreement with
Motilal Oswal capital Markets (Hong Kong) Private Limited for distribution of research report in Hong Kong. This report is intended for distribution only to “Professional Investors” as defined in Part I of Schedule 1 to SFO. Any
investment or investment activity to which this document relates is only available to professional investor and will be engaged only with professional investors.” Nothing here is an offer or solicitation of these securities,
products and services in any jurisdiction where their offer or sale is not qualified or exempt from registration. The Indian Analyst(s) who compile this report is/are not located in Hong Kong & are not conducting Research
Analysis in Hong Kong.
For U.S.
Motilal Oswal Securities Limited (MOSL) is not a registered broker - dealer under the U.S. Securities Exchange Act of 1934, as amended (the"1934 act") and under applicable state laws in the United States. In addition MOSL is
not a registered investment adviser under the U.S. Investment Advisers Act of 1940, as amended (the "Advisers Act" and together with the 1934 Act, the "Acts), and under applicable state laws in the United States.
Accordingly, in the absence of specific exemption under the Acts, any brokerage and investment services provided by MOSL, including the products and services described herein are not available to or intended for U.S.
persons. This report is intended for distribution only to "Major Institutional Investors" as defined by Rule 15a-6(b)(4) of the Exchange Act and interpretations thereof by SEC (henceforth referred to as "major institutional
investors"). This document must not be acted on or relied on by persons who are not major institutional investors. Any investment or investment activity to which this document relates is only available to major institutional
investors and will be engaged in only with major institutional investors. In reliance on the exemption from registration provided by Rule 15a-6 of the U.S. Securities Exchange Act of 1934, as amended (the "Exchange Act") and
interpretations thereof by the U.S. Securities and Exchange Commission ("SEC") in order to conduct business with Institutional Investors based in the U.S., MOSL has entered into a chaperoning agreement with a U.S.
registered broker-dealer, Motilal Oswal Securities International Private Limited. ("MOSIPL"). Any business interaction pursuant to this report will have to be executed within the provisions of this chaperoning agreement.
The Research Analysts contributing to the report may not be registered /qualified as research analyst with FINRA. Such research analyst may not be associated persons of the U.S. registered broker-dealer, MOSIPL, and
therefore, may not be subject to NASD rule 2711 and NYSE Rule 472 restrictions on communication with a subject company, public appearances and trading securities held by a research analyst account.
For Singapore
Motilal Oswal Capital Markets Singapore Pte Limited is acting as an exempt financial advisor under section 23(1)(f) of the Financial Advisers Act(FAA) read with regulation 17(1)(d) of the Financial Advisors Regulations and is a
subsidiary of Motilal Oswal Securities Limited in India. This research is distributed in Singapore by Motilal Oswal Capital Markets Singapore Pte Limited and it is only directed in Singapore to accredited investors, as defined in
the Financial Advisers Regulations and the Securities and Futures Act (Chapter 289), as amended from time to time. In respect of any matter arising from or in connection with the research you could contact the following
representatives of Motilal Oswal Capital Markets Singapore Pte Limited:
Disclaimer:
The report and information contained herein is strictly confidential and meant solely for the selected recipient and may not be altered in any way, transmitted to, copied or distributed, in part or in whole, to any other person
or to the media or reproduced in any form, without prior written consent. This report and information herein is solely for informational purpose and may not be used or considered as an offer document or solicitation of
offer to buy or sell or subscribe for securities or other financial instruments. Nothing in this report constitutes investment, legal, accounting and tax advice or a representation that any investment or strategy is suitable or
appropriate to your specific circumstances. The securities discussed and opinions expressed in this report may not be suitable for all investors, who must make their own investment decisions, based on their own investment
objectives, financial positions and needs of specific recipient. This may not be taken in substitution for the exercise of independent judgment by any recipient. Each recipient of this document should make such investigations
as it deems necessary to arrive at an independent evaluation of an investment in the securities of companies referred to in this document (including the merits and risks involved), and should consult its own advisors to
determine the merits and risks of such an investment. The investment discussed or views expressed may not be suitable for all investors. Certain transactions -including those involving futures, options, another derivative
products as well as non-investment grade securities - involve substantial risk and are not suitable for all investors. No representation or warranty, express or implied, is made as to the accuracy, completeness or fairness of
the information and opinions contained in this document. The Disclosures of Interest Statement incorporated in this document is provided solely to enhance the transparency and should not be treated as endorsement of the
views expressed in the report. This information is subject to change without any prior notice. The Company reserves the right to make modifications and alternations to this statement as may be required from time to time
without any prior approval. MOSL, its associates, their directors and the employees may from time to time, effect or have effected an own account transaction in, or deal as principal or agent in or for the securities
mentioned in this document. They may perform or seek to perform investment banking or other services for, or solicit investment banking or other business from, any company referred to in this report. Each of these entities
functions as a separate, distinct and independent of each other. The recipient should take this into account before interpreting the document. This report has been prepared on the basis of information that is already
available in publicly accessible media or developed through analysis of MOSL. The views expressed are those of the analyst, and the Company may or may not subscribe to all the views expressed therein. This document is
being supplied to you solely for your information and may not be reproduced, redistributed or passed on, directly or indirectly, to any other person or published, copied, in whole or in part, for any purpose. This report is not
directed or intended for distribution to, or use by, any person or entity who is a citizen or resident of or located in any locality, state, country or other jurisdiction, where such distribution, publication, availability or use would
be contrary to law, regulation or which would subject MOSL to any registration or licensing requirement within such jurisdiction. The securities described herein may or may not be eligible for sale in all jurisdictions or to
certain category of investors. Persons in whose possession this document may come are required to inform themselves of and to observe such restriction. Neither the Firm, not its directors, employees, agents or
representatives shall be liable for any damages whether direct or indirect, incidental, special or consequential including lost revenue or lost profits that may arise from or in connection with the use of the information.
The
person accessing this information specifically agrees to exempt MOSL or any of its affiliates or employees from, any and all responsibility/liability arising from such misuse and agrees not to hold MOSL or any of its affiliates or
employees responsible for any such misuse and further agrees to hold MOSL or any of its affiliates or employees free and harmless from all losses, costs, damages, expenses that may be suffered by the person accessing this
information due to any errors and delays.
Registered Office Address: Motilal Oswal Tower, Rahimtullah Sayani Road, Opposite Parel ST Depot, Prabhadevi, Mumbai-400025; Tel No.: 022-3980 4263; www.motilaloswal.com. Correspondence Address: Palm Spring
Centre, 2nd Floor, Palm Court Complex, New Link Road, Malad (West), Mumbai- 400 064. Tel No: 022 3080 1000. Compliance Officer: Neeraj Agarwal, Email Id:
na@motilaloswal.com,
Contact No.:022-30801085.
Registration details of group entities.: MOSL: SEBI Registration: INZ000158836 (BSE/NSE/MSE); CDSL: IN-DP-16-2015; NSDL: IN-DP-NSDL-152-2000; Research Analyst: INH000000412. AMFI: ARN 17397. Investment Adviser:
INA000007100. Motilal Oswal Asset Management Company Ltd. (MOAMC): PMS (Registration No.: INP000000670) offers PMS and Mutual Funds products. Motilal Oswal Wealth Management Ltd. (MOWML): PMS
(Registration No.: INP000004409) offers wealth management solutions. *Motilal Oswal Securities Ltd. is a distributor of Mutual Funds, PMS, Fixed Deposit, Bond, NCDs, Insurance and IPO products. * Motilal Oswal
Commodities Broker Pvt. Ltd. offers Commodities Products. * Motilal Oswal Real Estate Investment Advisors II Pvt. Ltd. offers Real Estate products. * Motilal Oswal Private Equity Investment Advisors Pvt. Ltd. offers Private
Equity products
22 January 2018
15