Quess Corp
BSE SENSEX
35,907
S&P CNX
11,017
1 February 2018
Update
| Sector:
Others
CMP: INR1,022
TP: INR1,300(+27%)
Acquires assets from Monster and HCL
One employment-related and one new service line
Buy
Stock Info
Bloomberg
Equity Shares (m)
52-Week Range (INR)
1, 6, 12 Rel. Per (%)
M.Cap. (INR b)
M.Cap. (USD b)
Avg Val, INRm
Free float (%)
n
QUESS IN
145
1199 / 630
-18/3/24
143.4
2.3
125.0
28.3
n
n
QUESS announced two acquisitions: (1) Monster’s India, South East Asia and Middle
East business, and (2) ‘Care Business’ of HCL Services from HCL Infosystems.
As seen in the past, valuations for both these transactions are significantly lower
than those commanded by QUESS. For Monster, that can be explained by stagnant
revenue and absence of profitability, and for the Care Business by low profitability.
Although our revenue estimates for FY19/20 have moved higher by 2.8%, a low
margin profile and cash outflow offset that, leaving our numbers unchanged.
Financials Snapshot (INR b)
2017 2018E 2019E
Y/E Mar
43.1
59.4
81.3
Net Sales
2.4
3.4
5.2
EBITDA
1.3
3.1
4.8
PAT
9.9
22.1
32.7
EPS (INR)
40.4 124.2
47.7
Gr. (%)
73.8 179.4 222.2
BV/Sh (INR)
21.0
21.7
21.0
RoE (%)
13.8
18.2
18.4
RoCE (%)
99.8
44.5
30.1
P/E (x)
13.4
5.5
4.4
P/BV (x)
Shareholding pattern (%)
As On
Dec-17 Sep-17 Dec-16
Promoter
71.7
81.5
89.0
DII
4.5
2.4
2.2
FII
7.3
5.3
4.2
Others
16.6
10.8
4.6
FII Includes depository receipts
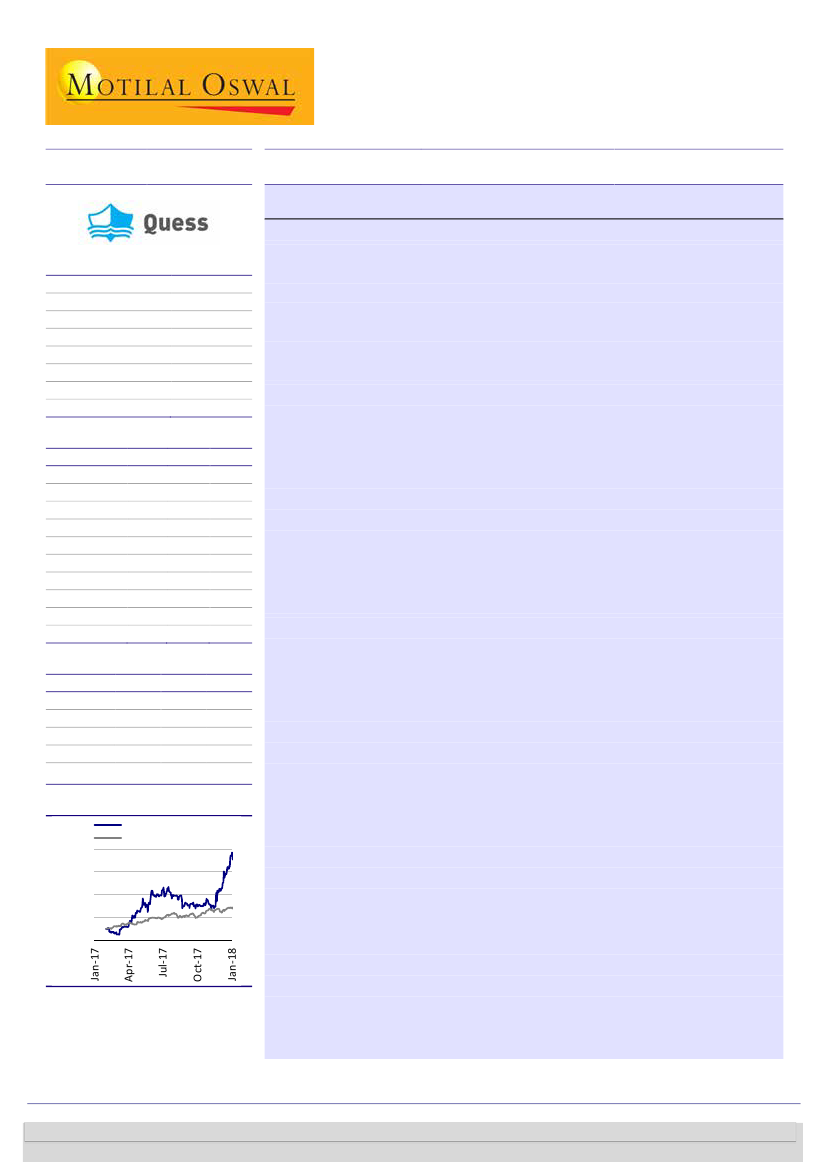
Stock Performance (1-year)
Quess corp
Sensex - Rebased
1,200
1,050
900
750
600
Transaction #1 – Monster.com
n
Monster is an online portal that provides job search services to registered users
and recruitment solutions to clients. It has a workforce of 600 across the three
geographies. Monster Worldwide is owned by Randstad.
n
The three entities together had revenue of USD26m in CY16, and have not seen
growth since CY14. Combined profitability, we reckon, would be slightly in the
red.
n
The entities would be acquired for an Enterprise Value of up to USD14m (0.5x
trailing revenue) and the transaction is expected to be completed by 4QFY18.
n
The acquisition would complement QUESS’ presence in HR services and pose
opportunities for value addition to its existing customers.
Transaction #2 – HCL Computing Products
n
The Care Business of HCL Services, a subsidiary of HCL Infosystems, is a
network of 80 walk-in centers, >200 authorized service providers and a
workforce of over 1,400, involved in after-sales services for mobile phones,
consumer electronics and consumer durables.
n
The business clocked INR1.9b in revenue in FY17 and has exhibited 20% CAGR
over the last two years. Given a high pass-through component in the business,
margins would be in low single digits.
n
It is being acquired for a cash consideration of up to INR300m (0.2x trailing
revenue, ~5x trailing EBITDA).
n
The acquisition will add a new service line for QUESS, opening up opportunities
in the aftermarket space. Its existing relationships with OEMs through other
businesses can be leveraged to further scale up the business.
Maintain Buy
We value QUESS using DCF to arrive at a TP of INR1,300 (27% upside); our TP is
unchanged by the acquisition. Valuations are rich, given its strong growth history
and continued aggressive thrust on acquisitions. Over FY18-20, we expect
revenue/EBITDA/PAT CAGR of 28/37/40%, led by our assumption of 20% growth in
organic business and incremental contribution by recent acquisitions. Long-term
prospects stand bright, given high-growth opportunities, aggression shown on
expansion and flawless execution.
Maintain Buy.
Investors are advised to refer through important disclosures made at the last page of the Research Report.
Motilal Oswal research is available on www.motilaloswal.com/Institutional-Equities, Bloomberg, Thomson Reuters, Factset and S&P Capital.
Sagar Lele
(Sagar.Lele@MotilalOswal.com); +91 22 6129 1531
Ashish Chopra
(Ashish.Chopra@MotilalOswal.com); +91 22 6129 1530

Quess Corp
Exhibit 1: Key financials of Monster
Revenue (USDm)
FY15
27.2
FY16
27.5
FY17
26.1
Source: Company
Exhibit 2: Key financials of HCL’s Care Business
Revenue (INRm)
FY15
1,320
FY16
1,710
FY17
1,910
Source: Company
Change in estimates
Our revenue estimates for FY19/20 have inched up by 2.8%, assuming integration
begins from 1QFY19. However, since both these entities have lower margins than
QUESS’ 5.7% EBITDA margin for 9MFY18, our margin estimates have been adjusted
downwards by 25/15bp for FY19/20. Moreover, assuming a reduction of cash, and
consequently, lower other income, our EPS estimates remain largely unchanged.
Exhibit 3: Change in estimates
FY18E
59,444
37.8
5.1
22.1
148.6
Revised
FY19E
81,317
36.8
5.7
32.7
53.6
FY20E
96,943
19.2
6.0
41.6
27.3
FY18E
59,444
37.8
5.1
22.1
148.6
Earlier
FY19E
79,117
33.1
6.0
33.1
55.4
FY20E
94,413
19.3
6.1
41.4
25.1
FY18E
0.0%
0bp
0bp
0.0%
0bp
Change
FY19E
2.8%
370bp
-25bp
-1.1%
-172bp
FY20E
2.7%
-12bp
-14bp
0.6%
217bp
Revenue (m)
Rev. growth (%)
EBIT Margin (%)
EPS (INR)
EPS Growth (%)
Source: MOSL, Company
1 February 2018
2

Quess Corp
Valuation and view
n
n
n
n
n
QUESS operates through four key business segments: [1] Global Technology
Solutions (GTS), [2] People & Services (P&S), [3] Integrated Facility Management
(IFM), and [4] Industrials. All of these areas have been witnessing high growth,
which is expected to continue going forward as well.
In terms of penetration, it has barely scratched the surface in its core staffing
business as well as other areas. In general staffing, India’s low penetration of
0.5% of working population (versus global average of 1.6%) itself should drive
high velocity growth. In business services, QUESS intends to be part of anything
that is non-core to a business and that can be outsourced to a third party. While
it has touched upon the areas of facilities management, catering, security and
industrial asset management, the directions for further growth are ample.
Inorganic growth has been a key component for QUESS’ growth, improvement
in profitability and diversification. It has demonstrated successful integration
with margin accretion and retention of management personnel. Validation also
comes from the following:
[1] Over the last eight years, revenue at Avon (a facilities management
acquisition) has grown at a CAGR of 52% and EBITDA margin has expanded to
5.1% from 1.7% at the time of acquisition.
[2] Magna (an acquired IT staffing company) has grown at 15% CAGR since
acquisition and its margins have improved to 13% from 5.5% at the time of
acquisition.
With the strategy in place, and execution being impeccable, we expect 26%
revenue CAGR over FY18-20. This would be fueled by the current portfolio and
any inorganic activity would only add to these expectations. Over the same
period, we also expect cumulative EBITDA margin expansion of ~100bp to 6.8%.
The visibility for this comes from [1] continued improvement in profitability in
Brainhunter and MFX, which were loss-making entities, [2] addition of Manipal
Integrated Services, Terrier Security, Comtel Solutions and Vedang Cellular
Services, all of which have better margins than company average, and [3] margin
expansion in the People & Services business, led by operational leverage and
continued growth in Training & Development.
We value QUESS using a DCF to reach a price target of INR1,300, implying 27%
upside. Valuations are rich, given its strong growth history, and continued
aggressive thrust on acquisitions. Over FY18/20, we expect revenue/EBITDA/PAT
CAGR of 28/37/40%, led by our assumption of 20% growth in the organic
business and incremental contribution by recent acquisitions. The long-term
prospects of the company stand bright given the high-growth opportunities,
aggression shown on expansion and flawless execution.
Key triggers
n
n
n
GST-related pick-up driving higher growth in the general staffing business
Significant margin turnaround in Brainhunter and MFX boosting overall margins
Broad-based and consistent growth driven across business segments
1 February 2018
3

Quess Corp
Key risks
n
n
n
Integration of current/future acquisitions going wrong
Inability to manage diverse portfolio of businesses, leading to inferior growth
Economic downturn, leading to a proportional and direct impact on business
Exhibit 4: Fair value of INR1,300/share based on DCF
Discount rate
Terminal growth rate
PV FCF
PV of terminal value
NPV
Cash and cash equivalents
Deployed in acquisitions
EBITDA acquired
EBITDA in FY20
Value of acquired EBITDA
Cash not deployed
Less: Debt
Total equity value
Per share
PV FCF
PV of terminal value
NPV
Cash deployed in acquisitions
Cash not utilized
Less: Debt
Total equity value
NOSH m
CMP
Target price
Upside (%)
12.0%
5.0%
54,128
108,424
162,553
10,397
8,318
1,040
1,300
32,491
2,079
6,393
190,731
370
740
1,110
222
14
44
1,302
146
986
1,300
32%
Source: MOSL
Exhibit 5: We assume 12% WACC and 5% terminal growth rate
WACC/g
Sensitivity analysis
1,300
10%
11%
12%
13%
14%
3.00%
1,460
1,270
1,130
1,010
920
4.00%
1,610
1,380
1,200
1,070
960
5.00%
1,830
1,520
1,300
1,140
1,020
6.00%
2,150
1,720
1,430
1,230
1,080
7.00%
2,680
2,020
1,620
1,360
1,170
Source: MOSL
1 February 2018
4

Quess Corp
Story in charts
Exhibit 6: Revenue CAGR of 46% over the last five years
Revenue (INRm)
43,149
34,350
15,194
20,536
4.2%
3.0%
4.3%
4.3%
Exhibit 7: Margins have expanded by 110bp over the same
period
EBITDA margin (%)
5.1%
4.4%
5.5%
2,749
FY11
6,370
FY12
10,012
FY13
FY14
FY15
FY16
FY17
FY11
FY12
FY13
FY14
FY15
FY16
FY17
Source: Company, MOSL
Exhibit 8: Growth has been organic and driven by
acquisitions, enabling presence in multiple segments
Integrated
Facility
Manageme
nt, 17%
Industrials,
7%
Global
Technology
Solutions,
30%
Exhibit 9: Addition of higher margin businesses expected to
further improve profitability
EBIT margin (%), as of FY17
7.0%
4.6%
7.6%
6.1%
People &
Services,
46%
Source: Company, MOSL
Global
Technology
Solutions
People &
Services
Integrated Industrial Asset
Facility
Management
Management
Source: Company, MOSL
Exhibit 10: Expect a cumulative 100bp EBITDA margin
expansion over the next two years…
EBITDA margin (%)
5.5%
4.4%
5.8%
6.4%
6.7%
Exhibit 11: …consequently leading to stellar PAT growth
PAT (INRm)
159%
94%
Growth (YoY, %)
149%
6,096
72%
51%
812
FY16
54%
54%
27%
1,254 3,117 4,789
FY17
FY18E FY19E FY20E
Source: Company, MOSL
5.1%
4.3%
4.3%
121
FY13
FY14
FY15
FY16
FY17
FY18E FY19E FY20E
Source: Company, MOSL
FY13
313
FY14
538
FY15
1 February 2018
5

Quess Corp
Financials and Valuations
Income Statement
Y/E Mar
Net Sales
Change (%)
EBITDA
EBITDA Margin (%)
Depreciation
EBIT
Interest
Other Income
Extraordinary items
PBT
Tax
Tax Rate (%)
Min. Int. & Assoc. Share
Reported PAT
Adjusted PAT
Change (%)
2013
10,012
57.2
431
4.3
44
387
176
32
0
243
72
29.6
50
121
121
94.1
2014
10,060
0.5
398
4.0
42
356
88
21
0
289
97
33.7
13
179
179
48.0
2015
25,671
155.2
1,305
5.1
101
1,203
218
57
0
1,042
370
35.5
0
672
672
276.3
2016
34,350
33.8
1,511
4.4
144
1,367
310
91
0
1,147
335
29.2
0
812
812
20.8
2017
43,149
25.6
2,378
5.5
275
2,103
471
154
0
1,787
534
29.9
-1
1,254
1,254
54.5
2018E
59,444
37.8
3,434
5.8
406
3,029
665
459
0
2,823
-293
-10.4
0
3,117
3,117
148.6
(INR Million)
2019E
81,317
36.8
5,207
6.4
569
4,637
333
651
0
4,955
0
0.0
167
4,789
4,789
53.6
2020E
96,943
19.2
6,459
6.7
679
5,780
285
776
0
6,271
0
0.0
175
6,096
6,096
27.3
Balance Sheet
Y/E Mar
Share Capital
Reserves
Net Worth
Debt
Deferred Tax
Total Capital Employed
Gross Fixed Assets
Less: Acc Depreciation
Net Fixed Assets
Capital WIP
Investments
Current Assets
Inventory
Debtors
Cash & Bank
Loans & Adv, Others
Curr Liabs & Provns
Curr. Liabilities
Provisions
Net Current Assets
Total Assets
2013
300
383
682
879
-66
1,660
244
159
85
0
0
2,909
4
1,580
234
1,091
1,583
1,548
36
1,325
1,660
2014
962
884
1,846
641
-50
2,437
319
201
118
4
0
3,080
4
1,246
291
1,539
1,496
1,461
35
1,585
2,437
2015
258
2,267
2,525
2,170
-35
4,660
604
415
189
0
0
5,869
4
2,755
818
2,292
2,502
2,355
147
3,367
4,660
2016
1,133
2,433
3,566
3,783
-1,345
6,005
1,043
541
502
24
37
8,573
18
6,926
1,094
536
5,151
4,812
339
3,423
6,005
2017
1,268
7,094
8,362
7,304
-1,658
14,017
1,363
779
583
77
2,976
13,721
57
8,337
3,013
2,314
7,128
6,676
453
6,593
14,017
2018E
1,377
18,950
20,327
6,393
-1,658
25,071
1,913
1,185
728
97
2,976
25,473
57
11,856
10,397
3,162
7,991
7,367
624
17,482
25,071
(INR Million)
2019E
1,450
23,738
25,188
5,543
-1,658
29,249
2,463
1,754
709
117
5,730
29,836
57
16,219
9,261
4,300
10,931
10,078
853
18,905
29,249
2020E
1,450
29,834
31,284
4,745
-1,658
34,722
3,013
2,433
580
137
5,730
37,519
57
19,335
13,014
5,113
13,032
12,015
1,017
24,487
34,722
1 February 2018
6

Quess Corp
Financials and Valuations
Ratios
Y/E Mar
Basic (INR)
EPS
Cash EPS
Book Value
DPS
Payout (incl. Div. Tax.)
Valuation(x)
P/E
Price / Book Value
EV/Sales
EV/EBITDA
Dividend Yield (%)
Profitability Ratios (%)
RoE
RoCE
RoIC
Turnover Ratios (%)
Asset Turnover (x)
Debtors (No. of Days)
Inventory (No. of Days)
Creditors (No. of Days)
Leverage Ratios (%)
Net Debt/Equity (x)
2013
1.1
1.5
6.0
0.0
0.0
2014
1.6
1.9
16.3
0.0
0.0
2015
5.9
6.8
22.3
0.0
0.0
166.5
44.2
4.4
86.8
0.0
19.9
22.3
24.1
6.0
58
0
2
0.9
14.1
12.4
13.2
4.1
45
0
2
0.2
30.8
22.6
25.9
5.5
39
0
6
0.5
2016
7.0
8.4
31.5
0.0
0.0
140.2
31.3
3.4
77.1
0.0
26.7
17.1
22.3
5.7
74
0
7
0.7
2017
9.9
13.5
73.8
0.0
0.0
99.8
13.4
3.0
54.5
0.0
21.0
13.8
23.0
3.1
71
0
5
0.2
2018E
22.1
31.1
179.4
0.0
0.0
44.5
5.5
2.3
39.2
0.0
21.7
18.2
34.2
2.4
73
0
5
-0.3
2019E
32.7
47.3
222.2
0.0
0.0
30.1
4.4
1.7
27.0
0.0
21.0
18.4
36.0
2.8
73
0
5
-0.4
2020E
41.6
59.8
276.0
0.0
0.0
23.7
3.6
1.4
21.1
0.0
21.6
19.6
38.6
2.8
73
0
5
-0.4
Cash Flow Statement
Y/E Mar
Adjusted EBITDA
Non cash opr. exp (inc)
(Inc)/Dec in Wkg. Cap.
Tax Paid
Other operating activities
CF from Op. Activity
(Inc)/Dec in FA & CWIP
Free cash flows
(Pur)/Sale of Invt
Others
CF from Inv. Activity
Inc/(Dec) in Net Worth
Inc / (Dec) in Debt
Interest Paid
Divd Paid (incl Tax) & Others
CF from Fin. Activity
Inc/(Dec) in Cash
Add: Opening Balance
Closing Balance
2013
431
24
-454
-200
38
-161
-44
-205
0
0
-44
0
323
-174
0
148
-57
290
233
2014
398
21
-52
-249
35
153
-92
61
-657
15
-734
965
-237
-90
0
638
58
233
291
2015
1,305
64
-942
-412
9
24
-145
-120
-525
375
-295
0
1,015
-217
0
798
527
291
818
2016
1,511
91
-1,622
-482
8
-495
-226
-721
0
129
-97
34
1,137
-304
0
867
275
818
1,093
2017
2,378
4
-759
-802
-66
756
-379
376
0
-5,457
-5,836
3,704
3,726
-430
0
7,000
1,920
1,093
3,013
2018E
3,434
459
-3,504
293
459
1,142
-570
572
0
0
-570
8,848
-912
-665
-459
6,813
7,385
3,013
10,397
(INR Million)
2019E
5,207
651
-2,560
0
651
3,948
-570
3,378
-2,754
0
-3,324
73
-850
-333
-651
-1,760
-1,137
10,397
9,261
2020E
6,459
776
-1,829
0
776
6,181
-570
5,611
0
0
-570
0
-797
-285
-776
-1,858
3,753
9,261
13,014
1 February 2018
7

Explanation of Investment Rating
Investment Rating
BUY
SELL
NEUTRAL
UNDER REVIEW
NOT RATED
Expected return (over 12-month)
>=15%
< - 10%
> - 10 % to 15%
Rating may undergo a change
We have forward looking estimates for the stock but we refrain from assigning recommendation
Quess Corp
*In case the recommendation given by the Research Analyst becomes inconsistent with the investment rating legend, the Research Analyst shall within 28 days of the inconsistency, take appropriate measures to make the recommendation consistent with the investment rating legend.
Disclosures:
The following Disclosures are being made in compliance with the SEBI Research Analyst Regulations 2014 (herein after referred to as the Regulations).
Motilal Oswal Securities Ltd. (MOSL) is a SEBI Registered Research Analyst having registration no. INH000000412. MOSL, the Research Entity (RE) as defined in the Regulations, is engaged in the business of providing Stock broking services,
Investment Advisory Services, Depository participant services & distribution of various financial products. MOSL is a subsidiary company of Motilal Oswal Financial Service Ltd. (MOFSL). MOFSL is a listed public company, the details in respect of
which are available on
www.motilaloswal.com.
MOSL is registered with the Securities & Exchange Board of India (SEBI) and is a registered Trading Member with National Stock Exchange of India Ltd. (NSE) and Bombay Stock Exchange Limited
(BSE), Metropolitan Stock Exchange Of India Ltd. (MSE) for its stock broking activities & is Depository participant with Central Depository Services Limited (CDSL) & National Securities Depository Limited (NSDL) and is member of Association of
Mutual Funds of India (AMFI) for distribution of financial products. Details of associate entities of Motilal Oswal Securities Limited are available on the website at
http://onlinereports.motilaloswal.com/Dormant/documents/Associate%20Details.pdf
Regulatory Enquiries against Motilal Oswal Securities Limited by SEBI:
SEBI pursuant to a complaint from client Shri C.R. Mohanraj alleging unauthorized trading, issued a letter dated 29th April 2014 to MOSL notifying appointment of an Adjudicating Officer as per SEBI regulations to hold inquiry and
adjudge violation of SEBI Regulations; MOSL requested SEBI to provide all documents, records, investigation report relied upon by SEBI which were referred in Show Cause Notice. The matter is closed and MOSL had to pay Rs. 2
lakhs towards penalty for misplacement of original POA of client.
MOSL, it’s associates, Research Analyst or their relative may have any financial interest in the subject company. MOSL and/or its associates and/or Research Analyst may have beneficial ownership of 1% or more securities in the subject company at
the end of the month immediately preceding the date of publication of the Research Report.
MOSL and its associate company(ies), their directors and Research Analyst and their relatives may; (a) from time to time, have a long or short position in, act
as principal in, and buy or sell the securities or derivatives thereof of companies mentioned herein. (b) be engaged in any other transaction involving such securities and earn brokerage or other compensation or act as a market maker in the financial
instruments of the company(ies) discussed herein or act as an advisor or lender/borrower to such company(ies) or may have any other potential conflict of interests with respect to any recommendation and other related information and opinions.;
however the same shall have no bearing whatsoever on the specific recommendations made by the analyst(s), as the recommendations made by the analyst(s) are completely independent of the views of the associates of MOSL even though there
might exist an inherent conflict of interest in some of the stocks mentioned in the research report.
Research Analyst may have served as director/officer, etc. in the subject company in the last 12 month period. MOSL and/or its associates may have
received any compensation from the subject company in the past 12 months.
In the last 12 months period ending on the last day of the month immediately preceding the date of publication of this research report, MOSL or any of its associates may have:
a)
managed or co-managed public offering of securities from subject company of this research report,
b)
received compensation for investment banking or merchant banking or brokerage services from subject company of this research report,
c)
received compensation for products or services other than investment banking or merchant banking or brokerage services from the subject company of this research report.
d)
Subject Company may have been a client of MOSL or its associates during twelve months preceding the date of distribution of the research report.
MOSL and it’s associates have not received any compensation or other benefits from the subject company or third party in connection with the research report. To enhance transparency, MOSL has incorporated a Disclosure of Interest Statement in
this document. This should, however, not be treated as endorsement of the views expressed in the report. MOSL and / or its affiliates do and seek to do business including investment banking with companies covered in its research reports. As a result,
the recipients of this report should be aware that MOSL may have a potential conflict of interest that may affect the objectivity of this report. Compensation of Research Analysts is not based on any specific merchant banking, investment banking or
brokerage service transactions.
Terms & Conditions:
This report has been prepared by MOSL and is meant for sole use by the recipient and not for circulation. The report and information contained herein is strictly confidential and may not be altered in any way, transmitted to, copied or distributed, in part
or in whole, to any other person or to the media or reproduced in any form, without prior written consent of MOSL. The report is based on the facts, figures and information that are considered true, correct, reliable and accurate. The intent of this report
is not recommendatory in nature. The information is obtained from publicly available media or other sources believed to be reliable. Such information has not been independently verified and no guaranty, representation of warranty, express or implied,
is made as to its accuracy, completeness or correctness. All such information and opinions are subject to change without notice. The report is prepared solely for informational purpose and does not constitute an offer document or solicitation of offer to
buy or sell or subscribe for securities or other financial instruments for the clients. Though disseminated to all the customers simultaneously, not all customers may receive this report at the same time. MOSL will not treat recipients as customers by
virtue of their receiving this report.
Analyst Certification
The views expressed in this research report accurately reflect the personal views of the analyst(s) about the subject securities or issues, and no part of the compensation of the research analyst(s) was, is, or will be directly or indirectly related to the
specific recommendations and views expressed by research analyst(s) in this report.
Disclosure of Interest Statement
Analyst ownership of the stock
Quess Corp
No
A graph of daily closing prices of securities is available at
www.nseindia.com, www.bseindia.com.
Research Analyst views on Subject Company may vary based on Fundamental research and Technical Research. Proprietary trading desk of MOSL or
its associates maintains arm’s length distance with Research Team as all the activities are segregated from MOSL research activity and therefore it can have an independent view with regards to subject company for which Research Team have
expressed their views.
Regional Disclosures (outside India)
This report is not directed or intended for distribution to or use by any person or entity resident in a state, country or any jurisdiction, where such distribution, publication, availability or use would be contrary to law, regulation or which would subject
MOSL & its group companies to registration or licensing requirements within such jurisdictions.
For Hong Kong:
This report is distributed in Hong Kong by Motilal Oswal capital Markets (Hong Kong) Private Limited, a licensed corporation (CE AYY-301) licensed and regulated by the Hong Kong Securities and Futures Commission (SFC) pursuant to the Securities
and Futures Ordinance (Chapter 571 of the Laws of Hong Kong) “SFO”. As per SEBI (Research Analyst Regulations) 2014 Motilal Oswal Securities (SEBI Reg No. INH000000412) has an agreement with Motilal Oswal capital Markets (Hong Kong)
Private Limited for distribution of research report in Hong Kong. This report is intended for distribution only to “Professional Investors” as defined in Part I of Schedule 1 to SFO. Any investment or investment activity to which this document relates is only
available to professional investor and will be engaged only with professional investors.” Nothing here is an offer or solicitation of these securities, products and services in any jurisdiction where their offer or sale is not qualified or exempt from
registration. The Indian Analyst(s) who compile this report is/are not located in Hong Kong & are not conducting Research Analysis in Hong Kong.
For U.S.
Motilal Oswal Securities Limited (MOSL) is not a registered broker - dealer under the U.S. Securities Exchange Act of 1934, as amended (the"1934 act") and under applicable state laws in the United States. In addition MOSL is not a registered
investment adviser under the U.S. Investment Advisers Act of 1940, as amended (the "Advisers Act" and together with the 1934 Act, the "Acts), and under applicable state laws in the United States. Accordingly, in the absence of specific exemption
under the Acts, any brokerage and investment services provided by MOSL, including the products and services described herein are not available to or intended for U.S. persons. This report is intended for distribution only to "Major Institutional
Investors" as defined by Rule 15a-6(b)(4) of the Exchange Act and interpretations thereof by SEC (henceforth referred to as "major institutional investors"). This document must not be acted on or relied on by persons who are not major institutional
investors. Any investment or investment activity to which this document relates is only available to major institutional investors and will be engaged in only with major institutional investors. In reliance on the exemption from registration provided by Rule
15a-6 of the U.S. Securities Exchange Act of 1934, as amended (the "Exchange Act") and interpretations thereof by the U.S. Securities and Exchange Commission ("SEC") in order to conduct business with Institutional Investors based in the U.S.,
MOSL has entered into a chaperoning agreement with a U.S. registered broker-dealer, Motilal Oswal Securities International Private Limited. ("MOSIPL"). Any business interaction pursuant to this report will have to be executed within the provisions of
this chaperoning agreement.
The Research Analysts contributing to the report may not be registered /qualified as research analyst with FINRA. Such research analyst may not be associated persons of the U.S. registered broker-dealer, MOSIPL, and therefore, may not be subject
to NASD rule 2711 and NYSE Rule 472 restrictions on communication with a subject company, public appearances and trading securities held by a research analyst account.
For Singapore
Motilal Oswal Capital Markets Singapore Pte Limited is acting as an exempt financial advisor under section 23(1)(f) of the Financial Advisers Act(FAA) read with regulation 17(1)(d) of the Financial Advisors Regulations and is a subsidiary of Motilal
Oswal Securities Limited in India. This research is distributed in Singapore by Motilal Oswal Capital Markets Singapore Pte Limited and it is only directed in Singapore to accredited investors, as defined in the Financial Advisers Regulations and the
Securities and Futures Act (Chapter 289), as amended from time to time. In respect of any matter arising from or in connection with the research you could contact the following representatives of Motilal Oswal Capital Markets Singapore Pte Limited:
Disclaimer:
The report and information contained herein is strictly confidential and meant solely for the selected recipient and may not be altered in any way, transmitted to, copied or distributed, in part or in whole, to any other person or to the media or reproduced
in any form, without prior written consent. This report and information herein is solely for informational purpose and may not be used or considered as an offer document or solicitation of offer to buy or sell or subscribe for securities or other financial
instruments. Nothing in this report constitutes investment, legal, accounting and tax advice or a representation that any investment or strategy is suitable or appropriate to your specific circumstances. The securities discussed and opinions expressed in
this report may not be suitable for all investors, who must make their own investment decisions, based on their own investment objectives, financial positions and needs of specific recipient. This may not be taken in substitution for the exercise of
independent judgment by any recipient. Each recipient of this document should make such investigations as it deems necessary to arrive at an independent evaluation of an investment in the securities of companies referred to in this document
(including the merits and risks involved), and should consult its own advisors to determine the merits and risks of such an investment. The investment discussed or views expressed may not be suitable for all investors. Certain transactions -including
those involving futures, options, another derivative products as well as non-investment grade securities - involve substantial risk and are not suitable for all investors. No representation or warranty, express or implied, is made as to the accuracy,
completeness or fairness of the information and opinions contained in this document. The Disclosures of Interest Statement incorporated in this document is provided solely to enhance the transparency and should not be treated as endorsement of the
views expressed in the report. This information is subject to change without any prior notice. The Company reserves the right to make modifications and alternations to this statement as may be required from time to time without any prior approval.
MOSL, its associates, their directors and the employees may from time to time, effect or have effected an own account transaction in, or deal as principal or agent in or for the securities mentioned in this document. They may perform or seek to perform
investment banking or other services for, or solicit investment banking or other business from, any company referred to in this report. Each of these entities functions as a separate, distinct and independent of each other. The recipient should take this
into account before interpreting the document. This report has been prepared on the basis of information that is already available in publicly accessible media or developed through analysis of MOSL. The views expressed are those of the analyst, and
the Company may or may not subscribe to all the views expressed therein. This document is being supplied to you solely for your information and may not be reproduced, redistributed or passed on, directly or indirectly, to any other person or
published, copied, in whole or in part, for any purpose. This report is not directed or intended for distribution to, or use by, any person or entity who is a citizen or resident of or located in any locality, state, country or other jurisdiction, where such
distribution, publication, availability or use would be contrary to law, regulation or which would subject MOSL to any registration or licensing requirement within such jurisdiction. The securities described herein may or may not be eligible for sale in all
jurisdictions or to certain category of investors. Persons in whose possession this document may come are required to inform themselves of and to observe such restriction. Neither the Firm, not its directors, employees, agents or representatives shall
be liable for any damages whether direct or indirect, incidental, special or consequential including lost revenue or lost profits that may arise from or in connection with the use of the information.
The person accessing this information specifically agrees
to exempt MOSL or any of its affiliates or employees from, any and all responsibility/liability arising from such misuse and agrees not to hold MOSL or any of its affiliates or employees responsible for any such misuse and further agrees to hold MOSL
or any of its affiliates or employees free and harmless from all losses, costs, damages, expenses that may be suffered by the person accessing this information due to any errors and delays.
Registered Office Address: Motilal Oswal Tower, Rahimtullah Sayani Road, Opposite Parel ST Depot, Prabhadevi, Mumbai-400025; Tel No.: 022-3980 4263; www.motilaloswal.com. Correspondence Address: Palm Spring Centre, 2nd Floor, Palm
Court Complex, New Link Road, Malad (West), Mumbai- 400 064. Tel No: 022 3080 1000. Compliance Officer: Neeraj Agarwal, Email Id:
na@motilaloswal.com,
Contact No.:022-30801085.
Registration details of group entities.: MOSL: SEBI Registration: INZ000158836 (BSE/NSE/MSE); CDSL: IN-DP-16-2015; NSDL: IN-DP-NSDL-152-2000; Research Analyst: INH000000412. AMFI: ARN 17397. Investment Adviser: INA000007100.
Motilal Oswal Asset Management Company Ltd. (MOAMC): PMS (Registration No.: INP000000670) offers PMS and Mutual Funds products. Motilal Oswal Wealth Management Ltd. (MOWML): PMS (Registration No.: INP000004409) offers wealth
management solutions. *Motilal Oswal Securities Ltd. is a distributor of Mutual Funds, PMS, Fixed Deposit, Bond, NCDs, Insurance and IPO products. * Motilal Oswal Commodities Broker Pvt. Ltd. offers Commodities Products. * Motilal Oswal Real
Estate Investment Advisors II Pvt. Ltd. offers Real Estate products. * Motilal Oswal Private Equity Investment Advisors Pvt. Ltd. offers Private Equity products
1 February 2018
8