5 February 2018
Market snapshot
Equities - India
Close
Chg .%
Sensex
35,067
-2.3
Nifty-50
10,761
-2.3
Nifty-M 100
19,760
-4.3
Equities-Global
Close
Chg .%
S&P 500
2,762
-2.1
Nasdaq
7,241
-2.0
FTSE 100
7,443
-0.6
DAX
12,785
-1.7
Hang Seng
13,539
0.8
Nikkei 225
23,275
-0.9
Commodities
Close
Chg .%
Brent (US$/Bbl)
68
-2.5
Gold ($/OZ)
1,333
-1.2
Cu (US$/MT)
7,004
-1.0
Almn (US$/MT)
2,210
-0.7
Currency
Close
Chg .%
USD/INR
64.1
0.1
USD/EUR
1.2
-0.4
USD/JPY
110.2
0.7
YIELD (%)
Close
1MChg
10 Yrs G-Sec
7.6
-0.04
10 Yrs AAA Corp
8.2
-0.15
Flows (USD b)
2-Feb
MTD
FIIs
0.1
2.2
DIIs
-0.1
0.0
Volumes (INRb)
2-Feb
MTD*
Cash
534
504
F&O
7,244
11,166
Note: YTD is calendar year, *Avg
YTD.%
3.0
2.2
-6.5
YTD.%
3.3
4.9
-3.2
-1.0
15.6
2.2
YTD.%
1.8
2.3
-2.8
-2.1
YTD.%
0.3
3.8
-2.2
YTDchg
0.2
0.3
YTD
2.2
-0.1
YTD*
433
7,601
Today’s top research idea
Bajaj Finance: Growth outlook remains healthy; Pressure on
LAP continues
Bajaj Finance (BAF) had a strong quarter with 35% YoY AUM growth, modest
margin uptick (due to higher capital), and stable asset quality.
From a customer base of 25m currently, management targets to reach 75m
over the next five years. BAF already has a database of 30m people who are
mass affluent but not yet customers of the company – management would like
to tap around half of them. Tie up with RBL is showing strong traction and it has
already issued 0.25m cards and target to end with 1m cards by end of CY18.
Management has infused INR12b in the HFC subsidiary, taking its net-worth to
INR15.5b. Over the next 5 years, this could be an INR600-700b balance sheet,
as per management.
Research covered
Cos/Sector
Bulls & Bears
Bajaj Auto
Bajaj Finance
Hindalco Inds
Ashok Leyland
United Breweries
Cummins India
MRPL
GSK Pharma
Other Results
Automobiles
Results Expectation
Key Highlights
India Valuations Handbook — Markets extend stellar gains of CY17
Revenue in-line; lower other income, higher tax dents PAT
Growth outlook remains healthy; Pressure on LAP continues
Stable performance in India; Novelis getting stronger
Product mix, operating leverage and higher exports drive margins
Multi-year high-double-digit volume growth
Operational performance disappoints
EBITDA significantly above estimate; core GRM at USD6.8/bbl
Pick-up seen in Recruitment and 99acres
INFOE | GUJGA | UNBK | JKCE | CEAT | JKLC | BSE | JKBK
Bajaj Auto | Hero MotoCorp
BOS | CLGT | ENIL | TTMT
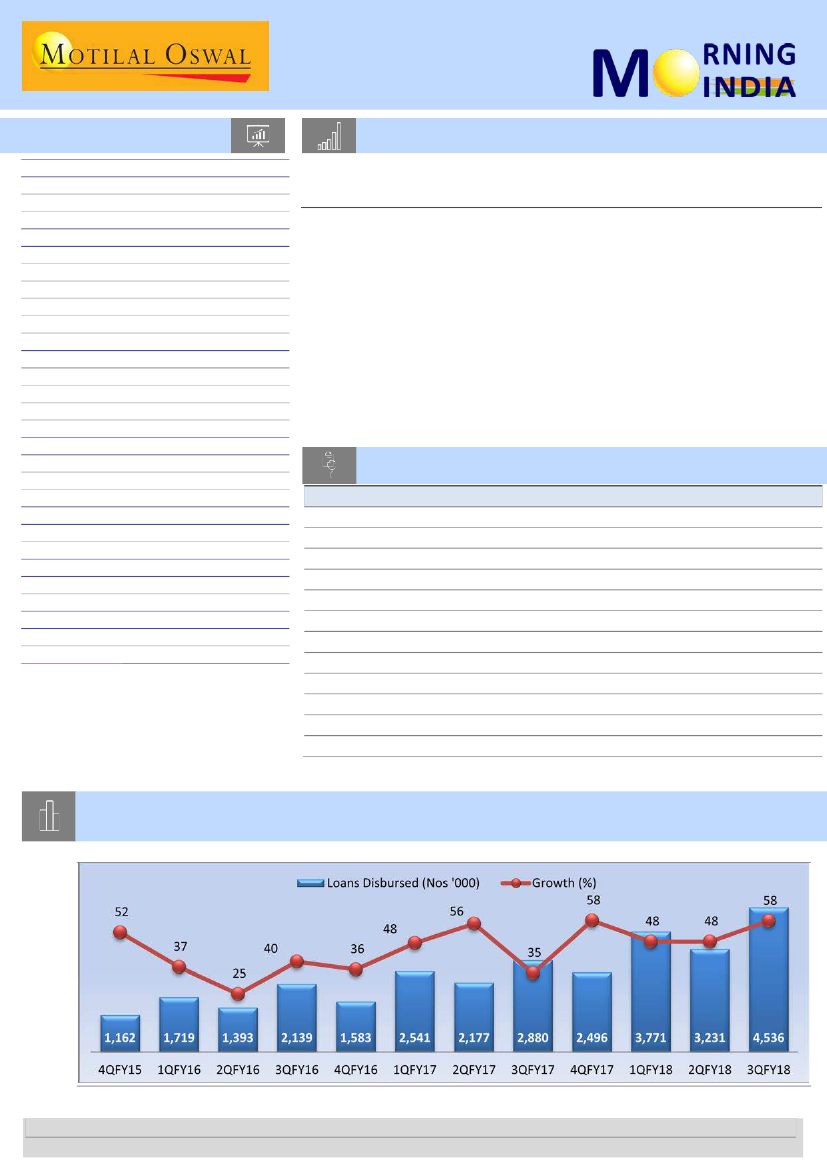
Chart of the Day: Bajaj Finance: Growth outlook remains healthy; Pressure on LAP
continues
No. of loan disb. grew at healthy 58% YoY
Research Team (Gautam.Duggad@MotilalOswal.com)
Source:
MOSL, Company
Investors are advised to refer through important disclosures made at the last page of the Research Report.
Motilal Oswal research is available on www.motilaloswal.com/Institutional-Equities, Bloomberg, Thomson Reuters, Factset and S&P Capital.

In the news today
Kindly click on textbox for the detailed news link
1
State Oil cos plan capex of Rs
89k crore, 50% for E&P
State oil companies have planned
a capital spending of Rs 89,000
crore, or $14 billion, in 2018-19,
half of which will go into
exploration and production. In the
current fiscal, these companies
had targeted an expenditure of Rs
87,400 crore, 70% of which has
been spent in the first three …
2
Reliance Industries emerges sole contender to acquire stake in JBF
Industries
Billionaire Mukesh Ambani’s Reliance Industries Ltd (RIL) has emerged as
the sole contender to acquire a part of polyester maker JBF Industries Ltd’s
operations in a transaction that will include its entire overseas operations
and an upcoming plant in Mangalore, two people directly aware of the
ongoing negotiations said. Mint had reported on 18 October last year that
JBF Industries was in discussions with at least three potential buyers,
including RIL, for a stake sale which could lead to a change of management
control.
3
JSW Steel, ArcelorMittal, Tata
Steel vie for Bhushan Steel
Top steel makers JSW Steel and
Tata Steel from India, and
Luxembourg-based ArcelorMittal
are learnt to have submitted bids
for the debt-ridden Bhushan Steel
which is undergoing insolvency
proceedings. The last date to
submit bids for Bhushan Steel, the
maker of auto grade steel in India,
was February 3.
4
Godrej Properties sells Rs 700
cr worth office space in
Mumbai
Realty firm Godrej Properties has
sold 2 lakh sq ft area in its
commercial building at Bandra-
Kurla complex in Mumbai for
nearly Rs 700 crore so far this
fiscal riding on the demand for
prime rent-yielding assets. In
September 2015, Godrej group's
realty firm had sold 4.35 lakh sq ft
area in Godrej BKC project …
5
Hawkish review ahead: MPC
likely to revise its inflation
forecast upwards
In December 2017, the Monetary
Policy Committee (MPC) had left
the repo rate unchanged at 6 per
cent and retained the neutral
stance of the monetary policy. At
that time, it had marginally
increased its Consumer Price
Index (CPI) inflation forecast for
the second half of 2018-19 to 4.3-
4.7 per cent, from the earlier 4.2-
4.6 per cent. Subsequently, the
CPI inflation spiked from the
modest 3.6 per cent in October
2017 to 4.9 per cent in November
and 5.2 per cent in December,
overshooting the upper end …
6
Tatas putting house in order at
realty arm
A "special review", directed by
promoter Tata Sons, is currently
underway. A few months ago, a
separate audit was undertaken by
the company. About 10 out of its
19 projects are grappling with
various problems — ranging from
angry homebuyers to unclear land
titles. And Tata Housing CEO Brotin
Banerjee, who has spent 13 years
with the conglomerate, has been …
7
Mahindra wins an order to
supply 1000 e-Veritos to
Bhagirathi
Mahindra and Mahindra Ltd on
Saturday won an order to supply
1,000 electric vehicles (EVs) to
Bengaluru-based fleet operator
Baghirathi Travel Solutions Pvt. Ltd
through its subsidiary Mahindra
Electric Mobility Ltd, Mahesh Babu,
CEO of Mahindra Electric said,
describing the order as “one of the
biggest in Indian corporate …
5 February 2018
2

Database Periodical | 2 February 2018
Bulls & Bears
India Valuations Handbook
Strategy: Markets extend stellar gains of CY17; earnings recovery in sight in CY18; Mid-
cap valuation premium unsustainable
Nifty continues its positive run in the new year:
The Nifty has started CY18 on a positive note (up 4.7% in
January) after delivering stellar 27% returns in CY17. India’ improving micros (earnings recovery), coupled with
continued liquidity inflow, have driven a strong market performance – despite this, the three-year (CY15-17)
CAGR returns for the Nifty stand at just 8.5%. In January, FIIs turned net buyers (USD2.0b) from net sellers in
December (USD.7b), while DII flows were the lowest in 10 months (USD.1b). Midcaps (-1.6% in January)
underperformed the Nifty after five months of continued outperformance, as muted DII flows and realignment
of MF portfolios (large cap/midcap/small cap) took the centre stage. Midcap still command a rich premium of
66% v/s large caps. The 3QFY18 reporting season has begun on a strong note – 100 companies in our MOSL
Universe have declared results so far, posting 13.5%, 10.8% and 13.6% YoY growth in sales, EBITDA and PAT, as
against expectations of 14.3%, 10.1% and 11.2%, respectively. 31 Nifty companies have posted
sales/EBITDA/PAT growth of 12.4%/9%/12.6% YoY v/s expectations of 14%/9.2%/10.4%, confirming our thesis of
a 2HFY18 earnings recovery.
Budget – shades of populism ahead of election year without being profligate:
The FY19 Union Budget,
presented on 1st February 2018, delivered a blend of pragmatic economics and electoral optimism, and placed
primacy on Rural and Agricultural India without being profligate and not deviating much from the path of fiscal
consolidation. The Indian government was expected to push its fiscal deficit target of 3% by one year, but it has
actually been pushed forward by two years (to 2020-21). The much-speculated Long Term Capital Gains (LTCG)
tax has been re-introduced, but with grandfathering provisions till 31st January 2018, providing a relief to equity
investors. Overall, while we are enthused with the government’s focus on rural income (and, in turn,
consumption), education and health, we believe the quality of fiscal spending could have been better (capital
spending estimated to fall to 1.6% of GDP). Refer to our Rural Strategy notes Back on the saddle, Volume I and
Back on the saddle, Volume II for more details on the rural recovery theme.
Indian market begins CY18 on solid footing, among top performing markets globally:
For January 2018, Brazil
(+11%), MSCI EM (+8%), Russia (+6%), the US (+6%), India-Sensex (+6%) and China (+5%) were the best
performers among the key global markets in local currency terms. On the other hand, the UK (-2%) delivered
negative returns. Over the last 12 months, MSCI EM (+38%) has outperformed MSCI India (+27%). However, over
the last five years, MSCI India has outperformed MSCI EM by 63%. MSCI India P/E is at a premium of 37% to
MSCI EM P/E, above its historical average premium of 43%.
Sectoral performance trends – Technology, Private Banks and NBFC top performers for January:
Technology
(+11%), Private Banks (+9%), NBFC (+7%) and Capital Goods (+6%) were the top outperformers, while Telecom (-
17%), Auto (-3%), Utilities (-3%), Healthcare (-2%) and Cement (-1%) delivered negative returns in January. In this
edition of ‘Bulls & Bears,’ we take a deep dive into the valuation metrics of the Technology sector.
Strong start to the reporting season; earnings recovery in sight, but mid-cap valuation premium concerning:
The key trigger that was missing for three years in an otherwise solid and strong India macro story was earnings
growth. We expect that to change in 2HFY18 even as the macro environment has relatively deteriorated of late.
Early 3QFY18 reporting trends indicate what has begun well could also end well, marking the ‘End of a long
drought’. 84/71 companies out of the 100 companies that have reported their results have met/exceeded our
EBITDA and PAT expectations. IT has been the surprise pack of the earnings season so far. Our CY18 theme of
‘Consumption Recovery’ is playing out well, with strong performances across consumer companies. At the
margin, Budget FY19 aids rural consumption, in our view. We continue to prefer large-caps over mid-caps, given
the sharp valuation premium of 66% for mid-caps v/s large-caps. ICICI Bank, RBL, SHTF, Repco, M&M, Motherson
Sumi, HUL, Titan, IOC, JSPL, L&T and IGL are some of our preferred bets.
3
5 February 2018

Valuation deep-dive for the month: Technology
Growth in Technology has been gradually coming off over past six years. Although the next wave of technology
spend has started to emerge in the form of Digital technologies, service providers have been faced with the
need to reposition themselves to capitalize on the opportunity.
Matters turned worse in the recent past, as these issues got exacerbated by pockets of problems that further
lowered growth. Slower spend in BFS, constraints of Retailers and uncertainty around the future of Healthcare in
the US, topped by customer-specific problems took growth below mid-single digits in 9MFY18.
Margins too have been declining due to pricing pressure in traditional services, need to re-invest in newer
technologies and the fact that delivery models are still not equally efficient in Digital, given lower scale and
maturity.
Revenue growth issues, however, are gradually turning the corner (at least the ones caused by specific vertical
pressures), paving the way for a better FY19. This is well-reflected in the recent sector re-rating, taking the one-
year forward PE to a 16% premium to the historical ten-year average from a year of trading close to the long-
term average. To some extent, this has also been a function of stable margins, driven by improved operational
efficiency – a widening of the de-linkage between revenue growth and headcount growth.
The sector though isn’t still at par with the broader indices. While it has commanded a ~6% premium to the
Sensex over the last 15 years, it currently trades at a ~7% discount despite the sharp up-move in the recent past.
A case for double-digit revenue growth with stable margins would be necessary for the sector to return to the
premium it has historically commanded. To a great extent, this is being witnessed in Tier-II names that have
significantly outperformed larger peers.
Technology sector premium/discount to Sensex
120
80
18.3
15.8
40
0
-40
5.5
-7.5
Relative to Sensex PE (%)
Technology P/E (x)
10 Yr Avg (x)
5 Yr Avg (x)
15 Yr Avg (x)
Technology sector trading at 16% premium to historical P/E
31.0
24.0
17.0
10.0
3.0
16.6
16.6
Sector valuations: Technology, Private Banks and NBFCs top outperformers
Technology sector trades at a P/E of 18.3x, a 16% premium to its historical average of 15.8x. The sector was the
best performer in January (+11% return MoM). Recent upward movement in stock prices has been a result of a
profitability beat across companies in 3QFY18 and improved expectations on performance heading into FY19.
Private Banks are trading at 3x P/B, above their long-period average P/B of 2.2x, as earnings/growth visibility
remains strong. We expect some pressure on margins going forward as the loan book gets re-priced from base
rate to MCLR. Asset quality trends largely remain stable for the retail lenders. Among corporate lenders, AXSB
and YES have both reported a decline in net slippages. We expect resolution process for several NCLT cases to
get completed over the next few months. Asset quality will remain a key monitorable for corporate lenders in
1HFY19.
NBFCs trade at a P/B of 3.6x, above their historical average (23% premium). G-Sec yields have hardened over
50bp and have now stabilized above 7%. If yields sustain at these levels over the medium term, it could
meaningfully impact spreads of NBFCs, especially HFCs. HFCs that have declared their 3QFY18 results till now
have shown strong disbursement growth ranging from 16% to 54%. Growth has been driven by both retail and
corporate segments. Vehicle financiers have had a strong 3QFY18.
Telecom, on EV/EBITDA basis, trades at 9.2x (15% premium to historical average). Bucking the trend of the
previous month, the sector was the worst performer in January (-17% return MoM). This was due to (1)
continuous downward revision in price plans by Rjio, and (2) muted results.
5 February 2018
4

Snapshot: Sector valuations
Sector
Auto
Banks - Private
Banks - PSU
NBFC
Capital Goods
Cement
Consumer
Healthcare
Infrastructure
Media
Metals
Oil & Gas
Retail
Technology
Telecom
Utilities
Current
18.2
22.6
13.5
25.0
31.3
25.9
39.9
22.6
17.4
28.8
10.5
12.3
46.6
18.3
Loss
10.7
PE (x)
10 Yr Avg Prem/Disc (%)
15.1
20.1
16.6
36.3
3.8
250.8
18.0
39.2
26.3
19.0
18.7
38.3
30.5
30.7
22.8
-0.6
13.6
28.1
23.0
25.1
12.0
-12.9
11.5
7.5
26.0
79.2
15.8
16.0
-
-
14.2
-24.4
Relative to Sensex
P/E (%)
Current 10 Yr Avg
-8
-14
14
-5
-32
-71
27
3
58
48
31
7
102
77
14
31
-12
-23
46
32
-47
-31
-38
-33
136
49
-8
-9
-
-
-46
-15
PB (x)
Current
3.9
3.0
0.9
3.6
3.5
3.1
11.5
3.3
2.0
5.5
1.7
1.7
10.0
4.3
2.5
1.4
10 Yr Avg Prem/Disc (%)
3.1
24.7
2.2
35.8
1.0
-8.8
2.9
22.7
3.7
-5.5
2.2
37.2
9.5
20.1
3.9
-14.4
1.8
16.2
4.0
35.1
1.5
13.4
1.6
9.1
6.6
51.5
4.1
4.0
2.5
1.2
1.7
-17.2
Relative to Sensex
P/B (%)
Current 10 Yr Avg
35
21
4
-15
-70
-63
25
13
20
39
6
-14
296
272
15
51
-30
-33
89
56
-42
-44
-41
-40
246
155
47
58
-13
-3
-51
-34
Nifty: Oil & Gas trading near its historical average valuations
Oil & Gas trades at 1.7x P/B, slightly above its historical average of 1.6x P/B and P/E of 12.3x (v/s 10-year average
of 11.5x). Brent crude oil price remained elevated at ~USD69/bbl on account of improving global forecast for
crude oil demand and extension of production cut by OPEC and Russia till the end of 2018.
Global equities: India among best-performing markets for January
For January 2018, Brazil (+11%), MSCI EM (+8%), Russia (+6%), US (+6%), India-Sensex (+6%) and China (+5%)
were the best performers among the key global markets in local currency terms. On the other hand, UK (-2%)
delivered negative returns.
Indian equities are trading at 23.9x FY18E earnings.
All key markets continue trading at a discount to India. However, India’s RoE remains superior to most EMs, an
important differentiator for valuation premium.
Global equities: MSCI EM outperforms MSCI India in last 12 months
Over the last 12 months, MSCI EM (+38%) has outperformed MSCI India (+27%). However, over the last five
years, MSCI India has outperformed MSCI EM by 63%.
MSCI India P/E is at a premium of 37% to MSCI EM P/E, below its historical average premium of 43%.
MSCI India outperforms MSCI EM by 63% in last five years
205
138
127
170
135
100
65
30
MSCI India Rebased
10 Year
CAGR:
MSCI India:
5.9%
MSCI EM:
1.4%
5 Year CAGR:
MSCI India:
10.8%
MSCI EM:
3.3%
MSCI EM outperforms MSCI India over 12 months
151
137
123
109
95
MSCI India Rebased
MSCI EM Rebased
178
115
5 February 2018
5

2 February 2018
3QFY18 Results Update | Sector: Financials
Bajaj Finance
Buy
BSE SENSEX
35,067
Bloomberg
Equity Shares (m)
M.Cap.(INR b)/(USD b)
52-Week Range (INR)
1, 6, 12 Rel. Per (%)
Avg Val, (INR m)
Free float (%)
S&P CNX
10,761
BAF IN
Growth outlook remains healthy; Pressure on LAP continues
546.9
Bajaj Finance’s (BAF) 3QFY18 PAT increased 38% YoY to INR7.66b (3%
999.6/15.3
miss), driven by 35% YoY AUM growth, modest margin uptick (due to
1989/1020
higher capital), and stable asset quality. Adjusted for benefit of capital
-9/-14/30
infusion, NII grew largely in-line with AUM growth.
1710.0
SME (31% of AUM) remains a drag to overall growth with AUM growth
44.7
CMP: INR1,629
TP: INR2,330 (+43%)
Financials & Valuations (INR b)
Y/E March
2018E 2019E
NII
75.5
101.7
PPP
50.2
70.5
PAT
26.1
35.4
EPS (INR)
45.6
61.7
EPS Gr. (%)
42.3
35.4
BV/Sh. (INR)
285
337
RoA on AUM (%)
3.5
3.6
RoE (%)
20.1
19.8
Payout (%)
Valuations
P/E (x)
P/BV (x)
Div. Yield (%)
12.5
38.3
6.1
0.3
12.5
28.3
5.2
0.4
2020E
132.2
94.0
47.5
82.8
34.2
408
3.7
22.2
12.5
21.0
4.3
0.6
of 2% QoQ and 16% YoY. Management continues to have cautious
outlook on LAP business. Consumer (+39% YoY), Commercial (+52% YoY)
and rural (+114% YoY) traction remains strong with growth across
product lines (ex 2W and 3W business).
From a customer base of 25m currently, management targets to reach
75m over the next five years. BAF already has a database of 30m
people who are mass affluent but not yet customers of the company –
management would like to tap around half of them. Tie up with RBL is
showing strong traction and it has already issued 0.25m cards and
target to end with 1m cards by end of CY18.
Management has infused INR12b in the HFC subsidiary, taking its net-
worth to INR15.5b. Over the next 5 years, this could be an INR600-700b
balance sheet, as per management. All mortgage businesses will be
booked in this subsidiary.
Asset quality is stable with a GNPA ratio of 1.67%.
In 2W lending, the
0dpd+ portfolio declined sequentially from 14.2% to 12.2%. However,
in the LAP portfolio, 0dpd+ dues increased ~30bp to 1.73% – the
highest in more than five years.
Valuation and view:
BAF within the consumer financing business, has
demonstrated its ability to cross-sell, as is evident from the strong
growth in the personal loans portfolio in the past three years. Its focus
on the SME and commercial lending segments may depress margins and
RoE, but will keep growth strong. We tweak estimates by 3/5%
FY19E/20E to accommodate slightly lower AUM growth.
Buy.
(INR Million)
FY17
2Q
FY18
1Q
31,123
36.1
10,780
20,344
45.0
140
20,484
8,413
12,071
45.2
2,817
9,254
3,234
6,020
42.0
38.9
33.4
41.1
34.9
FY17
2Q
30,862
32.1
11,438
19,425
40.8
161
19,586
8,752
10,833
36.8
2,278
8,555
2,986
5,569
36.6
37.8
22.6
44.7
34.9
3Q
35,406
31.5
11,709
23,698
38.4
27
23,724
9,494
14,230
38.2
2,468
11,762
4,094
7,668
38.0
35.4
30.0
40.0
34.8
4Q
34,818
30.6
11,823
22,995
36.8
61
23,056
9,944
13,112
33.9
2,553
10,559
3,692
6,868
52.9
36.0
28.7
43.1
35.0
92,723
34.4
38,034
54,690
37.6
260
54,949
25,642
29,047
40.0
8,182
20,865
9,810
18,366
43.6
32.9
33.0
46.9
35.1
121,282
30.8
45,749
75,533
38.1
389
75,922
36,603
38,930
34.0
10,116
28,813
14,006
26,125
42.3
36.0
28.7
48.5
35.1
FY18E
BAF: Quarterly Performance
Y/E March
1Q
Revenue from operations
YoY Growth (%)
Interes t expens es
Net Income
YoY Growth (%)
Other i ncome
Total Income
Opera ti ng Expens es
Operating Profit
YoY Growth (%)
Provi s i ons a nd Cont.
Profit before Tax
Ta x Provi s i ons
Net Profit
YoY Growth (%)
Loa n Growth (%)
Borrowi ngs Growth (%)
Cos t to Income Ra ti o (%)
Ta x Ra te (%)
E: MOSL Es ti ma tes
22,864
38.9
8,833
14,031
44.8
147
14,178
5,865
8,312
58.1
1,797
6,515
2,275
4,240
53.8
39.5
40.5
41.4
34.9
3Q
26,930
30.6
9,802
17,128
30.5
109
17,237
6,939
10,297
33.5
1,797
8,500
2,943
5,557
36.0
32.6
30.2
40.3
34.6
4Q
26,650
39.1
9,837
16,813
51.4
79
16,892
7,099
9,794
51.7
2,897
6,897
2,406
4,492
42.6
36.1
33.0
42.0
34.9
23,355
39.0
9,562
13,793
40.0
56
13,849
5,932
7,917
40.2
1,654
6,263
2,185
4,078
45.9
37.8
43.4
42.8
34.9
5 February 2018
6

RESULTS
FLASH
2 February 2018
Results Flash | Sector: Automobiles
Bajaj Auto
BUY
BSE SENSEX
35,067
S&P CNX
10,761
CMP: INR3,222
TP: INR4,023
Revenue in-line; lower other income, higher tax dents PAT
Conference Call Details
Date:
5 Feb 2018
Time:
10:00am IST
Dial-in details:
+91-22-3960 0734
th
Financials & Valuations (INR b)
2018E 2019E
Y/E Mar
Net Sales
239
271
EBITDA
45.5
56.1
NP
43.3
52.0
EPS (INR)
150
180
EPS Gr. (%)
6.1
20.0
BV/Sh. (INR)
651
729
RoE (%)
24.2
26.0
RoCE (%)
21.9
23.8
P/E (x)
21.7
18.1
P/BV (x)
5.0
4.4
2020E
309
65.3
60.3
208
16.0
824
26.8
33.8
15.6
3.9
Net sales grew 25.7% YoY (but declined 3.2% QoQ) to INR63.7b (in-line), as
volumes grew 17.6% YoY (declined 6.5% QoQ). Realization increased 6.9% YoY
(3.6% QoQ) due to a favorable mix (higher share of 3Ws, Pulsar) and price
actions taken. Recovery in key export markets and domestic 3W market
boosted volumes.
RM cost increased ~160bp YoY (declined 80bp QoQ) due to commodity cost
inflation.
EBITDA margin was 19.3% (-130bp YoY, -40bp QoQ), below our estimate of
20%, mainly due to sharp rise in other expenses (+31% YoY).
PAT grew 3% YoY to INR9.5b, below our estimate due to lower other income (-
29% YoY) and higher tax (effective tax rate at 31% v/s estimate of 29%).
Bajaj’s share of profit from KTM increased by 17% YoY to INR0.6b, led by 14%
YoY growth in KTM volumes.
The management’s outlook for 3Ws remains positive due to removal of cap on
permits in Maharashtra and issue of new permits in Delhi.
Bajaj expects its share in domestic 2Ws to improve, led by new launches (New
Discover 110, Discover 125, Avenger Cruise 220 and Avenger Street 220).
Key questions for the management
Outlook on demand for recently-launched products and export demand.
Product actions in pipeline.
Valuation and view:
We will revisit our estimates post earnings call. The stock
trades at 18.1x/15.6x FY19E/20E EPS. Maintain BUY with a TP of INR4,023.
(INR m)
FY17
2Q
3Q
1,032
852
-2.3
-10.5
58,676 59,495
2.0
2.0
60,545 50,669
-0.4
-8.7
67.0
66.8
4.3
4.8
7.4
7.9
12,961 10,439
21.4
20.6
3,420
3,193
7
3
770
772
15,605 12,858
4,378
3,612
28.1
28.1
11,228
9,246
6.7
(4.7)
39
32
FY18
2Q
3QE
1,072
1,001
3.8
17.6
61,408 63,600
4.7
6.9
65,799 63,693
8.7
25.7
69.1
68.4
4.0
4.2
7.2
8.3
12,984 12,315
19.7
19.3
2,964
2,269
5
3
770
747
15,174 13,833
4,055
4,309
26.7
31.1
11,119
9,524
(1.0)
3.0
38
33
FY17
4QE
955
21.3
57,758
-7.1
55,186
12.7
69.5
4.7
6.3
10,836
19.6
4,124
0
818
14,142
3,828
27.1
10,314
28.6
36
3,666
(5.8)
59,419
2.4
217,827
(3.6)
67.1
4.6
8.0
44,384
20.4
12,220
14
3,073
53,516
15,081
28.2
38,436
(2.2)
133
FY18E
3,917
6.8
61,044
2.7
239,102
9.8
69.4
4.4
7.4
44,974
18.8
13,930
10
3,087
55,806
15,834
28.4
40,516
5.4
140
Est.
3QE
1,001
17.6
62,022
4.2
62,113
22.6
68.8
4.2
7.2
12,399
20.0
3,200
3
770
14,827
4,300
29.0
10,527
13.9
36
Quarterly Performance
Volumes ('000 units)
Growth YoY (%)
Realization (INR/unit)
Growth YoY (%)
Net Sales
Change (%)
RM/Sales %
Staff cost/Sales %
Oth. Exp./Sales %
EBITDA
EBITDA Margins (%)
Other Income
Interest
Depreciation
PBT
Tax
Effective Tax Rate (%)
Adj. PAT
Change (%)
EPS (Rs)
1Q
995
-1.8
57,784
4.5
57,480
2.7
67.2
4.7
7.7
11,763
20.5
2,671
2
775
13,657
3,873
28.4
9,784
2.2
34
4Q
788
-9.7
62,171
1.2
48,973
-8.6
67.8
4.6
9.2
9,060
18.5
2,936
2
757
11,236
3,218
28.6
8,018
(15.5)
28
1Q
888
-10.7
61,258
6.0
54,424
-5.3
70.0
5.0
7.8
9,384
17.2
4,573
2
753
12,881
3,642
28.3
9,469
(3.2)
33
Var.
(%)
0.0
2.5
2.5
-40bp
0bp
110bp
-0.7
-60bp
-29.1
20.0
-3.0
-6.7
7.4
-9.5
E: MOSL Estimates
5 February 2018
7

2 February 2018
3QFY18 Results Update | Sector: Metals
Hindalco
BSE SENSEX
35,067
Bloomberg
Equity Shares (m)
M.Cap.(INRb)/(USDb)
52-Week Range (INR)
1, 6, 12 Rel. Per (%)
Avg Val, INRm/ Vol m
Free float (%)
S&P CNX
10,761
HNDL IN
CMP: INR249
TP: INR344(+38%)
Buy
2,245
559.9 / 8.7
284 / 179
-12/2/5
2450.0
65.3
Stable performance in India; Novelis getting stronger
After de-risking B/S, focus shifts to high-IRR projects; Maintain Buy
Hindalco’s standalone (HNDL S/A) 3QFY18 EBITDA increased 11% YoY to INR13.1b
and adj. PAT increased 54% YoY to INR5b, in line with estimates. Reported PAT at
INR3.8b was impacted by INR1.15b provisions toward bauxite mine in Jharkhand.
HNDL and Utkal have prepaid debt of INR11.3b in 3Q (INR57b in 9MFY18). Utkal
EBITDA increased 73% YoY (+23%) to INR2.47b on higher prices.
Aluminum EBITDA (incl. Utkal) increased 2% QoQ (+15% YoY) to INR11.6b.
EBITDA per ton increased 3% QoQ to USD552/t, driven by higher LME. Metal
sales were down 1% QoQ to 325kt. Alumina production increased 3% QoQ to
734kt, helped improved bauxite supply at Muri. Cost of production (CoP)
increase was benign at 3% QoQ.
Copper EBTIDA declined 12% QoQ (+ 23% YoY) to INR4b, while sales volumes
increased 10% QoQ (+5% YoY) to 102kt.
After de-risking B/S, focus shifts to high-IRR projects to drive growth; Buy
Aluminum CoP is likely to increase further by USD20-25/t on input cost
pressure. HNDL SA now has 28% of FY19 volumes hedged at higher price of
USD2,200/t (v/s USD2,000 in FY18).
Spend on high-IRR projects (e.g., Utkal Alumina and VAP) is picking up. We are
adjusting our model for higher capex of INR53b (v/s INR28b) in FY19 to factor
in the announced investments in Novelis and India. This will drive earnings in
FY21. Therefore, we are adding book value of CWIP to SOTP and roll over to
FY20E. EPS has increased by 5-6% on lower tax rate in the US. Stock is trading
at attractive EV/EBITDA of 5.8xFY20E. Net debt/EBITDA ratio has declined to
2.8x in FY18 (from 6.4 in FY16). After de-risking balance sheet, Hindalco is now
investing in high-IRR projects to drive growth. Maintain
Buy.
INR million
vs Est
(%)
1
7
3
2
5
6
19
4
-12
Financials & Valuations (INR b)
Y/E Mar
2018E 2019E 2020E
Net Sales
1,174 1,147 1,161
EBITDA
139.7 147.2 145.7
PAT
43.5
60.2
62.0
EPS (INR)
19.5
27.0
27.9
Gr. (%)
127.9
38.6
3.0
BV/Sh (INR)
147.9 173.5 200.0
RoE (%)
14.0
16.8
14.9
RoCE (%)
8.8
9.8
9.7
P/E (x)
12.8
9.2
9.0
P/BV (x)
1.7
1.4
1.2
Estimate change
TP change
Rating change
Quarterly Performance (Standalone)
Y/E March
1Q
Aluminium (sales, kt)
291
Copper (sales, kt)
62
Net Sales
75,973
Change (YoY %)
-11.4
EBITDA
11,325
As % of Net Sales
14.9
Interest
5,996
Depreciation
3,382
Other Income
2,184
PBT (before EO item)
4,131
Extra-ordinary Income
-2
PBT (after EO item)
4,129
Total Tax
1,189
% Tax
28.8
Reported PAT
2,941
Adjusted PAT
2,987
Novelis ad EBITDA (USDm)
268
FY17
FY18
FY17
FY18E
2Q
3Q
4Q
1Q
2Q
3Q
4QE
3QE
320
310
328
299
329
325
333
1,249
1,286
323
106
97
114
105
93
102
95
379
395
95
90,123 93,136 110,261 97,700 103,082 110,228 106,723 369,366 417,733 107,267
1.0
14.3
27.2
28.6
14.4
18.4
-3.2
7.6
13.1
15.2
11,564 11,852 13,472 11,477 13,899 13,117 13,301 48,135 51,794 12,921
12.8
12.7
12.2
11.7
13.5
11.9
12.5
12.0
5,943 5,879
5,411 4,878
4,836
4,828
4,353 23,229 18,895
4,614
3,516 3,580
3,802 3,792
3,804
3,822
3,651 14,280 15,069
3,615
3,364 2,200
2,226 2,563
1,872
2,994
2,453 10,052
9,882
2,515
5,469 4,593
6,485 5,371
7,131
7,460
7,749 20,679 27,712
7,207
857
-3 -1,044 -1,055 -1,153
852
-3,252
6,326 4,593
6,482 4,327
6,076
6,307
7,749 21,531 24,460
7,207
1,929 1,390
1,457 1,431
2,146
2,552
2,170
5,964
8,299
2,018
35.3
30.2
22.5
26.6
30.1
34.2
28.0
27.7
33.9
28.0
4,397 3,204
5,025 2,896
3,930
3,755
5,580 15,567 16,161
5,189
3,954 3,204
4,689 3,549
4,712
4,929
5,120 14,951 18,310
5,005
270
255
292
289
302
305
313
1,085
1,209
294
-28
-2
4
5 February 2018
8

2 February 2018
3QFY18 Results Update | Sector: Automobiles
Ashok Leyland
Buy
BSE SENSEX
35,067
Bloomberg
Equity Shares (m)
M.Cap.(INRb)/(USDb)
52-Week Range (INR)
1, 6, 12 Rel. Per (%)
Avg Val, INRm
Free float (%)
S&P CNX
10,761
AL IN
Product mix, operating leverage and higher exports drive margins
2,927
Volume and realization drive revenues:
AL’s revenues grew 47.3% YoY to
357.8 / 5.6
INR71.1b (est. of INR69.5b), driven by volume growth of 47.3% YoY (+17.6%
133 / 81
QoQ) and realizations growth of 3.8% YoY (+3.4% QoQ) to INR1.52m (est. of
-5/4/5
INR1.49m). AL took marginal price increase in November, and then further
1296.0
48.7
by 1-2% in Jan-18, which helped realizations in 3QFY18.
CMP: INR122
TP: INR158(+29%)
Financials & Valuations (INR b)
2018E 2019E
Y/E Mar
Net Sales
251.7
288.7
EBITDA
26.0
31.3
PAT
14.4
18.2
EPS (INR)
4.9
6.2
Gr. (%)
7.8
26.7
BV/Sh (INR)
23.4
26.9
RoE (%)
22.1
24.7
RoCE (%)
18.6
20.9
P/E (x)
24.9
19.7
P/BV (x)
5.2
4.5
EV/EBITDA (x)
13.3
10.6
2020E
330.0
36.1
22.6
7.7
24.0
31.6
26.4
22.7
15.9
3.9
8.7
Estimate change
TP change
Rating change
Favorable product mix, operating leverage drive EBITDA margin:
EBITDA
margin expanded 170bp YoY (+100bp QoQ) to 11.1% (est. of 10.3%) due to a
favorable product mix, an increase in exports and operating leverage
benefits. However, heavy discounting continues to prevail in the CV
industry. EBITDA grew 73.6% YoY (+28.9% QoQ) to INR7.9b (est. of INR7.1b).
On the back of the healthy operating performance, PAT grew 178% YoY to
INR4.5b (est. of INR4b).
Key concall takeaways:
a)
Outlook:
CV industry growth of ~10% for FY18E.
Expects AL to grow in line with industry. FY19-20 to be growth years. b)
Price
increase
of 1% from Nov-17 in some models and another 1-2% from Jan-18.
c)
RM cost inflation impact of INR1.5b
in 9MFY18. d) LCV business turned
PAT positive, with gross margins similar to domestic M&HCV business. e)
Aftermarket business
averaging turnover of INR1b/month. Current after-
market penetration is 20% and expected to go up to 50% in 4-5 years. f)
AL
has supply chain constraints,
which impacted volumes in Jan’18.
Valuation view:
We upgrade FY19/20 EPS by 1.5%/2.4%, as we raise volume
estimate by 2.3% for FY19/FY20E, while we keep margin assumptions
unchanged in FY19/20. We value AL at ~INR158 (11x Dec-19E EV/EBITDA +
INR12.5/share for stake in HLF post 20% HoldCo Discount). Maintain
Buy.
FY18
2Q
3Q
40,985 46,627
22.6
42.0
1,475
1,526
6.7
3.8
60,469 71,132
30.8
47.3
71.3
71.4
8.1
6.9
10.4
10.6
6,118
7,884
10.1
11.1
557
380
410
335
4,826
6,576
0
0
4,826
6,576
30.7
31.6
3,342
4,497
13.5
178.1
FY17
FY18E
FY18
3QE
46,627
42.0
1,490
8.3
69,481
53.8
71.5
7.0
11.2
7,123
10.3
475
425
5,748
0
5,748
30.0
4,024
148.7
Var.
(%)
0.0
2.4
2.4
-10bp
-10bp
-60bp
10.7
80bp
-20.1
-21.1
14.4
14.4
11.8
Quarterly Performance
(INR Million)
Total Volumes (nos)
Growth %
Realizations (INR '000)
% change
Net operating revenues
Change (%)
RM/sales %
Staff/sales %
Other exp/sales %
EBITDA
EBITDA Margins(%)
Other Income
Interest
PBT before EO Item
EO Exp/(Inc)
PBT
Effective Tax Rate (%)
Adj. PAT
Change (%)
E: MOSL Estimates
1Q
31,165
10.7
1,367
-0.9
42,588
9.7
68.7
8.4
11.6
4,820
11.3
385
338
4,154
0
4,154
30.0
2,908
130.0
FY17
2Q
3Q
33,441 32,838
-10.5
6.2
1,382
1,470
4.0
10.5
46,224 48,283
-6.9
17.4
67.8
65.1
8.0
8.2
12.6
10.8
5,365
4,541
11.6
9.4
316
258
339
453
4,146
2,395
0
0
4,146
2,395
29.0
32.5
2,944
1,617
14.5
-25.6
4Q
47,622
8.5
1,390
2.1
66,179
10.8
71.9
6.2
10.8
7,299
11.0
404
423
6,114
3,508
2,605
-
4,279
-16.5
1Q
28,484
-8.6
1,488
8.9
42,378
-0.5
69.4
10.3
13.0
3,061
7.2
384
366
1,730
126
1,605
30.7
1,199
-58.7
4QE
54,298 145,066 170,394
14.0
3.4
17.5
1,431
1,380
1,477
3.0
2.3
7.0
77,696 200,187 251,674
17.4
5.7
25.7
71.3
69.7
71.0
6.4
7.6
7.6
10.8
11.6
11.0
8,960 22,025 26,023
11.5
11.0
10.3
430
1,363
1,750
356
1,554
1,467
7,629 16,809 20,762
0
3,508
126
7,629 13,301 20,636
30.7
8.0
31.0
5,340 13,447 14,326
24.8
11.6
6.5
5 February 2018
9

RESULTS
FLASH
United Breweries
BSE SENSEX
35,067
S&P CNX
10,761
2 February 2018
Results Flash | Sector: Consumer
CMP: INR1,135
TP: INR1,320
Buy
Multi-year high-double-digit volume growth
Conference Call Details
Date:
5 February 2018
Time:
04:00pm IST
Dial-in details:
+91-22-3960 0894
th
Financials & Valuations (INR b)
2018E 2019E
Y/E Mar
Net Sales
55.2
63.5
EBITDA
9.1
10.7
NP
3.9
4.7
EPS (INR)
14.7
18.0
EPS Gr. (%)
68.9
22.4
BV/Sh. (INR)
100.9 116.4
RoE (%)
15.5
16.5
RoCE (%)
14.0
14.8
P/E (x)
73.0
59.7
P/BV (x)
10.6
9.2
2020E
73.0
12.8
5.9
22.3
24.2
135.7
17.7
15.9
48.0
7.9
Standalone - Quarterly Earning Model
Y/E March
Net Sales
YoY Change (%)
Total Expenditure
EBITDA
YoY Change (%)
Margins (%)
Depreciation
Interes t
Other Income
PBT before EO expense
Extra-Ord expens e
PBT
Tax
Rate (%)
Minority Interes t & Profit/Los s of As s o.
Adj PAT
YoY Change (%)
Margins (%)
E: MOSL Es timates
1Q
15,642
7.5
12,733
2,909
17.1
18.6
637
148
136
2,260
0
2,260
790
34.9
0
1,471
20.4
9.4
United Breweries (UBBL) reported 17.1% YoY sales growth to INR12b in 3QFY18
(est. of INR11.9b). Volumes grew 12% YoY v/s 6% growth for the industry.
Growth was achieved despite the lack of supply for a large part of 3QFY18 in
the state of Maharashtra due to the pricing issue that was subsequently
resolved and the route-to-market change in West Bengal.
Gross margin contracted 140bp YoY to 52.4% (higher commodity costs and
effect of GST). Staff costs fell 30bp YoY and other expenses by 140bp YoY,
possibly because of operating leverage led by healthy sales growth.
EBITDA margin at 12.7% (est. of 15.3%) was up 20bp YoY; did not grow as
impressively YoY as in 1HFY18.
EBITDA was up by a healthy 19.3% YoY to INR1.5b, but missed our estimate of
INR1.8b due to lower-than-expected margin growth.
PAT declined 2.3% YoY to INR474m (est. of 674m).
The company did not sell in Maharashtra from October until first half of
December due to the lack of clarity on the pricing structure following excise
increases.
UBL gained market share in important markets like Rajasthan, Karnataka, West
Bengal and Orissa. The erstwhile largest state now bifurcated into Telangana
and Andhra Pradesh also witnessed healthy growth.
The company has taken price increases in key states like Karnataka,
Maharashtra, Tamil Nadu, West Bengal and Kerala over the past year.
We have a
Buy
rating on the stock.
FY17
2Q
3Q
10,368 10,222
-3.3
-6.8
9,156
8,942
1,212
1,280
-10.3
-28.9
11.7
12.5
702
698
141
153
8
330
376
759
0
0
376
759
106
274
28.1
36.1
0
0
271
485
-48.1
-31.9
2.6
4.7
4Q
11,127
-8.4
10,116
1,011
-21.3
9.1
833
144
43
76
0
76
9
11.7
0
67
-87.1
0.6
1Q
16,742
7.0
13,559
3,184
9.4
19.0
649
142
63
2,456
0
2,456
837
34.1
0
1,619
10.1
9.7
FY18
2Q
3Q
4QE
12,764 11,971 13,742
23.1
17.1
23.5
10,545 10,445 11,559
2,219
1,526
2,182
83.1
19.3
115.8
17.4
12.7
15.9
650
650
806
127
93
303
12
8
107
1,454
791
1,180
0
0
0
1,454
791
1,180
515
317
330
35.4
40.1
28.0
0
0
0
938
474
850
246.9
-2.3 1,162.8
7.4
4.0
6.2
FY17
47,359
-2.1
40,947
6,412
-7.3
13.5
2,870
587
516
3,472
0
3,472
1,178
33.9
0
2,293
-23.0
4.8
FY18E
55,219
16.6
46,108
9,111
42.1
16.5
2,754
666
189
5,880
0
5,880
1,999
34.0
4
3,877
69.1
7.0
FY18
3QE
11,890
16.0
10,068
1,822
39
15.3
690
180
50
1,002
0
1,002
328
33
0.0
674
31.4
5.7
Variance
0.7%
-16.2%
-21.0%
-29.7%
5 February 2018
10

3 February 2018
Q3FY18 Results Update | Sector: Capital Goods
Cummins India
BSE SENSEX
35,067
Bloomberg
Equity Shares (m)
M.Cap.(INR b)/(USD b)
52-Week Range (INR)
1, 6, 12 Rel. Per (%)
Avg. Val, INRm
Free float (%)
S&P CNX
10,761
KKC IN
Operational performance disappoints
277.2
Operating performance below expectations:
Cummins India’s (KKC) 3QFY18
229.5/3.6
revenue was flat YoY at INR13.5b, below our estimate of INR14.3b. Gross
1,096 / 800
margin improved 130bp YoY to 36.9%. EBITDA declined 13% YoY to INR1.7b
-14/-20/-32
(our estimate: INR2.5b), with margin contracting 220bp YoY to 14.5% (our
335.0
estimate: 17.2%) due to higher other expenses (12.7% of sales v/s 10.8% in
49.0
CMP: INR828
TP: INR1,040 (+25%)
Buy
Financials & Valuations (INR b)
2018 2019E
Y/E Mar
Net Sales
50.7
59.9
EBITDA
7.3
10.1
Adj PAT
6.4
8.7
EPS (INR)
23.2
31.3
EPS Gr. (%)
-12.4
34.6
BV/Sh. (INR)
143.9
156.0
RoE (%)
16.7
20.8
RoCE (%)
16.0
20.0
P/E (x)
35.7
26.5
P/BV (x)
5.8
5.3
2020E
69.1
12.1
10.3
37.1
18.6
170.3
22.7
21.8
22.3
4.9
Estimate change
TP change
Rating change
3QFY17). PAT fell 13% YoY to INR1.7b (our estimate: INR2.1b).
Revenue decline witnessed in key segment of power gen and exports:
Domestic business registered muted revenue growth of 3% YoY, supported
by distribution business (INR3.6b, +11% YoY) and industrial segment
(INR2.1b, +8% YoY). However, key power generation business witnessed 6%
decline YoY to INR3.3b. Exports declined 7% YoY due to weakness in LHP
segment (-22% YoY) and HHP segment (-14% YoY) demand.
Gross margin expansion driven by cost savings and better product
mix:
Gross margin improved 130bp YoY to 36.9%, led by cost-saving
measures (like value engineering initiatives with vendors) and better
product mix. Operating margin contracted 220bp YoY to 14.5% due to higher
other expenses (trueing up of management cost, higher variable
compensation, and knowledge fees paid to parent company).
Domestic revenue guidance cut: exports revenue guidance maintained:
For
FY18, KKC lowered its domestic revenue growth guidance to 0-5% (from 5-
10% earlier), and maintained its export growth guidance of -5%-10%.
Maintain Buy:
We cut our earnings estimates by 7/5/5% for FY18/19/20E,
given the weak outlook on the exports front. We maintain our
Buy
rating,
with a target price of INR1,040 (28x March 2020E EPS). The stock trades at
27x FY19E EPS of INR31.3 and 23x FY20E EPS of INR37.1. Key risks to our
rating are (a) slower-than-expected growth in the domestic power
generation market, and (b) delay in pick-up of export demand.
(INR M)
FY18
FY17 FY18
2Q
3Q
4QE
11,539 13,547 12,716 50,773 50,999
-9.8
0.0
7.4
7.8
0.4
1,675
1,967
2,053 8,018 7,437
-15.8
-13.2
20.8
14.6 -10.9
14.5
14.5
16.1
15.8
14.6
220
237
316
848
981
38
34
54
168
168
536
501
564 2,080 2,185
1,953
2,197
2,248 9,082 8,474
424
475
435 1,736 1,959
21.7
21.6
19.3
19.1
23.1
1,529
1,722
1,814 7,346 6,515
(22.3) (13.1)
14.5
(2.8) (11.3)
1,529
1,722
1,814 7,346 6,515
(22.3) (13.1)
14.5
(2.8) (11.3)
Vs Est.
3Q
14,310
5.6
2,460
8.6
17.2
250
40
550
2,720
620
22.8
2,100
6.0
2,100
6.0
Var.
(%)
-5.3%
-20%
Quarterly Perf.(Standalone)
Y/E March
Sales
Change (%)
EBITDA
Change (%)
As of % Sales
Depreciation
Interest
Other Income
PBT
Tax
Effective Tax Rate (%)
Adjusted PAT
Change (%)
Reported PAT
Change (%)
1Q
12,590
-3.9
2,063
-6.9
16.4
206
21
416
2,252
440
19.5
1,812
(14.3)
1,812
(14.3)
FY17
2Q
3Q
12,790 13,550
7.1
19.0
1,990
2,265
-1.4
31.1
15.6
16.7
209
225
43
55
692
461
2,430
2,446
461
466
19.0
19.0
1,969
1,981
(0.5)
11.3
1,969
1,981
(0.5)
11.3
4Q
1Q
11,844 13,408
11.1
6.5
1,700
1,953
-4.9
-5.4
14.4
14.6
208
208
49
42
511
583
1,954
2,286
369
625
18.9
27.4
1,585
1,660
(5.1)
(8.4)
1,585
2,222
(5.1)
22.6
-19.2%
-18.0%
-18.0%
5 February 2018
11

2 February 2018
3QFY18 Results Update | Sector: Oil & Gas
MRPL
BSE SENSEX
35,067
Bloomberg
Equity Shares (m)
M.Cap.(INRb)/(USDb)
52-Week Range (INR)
1, 6, 12 Rel. Per (%)
Avg Val, INRm
Free float (%)
Financials & Valuations (INR b)
Y/E Mar
Net Sales
EBITDA
PAT
EPS (INR)
Gr. (%)
BV/Sh (INR)
RoE (%)
RoCE (%)
P/E (x)
P/BV (x)
EV/EBITDA (x)
Estimate change
TP change
Rating change
2018E
462.4
42.1
22.0
12.6
(15.0)
67.1
20.2
14.5
9.3
1.7
5.2
S&P CNX
10,761
MRPL IN
EBITDA significantly above estimate; core GRM at USD6.8/bbl
1,753
MRPL’s 3QFY18 EBITDA was INR17.5b (+52% YoY, +93% QoQ), significantly
205.7 / 3.2
above our estimate of INR11.5b, led by higher than expected inventory gains
146/99
and throughput. The company booked a forex gain of INR1.9b v/s forex loss
-10/-18/-12
275.0
of INR670m in 2QFY18 and INR1.6b in 3QFY17. Interest cost was INR1.2b (-
11.4
17% YoY, +10% QoQ; our estimate: INR1.3b), depreciation was INR1.7b (+1%
CMP: INR117
TP: INR114(-3%)
Upgrade to Neutral
2019E
516.0
39.7
20.3
11.6
(7.7)
76.0
16.2
13.1
10.1
1.5
5.3
2020E
517.5
39.8
21.3
12.2
5.0
85.3
15.1
13.0
9.6
1.4
4.5
YoY, +1% QoQ; our estimate: INR1.9b) and other income was INR202m (-
68% YoY, -76% QoQ; our estimate: INR573m). Effective tax rate was 34% v/s
31% in 2QFY18 and 37% in 3QFY17. PAT was INR9.7b (+72% YoY, 103%
QoQ), significantly beating our estimate of INR5.9b.
Core GRM at USD6.8/bbl:
Core GRM stood at USD6.8/bbl v/s benchmark
Singapore GRM of USD7.3/bbl, USD5.3/bbl in 2QFY18 and USD5.1/bbl in
3QFY17. Inventory gain stood at USD2.45/bbl in 3QFY18 v/s a gain of
USD2.7/bbl in 2QFY18 and USD2.3/bbl in 3QFY17.
Crude throughput stood at 4.5mmt
(+3% YoY, +27% QoQ), implying 120%
utilization in the quarter, as against throughput of 3.53mmt (94% utilization)
in 2QFY18 and 4.35mmt (116% utilization) in 3QFY17.
Valuation and view:
We believe that the refinery should be able to report GRM
of USD6.5/bbl in FY19/20 including the benefit from its polypropylene plant. The
stock trades at 10.1x FY19E EPS of INR11.6 and EV of 5.3x FY19E EBITDA. We
value the stock at EV of 5x FY19-20E EBITDA to arrive at a fair value of
INR98/share for the standalone refinery and add INR16.3 for OMPL. Our fair
value stands at INR114 (September 2018 TP). The stock has corrected sharply in
the recent past; we upgrade the stock to
Neutral
from Sell.
4Q
1Q
133,349 102,624
43.5
21.8
15,540
5,827
11.7
5.7
1,703
1,637
1,219
1,074
375
204
12,993
3,320
-15,973
0
28,966
3,320
9,542
980
33
30
19,424
2,340
8,713
2,340
-35.5
-67.4
6.5
2.3
4.2
8.1
4.0
7.1
FY18
2Q
3Q
90,965 141,020
-8.8
22.9
9,082 17,495
10.0
12.4
1,701
1,720
1,053
1,159
828
202
7,156 14,819
259
0
6,898 14,819
2,118
5,110
31
34
4,780
9,709
4,959
9,709
19.2
71.5
5.5
6.9
3.5
5.3
4.5
6.8
(INR Million)
FY17 FY18E
FY18 Var. vs
4QE
3QE
est
127,829 432,079 462,438 132,750
6%
-4.1
9.0
7.0
15.7
9,669 47,076 42,073 11,540
52%
7.6
10.9
9.1
8.7
1,767 6,788 6,825 1,896
-9%
1,135 5,188 4,422 1,263
-8%
630 4,232 1,865
573
-65%
7,396 39,332 32,691 8,954
66%
0 -15,973
259
0
7,396 55,305 32,432 8,954
66%
2,465 18,877 10,673 2,984
71%
33
34
33
33
4,931 36,428 21,759 5,969
63%
4,931 25,907 21,933 5,969
63%
-43.4
98.3
-15.3
5.5
3.9
6.0
4.7
4.5
4.0
6.4
16.3
6.0
16.0
6.4
4.1
7.3
10%
-7%
Standalone - Quarterly Earning Model
Y/E March
Net Sales
YoY Change (%)
EBITDA
Margins (%)
Depreciation
Interest
Other Income
PBT before EO expense
Extra-Ord expense
PBT
Tax
Rate (%)
Reported PAT
Adj PAT
YoY Change (%)
Margins (%)
Key Assumptions
Refining throughput (mmt)
Core GRM (USD/bbl)
E: MOSL Estimates
FY17
1Q
2Q
3Q
84,288 99,690 114,753
-25.5
-2.5
30.1
12,206
7,855 11,476
14.5
7.9
10.0
1,703
1,681
1,702
1,459
1,115
1,395
2,295
926
636
11,340
5,984
9,015
0
0
0
11,340
5,984
9,015
4,155
1,826
3,355
37
31
37
7,185
4,159
5,660
7,185
4,159
5,660
36.0 -146.5
91.8
8.5
4.2
4.9
3.7
5.3
4.0
5.5
4.4
5.1
5 February 2018
12

3 February 2018
3QFY18 Results Update | Sector: Healthcare
GSK Pharma
Neutral
BSE SENSEX
35,067
Bloomberg
Equity Shares (m)
M.Cap.(INRb)/(USDb)
52-Week Range (INR)
1, 6, 12 Rel. Per (%)
Avg Val, INRm
Free float (%)
S&P CNX
10,761
GLXO IN
Revenue lower than expected; Margins surprised positively
85
GSK Pharma’s (GLXO) 3QFY18 sales increased marginally by 2% YoY (-16%
206.6 / 3.2
QoQ) to INR7b (10% miss). Other income came in lower at INR120m v/s
2795 / 2309
INR319m in 3QFY17. EBITDA increased significantly by 305% YoY to INR1.4b,
-4/-7/-33
30.0
primarily due to a lower base (3QFY17 was impacted by demonetization).
25.0
EBITDA margin stood at 20% (+1,510bp YoY). Adjusted PAT increased ~156%
CMP: INR2,439
TP: INR2,500(+2%)
Financials & Valuations (INR b)
2018E 2019E
Y/E Mar
Net Sales
29.5
33.0
EBITDA
5.0
5.6
PAT
4.2
4.7
EPS (INR)
49.1
54.9
Gr. (%)
42.9
11.9
BV/Sh (INR)
205.5
180.0
RoE (%)
23.9
30.5
RoCE (%)
22.2
28.5
P/E (x)
49.7
44.4
P/BV (x)
11.9
13.6
2020E
37.0
6.5
5.2
61.1
11.2
180.0
34.0
33.9
39.9
13.6
Estimate change
TP change
Rating change
YoY to INR897m on the back of operational leverage and a lower base.
Margins at a healthy level, but down sequentially:
GLXO’s sales grew
2% YoY (excluding deflationary impact on prices due to GST, growth would
have been ~7% YoY). Although revenue improved YoY, it was lower than our
estimate due to fewer new product launches and competition in existing
products. Margin improved YoY (+1,510bp YoY) primarily due to a lower
base (demonetization in 3QFY17), but contracted QoQ (-290bp QoQ) due to
a high base (re-stocking post GST in 2QFY18). Nevertheless, margins remain
at a decent level due to a change in the product mix, lower stock
impairments, and cost optimization. The company expects the EBITDA
margin to be in the range of 18-20% over the medium term.
Revenue improvement is key for growth:
GLXO’s manufacturing plant
at Vemgal is nearing completion (expected to be commissioned by mid-
CY18), post which we expect revenues to pick up. The company is planning
to diversify product portfolio going forward (currently >90% of revenue
comes from the acute business). According to AIOCD, FDC-related market
grew 4% YoY. Secondary sales of GLXO rose 11.2% YoY, while market
secondary sales increased 7.8% YoY in 3QFY18.
Valuation and view:
We believe GLXO has strong parent support, a
superior brand portfolio (competitive advantage), a high payout ratio
(>100%), and industry-leading return ratios (RoCE of ~30%). We maintain
our
Neutral
rating with a target price of INR2,500 @ 43x 1HFY20E EPS (v/s
INR2,500 @ 45x FY19E PER). We increase FY18E EPS by ~11% on the back of
margins improvement in the last two quarters, although the lower multiple
is attributed to lower-than-expected revenue growth.
5 February 2018
13

3 February 2018
Q3FY18 Results Update | Sector: Technology
Info Edge India
BSE SENSEX
35,067
Bloomberg
Equity Shares (m)
M.Cap.(INRb)/(USDb)
52-Week Range (INR)
1, 6, 12 Rel. Per (%)
Avg Val, INRm
Free float (%)
S&P CNX
10,761
INFOE IN
Pick-up seen in Recruitment and 99acres
126.4
170.0 / 2.6
Sold a small stake in Zomato to Ant Financial
1,458 / 796
3Q largely in line:
3QFY18 standalone revenue grew 22% YoY to INR2,272m,
led by a pickup in both Recruitment (20% YoY) and 99acres.com (31% YoY),
-4/24/38
from 6% YoY growth seen in 2Q. EBITDA margin expanded 940bp YoY to
108.0
58.5
34.7%, a beat of 20bp. On a YoY basis, with most expenses flattish, INFOE
CMP: INR1,347
TP: INR1,550(+15%)
Buy
Financials & Valuations (INR b)
2018E 2019E
Y/E Mar
9.1
10.4
Sales
3.1
3.7
EBITDA
2.6
3.2
PAT
23.4
26.3
EPS (INR)
49.0
12.5
EPS Gr. (%)
177.6
196.7
BV/Sh. (INR)
13.7
14.0
RoE (%)
13.7
14.0
RoCE (%)
57.7
51.3
P/E (x)
7.6
6.9
P/BV (x)
Estimate change
TP change
Rating change
has been able to ramp-up on advertising spend (+39% YoY). Adj. PAT grew
49% YoY to INR703m, below our estimates, due to lower other income.
2020E
Back on the growth trajectory:
Over the last few quarters, growth has fallen
in Recruitment due to softness in IT Services, and in 99acres due to
12.1
uncertainty around RERA. Although IT hiring continues to be subdued, a
4.7
meaningful pick-up was seen in other sectors; even the Gulf business saw
4.1
growth. At the same time, with the uncertainty factor around RERA waning,
33.4
a gradual revival is expected in the real estate business. Effectively, INFOE’s
27.1
performance trajectory has been thrown back to the levels before being
222.9
impacted by the pain points.
15.9
15.9
Zomato sees another round of funding:
INFOE divested its 6.66% stake in
40.3
Zomato to Ant Financial (an affiliate of Alibaba), out of its total holding of
6.0
44.74%. The divestment values Zomato at USD760m, but other transactions
in the same deal value the company at >USD1b, a tad more than the
previous round, which valued it at USD910m. Post the dilution (20%) in
Zomato’s equity, INFOE will end up holding 30.91% in Zomato, making
INFOE’s holding value INR22.4b (INR184 per share).
Valuation view:
Our standalone EPS estimates for FY20 have moved up by
9% to factor in the improving trajectory in major segments. We expect
INFOE to leverage any growth opportunity on offer from macro tailwinds in
the Recruitment and Real Estate segments. We see Naukri.com (pick-up in
economic growth), 99acres.com (lower competitive intensity) and
Zomato.com (focus on driving monetization and profitability) as the key
drivers of valuation at INFO. Our SOTP-based price target of INR1,550
implies a 15% upside. Maintain
Buy.
5 February 2018
14

2 February 2018
3QFY18 Results Update | Sector: Oil & Gas
Gujarat Gas
Buy
BSE SENSEX
35,067
Bloomberg
Equity Shares (m)
M.Cap.(INRb)/(USDb)
52-Week Range (INR)
1, 6, 12 Rel. Per (%)
Avg Val, INRm
Free float (%)
Financials & Valuations (INR b)
Y/E Mar
2018E 2019E
Net Sales
60.0
72.8
EBITDA
8.7
10.7
PAT
2.8
4.5
EPS (INR)
20.6
32.9
EPS Gr. (%)
28.2
59.6
BV/Sh (INR)
136.2
162.9
RoE (%)
16.1
22.0
RoCE (%)
15.5
19.6
P/E (x)
40.9
25.6
P/BV (x)
6.2
5.2
EV/EBITDA (x)
16.0
12.7
S&P CNX
10,761
GUJGA IN
EBITDA above estimate led by better volumes and EBITDA/scm
137.7
GUJGA reported EBITDA of INR2.0b (+17% YoY, -1% QoQ), above our
115.9/1.8
estimate of INR1.6b, led by better-than-expected volumes and margins. PAT
974/582
increased 42% YoY (-2% QoQ) to INR600m.
-4/3/20
71.0
PNG volumes strong:
PNG industrial/commercial volumes stood at
39.1
4.5mmscmd (+22% YoY, +11% QoQ), and PNG household volumes at
CMP: INR842
TP: INR1,014 (+20%)
2020E
83.5
12.4
5.8
42.3
28.7
197.3
23.5
23.1
19.9
4.3
10.6
Estimate change
TP change
Rating change
0.5mmscmd (+9% YoY, +14% QoQ). Despite higher spot LNG prices, the
company has seen a strong pick-up, led by higher offtake from industrial
customers.
CNG volumes up 11% YoY:
CNG volumes stood at 1.3mmscmd (+11% YoY,
+3% QoQ). Unless CNG volumes become a larger contributor, the company
would continue witnessing volatility in volumes and margins, in our view.
EBITDA/scm stood at INR3.5:
EBITDA/scm declined 1% YoY (-10% QoQ) to
INR3.5, above our estimate of INR3.1, led by higher gas cost. We have
modeled EBITDA/scm at INR4.3/4.4 for FY18/19.
Valuation and view
We expect volume to continue growing in FY19/20, primarily led by the PNG
industrial and commercial segment. Increasing CNG volumes are positive, as
it would reduce volatility in volumes and margins for GUJGA.
For FY18/19E, we model volumes of 6.80/7.75mmscmd and EBITDA/scm of
INR4.3/4.4.
We value the company at 27x. At 27x average FY19-20E EPS of INR37.6, we
value GUJGA at INR1,014, implying an upside of 30%. Maintain
Buy.
(INR Million)
FY18
3QE Var (%)
14,406
9.1
17.0
1,637
22.1
11.4
746
-7.7
307
58.6
130
-29.9
714
28.1
236
33.5
33.0
479
25.4
13.2
3.3
5.8
8.8
1.3
0.0
4.0
11.4
0.5
11.2
3.1
12.2
Standalone - Quarterly Earning Model
Y/E March
Net Sales
YoY Change (%)
EBITDA
Margins (%)
Depreciation
Interest
Other Income
PBT
Tax
Rate (%)
Reported PAT
YoY Change (%)
Margins (%)
Total volume (mmscmd)
CNG
PNG - Industrials/commercial
PNG - Households
EBITDA (INR/scm)
E: MOSL Estimates
1Q
12,247
-26.7
2,173
17.7
632
534
62
1,070
321
30.0
748
27.7
6.1
5.1
1.1
3.5
0.4
4.7
FY17
FY18
FY17
2Q
3Q
4Q
1Q
2Q
3Q
4QE
12,370 12,309 14,002 14,780 13,914 15,713 15,625 50,927
-21.3 -17.1
1.6
20.7
12.5
27.7
11.6 -16.6
2,094 1,709 1,463 2,698 2,027 1,999 1,953 7,440
16.9
13.9
10.4
18.3
14.6
12.7
12.5
14.6
645
653
643
666
683
688
718 2,672
541
539
476
496
499
487
472 2,090
52
75
71
78
89
91
102
371
959
593
415 1,615
934
915
866 3,050
265
170
84
571
323
315
286
839
27.6
28.6
20.2
35.4
34.6
34.4
33.0
27.5
695
423
331 1,044
611
600
580 2,210
150.3
31.5 -63.9
39.4 -12.1
41.9
75.1
7.0
5.6
3.4
2.4
7.1
4.4
3.8
3.7
4.3
5.2
5.3
6.1
6.1
5.7
6.3
6.2
5.4
1.2
1.2
1.2
1.3
1.3
1.3
1.3
1.2
3.6
3.7
4.3
4.4
4.0
4.5
4.3
3.8
0.4
0.5
0.6
0.4
0.5
0.5
0.5
0.5
4.4
3.5
2.7
4.8
3.8
3.5
3.5
3.8
FY18E
60,032
17.9
8,677
14.5
2,754
1,954
360
4,329
1,495
34.5
2,834
28.2
4.7
6.1
1.3
4.3
0.5
3.9
5 February 2018
15

3 February 2018
Q3FY18 Results Update | Sector: Financials
Union Bank
BSE SENSEX
35,067
Bloomberg
Equity Shares (m)
M.Cap.(INRb)/(USDb)
52-Week Range (INR)
1, 6, 12 Rel. Per (%)
Avg Val, INRm
Free float (%)
S&P CNX
10,761
UNBK IN
Asset quality pressure continues; maintain Neutral
687
UNBK reported a loss of INR12.5b. PPoP growth of -15%/-11% QoQ/YoY was
98.4 / 1.5
nullified by elevated provisions of INR32.5b (8% QoQ decline) as the bank
205/124
provided INR9.9b towards the NCLT 2
nd
list in advance, thereby taking care
-14/-21/-40
of all provisioning needed towards these accounts by FY18. Provisions also
775.0
included INR481m of additional provisions towards standard accounts in
44.5
CMP: INR128
TP: INR145 (+13%)
Neutral
Financials & Valuations (INR b)
Y/E March
2018E 2019E
NII
96.4
121
OP
72.2
96.0
NP
-38.3
7.2
EPS (INR)
-40.5
5.9
EPS Gr. (%)
NA
NP
BV/Sh. (INR)
202.4
234
RoE (%)
-16.7
2.7
RoA (%)
-0.8
0.1
P/E(X)
NA
24.1
P/BV (X)
0.7
0.6
2020E
123
95.9
18.9
15.3
158.0
247
6.4
0.3
9.3
0.6
telecom and power sector.
NII growth picked up on a moderate base to 19% YoY to INR25.5b, even with
an interest reversal of INR3.8b. Domestic/Global NIM came in at
2.34%/2.12% (2.19%/2.08% in 2QFY18). Muted trading gains of (INR60m
compared to INR4.8b in 2Q) led to 35% YoY decline in in other income.
Gross slippages spiked 56% QoQ to INR41.9b (5.8% slippage ratio) vs
INR26.9b last quarter, while recoveries and upgrades picked up to INR6.9b,
leading to net slippage ratio of 5.3%. Total pool of NSL (NNPL + OSRL + other
stressed loans) declined to INR301.4b (10.3% of advances) from 11.5% in the
previous quarter. During the quarter the bank witnessed slippage in one
power account of INR5.5b
Other highlights:
(1) RAM portfolio grew 12% YoY, led by 18% growth in
retail (2) CASA deposits declined 3% YoY, as CA deposits declined 9%. CASA
ratio stood at 34%.
Valuation and view:
Balance sheet recalibration is evident from stronger
focus on RAM portfolio. However, ageing of the NPL portfolio and continued
elevated slippages and credit costs will pressurize earnings. Resultantly, we
expect RoA/RoE to remain sub-optimal at 0.3/6% for FY19. We cut earnings
sharply for FY18E to factor in pressure on NIMs and higher credit costs and
build in INR45.2b of capital infusion from the GOI in 4QFY18 (recap bonds)
and another INR40b of capital raise in FY19. Maintain
Neutral
with a TP of
INR145 (0.6x Mar 20 BV) view of prolonged pressure on profitability.
5 February 2018
16

RESULTS
FLASH
3 February 2018
Results Flash | Sector: Cement
JK Cement
Buy
BSE SENSEX
35,067
S&P CNX
10,761
CMP: INR1,095
TP: INR1,324(+21%)
Conference Call Details
Date:
6
th
Feb 2018
Time:
04:00pm IST
Dial-in details:
+91-22-3938 1073
Financials & Valuations (INR b)
2018E 2019E
Y/E Mar
Net Sales
47.8
53.9
EBITDA
8.8
10.0
NP
3.3
4.3
EPS (INR)
47.8
61.8
EPS Gr. (%)
41.7
29.5
BV/Sh. (INR)
294.9 350.7
RoE (%)
17.5
19.2
RoCE (%)
11.0
12.0
P/E (x)
22.9
17.7
P/BV (x)
3.7
3.1
2020E
58.8
11.5
5.5
79.1
27.8
422.8
20.4
13.1
13.9
2.6
Margins impacted due to sequentially weaker realizations
White Cement volumes at 0.3mt (+12%YoY) ( in line with est.) led by 20% YoY
growth in wall putty due to ramp up of new capacity. Grey Cement volume
(including clinker sales) increased by 22%YoY to 2.03mt (est 1.94mt) led by
growth in both North and South operations as well as higher clinker sales.
Revenue at INR11.26b, +24%YoY (est INR11.25b) led by strong volume growth
in grey segment. Grey cement realizations stood at INR 3817/ton (-3% QoQ,
+7% YoY); Sequential decline in realizations was driven by lower realizations in
North markets (-3% QoQ) and South region (-5% QoQ).
EBITDA at INR1.7b, flat YoY (est. INR1.83b) | margins at 15% (-3.6pp YoY, -
3.5pp QoQ) led by weaker realizations. Grey cement EBITDA/t at INR 376 ( -
17%YoY) due to cost push on account of higher power and fuel cost and freight
cost. This was partially offset by increase in realization (+7% YoY).
White cement realizations increased 2% QoQ as led by better pricing.
Adj.PAT at INR730mn (+ 11% YoY) led by lower interest and depreciation.
Net debt has been reduced by INR1.66b in 9MFY18.
Management has approved brownfield expansion of 4.2mt of grey cement
capacity with clinker unit in Rajasthan and associated split grinding unit in
Rajasthan, U.P and Gujarat at a capex of INR20b (USD73/t ).
Key questions for the management
Volume guidance for FY18
Pricing trend in its focus markets
Impact of increase in input cost in profitability in coming quarters.
Valuation and view:
The stock trades at 9.9x/8.5x FY19/FY20E EV/EBITDA. We
value the stock at 9.9x FY20E EBITDA to arrive at a target price of INR 1,324.
Buy
FY17
2Q
1.92
5.1
4,800
1.4
1.1
9,221
6.6
1,573
17.1
437
691
78
522
0
522
112
21.6
409
409
181.4
FY18
3Q
1.93
-4.5
4,717
5.6
-1.7
9,101
0.9
1,705
18.7
447
662
218
815
-7
822
158
19.2
665
659
272.8
4Q
2.15
-1.2
4,787
10.2
1.5
10,297
8.9
1,922
18.7
452
628
418
1,260
89
1,171
258
22.0
913
983
40.3
1Q
2.12
12.7
4,902
3.3
2.4
10,415
16.4
1,977
19.0
450
680
186
1,033
0
1,033
240
23.2
793
793
13.1
2Q
2.22
15.8
4,981
3.8
1.6
11,077
20.1
2,072
18.7
492
633
220
1,167
-46
1,213
281
23.2
931
896
119.1
3Q
2.32
20.4
4,847
2.8
-2.7
11,261
23.7
1,702
15.1
451
578
249
923
1
922
193
20.9
729
730
10.9
(INR Million)
FY18
Var (%)
3QE
2.3
3
16.6
5,002
-3
6.0
0.4
11,256
0
26.8
1,836
-7
16.3
490
-8
630
-8
220
13
936
-1
0
936
-1
215
23.0
720
1
720
1
9.4
Quarterly Performance (Standalone)
Y/E March
Sales Dispatches (m ton)
YoY Change (%)
Realization (INR/ton)
YoY Change (%)
QoQ Change (%)
Net Sales
YoY Change (%)
EBITDA
Margins (%)
Depreciation
Interest
Other Income
PBT before EO expense
Extra-Ord expense
PBT
Tax
Rate (%)
Reported PAT
Adj PAT
YoY Change (%)
1Q
1.89
4.1
4,747
5.9
9.3
8,951
10.2
1,749
19.5
425
675
191
840
111
729
121
16.5
609
702
6,536.2
5 February 2018
17

2 February 2018
Q3FY18 Results Update | Sector: Automobiles
CEAT
Buy
BSE SENSEX
35,067
Bloomberg
Equity Shares (m)
M.Cap.(INRb)/(USDb)
52-Week Range (INR)
1, 6, 12 Rel. Per (%)
Avg Val, INRm
Free float (%)
S&P CNX
10,761
CEAT IN
Results below estimates; Heavy capex planned for expansion
40
Results below estimates:
3QFY18 revenue rose 12.6% YoY on a like-to-like
66.7 / 1.0
basis (after netting off excise of INR1,596m from 3QFY17 revenue) to
1,948 / 1,060
INR15,742m (est. INR16,974m). EBITDA increased 22% YoY to INR1,870m
-18/-13/15
1324.0
(est. of INR2,054m) from INR1,535m in 3QFY17. EBITDA margin expanded
49.2
90bp YoY to 11.9% (est. of 12.1%), driven by 50bp gross margin expansion.
CMP: INR1,650
TP: INR1,899(+15%)
Financials & Valuations (INR b)
2018E 2019E
Y/E Mar
Net Sales
63.4
70.1
EBITDA
5.9
7.7
PAT
2.6
3.4
EPS (INR)
63.1
84.7
Gr. (%)
-32.3
34.1
BV/Sh (INR)
650.5
723.9
RoE (%)
10.1
12.3
RoCE (%)
8.8
10.0
P/E (x)
26.1
19.5
P/BV (x)
2.5
2.3
2020E
83.3
10.2
4.5
111.7
31.9
820.8
14.5
11.1
14.8
2.0
Estimate change
TP change
Rating change
Consequently, adj. PAT stood flat YoY at INR833m (est. of INR1,107m).
Expect raw material price fluctuation in 1QFY19:
CEAT’s raw material prices
declined 240bp QoQ in 3QFY18. Rubber prices came down further in 3QFY18
after stabilizing in 2QFY18. However, the cost of crude, which forms ~45% of
raw material cost, has shot up. Nevertheless, due to the three-month
lagging effect, raw material cost is expected to remain stable in 4QFY18, and
the impact in the form of ~5% increase is expected in 1QFY19.
Heavy capex to ramp up capacities:
CEAT is expected to incur capex of
INR21b in FY19 and FY20 to ramp up facilities at Halol, Nagpur and
Ambernath (40 tonnes/day). On account of anti-dumping duty on import of
TBR being introduced in 2QFY18, the commercial segment has picked up
better than other segments. However, CEAT’s growth in this segment has
been limited because of capacity constraints, which the company intends to
overcome via aggressive capacity expansion.
Valuation view:
CEAT has earmarked heavy capex of INR15b in FY19 and
INR6b in FY20 to ramp up its capacities. Capacity expansion will help the
company to expand its market share in key segments. However, in the near
term, it will result in a spike in debt, which will peak in FY20 (estimated
~INR18b). Consequently, we cut our earnings estimate by 27%/21% for
FY19E/20E and value the company at 17x FY20E EPS. Maintain
Buy
with a
target price of INR1,899 (15% upside).
5 February 2018
18

J K Lakshmi Cement
BSE SENSEX
35,067
Bloomberg
Equity Shares (m)
M.Cap.(INRb)/(USDb)
52-Week Range (INR)
1, 6, 12 Rel. Per (%)
Avg Val, INRm
Free float (%)
S&P CNX
10,761
JKLC IN
EBITDA miss led by lower-than-estimated realizations
117.7
Weaker realizations in focus markets:
JKLC’s volume grew 15% YoY (+12%
47.9 / 0.7
QoQ) to 2.11mt v/s our estimate of 2.02mt, led by ramp-up of new capacity
535 / 375
in east. Realizations rose 9% YoY (-3.4% QoQ) to INR3,969/t, lower than our
-12/-18/-21
estimate of INR4,259/t, due to weaker pricing in focus regions. Revenue
64.0
grew 25% YoY (+8% QoQ) to INR8.4b (est. of INR 8.6b). EBITDA grew 14%
54.1
3 February 2018
3QFY18 Results Update | Sector: Cement
CMP: INR407
TP: INR470(+16%)
Buy
Financials & Valuations (INR b)
2018E
2019E
Y/E Mar
35.7
40.3
Net Sales
4.6
6.3
EBITDA
1.1
2.2
PAT
9.4
18.5
EPS (INR)
34.7
97.2
Gr. (%)
125.6
142.9
BV/Sh (INR)
7.7
13.8
RoE (%)
7.5
9.4
RoCE (%)
43.4
22.0
P/E (x)
3.2
2.8
P/BV (x)
2020E
45.6
7.4
2.9
25.0
35.2
166.7
16.1
11.5
16.3
2.4
Estimate change
TP change
Rating change
YoY (-1% QoQ) to INR943m v/s estimate of INR1.2b (margin: 11.3%, -1.05pp
YoY, -1.02pp QoQ), translating into EBITDA/ton of INR447 (flat YoY, -INR58/t
QoQ) v/s estimates of INR576/t. Tax rate was 32.5% in 3Q v/s tax inflow of
INR27m. Net profit stood at INR86m (+13% YoY) v/s estimate of INR301m.
Unitary cost up 10%YoY:
Unitary cost/t increased 10% YoY (-2% QoQ) due to
an increase in power & fuel and freight cost. Other expenses increased 34%
YoY to INR811m, which further dented margins.
Management commentary:
1) JKLC’s north volumes increased 10% YoY to
1.37mt, while east volumes rose 29% YoY to 0.54mt for 3QFY18. 2) EBITDA/t
differential between north and east operations is ~INR350/t: INR150/t due
to cost differential and INR200/t due to realization difference. 3)
Commissioning of WHRS should reduce cost by INR 80/t for eastern
operations, while commissioning of the thermal power plant in east in
3QFY19 should reduce cost by INR100/t for the region. 4) OPC is 38%, PPC is
57% and slag is 5% of overall volumes.
Market mix favorable:
We continue remaining positive on the company due
to its higher exposure to the north market, which we believe is likely to see
highest realization increase due to utilization improvement. However,
turnaround of eastern operations would be a key monitorable. The stock
trades at 9.1x/7.2x FY19E/20 EV/EBITDA and USD71/66 per ton on FY19/20
capacity. We value JKLC at EV of 8x FY20 EV/EBITDA (implied EV of USD 78
on FY20 capacity), translating to INR470/share. Maintain
Buy.
(INR Million)
4Q
2.28
6.0
3,531
3.5
-3.1
8,067
9.7
716
8.9
457
466
263
55
0
55
-152
-274.5
207
-19.8
2.6
1Q
2.29
8.0
3,944
7.4
11.7
9,011
15.9
1,203
13.4
439
492
102
374
0
374
91
24.4
283
-1.2
3.1
FY18
2Q
1.89
10.0
4,109
7.7
4.2
7,767
18.5
954
12.3
447
489
169
188
0
188
56
29.6
132
-46.9
1.7
3Q
2.11
14.6
3,969
8.9
-3.4
8,374
24.8
943
11.3
448
514
146
127
0
127
41
32.5
86
13.0
1.0
FY17
4QE
2.56
7.97
12.2
8.7
4,127
3,651
16.9
2.2
4.0
10,578 29,104
31.1
11.1
1,509
3,654
14.3
12.6
429
1,724
524
1,887
133
698
689
742
0
0
689
742
87
(77)
12.7
-10.4
602
819
190.0 -1,694.8
5.7
2.8
FY18E
8.85
11.0
4,038
10.6
35,730
22.8
4,610
12.9
1,763
2,019
550
1,379
0
1,379
276
20.0
1,103
34.7
3.1
3QE Var (%)
2.02
4
10.0
4,259
-7
16.9
3.7
8,624
-3
28.6
1,166
-19
13.5
440
450
100
376
0
376
-66
75
20.0
301
-71
295.9
3.5
Quarterly performance
Y/E March
Sales Dispatches (m ton)
YoY Change (%)
Realization (INR/ton)
YoY Change (%)
QoQ Change (%)
Net Sales
YoY Change (%)
EBITDA
Margins (%)
Depreciation
Interest
Other Income
PBT before EO expense
Extra-Ord expense
PBT
Tax
Rate (%)
Adj PAT
YoY Change (%)
Margins (%)
1Q
2.12
27.9
3,673
2.9
7.7
7,772
31.6
1,175
15.1
412
463
104
404
0
404
118
29.1
286
-244.1
3.7
FY17
2Q
3Q
1.72
1.84
-1.7
4.0
3,816
3,645
3.3
-0.5
3.9
-4.5
6,556
6,709
1.5
3.5
937
826
14.3
12.3
412
443
471
486
179
152
233
49
0
0
233
49
-16
-27
-6.8
-54.5
249
76
-545.5 -1,433.3
3.8
1.1
5 February 2018
19

3 February 2018
3QFY18 Results Update | Sector: Others
BSE
BSE SENSEX
35,067
Bloomberg
Equity Shares (m)
M.Cap.(INRb)/(USDb)
52-Week Range (INR)
1, 6, 12 Rel. Per (%)
Avg Val, INRm
Free float (%)
S&P CNX
10,761
BSE IN
54.8
57.2 / 0.9
…But there is still time before these move the needle
1200 / 842
Revenue beat but profit miss:
BSE’s 3QFY18 consolidated revenues grew to
-13/-29/-19
INR1.37b excluding investment income, above our estimate of INR1.26b, as
271.0
the move to shift pricing to per-trade / per-order basis had lower impact
100.0
CMP: INR848
TP: INR950 (+12%)
Neutral
Continued progress in new segments…
Financials & Valuations (INR b)
Y/E March
FY18E FY19E
Net Sales
5.1
5.4
EBITDA
1.5
1.7
PAT
2.3
2.7
EPS (INR)
41.8
45.5
EPS Gr (%)
2.0
8.7
BV / Sh (INR)
492
617
P/E (x)
7.2
20.5
P / BV (x)
1.9
1.5
RoE (%)
8.5
7.4
RoCE (%)
11.1
9.6
Estimate change
TP change
Rating change
than anticipated. EBITDA margin expanded 8pp YoY to 33%, missed our
estimate by 80bp due to total expenditure of INR920m (+15% YoY), v/s
FY20E
estimate of INR834m.
PAT was INR686m, below our estimate of INR794m,
5.8
mainly led by MTM losses on FMPs and lower operating margin.
2.0
New segments continue to build momentum:
Average daily traded
3.0
contracts in INX were 10,248 in the month of December 2017, up
49.4
significantly from range of 2000-4000 contracts in the previous months. This
8.6
628
was partly helped by liquidity enhancement incentives introduced in the
18.8
segment since November. Listing related income from SMEs increased 44%
1.5
YoY. 9MFY18 turnover was up 87% here. MF orders on BSE’s Star MF
7.9
platform increased 154% YoY. Likewise, ADT in interest rate futures was up
10.0
65% YoY and up 29% YoY in currency derivatives for 9MFY18
Valuation and view:
BSE has been partaking in the market momentum with
a healthy growth in volumes that have prevailed in recent quarters. Going
forward, scaling of new segments should continue to drive growth in
earnings, given that the benefits should flow directly to the bottom line with
costs already baked in. This would also improve the earnings quality as
dependency on cash income reduces. However, we estimate FY20 PBT to
still have only ~30% contribution from profits outside of investment income.
We arrive at our price target of INR950 by discounting forward core
operating earnings (ex-CDSL) by 25x (INR520/share), and applying 20%
holding company discount to CDSL’s market value (INR120/share) and
unencumbered cash at 1x (INR290/share). Maintain
Neutral.
1Q
1,285
24.7
947
338
26.3
118
2
552
770
136
634
110
17.4
87
437
549
135.3
42.8
FY17
2Q
3Q
1,392 1,323
30.4
14.1
935
989
456
334
32.8
25.3
126
135
4
3
630
514
957
711
72
0
885
711
127
76
14.4
10.7
118
106
640
529
701
529
44.0
62.2
50.4
40.0
4Q
1,628
17.8
1,332
296
18.2
161
2
684
817
0
817
93
11.4
122
601
601
2.7
36.9
1Q
1,174
-8.6
868
306
26.1
101
2
410
613
0
613
118
19.2
-2
497
497
-9.5
42.4
FY18
2QE
3QE
1,232 1,168
-11.5
-11.7
848
875
384
293
31.2
25.1
109
136
4
-1
460
547
731
706
5
-2
727
708
126
153
17.4
21.6
-68
-84
668
639
672
637
-4.2
20.4
54.6
54.5
FY17
4QE
1,228
-24.5
920
308
25.1
143
-1
575
742
-2
744
161
21.6
-88
671
669
11.4
54.5
5,628
20.1
4,369
1,258
22.4
540
10
2,380
3,089
3,089
406
13.2
435
2,248
2,248
32.5
39.9
FY18E
4,800
-14.7
3,510
1,291
26.9
488
3
1,991
2,790
2,790
558
20.0
-242
2,475
2,475
10.1
51.6
Est. 2Q Var. (%/bp)
1,132
8.8
-18.7
716bp
947
-10.5
185
107.3
16.3
1481bp
127
-14.0
0
586
-21.4
643
13.6
0
643
12.9
130
-3.0
20.2
-286bp
-79
-13.5
592
12.9
592
13.6
-15.6
1145bp
52.3
229bp
Quarterly Performance (Consolidated)
Y/E March
Revenue from operations
YoY Change (%)
Total Expenditure
EBITDA
Margins (%)
Depreciation
Interes t
Inves tment income
PBT before EO expense
Extra-Ord expens e
PBT
Tax
Rate (%)
Minority Interes t & P/L of As s o. Cos .
Reported PAT
Adj PAT
YoY Change (%)
Margins (%)
5 February 2018
20

2 February 2018
3QFY18 Results Update | Sector: Financials
J&K Bank
Buy
BSE SENSEX
35,067
Bloomberg
Equity Shares (m)
M.Cap.(INRb)/(USDb)
52-Week Range (INR)
1, 6, 12 Rel. Per (%)
Avg Val, INRm
Free float (%)
S&P CNX
10,761
JKBK IN
Balance sheet growth picking up with improvement in asset quality
484.9
JKBK reported PAT of INR725m in 3QFY18 (+1.1% QoQ), exceeding our
35.2/0.5
estimate by 3%, aided by 33.8% growth in NII. PPoP was up 30.6% YoY (4%
96/63
beat), despite high opex (23.1% YoY), raising the CI ratio to 57%. Provisions
-19/-23/-22
of INR2.5b were 5% below our estimate. Tax rate for 3QFY18 was 45.4% (v/s
64.0
40.9% in 2QFY18).
40.8
NII grew ~34% YoY (+8% QoQ), led by an improvement in margins to 4%
CMP: INR70
TP: INR100 (+44%)
Financials & Valuations (INR b)
Y/E March
2018E 2019E
NII
30.3
33.8
OP
16.9
19.2
NP
4.6
6.8
NIM (%)
3.8
3.7
EPS (INR)
8.6
12.2
EPS Gr. (%)
NA
46.2
BV/Sh. (INR)
97.2
107.0
ABV/Sh. (INR)
68.1
80.9
RoE (%)
8.9
11.9
RoA (%)
0.5
0.7
P/E(X)
8.1
5.7
P/BV (X)
0.7
0.7
2020E
39.4
23.6
9.3
3.6
16.8
37.7
121.3
95.2
14.7
0.8
4.2
0.6
(+24bp QoQ, +103bp YoY) and a pick-up in loan growth (INR579b,
+12.8%/+28.5% QoQ/YoY). NIM improved despite 27bp/55bp QoQ/YoY
decline in yield on advances, as the bank shifted its treasury portfolio for
growing loans.
Both slippages (INR3.7b, INR4.8b in 2Q) and recoveries & upgrades (INR1.2b,
INR1.4b in 2Q) moderated sequentially, leading to a 4.2% sequential
increase in GNPA (INR62.3b, 10.11% of advances). However, PCR stood
strong at 69.5% (28bp increase from 2QFY18). NNPA stood at INR24.9b
(4.29% v/s 4.76% of advances in 2Q). Std. restructured loans stood at
INR56.7b (9.8% of loans). Std. SDR book stood at INR5.5b as at 3QFY18.
Other highlights:
(1)
Share of J&K state loans decreased to ~48.14% v/s
51.8% in 2QFY18,
(2)
CASA ratio stood at 49.9% (-97bp QoQ).
(3)
The bank is
aiming to raise INR6-7b of equity within a total planned capital raise of
INR20b, including equity, AT1 bonds and T2 bonds.
Valuation and view:
Management is focused on purging the balance sheet,
growing the J&K business, and monitoring and resolving problematic assets
outside the home state. We believe asset quality will gradually turn a corner led
by controlled slippages, while large proportion of rehabilitated loans may turn
standard over the next two quarters. We cut FY19E PAT by 3% to account for a
sharp pick-up in margins and maintain our TP of INR100 (upside of 44%), which
corresponds to 1.1x Mar-20E ABV.
5 February 2018
21

Sector Update| 2 February 2018
Automobiles
Bajaj Auto
CMP: INR3,242
Bloomberg
Equity Shares (m)
52-Week Range (INR)
1, 6, 12 Rel. Per (%)
BJAUT IN
289.4
3122/2366
2/-6/0
2020E
309
65.3
60.3
208
16.0
824
26.8
33.8
49.0
15.6
3.9
11.4
2.6
TP: INR4,023 (+22.1%)
Buy
Jan-18 dispatch above est at 353k (est. 299k); +46% YoY
Domestic volume rises 49.6% YoY; exports grow 41.4% YoY
M.Cap. (INR b) / (USD b) 840.6/13.1
Financial & Valuation (INR b)
Y/E MARCH
2018E 2019E
Sales
239 271
EBITDA
45.5 56.1
Consol. NP
43.3 52.0
ConsEPS(INR)
150 180
EPS Gr. (%)
6.1 20.0
BV/Sh. (INR)
651 729
RoE (%)
24.2 26.0
RoCE (%)
21.9 23.8
Payout (%)
52.2 50.2
Valuation
P/E (x)
21.7 18.1
P/BV (x)
5.0
4.4
EV/EBITDA (x) 17.2 13.6
Div. Yield (%)
2.0
2.3
BJAUT’s Jan-18 sales at 353.1k units (above est. of 299k units), were higher by 46%
YoY. Domestic volume increased by 49.6% YoY to 202.2k (est. 162k) while exports
increased 41.4% YoY to 151k (est. 137k). Overall FY18 volume est. is at 3.92m, asking
for a residual monthly run rate of 301.2k units.
Overall motorcycle volumes increased by 36.4% YoY . Domestic motorcycle dispatches
increased by ~36% YoY to 163k. Motorcycle exports grew ~37% YoY to 125.8k units.
3W volumes remained strong with overall volume growing 113% YoY. Domestic 3Ws
volume continued their positive growth trajectory at 39.1k units, growing 154% YoY.
3W exports at 25.1k units grew 71% YoY.
The company launched the New Discover 110, Discover 125, all new Avenger Cruise
220 and Avenger Street 220 in Jan-18. It expects to improve market share in the
domestic market led by these launches.
The stock trades at 18.1x/15.6x FY19E/20E consol. EPS. Maintain Buy.
Snapshot of volumes for Jan-18
YoY
Company Sales
Bajaj Auto
Motorcycles
Three-Wheelers
Domestic
Exports
Jan-18
353,147
288,936
64,211
202,193
150,954
YoY (%)
chg
241,917
46.0
211,824
36.4
30,093 113.4
135,188
49.6
106,729
41.4
Jan-17
MoM
MoM
FY18YTD FY17YTD
Dec-17
(%) chg
292,547
20.7 3,314,560 3,120,154
228,762
26.3 2,801,881 2,730,739
63,785
0.7 512,679 389,415
149,509
35.2 1,926,591 1,926,229
143,038
5.5 1,387,969 1,193,925
(%)
chg
6.2
2.6
31.7
0.0
16.3
Residual Residual FY18 YTD
Growth Monthly Monthly
FY18
Gr. (%)
(%) Run rate Run rate
estimate
3,916,894
6.8
10.4 301,167 331,456
3,303,922
2.6
2.6 251,020 280,188
612,973
37.4
77.2 50,147 51,268
2,271,453
1
5.0 172,431 192,659
1,645,441
16.6
18.4 128,736 138,797
5 February 2018
22

Hero MotoCorp
CMP: INR3,624
Stock Info
Bloomberg
Equity Shares (m)
M.Cap.(INR b)/ (USDb)
52-Week Range (INR)
1, 6, 12 Rel. Per (%)
HMCL IN
199.7
635/9.5
3813 / 2844
9/-1/4
TP: INR3,922 (+8.2%)
Neutral
Above estimate at 641.5k (v/s est 535k); grows 31.7% YoY
Financials Snapshot (INR b)
Y/E MARCH 2018E 2019E 2020E
Sales
310.4 339.8 372.2
EBITDA
51.3 54.3
59.7
NP
36.2 38.7
42.9
Adj. EPS (INR) 181.3 193.9 214.2
EPS Gr. (%)
7.2
6.9
10.4
BV/Sh. (INR) 579.2 664.7 768.7
RoE (%)
33.4 31.2
29.9
RoCE (%)
32.2 30.2
29.1
Valuations
P/E (x)
20.0 18.7
16.9
P/BV (x)
6.3
5.5
4.7
EV/EBITDA (x) 12.6 11.7
10.5
Div. Yield (%)
2.5
2.5
2.5
HMCL’s Jan-18 volumes were above our estimates at 641,501 units (+31.7% YoY, est
535,000 units). Our FY18 total volume estimate is 7.38m units, asking for a residual
monthly run rate of ~576k units.
Mr. Ashok Bhasin, Head of Sales, Marketing & Customer Care, said “Our robust double
digit growth in overall two-wheeler sales has been driven by very strong growth in
both Scooters and Motorcycles. We are confident of maintaining our growth trajectory
and setting a new industry benchmark in sales for the full year.”
Apart from the new 125cc Super Splendor, the 110cc Passion PRO and the 110cc
Passion XPRO which were unveiled recently, it unveiled its premium motorcycle
‘Xtreme 200R’, sales of which will begin from Apr-18.
HMCL trades at 18.7/16.9x FY19E/20E EPS. Maintain Neutral.
Snapshot of volumes for Jan-18
YoY
Company Sales
Hero MotoCorp
MoM
Residual Residual FY18 YTD
Growth Monthly Monthly
YoY (%)
MoM
(%)
FY18
Jan-18 Jan-17
FY18YTD FY17YTD
Dec-17
Gr. (%)
(%) Run rate Run rate
chg
(%) chg
chg estimate
641,501 487,088
31.7 472,731
35.7 6,222,787 5,529,186 12.5 7,375,515
10.7
1.6 576,364 622,279
5 February 2018
23

December 2017 Results Preview | Consumer
Colgate
Bloomberg
Equity Shares (m)
M. Cap. (INR b)/(USD b)
52-Week Range (INR)
1,6,12 Rel Perf. (%)
CLGT IN
272.0
298 / 5
1176 / 863
4 / -11 / -5
CMP: INR1,096 TP: INR1,357 (+24%)
Gross margins are expected to expand by 30bp YoY to 64.2%.
Buy
We expect Colgate’s (CLGT) sales to grow 12.5% YoY to INR9.8b,
with 10% toothpaste volume growth.
Financial Snapshot (INR b)
Y/E March
2017 2018E 2019E 2020E
Sales
EBITDA
Adj. PAT
Adj. EPS (INR)
EPS Gr. (%)
BV/Sh.(INR)
RoE (%)
RoCE (%)
Payout (%)
Valuation
P/E (x)
P/BV (x)
EV/EBITDA (x)
Div. Yield (%)
51.6
23.4
31.2
0.9
46.8
22.3
27.5
1.5
39.1
20.9
23.6
1.8
32.5
19.3
20.1
2.2
39.8
9.4
5.8
21.2
-5.7
46.8
50.1
49.3
48.8
42.0
10.6
6.4
23.4
10.3
49.2
48.8
47.8
70.0
47.8
12.3
7.6
28.1
19.8
52.4
55.2
54.1
70.0
54.7
14.3
9.2
33.7
20.2
56.7
61.8
60.7
70.0
We estimate EBITDA margin expansion of 130bp YoY to 25.8%.
Hence, we have modeled EBITDA growth of 18.5% and adjusted
PAT growth of 17.2% for the quarter.
The stock trades at 39.1x/32.5x FY19E/20E EPS of
INR28.1/INR33.7; we have a Buy rating on the stock.
Key issues to watch for
Volume growth in toothpaste and market share movement.
Ad spends and competitive intensity in toothpaste, especially
from Patanjali.
Quarterly Performance
Y/E March
Toothpaste Volume Gr %
Net Sales
YoY Change (%)
COGS
Gross Profit
Gross Margin (%)
Other operating Expenses
% to sales
EBITDA
Margins (%)
YoY Growth (%)
Depreciation
Financial other Income
PBT
Tax
Rate (%)
Adj PAT
YoY Change (%)
E: MOSL Estimates
1Q
5.0
10,131
8.8
3,822
6,309
62.3
4,197
41.4
2,113
20.9
3.7
316
101
1,897
640
33.7
1,257
1.3
FY17
2Q
4.0
10,566
9.5
3,910
6,656
63.0
3,909
37.0
2,748
26.0
8.1
333
113
2,527
714
28.3
1,813
15.6
3Q
-12.0
8,746
-8.6
3,159
5,587
63.9
3,446
39.4
2,141
24.5
-10.3
342
109
1,908
630
33.0
1,278
-12.8
4Q
-3.0
10,375
2.2
3,877
6,498
62.6
4,055
39.1
2,443
23.5
1.2
341
80
2,182
756
34.6
1,426
-0.5
1Q
-5.0
9,781
-3.5
3,584
6,197
63.4
3,979
40.7
2,218
22.7
5.0
373
125
1,970
606
30.8
1,364
8.5
FY18
2Q
-0.9
10,849
2.7
3,970
6,879
63.4
3,873
35.7
3,006
27.7
9.4
392
89
2,703
927
34.3
1,776
-2.1
FY17
3QE
10.0
9,839
12.5
3,524
6,315
64.2
3,779
38.4
2,536
25.8
18.5
403
120
2,253
755
33.5
1,498
17.2
4QE
8.0
11,564
11.5
4,302
7,262
62.8
4,418
38.2
2,844
24.6
16.4
424
164
2,585
850
32.9
1,734
21.6
-1.5
39,818
2.9
14,768
25,050
62.9
15,606
39.2
9,444
23.7
0.7
1,332
403
8,514
2,740
32.2
5,774
1.2
FY18E
3.0
42,033
5.6
15,379
26,653
63.4
16,049
38.2
10,605
25.2
12.3
1,592
497
9,510
3,138
33.0
6,372
10.3
5 February 2018
24

December 2017 Results Preview | Sector: Media
Entertainment Network
Bloomberg
Equity Shares (m)
M. Cap. (INR b)/(USD b)
52-Week Range (INR)
1,6,12 Rel Perf. (%)
ENIL IN
47.7
35 / 1
1008 / 715
-4 / -28 / -33
CMP: INR738
TP: INR910 (+23%)
Buy
Financial Snapshot (INR Billion)
Y/E March
2017 2018E 2019E 2020E
Net Sales
EBITDA
Adj. NP
Adj. EPS (INR)
Adj. EPS Gr. (%)
BV/Sh (INR)
RoE (%)
RoCE (%)
Valuation
P/E (x)
P/BV (x)
EV/EBITDA (x)
65.1
4.1
29.0
82.9
4.0
28.1
37.2
3.6
17.1
23.5
3.1
12.1
5.6
1.3
0.5
11.4
-45.5
6.7
5.0
5.5
1.3
0.4
9.0
7.3
2.0
1.0
20.0
8.4
2.7
1.5
31.7
58.7
14.3
12.6
-21.5 122.7
4.9
4.2
10.1
8.6
179.3 187.7 206.5 237.0
We expect ENIL’s standalone revenue to decline 3% YoY to
INR1.5b, impacted by GST.
Old 35 stations are expected to see a 9% drop to INR1.3b.
New 17 stations (batch-1 of phase-3) are expected to contribute
revenue of INR169m.
ENIL’s standalone EBITDA is likely to de-grow 2% YoY to INR374m
due to decline in revenue, partly offset by 40bp margin
improvement.
PAT is expected to decline 13% YoY to INR142m.
The stock trades at EV/EBITDA of 28.1x FY18E and 17.1x FY19E.
Maintain Buy.
Key things to watch for
Growth in advertisement revenue in new and old stations
Standalone - Quarterly Earning Model
Y/E March
Net Sales
YoY Change (%)
Total Expenditure
EBITDA
Margins (%)
Depreciation
Net Interest cost
PBT before EO expense
Extra-Ord expense
PBT
Tax
Rate (%)
Reported PAT
Adj PAT
YoY Change (%)
Margins (%)
E: MOSL Estimates
1Q
1,107
9.0
813
294
26.6
85
-33
243
0
243
78
32.0
165
165
-36.3
14.9
FY17
2Q
3Q
1,296
1,506
11.5
4.9
1,065
1,125
231
381
17.8
25.3
140
147
-22
-4
114
239
0
0
114
239
35
76
30.5
31.7
79
163
79
163
-70.7
-43.3
6.1
10.8
4Q
1,655
12.4
1,303
352
21.3
164
-1
188
0
188
50
26.7
138
138
-31.6
8.3
1Q
1,044
-5.8
877
167
16.0
156
-15
25
42
68
23
34.2
44
17
-89.9
1.6
FY18
2Q
3QE
1,257
1,456
-3.0
-3.3
973
1,082
284
374
22.6
25.7
159
171
-9
-1
134
204
0
0
134
204
74
62
55.5
30.4
60
142
60
142
-24.5
-13.1
4.7
9.7
FY17
4QE
1,782
7.7
1,332
450
25.3
184
17
250
0
250
40
15.9
210
210
52.3
11.8
5,565
9.4
4,306
1,259
22.6
536
-60
783
0
783
238
30.4
545
545
-46.5
9.8
FY18E
5,540
-0.5
4,264
1,276
23.0
670
-7
613
42
655
199
30.4
456
428
-21.5
7.7
5 February 2018
25

December 2017 Results Preview | Sector: Automobiles
Tata Motors
Bloomberg
Equity Shares (m)
M. Cap. (INR b)/(USD b)
52-Week Range (INR)
1,6,12 Rel Perf. (%)
TTMT IN
3396.6
1471 / 23
553 / 358
6 / -8 / -37
CMP: INR433
TP:INR593 (+37%)
Buy
Financial Snapshot (INR b)
Y/E March
2017 2018E 2019E 2020E
Net Sales
EBITDA
NP
Adj. EPS (INR)
EPS Gr. (%)
BV/Sh. (INR)
RoE (%)
RoCE (%)
Payout (%)
Valuations
P/E (x)
P/BV (x)
EV/EBITDA (x)
Div. Yield (%)
21.9
2.5
4.5
0.0
13.2
2.0
4.5
0.1
7.1
1.6
2.9
0.1
6.5
1.3
2.5
0.1
2,697
369.1
67.3
19.8
-48.4
171.0
9.8
9.2
0.0
2,929
384
111
32.8
65.5
214
17.0
9.6
1.0
3,548
561
206
60.7
85.2
276
24.8
15.2
0.5
3,800
601
225
66.3
9.2
344
21.4
13.9
0.5
We expect JLR’s (incl. JV) volume to be up by 4.3% YoY (+3.6%
QoQ), led by strong growth in Land Rover sales and an increase in
volume in China JV.
Net realization is expected to increase by 4.9% YoY (+0.7% QoQ),
led by ramp-up of F-Pace and a rise in share of China. EBITDA
margin would expand 240bp YoY (+70bp QoQ) to 12.5%, led by a
better mix. JLR’s adjusted PAT is likely to increase 167% YoY to
GBP297m.
S/A volume increased 29% YoY (+11.6% QoQ), led by 34.4% and
17.5% YoY increase in CV and PV sales, respectively. EBITDA
margin likely to expand 6.6% YoY to 8%. We expect standalone
operations to turn PAT positive at INR1.3b.
The stock trades at 7.1x FY19E and 6.5x FY20E EPS.
Buy.
Key issues to watch
Impact of forex hedge loss.
Current demand trends for JLR and outlook, particularly in China and
the US.
Update on new launches.
Update on Chery JV operations and CV business outlook.
Quarterly Performance
Y/E March
(Consolidated)
JLR vols. (incl JV)
JLR Realizations (GBP/unit)
JLR EBITDA (%)
S/A vol. (units)
S/A Realizations (INR/unit)
S/A EBITDA (%)
S/A PAT (INR m)
Net Op Income
Growth (%)
EBITDA
EBITDA Margins (%)
PBT before EO Exp
EO Exp/(Inc)
PBT after EO Exp
Tax rate (%)
Adj PAT
E: MOSL Estimates
1Q
134,334
44,338
12.5
126,839
811,243
6.5
258
650,047
7.6
90,275
13.9
34,718
9,204
25,514
28.2
28,970
FY17
2Q
3Q
139,227 152,245
45,642 46,200
10.9
10.1
134,397 132,553
765,059 769,912
3.3
1.4
-5,793 -10,452
635,376 639,330
3.3
-9.4
74,298 62,403
11.7
9.8
21,304 13,071
11,311
7,085
9,993
5,986
42.5
144.8
14,788
-2,239
4Q
175,000
45,746
14.5
148,533
914,725
4.1
-5,369
772,172
-2.9
108,012
14.0
52,011
356
51,655
24.0
43,229
1Q
138,476
47,483
7.9
109,692
829,080
0.0
-4,671
584,934
-10.0
49,648
8.5
-5,145
-42,515
37,370
32.3
3,045
FY18
2Q
3QE
153,210 158,751
48,137 48,474
11.8
12.5
153,321 171,139
905,798 932,972
7.0
8.0
-2,953
1,273
706,907 741,715
11.3
16.0
89,383 95,318
12.6
12.9
30,099 31,868
-715
0
30,814 31,868
35.4
32.5
24,366 26,722
FY17
4QE
191,857
600,806
49,423
45,515
15.9
12.1
172,519
542,322
923,462
818,038
8.1
3.8
1,011
-21,341
895,035 2,696,925
15.9
-1.2
128,259
295,887
14.3
11.0
68,449
82,002
0
27,955
68,449
54,047
22.4
60.2
58,747
46,581
FY18E
642,294
48,474
12.4
606,671
904,615
6.5
-5,339
2,928,590
8.6
362,609
12.4
125,271
-43,229
168,501
28.9
111,373
5 February 2018
26

In conversation
1. TITAN : Expect 25% growth in Jewellery division; Subbu
Subramaniam, CFO
The retail growth of 15 percent is in-line with the growth expectations and is a
good performance.
Still looking at a 25 percent growth in the jewellery division. For the jewellery
division, guidance stands intact. Expect to do very well this year.
Online sales contributes 10 percent of volumes in India. Fastrack has been doing
well in online sales - has grown 26 percent this quarter.
On the path to achieve 15 percent margin in watches division.
2. BAJAJ AUTO : Expect exports & domestic cv to do well in Q4;
Kevin D'sa, President-Finance
Total turnover has gone up by about 16 percent and operating EBITDA has gone
up by 17 percent.
51 percent of business, which is represented by exports in three-wheelers has
done exceedingly well. Exports in number terms have gone up by 25 percent,
domestic commercial vehicles (CVs) has gone up by 105 percent and this trend
line is likely to continue in Q4 as well.
In Q4 company sees absolute profit and absolute numbers increasing and there
should be an inch up in margins as well. So looking forward into Q4 and going
forward into FY18-19 with a lot of confidence in the entire business.
Believe all three businesses are firing well.
3. BAJAJ FINANCE : Company is well-positioned to manage rise in
g-sec yields; Rajeev Jain, MD
G-sec yields have run up in the last 4 months rapidly. Company believes in
running a well-managed asset liability management (ALM), so company is better
positioned, relatively, to manage this degree of rise that has been seen in the G-
sec yields.
The loan against property (LAP) business had gone through deterioration but
think it is well on course to be back to the pre-demonetisation levels by end of
Q4.
Rural business growth is stronger due to the lower base. Have been investing in
this business over the last four-five years.
Over the last four-five years efforts are beginning to yield good results both on
volume momentum and profitability.
4. BEL : 88% of orders are from defence; will focus on defence
going ahead; MV Gowtama, CMD
Implemented revised wages in Q3 of FY18 which hit margin.
Lower other income impacted profitability in December quarter.
Cash reduced due to buyback.
88 percent of orders are from defence and will focus on defence going ahead.
5 February 2018
27

From the think tank
1. Budget 2018 is politically smart, fiscally expensive
Has the welfare state for Indian stock market investors ended? The
announcement of the finance minister that long-term capital gains tax, or LTCG
tax, on stock market investments would be reintroduced at 10% for gains above
Rs1 lakh suggests that this is the case. That is a job well done. Simultaneously, the
minister should have announced that “long-term” would kick in after 36 months
and he could have provided an offset for the short-term transaction tax paid.
Further, there are multiple definitions of “short-term” and “long-term” depending
on the asset—real estate, debt, private equity, etc.—and different rates. There
was a case for making things simple. The government has sought to cushion the
blow on sentiment by extending a 25% corporate tax rate for companies but with
revenue under Rs250 crore. That is a disappointment. It should have been
extended to all companies regardless of revenue.
2. Investing in India? better call your tax lawyer first
Just as foreign stock investors in India try to come to terms with a rudely
reimposed 10% tax on long-term capital gains, a bigger shock awaits them. The
grandfathering of past returns promised by finance minister Arun Jaitley in his
budget speech on Thursday is missing from the fine print of the bill. Well, it’s not
completely missing. The finance bill, which will become law when parliament
passes the budget, does clarify on page 14 that the acquisition cost of an asset
for the purpose of computing capital gains will be the higher of the actual
purchase price or the maximum traded price on 31 January. In other words, any
gains accumulated before that date won’t be taxed when the asset is sold. This
is very much in line with what Jaitley said in his speech. However, there’s a
catch. The benefit, as it is currently worded, applies only to domestic investors.
A separate section of the Indian Income Tax Act, which deals specifically with
foreigners, will be amended to reflect the new liability, but with no mention of
the grandfathering relief.
3. Manish Sabharwal on Budget 2018: from jobs to formal jobs
Every doctor will tell you that treating the symptom rather than the disease is very
bad for patients. The diagnosis of whether India has a jobs problem or a wages
problem is an important one for budgets because if you think it is jobs, then you
will junk fiscal discipline and pump up spending; this thinking converted India from
a high-growth, low-inflation economy in 2004 to a low-growth, high-inflation
economy in 2014. The latest budget has a clear philosophy; India’s problem is not
jobs, but formal jobs. And formal jobs need the productivity that comes with lower
regulatory cholesterol, and infrastructure, human capital and fiscal discipline. The
moves on lower regulatory cholesterol are broad and deep for formal employers;
lower income tax for all but the biggest companies, replacing the massive
paperwork of travel and medical reimbursements with a standard Rs40,000
deduction for employees, rationalizing the tax structure for bankruptcy cases and
bidders, fixed-term contracts for all industries, continuing the shift in the tax
regime from one that offers subsidies for investing capital to one that rewards
hiring people (80JJA).
5 February 2018
28

4. Kumar Mangalam Birla on budget 2018: a fine balance
One of the key themes of the government’s reforms in the recent past has been
greater formalisation of the economy. The budget suggests that these measures
have started yielding results in terms of widening the tax net and buoyancy in
direct tax revenues, enabling the government to use this fiscal dividend for larger
social and infrastructure spending. Agriculture and health are the thrust areas of
this budget. Two announcements are remarkable and promise to be game
changers. First is the enhancement of the minimum support price (MSP) for
agricultural produce to 150% of the cost of cultivation. Along with institutional
measures announced for the development of agro markets and ‘Operation Green’
to address price fluctuations in perishable crops, it will go a long way in realising
the government’s mission of doubling farmers’ incomes.
International
5. Burying the legal ghosts of brazil’s hyperinflation
A decades-old legal fight between consumers and financial institutions over the
impact of Brazil’s economic policies of the 1980s and 1990s is nearing
conclusion. In December, lawyers representing claimants presented Brazil’s
Supreme Federal Court with a request to ratify a settlement reached with the
banks. If the court approves the deal, the settlement would put billions of reals
into the pockets of savers. But more than a long-awaited payday for some one
million claimants, the court-ordered restitution would also mark an official end
to Brazil’s seemingly endless war on hyperinflation. During the late 1980s and
early 1990s, the Brazilian government struggled to stabilize the country’s
economy and currency. At the height of the crisis, annual inflation reached
2,477%; at that rate, prices for food and household goods increased daily. A
string of unsuccessful policies had accelerated inflation in public and private
contracts, affecting wages, rents, and bank deposits.
5 February 2018
29

Click excel icon
for detailed
valuation guide
CMP
(INR)
769
122
3243
691
19344
1650
27739
1181
859
211
3624
769
212
9000
352
384
645
Valuation snapshot
Company
Automobiles
Amara Raja
Ashok Ley.
Bajaj Auto
Bharat Forge
Bosch
CEAT
Eicher Mot.
Endurance Tech.
Escorts
Exide Ind
Hero Moto
M&M
Mahindra CIE
Maruti Suzuki
Motherson Sumi
Tata Motors
TVS Motor
Aggregate
Banks - Private
AU Small Finance
Axis Bank
DCB Bank
Equitas Hold.
Federal Bank
HDFC Bank
ICICI Bank
IDFC Bank
IndusInd
J&K Bank
Kotak Mah. Bk
RBL Bank
South Indian
Yes Bank
Aggregate
Banks - PSU
BOB
BOI
Canara
Indian Bk
PNB
SBI
Union Bk
Aggregate
NBFCs
Aditya Birla Cap
Bajaj Fin.
Capital First
Cholaman.Inv.&F
n
Dewan Hsg.
GRUH Fin.
HDFC
HDFC Stand. Life
Indiabulls Hsg
Reco
Buy
Buy
Buy
Buy
Neutral
Buy
Buy
Buy
Sell
Buy
Neutral
Buy
Buy
Buy
Buy
Buy
Neutral
TP % Upside
EPS (INR)
EPS Gr. YoY (%)
P/E (x)
P/B (x)
ROE (%)
(INR) Downside FY18E FY19E FY20E FY18E FY19E FY18E FY19E FY18E FY19E FY18E FY19E
984
153
4023
859
20025
2221
34678
1554
714
268
3922
881
297
10972
458
593
741
28
25
24
24
4
35
25
32
-17
27
8
15
40
22
30
54
15
28.7
4.6
149.7
19.4
454.9
82.5
823.8
27.6
36.6
8.0
181.3
37.6
9.0
275.6
10.0
32.8
13.9
34.2
6.1
179.6
26.3
604.8
116.9
1,071.3
38.5
45.6
10.2
193.9
44.3
12.0
369.9
14.4
60.7
25.1
41.1
2.6
7.5
1.3
208.4
6.1
34.4
48.1
730.1
-3.9
140.6 -11.6
1,343.8 33.6
51.8
17.5
54.9
90.4
11.6
-1.3
214.2
7.2
48.8
37.5
14.9
94.3
471.3 10.8
18.3
30.0
66.3
65.5
33.9
18.5
25.3
21.6
44.6
10.9
10.2
8.2
100.9
21.0
3.9
101.4
17.2
54.2
30.3
4.9
30.8
-42.8
-4.4
5.3
-81.6
13.3
18.0
-18.3
0.4
27.0
LP
22.0
33.0
-22.6
24.8
15.6
199.6
Loss
-33.0
17.6
69.4
3,751.8
128.4
304.0
NA
42.8
38.9
34.5
26.5
22.1
8.0
5.4
32.8
18.9
32.8
20.0
35.9
33.0
41.7
30.1
39.6
24.3
27.5
6.9
17.6
33.0
34.2
43.9
85.2
80.5
42.6
26.7
26.5
21.7
35.6
42.5
20.0
33.7
42.8
23.4
26.3
20.0
20.4
23.6
32.7
35.1
11.7
46.3
25.0
22.5
20.0
18.1
26.2
32.0
14.1
25.9
30.7
18.9
20.6
18.7
17.4
17.8
24.3
24.4
6.3
25.7
17.6
41.7
18.2
18.4
21.2
14.3
24.2
20.3
16.4
22.2
5.2
26.2
21.3
7.4
14.7
21.3
6.8
30.1
8.3
8.9
8.6
15.2
4.3
12.1
30.9
25.6
15.3
17.4
11.0
48.0
38.8
82.4
12.5
4.4
5.3
5.0
6.7
6.1
2.5
10.6
8.1
3.5
3.3
6.3
3.2
2.2
6.6
7.6
1.8
10.6
4.6
7.9
2.1
2.0
2.1
1.5
4.3
2.5
1.2
4.5
0.7
4.4
3.1
1.0
3.2
3.2
0.9
0.6
0.7
1.0
0.9
1.2
0.4
0.9
4.3
5.7
2.6
3.9
1.9
17.1
5.2
2.9
4.1
3.8
4.6
4.4
5.6
5.5
2.1
8.0
6.7
3.0
3.0
5.5
2.9
2.0
5.6
6.2
1.4
7.9
3.9
6.6
1.9
1.8
1.9
1.3
3.8
2.3
1.1
3.9
0.6
3.8
2.8
0.9
2.7
2.8
0.8
0.6
0.6
1.0
0.8
1.1
0.4
0.8
3.3
4.8
2.2
3.2
1.6
14.1
4.5
2.4
3.6
17.6
21.0
24.2
20.3
15.1
13.0
36.0
20.5
17.2
12.6
33.4
14.1
9.9
19.8
23.4
17.0
24.9
18.5
14.1
5.9
10.1
1.4
9.4
16.7
8.1
6.8
17.0
8.4
13.2
12.2
6.9
17.6
11.0
6.4
-0.4
2.3
10.9
5.3
5.3
5.9
4.2
12.5
20.2
13.7
20.4
14.0
32.9
17.6
21.7
29.9
18.1
24.7
26.0
23.4
18.2
16.2
35.2
23.8
17.3
14.4
31.2
14.6
11.8
22.8
28.1
24.8
35.3
22.0
17.2
11.1
10.4
9.5
9.8
16.6
10.1
6.9
19.1
12.3
14.3
13.8
12.7
19.9
13.3
9.4
1.8
6.8
11.2
9.0
8.0
9.1
7.0
12.3
20.4
15.6
20.2
15.8
32.2
16.5
21.1
30.4
Neutral
Buy
Neutral
Buy
Buy
Buy
Buy
Neutral
Buy
Buy
Buy
Buy
Buy
Buy
638
565
166
141
93
1949
335
53
1756
69
1087
484
28
350
705
710
188
205
149
2350
405
65
2076
100
1220
680
38
410
11
26
13
45
60
21
21
23
18
44
12
41
35
17
10.6
14.7
7.4
0.9
5.5
67.0
12.5
3.0
61.1
8.4
32.7
15.8
1.9
18.2
15.3
31.0
9.0
6.6
6.5
80.6
16.5
3.2
78.9
13.4
41.5
22.7
3.8
23.9
43.9 60.0
111.4 38.5
22.2 22.5
616.0 152.1
19.1 17.0
20.3 29.1
32.0 26.8
7.0
17.5
29.2 28.7
59.1
8.3
26.9 33.2
43.7 30.6
97.1 14.6
31.2 19.2
35.2 28.8
26.2
LP
196.8
11.4
79.1
70.8
59.5
81.0
46.5
39.3
30.2
18.7
26.8
18.8
14.0
13.9
15.4
8.5
NM
24.7
9.9
15.3
25.9
6.9
21.9
45.3
35.6
20.0
20.6
13.9
57.1
44.2
93.9
14.5
Buy
Neutral
Neutral
Buy
Buy
Buy
Neutral
153
148
311
340
162
297
128
217
175
415
438
250
415
153
42
18
33
29
55
40
20
17.9
-1.2
12.6
34.4
10.5
11.5
18.4
22.6
4.9
37.3
38.3
18.9
19.6
29.4
29.7
10.3
70.6
42.3
24.1
34.9
45.0
Buy
Buy
Buy
Buy
Buy
Neutral
Buy
Buy
Buy
168
1629
683
1275
521
567
1903
443
1319
231
2300
960
1520
720
540
2260
485
1630
38
41
41
19
38
-5
19
10
24
3.7
45.7
34.2
61.8
37.4
9.9
43.0
4.7
91.1
5.4
63.7
44.6
73.3
47.5
11.8
49.0
5.4
105.1
7.8
87.0
56.8
89.1
59.9
14.6
57.0
6.7
128.3
5 February 2018
30

Click excel icon
for detailed
valuation guide
CMP
(INR)
158
512
612
446
401
1291
595
2009
1323
TP % Upside
(INR) Downside
240
52
608
19
750
23
575
29
515
28
1750
36
800
34
2500
1750
24
32
EPS (INR)
EPS Gr. YoY (%)
FY18E FY19E FY20E FY18E FY19E
7.4
11.0
13.5
42.2 47.1
38.5 44.3
52.6
0.6
15.2
18.6 24.2
30.0
24.0 29.6
13.9 19.2
23.0
95.8 38.7
42.6 42.0
48.1
44.4
-1.4
51.4 69.0
92.3
62.4 34.4
36.0 41.9
50.0
23.5 16.5
114.2 140.0
78.7
104.8
166.8
125.9
35.4
42.1
28.2
-3.4
12.6
119.0
28.0
9.8
-64.9
-7.8
64.4
19.4
20.5
15.7
10.9
27.3
-1.7
15.2
13.4
15.9
22.6
33.1
23.0
48.7
12.0
-19.9
48.3
26.1
57.4
34.2
19.4
21.6
23.3
18.8
56.9
19.5
16.3
8.0
12.0
19.0
Valuation snapshot
P/E (x)
P/B (x)
FY18E FY19E FY18E FY19E
21.2 14.4
3.1
2.6
13.3 11.5
2.0
1.8
32.8 25.3
4.6
4.1
32.2 23.2
3.0
2.8
9.4
9.6
2.1
1.8
25.1 18.7
3.5
3.0
16.5 14.2
2.8
2.3
17.6
16.8
30.2
88.2
21.4
31.8
43.6
47.7
59.6
33.9
42.5
44.7
23.8
28.9
65.2
41.0
40.4
16.4
32.7
35.3
42.3
34.5
34.4
46.4
13.8
26.3
22.9
43.4
27.1
44.3
46.2
38.2
20.3
40.3
47.0
33.1
52.7
56.0
47.6
45.5
46.0
50.2
40.9
59.4
14.4
12.6
24.6
59.3
19.1
39.7
29.4
37.8
37.9
25.3
35.6
36.7
19.3
24.3
41.6
34.3
34.7
15.2
29.1
29.6
33.7
24.7
19.5
33.7
9.7
14.6
17.7
22.0
21.0
26.5
25.5
19.0
13.2
39.1
30.7
23.8
44.4
44.3
39.7
38.2
35.2
43.6
36.1
49.2
2.3
2.4
4.5
9.6
3.8
1.0
8.5
20.9
1.3
5.7
8.7
8.6
4.6
3.6
6.0
8.1
4.9
2.7
5.1
3.9
2.6
3.5
2.5
4.6
1.5
0.9
3.7
3.2
4.1
2.9
6.0
2.4
2.1
6.6
4.4
3.3
14.0
17.4
22.7
10.8
12.5
10.6
8.1
45.1
2.1
2.1
3.9
8.6
3.4
1.0
7.8
17.1
1.2
5.3
7.5
7.6
3.9
3.3
5.5
6.8
4.5
2.3
4.5
3.6
2.4
3.3
2.2
4.0
1.3
0.9
3.1
2.8
3.5
2.6
5.0
2.2
1.8
5.7
3.9
3.0
12.4
14.1
21.3
9.6
11.0
9.2
7.4
44.9
ROE (%)
FY18E FY19E
15.9 19.7
16.4 16.5
20.2 17.0
10.9 12.5
23.8 19.9
14.7 17.4
18.1 17.9
14.1
14.9
15.0
10.9
17.9
3.3
20.2
50.6
2.1
17.5
21.8
19.4
19.5
13.0
9.1
21.4
12.8
17.5
16.5
11.0
6.2
10.3
7.3
10.3
11.5
3.5
17.5
7.7
16.0
6.6
13.7
6.5
10.8
17.6
9.7
10.0
26.9
34.0
48.8
25.4
29.0
23.6
20.7
76.5
15.2
17.5
15.8
14.5
18.0
2.6
27.8
49.8
3.3
21.7
22.6
20.8
20.2
14.1
13.1
21.5
13.5
16.4
16.3
12.1
7.4
13.7
12.0
12.7
14.5
6.0
19.2
13.8
17.9
10.3
21.3
12.0
14.6
15.7
13.5
12.5
29.6
35.2
55.2
26.7
33.2
22.6
21.4
91.4
Company
Reco
L&T Fin Holdings Buy
LIC Hsg Fin
Neutral
MAS Financial
Buy
M&M Fin.
Buy
Muthoot Fin
Neutral
PNB Housing
Buy
Repco Home
Buy
Shriram
City
Buy
Union
Shriram Trans. Buy
Aggregate
Capital Goods
ABB
Sell
Bharat Elec.
Buy
BHEL
Sell
Blue Star
Neutral
CG Cons. Elec.
Buy
CG Power & Indu. Neutral
Cummins
Buy
GE T&D
Neutral
Havells
Buy
K E C Intl
Neutral
L&T
Buy
Siemens
Neutral
Solar Ind
Neutral
Thermax
Neutral
Va Tech Wab.
Buy
Voltas
Neutral
Aggregate
Cement
Ambuja Cem.
Neutral
ACC
Neutral
Birla Corp.
Buy
Dalmia Bharat
Buy
Grasim Inds.
Neutral
India Cem
Neutral
J K Cements
Buy
JK Lakshmi Ce
Buy
Ramco Cem
Buy
Orient Cem
Buy
Prism Cem
Buy
Sagar Cements Not Rated
Sanghi Inds.
Buy
Shree Cem
Buy
Ultratech
Buy
Aggregate
Consumer
Asian Paints
Neutral
Britannia
Buy
Colgate
Buy
Dabur
Buy
Emami
Buy
Godrej Cons.
Neutral
GSK Cons.
Neutral
HUL
Buy
1678
152
93
718
245
86
829
400
510
339
1414
1288
1076
1224
566
572
1230
210
78
685
305
90
1150
440
640
350
1650
1313
1120
1150
745
580
-27
38
-16
-5
25
5
39
10
26
3
17
2
4
-6
32
1
19.0
7.1
2.9
16.5
5.1
1.4
24.4
9.4
11.4
14.3
49.0
19.8
26.2
30.3
34.5
17.5
28.3
7.9
2.3
24.4
6.5
2.3
32.8
11.2
13.9
17.6
58.1
31.0
31.3
35.2
37.2
19.6
34.1
8.4
3.5
31.0
7.7
3.0
38.8
14.0
17.2
21.7
69.3
35.3
39.3
38.4
41.9
22.4
259
1676
1107
2821
1130
154
1095
407
735
146
127
962
118
17046
4178
275
1795
1435
3568
1286
188
1324
512
913
179
130
-
157
22424
5131
6
7
30
26
14
22
21
26
24
23
3
33
32
23
6.1
7.7
48.6 67.8
32.2 56.7
60.8 83.7
81.9 116.8
5.8
10.5
47.8 61.8
9.4
18.5
27.1 35.1
3.3
5.5
2.7
5.0
25.2 50.6
5.8
8.9
423.0 435.8
89.0 136.2
9.8
80.4
61.6
111.7
133.5
12.1
79.1
25.0
44.7
10.3
6.6
70.6
12.0
724.2
178.4
25.5 25.3
34.5 39.5
12.8 76.1
56.8 37.6
20.8 42.5
3.9
80.4
41.7 29.5
34.7 97.2
-0.5
29.3
LP
66.8
905.1 81.3
LP
101.0
102.0 53.5
10.0
3.0
-7.4
53.0
16.8 39.3
2.7
14.7
10.3
4.5
-9.6
10.6
3.0
17.6
18.8
26.4
19.8
19.2
30.5
15.1
13.4
20.7
1138
4732
1115
344
1104
1049
6582
1373
1270
6098
1357
415
1505
1065
5785
1585
12
29
22
20
36
2
-12
15
21.6 25.6
84.5 106.9
23.4 28.1
7.6
9.0
24.0 31.3
20.9 24.1
160.8 182.3
23.1 27.9
30.8
133.8
33.7
10.5
37.3
27.5
206.5
32.9
5 February 2018
31

Click excel icon
for detailed
valuation guide
CMP
(INR)
275
364
304
7141
20063
275
862
9195
197
1135
3178
TP % Upside
(INR) Downside
278
1
380
4
355
17
8173
14
28650
43
314
14
1050
22
9461
3
-
1320
16
3515
11
EPS (INR)
EPS Gr. YoY (%)
FY18E FY19E FY20E FY18E FY19E
9.0
10.2
11.4
6.6
13.7
8.1
10.7
13.3
-27.7 32.0
6.2
7.7
9.3
-1.2
24.3
128.6 146.9 177.7
4.0
14.2
296.6 413.1 544.5 24.3 39.3
8.9
12.4
16.8 147.7 38.7
17.7 20.8
24.1
5.7
17.8
151.5 176.7 209.4 14.0 16.6
3.5
6.4
9.7
-2.0
83.8
14.7 18.0
22.3
68.9 22.4
32.9 57.0
78.7
22.9 73.4
8.7
18.7
23.9 25.3
68.0 89.5
54.0 65.8
44.6 50.3
7.6
10.9
17.5 23.7
22.6 27.0
32.9 44.0
68.9 113.2
1.9
4.9
37.9 42.8
6.8
9.0
44.2 54.9
17.8 26.2
47.8 62.6
19.0 29.1
37.6 42.7
140.1 157.4
18.1 29.9
36.3 62.5
14.5 22.1
49.7 61.4
30.1
109.1
81.4
55.3
19.8
26.4
33.3
52.7
145.0
8.4
50.5
13.0
60.6
35.2
72.5
35.7
57.1
180.5
37.8
77.9
27.5
78.5
10.8
-8.9
-5.8
13.5
-25.3
23.0
42.3
-17.7
-5.1
-81.8
-3.4
-5.4
28.6
10.9
29.5
7.0
-33.6
8.5
29.3
12.6
-44.5
-9.9
-13.1
LP
12.5
11.5
29.3
5.9
31.7
21.9
12.8
43.1
35.8
19.5
33.9
64.2
160.8
12.9
31.1
24.3
47.0
30.9
52.7
13.7
12.4
65.1
71.9
52.0
23.6
32.0
79.9
1.4
9.0
3.5
Valuation snapshot
P/E (x)
P/B (x)
FY18E FY19E FY18E FY19E
30.8 27.1
6.7
6.2
44.8 34.0
6.3
6.1
49.0 39.5 14.9 14.1
55.5 48.6 20.7 18.7
67.6 48.6 26.9 21.5
30.8 22.2
3.2
2.8
48.8 41.4 11.4
9.8
60.7 52.0 35.9 30.0
56.6 30.8
2.7
2.5
77.4 63.2 11.3
9.8
96.7 55.8 16.7 12.5
46.3 39.0 12.4 11.2
22.4
32.2
25.8
13.6
78.4
23.4
25.6
31.3
30.8
67.2
15.6
17.7
55.2
31.4
18.3
26.8
22.6
35.5
29.0
19.6
38.0
27.3
28.2
42.4
9.8
22.5
27.5
18.2
21.2
24.5
21.1
12.0
54.8
17.3
21.4
23.4
18.7
25.8
13.8
13.5
44.4
21.4
14.0
17.6
19.9
31.6
17.6
11.4
25.0
22.1
21.4
23.6
9.6
20.6
26.5
16.7
14.3
26.1
12.1
23.1
4.5
5.1
6.2
3.0
6.9
5.0
3.3
5.3
2.7
1.0
3.1
2.2
12.2
2.7
3.3
3.5
2.6
6.1
4.0
2.1
3.4
4.7
3.7
2.2
1.3
4.0
3.5
2.2
2.3
3.5
2.3
3.3
3.9
4.4
5.0
2.4
6.4
4.1
2.9
4.7
2.4
1.0
2.5
2.0
13.9
2.4
2.7
3.0
2.4
5.6
3.3
1.8
3.2
4.1
3.3
2.0
1.2
3.3
3.2
2.0
2.1
3.3
2.1
3.1
9.8
2.7
2.2
3.4
ROE (%)
FY18E FY19E
22.8 23.8
13.8 18.3
32.3 36.8
39.1 40.4
39.8 44.4
10.8 13.3
25.2 25.4
64.8 62.9
4.9
8.5
15.5 16.5
17.3 22.3
26.8 28.7
21.8
17.0
26.4
24.6
8.9
23.4
12.8
16.6
9.2
1.6
19.6
14.2
22.0
8.8
19.7
14.1
12.0
17.2
14.7
11.4
9.3
18.2
13.1
5.5
14.1
19.1
13.7
12.3
14.1
11.2
9.2
11.1
13.3
20.1
-6.3
4.9
19.7
19.4
25.7
22.3
11.6
26.1
13.5
21.2
13.7
3.9
18.4
15.4
31.4
11.9
21.4
18.3
12.5
17.7
20.5
17.0
13.2
19.9
15.2
8.9
12.9
17.5
12.6
12.0
15.4
12.9
18.2
13.2
34.9
20.9
0.2
10.1
Company
ITC
Jyothy Lab
Marico
Nestle
Page Inds
Parag Milk
Pidilite Ind.
P&G Hygiene
Prabhat Dairy
United Brew
United Spirits
Aggregate
Healthcare
Alembic Phar
Alkem Lab
Ajanta Pharma
Aurobindo
Biocon
Cadila
Cipla
Divis Lab
Dr Reddy’s
Fortis Health
Glenmark
Granules
GSK Pharma
IPCA Labs
Jubilant Life
Laurus Labs
Lupin
Sanofi India
Shilpa Medicare
Strides Shasun
Sun Pharma
Torrent Pharma
Aggregate
Infrastructure
Ashoka Buildcon
IRB Infra
KNR
Constructions
Sadbhav
Engineering
Aggregate
Logistics
Allcargo Logistics
Concor
Gateway
Distriparks
Aggregate
Media
Dish TV
D B Corp
Den Net.
Ent.Network
Reco
Neutral
Neutral
Neutral
Neutral
Buy
Neutral
Buy
Neutral
Not Rated
Buy
Neutral
Neutral
Buy
Buy
Buy
Neutral
Buy
Neutral
Neutral
Neutral
Buy
Neutral
Buy
Neutral
Neutral
Buy
Buy
Buy
Buy
Buy
Buy
Buy
Neutral
536
2192
1391
605
597
410
579
1029
2122
126
591
121
2439
560
875
511
850
4974
526
711
551
1358
555
2500
1840
900
600
555
600
1100
2575
185
650
200
2500
550
1110
631
1000
5000
797
1074
610
1400
4
14
32
49
0
36
4
7
21
46
10
65
2
-2
27
24
18
1
51
51
11
3
Buy
Neutral
Buy
Buy
224
224
300
389
290
240
325
445
30
7
8
14
5.3
22.9
13.3
14.2
9.5
23.2
14.5
14.6
19.1
19.7
16.0
17.0
Buy
Neutral
Buy
189
1339
224
242
1469
282
28
10
26
10.9
41.9
8.8
13.3
51.2
18.4
15.3
58.2
21.3
10.7
10.3
29.6
11.5
22.0
22.3
109.2
28.2
17.4
32.0
25.4
29.6
Buy
Buy
Neutral
Buy
73
324
99
705
106
420
90
910
46
30
-10
29
0.7
18.8
-2.9
9.0
2.2
23.0
0.1
20.0
3.8
27.6
4.0
31.7
-36.4
-7.6
Loss
-21.5
237.6 111.6 33.1 14.0
22.0 17.2 14.1
3.2
LP
NM 1,400.6 2.2
122.7 78.6 35.3
3.8
5 February 2018
32

Click excel icon
for detailed
valuation guide
CMP
(INR)
37
242
94
167
373
1308
102
22
955
583
TP % Upside
(INR) Downside
47
28
305
26
117
24
215
29
469
26
1760
35
148
46
27
24
1155
21
705
21
EPS (INR)
EPS Gr. YoY (%)
FY18E FY19E FY20E FY18E FY19E
-0.2
0.8
2.0
Loss
LP
25.9 28.8
32.4
0.2
11.3
11.8 12.1
12.7
59.3
2.6
9.9
12.5
15.2
-6.9
26.4
8.2
13.5
17.8
27.8 64.9
22.1 37.3
51.5
7.8
68.7
3.2
6.1
9.2
164.0 90.5
-0.9
0.1
0.6
Loss
LP
28.1 35.7
41.8
13.0 27.0
13.7 17.6
21.0
2.1
28.7
17.3 39.8
19.9
21.6
-11.5
20.7
4.6
14.3
-1.4
25.5
23.8
62.7
28.2
33.3
7.3
24.0
5.3
14.0
4.5
38.9
42.7
85.3
28.8
32.1
11.9
23.7
5.4
14.7
6.5
43.0
44.5
67.2
132.1
9.6
Loss
39.8
24.8
43.7
Loss
165.2
57.4
65.0
67.6
-15.3
15.8
27.2
41.4
-12.8
-3.9
14.4
23.6
-29.6
-11.7
16.7
32.3
19.6
6.9
186.2
44.4
38.8
48.6
18.1
3.1
20.1
2.6
0.8
18.5
31.5
12.9
17.4
14.4
30.8
42.0
54.6
LP
15.9
13.1
-2.0
LP
52.3
79.4
36.0
56.3
25.0
19.3
58.5
4.2
20.2
-1.5
15.2
-1.1
25.0
37.7
21.8
11.3
11.8
14.3
29.6
26.6
27.0
27.2
12.1
3.8
-1.1
9.7
10.5
13.7
24.6
14.8
16.9
22.8
18.4
Valuation snapshot
P/E (x)
P/B (x)
FY18E FY19E FY18E FY19E
NM
48.4
2.6
2.5
9.4
8.4
1.3
1.1
8.0
7.8
0.9
0.8
16.9 13.4
2.6
2.3
45.4 27.5
3.6
3.2
59.1 35.0
5.8
5.0
31.5 16.5
4.6
3.6
NM 172.6 4.2
4.1
34.0 26.8
8.6
7.8
42.7 33.2
7.2
6.2
38.2 27.3
5.6
4.9
12.6
13.7
NM
14.4
15.1
9.3
NM
13.0
14.0
10.7
15.4
11.6
17.8
41.2
15.4
10.5
10.2
28.8
17.7
11.3
11.6
10.0
16.1
15.0
13.1
66.1
23.7
65.6
55.4
17.1
16.0
22.5
17.7
16.4
19.0
22.5
19.4
17.7
18.2
27.0
8.8
8.8
34.5
12.4
13.3
9.5
18.5
8.5
7.8
7.9
9.9
9.3
14.9
26.0
14.8
8.8
10.3
25.0
17.9
9.0
8.4
8.2
14.5
13.4
11.5
51.0
18.7
51.7
43.5
15.2
15.4
22.8
16.2
14.8
16.7
18.0
16.9
15.1
14.8
22.8
1.7
4.4
0.8
2.7
1.3
1.7
1.0
2.9
1.9
1.8
1.9
2.6
1.9
6.2
2.2
2.4
1.7
5.8
4.6
1.8
0.9
1.1
3.7
1.8
1.7
14.9
3.7
13.9
10.6
3.0
3.9
5.6
4.1
2.2
5.4
4.6
3.3
2.8
3.1
8.7
1.4
3.3
0.8
2.2
1.2
1.6
0.9
2.2
1.7
1.5
1.7
2.2
1.8
5.2
1.9
2.0
1.5
4.9
4.2
1.6
0.9
1.0
3.2
1.7
1.6
15.2
3.2
12.9
9.7
2.7
3.5
4.7
3.5
1.9
4.4
4.1
3.0
2.5
3.0
6.9
ROE (%)
FY18E FY19E
-1.2
5.2
15.1 14.6
11.5 10.6
15.3 18.4
8.2
12.2
10.2 15.3
15.9 24.7
-15.8 2.4
26.4 30.7
18.2 20.0
14.5 17.8
14.3
30.8
-3.6
20.2
8.6
19.1
-1.5
25.2
14.1
18.0
12.2
24.0
11.2
16.0
14.7
24.5
17.5
22.0
27.3
16.9
8.0
10.9
25.3
12.9
13.2
22.5
16.9
23.4
19.2
17.4
25.1
26.6
24.3
14.3
32.1
19.9
15.3
16.1
17.8
36.0
17.5
42.7
2.3
19.5
9.2
17.2
5.0
29.7
23.1
21.0
16.7
25.4
12.4
21.7
13.7
25.1
15.4
21.4
24.4
18.5
10.5
12.8
23.6
13.1
13.8
29.8
18.4
25.9
22.2
17.8
23.9
22.4
23.1
13.8
29.0
24.0
18.7
17.6
21.0
33.8
Company
Hathway Cable
Hind. Media
HT Media
Jagran Prak.
Music Broadcast
PVR
Prime Focus
Siti Net.
Sun TV
Zee Ent.
Aggregate
Metals
Hindalco
Hind. Zinc
JSPL
JSW Steel
Nalco
NMDC
SAIL
Rain Industries
Vedanta
Tata Steel
Aggregate
Oil & Gas
BPCL
GAIL
Gujarat Gas
Gujarat St. Pet.
HPCL
IOC
IGL
Mahanagar Gas
MRPL
Oil India
ONGC
PLNG
Reliance Ind.
Aggregate
Retail
Jubilant Food
PC Jeweller
Titan Co.
Aggregate
Technology
Cyient
HCL Tech.
Hexaware
Infosys
KPIT Tech
L&T Infotech
Mindtree
Mphasis
NIIT Tech
Persistent Sys
Tata Elxsi
Reco
Buy
Buy
Neutral
Buy
Buy
Buy
Buy
Neutral
Buy
Buy
Buy
Neutral
Buy
Buy
Neutral
Buy
Sell
Buy
Buy
Neutral
249
295
250
299
70
133
83
332
334
670
344
354
361
339
81
215
75
492
416
858
38
20
44
14
16
62
-10
48
25
28
Buy
Sell
Buy
Neutral
Buy
Buy
Buy
Neutral
Neutral
Buy
Buy
Buy
Buy
476
466
842
192
374
409
290
965
117
346
192
243
906
632
371
1000
183
576
533
416
1219
114
420
234
312
1069
33
-20
19
-5
54
30
44
26
-3
21
22
28
18
40.9
26.1
20.4
12.5
35.5
40.2
10.1
54.4
10.4
29.8
19.2
15.0
60.4
51.2
31.2
32.4
13.0
42.7
39.6
11.6
53.8
13.0
41.0
23.4
16.7
67.5
54.1
32.7
41.7
14.0
45.3
41.4
13.5
54.5
13.7
42.3
22.6
20.3
76.8
Neutral
Buy
Buy
2004
366
822
2185
685
990
9
87
20
30.3
15.4
12.5
39.3
19.5
15.9
51.6
24.9
19.8
Buy
Neutral
Neutral
Buy
Neutral
Buy
Buy
Neutral
Neutral
Buy
Buy
619
988
370
1142
197
1248
735
851
790
785
994
675
950
270
1250
219
1400
725
800
800
900
1236
9
-4
-27
9
11
12
-1
-6
1
15
24
36.2
61.7
16.4
64.4
12.0
65.7
32.7
43.9
44.6
43.1
36.8
40.6
64.1
16.3
70.7
13.3
74.7
40.8
50.4
52.2
53.0
43.6
45.9
68.9
18.5
78.6
17.2
86.1
47.8
54.6
60.6
60.5
51.5
5 February 2018
33

Click excel icon
for detailed
valuation guide
CMP
(INR)
3149
617
301
919
TP % Upside
(INR) Downside
2700
-14
700
13
300
0
1100
20
EPS (INR)
EPS Gr. YoY (%)
FY18E FY19E FY20E FY18E FY19E
130.6 147.3 161.0
-2.1
12.8
39.2 40.9
47.7
26.8
4.5
17.9 18.5
21.2
6.0
3.2
54.2 64.1
85.2
4.0
18.3
4.2
5.0
3.5
14.0
-11.9
4.4
3.9
16.2
-12.9
16.0
7.2
17.8
-11.7
30.1
-68.7
-6.1
Loss
-56.4
PL
23.7
71.7
4.8
-19.3
7.5
20.7
-0.5
14.3
-8.4
63.6
17.8
17.2
-3.5
45.1
93.7
11.2
48.2
-38.2
50.9
78.9
41.6
-16.0
21.9
3.6
Valuation snapshot
P/E (x)
P/B (x)
FY18E FY19E FY18E FY19E
24.1 21.4
7.6
6.5
15.8 15.1
3.1
2.7
16.8 16.2
3.0
2.5
17.0 14.4
2.5
2.2
19.8 18.8
4.9
4.3
2.5
4.3
1.5
12.2
2.7
7.1
1.1
1.3
1.0
1.3
1.8
1.8
2.0
2.6
16.1
6.0
1.7
27.1
4.8
5.6
8.0
6.7
1.9
7.4
3.5
3.5
2.8
7.4
4.3
2.7
5.6
6.3
2.4
3.0
4.8
8.2
1.2
8.8
11.7
2.4
4.3
1.9
9.3
2.8
6.6
1.0
1.3
1.0
1.2
1.5
1.5
1.9
2.5
13.8
5.3
1.5
24.7
4.1
5.0
6.5
6.3
1.5
6.7
3.1
3.2
2.7
6.4
3.7
2.2
4.5
5.2
2.2
2.6
4.3
6.7
1.1
7.8
9.3
ROE (%)
FY18E FY19E
30.4 32.9
20.6 19.5
17.2 16.7
15.7 16.4
25.0 23.0
2.1
2.3
17.0 20.4
-19.4 -24.4
8.2
27.4
-0.5
0.0
44.6
10.7
6.3
8.4
10.5
16.5
16.2
14.8
8.0
19.0
14.6
9.8
103.8
22.5
12.6
32.1
46.8
17.0
13.7
23.3
7.4
7.9
32.5
23.9
7.8
21.7
23.0
8.9
13.2
13.4
17.7
12.6
18.0
26.9
60.8
11.1
5.0
10.8
11.3
17.5
15.9
17.3
9.4
22.6
15.7
9.6
94.6
23.4
13.2
31.5
42.1
18.5
13.7
27.4
11.8
11.0
34.5
26.9
24.2
21.0
22.9
10.2
16.3
16.0
20.1
14.5
20.7
28.8
Company
TCS
Tech Mah
Wipro
Zensar Tech
Aggregate
Telecom
Bharti Airtel
Bharti Infratel
Idea Cellular
Tata Comm
Aggregate
Utiltites
Coal India
CESC
JSW Energy
NHPC
NTPC
Power Grid
Tata Power
Aggregate
Others
Arvind
Avenue
Supermarts
Bata India
BSE
Castrol India
Coromandel Intl
Delta Corp
Eveready Inds.
Interglobe
Indo Count
Info Edge
Kaveri Seed
Manpasand
MCX
Monsanto
Navneet
Education
Oberoi Realty
Quess Corp
Reco
Neutral
Buy
Neutral
Buy
Buy
Neutral
Buy
Buy
422
344
88
614
680
380
110
780
61
11
25
27
12.2 121.2 108.0
16.5 24.6 21.1
Loss NM
NM
267.3 141.2 38.4
Loss -514.2 -5,702.2
45.0
14.7
-18.2
30.3
15.1
20.9
12.2
26.7
23.8
37.4
21.0
15.3
0.3
20.4
40.7
21.6
19.3
32.9
10.9
20.2
47.2
41.1
20.6
28.4
15.8
11.2
20.9
11.7
12.8
11.4
11.5
13.7
33.4
90.5
43.4
17.7
27.5
22.7
55.9
27.8
18.4
12.1
57.0
14.5
42.0
35.3
24.1
19.1
36.0
45.1
29.7
31.8
23.4
37.6
50.6
10.2
51.1
48.0
10.9
9.8
25.5
9.0
11.2
9.4
10.2
10.8
27.0
65.9
35.9
15.3
27.4
18.9
39.8
22.8
15.4
9.1
51.4
12.0
28.6
25.0
19.9
14.9
10.2
30.5
24.9
22.7
17.1
28.6
36.8
8.0
40.0
36.1
Buy
Buy
Sell
Buy
Buy
Buy
Sell
292
1001
84
28
165
193
85
356
1360
51
37
210
282
73
22
36
-39
32
27
46
-14
18.5
89.1
4.0
2.4
12.9
16.9
7.4
26.8
102.1
3.3
3.1
14.8
20.4
8.3
31.1
110.7
3.6
3.7
16.2
21.3
8.5
Neutral
Sell
Sell
Neutral
Buy
Buy
Buy
Buy
Neutral
Neutral
Buy
Buy
Buy
Buy
Buy
Buy
380
1136
690
849
180
548
331
397
1180
97
1347
494
378
736
2526
145
490
998
888
2644
1792
298
2191
73
7042
215
402
920
578
1100
235
523
382
400
1307
128
1300
738
467
1100
3293
194
608
1300
-
3500
2202
343
2700
114
5281
167
6
-19
-16
30
31
-5
15
1
11
32
-4
49
24
49
30
34
24
30
11.3
12.6
14.1
17.2
18.8
23.0
22.4
65.4
6.7
30.3
11.2
22.1
110.4
12.4
30.5
48.1
17.9
34.9
149.9
11.4
46.5
41.6
40.3
147.9
132.7
12.2
88.1
11.6
203.2
6.7
15.9 19.3
48.0 55.4
6.6
6.6
24.1 29.0
5.9
8.3
14.3 17.4
64.0 76.4
8.0
10.7
23.6 26.2
34.1 41.0
9.0
13.2
20.8 29.4
105.0 126.6
7.6
13.6
22.1
29.9
9.7
48.2
32.7
35.6
Buy
Buy
Under
PI Inds.
Review
Piramal Enterp. Buy
SRF
Buy
S H Kelkar
Buy
Team Lease Serv. Buy
Trident
Buy
TTK Prestige
Neutral
V-Guard
Neutral
22.3 253.5
124.2 47.7
-10.4
14.5
-10.7
9.1
11.6
8.4
4.4
25.3
19.0
40.0
36.7
31.6
37.5
28.1
27.8
32.9
32
23
15
23
55
-25
-22
83.1 116.4
76.7 104.9
7.9
10.4
43.3 59.6
7.2
9.2
137.8 176.1
4.5
6.0
5 February 2018
34

MOSL Universe stock performance
Company
Automobiles
Amara Raja
Ashok Ley.
Bajaj Auto
Bharat Forge
Bosch
CEAT
Eicher Mot.
Endurance Tech.
Escorts
Exide Ind
Hero Moto
M&M
Mahindra CIE
Maruti Suzuki
Motherson Sumi
Tata Motors
TVS Motor
Banks - Private
AU Small Fin. Bank
Axis Bank
DCB Bank
Equitas Hold.
Federal Bank
HDFC Bank
ICICI Bank
IDFC Bank
IndusInd
J&K Bank
Kotak Mah. Bk
RBL Bank
South Indian
Yes Bank
Banks - PSU
BOB
BOI
Canara
Indian Bk
PNB
SBI
Union Bk
NBFCs
Aditya Birla Cap
Bajaj Fin.
Capital First
Cholaman.Inv.&Fn
Dewan Hsg.
GRUH Fin.
HDFC
HDFC Stand. Life
Indiabulls Hsg
L&T Fin.Holdings
LIC Hsg Fin
M&M Fin.
Muthoot Fin
1 Day (%)
-4.4
-1.0
-4.9
-4.6
-0.7
-12.6
-0.9
-1.5
-1.5
-3.8
-3.0
-3.6
-6.1
-4.3
-3.2
-2.7
-4.3
-3.7
-4.3
-5.4
-6.4
-5.0
-2.2
-3.2
-6.0
-2.3
-4.3
-2.9
-4.2
-6.0
-2.5
0.5
-3.7
-5.8
-4.1
-3.2
-2.8
-3.7
-3.5
-5.9
-5.9
-4.2
-8.4
-1.3
-3.3
-1.3
-4.2
-7.8
-3.9
-5.3
-8.2
1M (%)
-7.3
-0.9
-1.6
-5.0
-1.9
-14.2
-3.3
-13.7
11.1
-4.5
-3.3
2.1
-15.5
-5.7
-7.2
-12.5
-16.9
-3.8
0.9
-14.4
-3.7
-13.6
4.1
8.3
-2.3
6.8
-15.2
8.5
-5.5
-9.0
12.3
-3.1
-11.7
-11.6
-9.5
-2.9
-2.0
-10.1
-9.2
-5.4
-2.1
-1.4
-10.6
14.2
11.8
12.0
11.4
-7.6
-9.0
-3.5
-12.5
12M (%)
-15.4
28.8
15.4
42.9
-15.5
38.4
16.8
84.4
128.9
0.7
12.3
21.5
8.4
46.5
57.0
-27.7
65.6
Company
MAS Financial Serv.
PNB Housing
Repco Home
Shriram City Union
Shriram Trans.
Capital Goods
ABB
Bharat Elec.
BHEL
Blue Star
CG Cons. Elec.
CG Power & Inds Sol.
Cummins
GE T&D
Havells
K E C Intl
L&T
Siemens
Solar Ind
Thermax
Va Tech Wab.
Voltas
Cement
Ambuja Cem.
ACC
Birla Corp.
Dalmia Bharat
Grasim Inds.
India Cem
J K Cements
JK Lakshmi Ce
Ramco Cem
Orient Cem
Prism Cem
Sagar Cements
Sanghi Inds.
Shree Cem
Ultratech
Consumer
Asian Paints
Britannia
Colgate
Dabur
Emami
Godrej Cons.
GSK Cons.
HUL
ITC
Jyothy Lab
Marico
Nestle
Page Inds
Parag Milk
Pidilite Ind.
P&G Hygiene
1 Day (%)
-3.9
-0.2
-4.8
-1.9
-4.0
-1.4
-6.1
-7.0
-2.1
-3.3
-6.2
-8.5
-5.4
-2.8
-2.8
-2.8
-2.2
-0.7
-4.7
-4.5
-5.7
-2.1
-3.3
-6.5
-5.4
-4.6
-7.2
-3.1
-1.4
-2.7
-3.8
-5.9
-4.2
-5.6
-2.2
-4.8
-1.2
-0.2
-1.0
-1.5
-3.2
0.1
-1.5
0.1
0.0
-0.1
-2.0
-2.3
-5.8
-2.5
-3.9
-0.4
1M (%)
-0.6
-1.3
-13.3
-5.0
-9.2
20.2
-16.1
-4.8
-12.2
-12.1
-5.1
-10.1
-8.4
-7.2
-11.0
13.2
2.3
-8.2
0.6
-8.9
-11.6
-3.1
-3.5
-9.8
-9.4
-0.6
-14.9
-1.9
-7.9
-4.8
-12.6
9.7
5.4
-13.1
-5.0
-1.8
-0.4
1.4
1.6
-1.5
-15.8
7.0
1.6
2.5
5.5
-4.1
-6.2
-9.1
-17.9
-7.3
-3.0
-2.1
12M (%)
39.4
-19.1
5.6
36.3
51.2
8.2
0.7
33.3
26.7
29.0
-8.2
31.0
20.9
122.6
44.0
10.2
51.7
51.2
17.4
72.8
11.6
16.8
48.2
45.8
42.5
-3.5
42.8
3.7
5.0
3.7
26.9
27.9
80.1
8.3
12.1
15.1
46.5
23.7
25.8
-3.9
31.5
28.0
62.5
0.6
4.8
19.2
18.9
40.6
3.5
27.4
31.8
17.1
34.0
-20.0
10.8
50.1
29.0
-12.7
36.8
2.4
41.1
22.5
42.6
26.0
-13.8
18.1
7.2
21.3
13.4
8.9
-15.6
54.5
-1.1
21.9
77.2
62.9
35.7
69.2
53.8
-8.9
50.5
15.9
5 February 2018
35

MOSL Universe stock performance
Company
Prabhat Dairy
United Brew
United Spirits
Healthcare
Alembic Phar
Alkem Lab
Ajanta Pharma
Aurobindo
Biocon
Cadila
Cipla
Divis Lab
Dr Reddy’s
Fortis Health
Glenmark
Granules
GSK Pharma
IPCA Labs
Jubilant Life
Lupin
Laurus Labs
Sanofi India
Shilpa Medicare
Strides Shasun
Sun Pharma
Torrent Pharma
Infrastructure
Ashoka Buildcon
IRB Infra.Devl.
KNR Construct.
Sadbhav Engg.
Logistics
Allcargo Logistics
Concor
Gateway Distriparks
Media
Dish TV
D B Corp
Den Net.
Ent.Network
Hathway Cab.
Hind. Media
HT Media
Jagran Prak.
Music Broadcast
PVR
Prime Focus
Siti Net.
Sun TV
Zee Ent.
Metals
Hindalco
Hind. Zinc
JSPL
JSW Steel
1 Day (%)
-7.3
-4.8
-4.1
-2.6
-1.5
-1.3
-1.3
-3.3
-2.0
-1.3
-1.2
-1.6
-4.3
0.3
-5.2
-0.4
-0.5
-4.3
-1.6
-1.3
0.2
-7.8
-5.0
-0.9
0.1
-3.9
-7.8
-1.8
-5.4
-2.5
-3.2
-1.5
-5.8
-1.4
-6.8
-2.6
-4.0
-3.9
-3.2
-1.3
-3.6
-8.0
-6.5
-3.3
-5.7
-2.0
-2.9
-4.3
-5.8
-1.2
1M (%)
-8.3
10.5
-11.6
1.3
-0.2
-5.8
-9.9
10.4
-4.4
-4.6
-4.7
-11.9
-18.4
-0.3
-9.6
-0.7
-4.7
16.3
-3.0
-4.5
6.0
-14.1
-13.0
-3.6
-2.7
-8.2
-2.4
-3.0
-8.8
-7.7
-1.3
-4.5
-14.3
-9.3
-8.5
-4.3
-6.4
-5.2
-8.0
-7.4
-1.1
-6.8
-19.3
-15.0
-4.1
0.8
-8.3
-4.9
23.1
13.0
12M (%)
78.9
39.7
39.5
-3.3
24.0
-18.3
-12.3
69.5
12.5
-0.8
39.4
-31.5
-30.8
-34.9
4.4
-9.0
5.3
22.9
-42.7
7.5
21.9
-23.0
-34.2
-14.1
5.3
15.6
-5.7
60.3
36.7
7.3
39.7
-10.9
-14.4
-13.6
14.8
-11.6
2.2
-11.7
17.6
-9.2
4.7
20.2
-44.6
73.1
15.1
29.0
-8.4
191.1
54.1
Company
Nalco
NMDC
Rain Industries
SAIL
Vedanta
Tata Steel
Oil & Gas
BPCL
GAIL
Gujarat Gas
Gujarat St. Pet.
HPCL
IOC
IGL
Mahanagar Gas
MRPL
Oil India
ONGC
PLNG
Reliance Ind.
Retail
Jubilant Food
PC Jeweller
Titan Co.
Technology
Cyient
HCL Tech.
Hexaware
Infosys
KPIT Tech
L&T Infotech
Mindtree
Mphasis
NIIT Tech
Persistent Sys
Tata Elxsi
TCS
Tech Mah
Wipro
Zensar Tech
Telecom
Bharti Airtel
Bharti Infratel
Idea Cellular
Tata Comm
Utiltites
Coal India
CESC
JSW Energy
NHPC Ltd
NTPC
Power Grid
Tata Power
1 Day (%)
-6.2
-6.4
-8.6
-6.6
-2.1
-3.8
-2.9
-4.1
-0.1
-3.7
-4.6
-1.7
-4.4
-4.3
-8.8
-3.0
-1.4
-3.5
-4.1
-2.3
-24.4
-1.1
-3.5
0.3
-2.3
-0.2
-5.3
-3.5
-2.4
-3.5
-5.5
0.2
-3.1
0.3
1.0
-0.2
-2.9
-3.7
-0.8
-3.4
-1.2
-1.2
-4.1
-4.1
-4.0
-2.3
-1.3
-5.3
1M (%)
-18.0
-10.7
-17.1
-9.1
1.9
-2.5
-4.8
-5.7
-0.4
-13.7
-7.9
5.9
-13.7
-11.9
-6.3
-7.0
-2.3
-4.0
-0.6
11.7
-21.7
-2.7
7.9
10.8
8.8
10.9
4.0
8.8
21.7
16.0
22.7
10.8
1.8
19.6
20.4
-5.8
6.8
-18.3
-9.1
-12.5
-8.4
8.1
-4.9
-6.7
-12.2
-7.6
-4.0
-14.7
12M (%)
-5.0
-10.5
354.2
26.2
28.6
49.1
1.8
30.3
43.8
24.1
1.8
7.0
51.0
10.4
12.3
1.8
-4.2
25.8
73.4
117.3
94.9
111.9
36.8
19.7
92.2
22.1
48.3
83.7
59.5
50.7
89.7
31.5
35.2
42.8
33.7
32.0
3.1
19.3
17.6
-19.7
-18.7
-8.8
31.6
34.8
-9.3
-4.3
-5.5
5.4
5 February 2018
36

MOSL Universe stock performance
Company
Others
Arvind
Avenue Super.
Bata India
BSE
Castrol India
Coromandel Intl
Delta Corp
Eveready Inds.
Interglobe
Indo Count
Info Edge
Kaveri Seed
Manpasand
MCX
Monsanto
Navneet Educat.
Oberoi Realty
PI Inds.
Piramal Enterp.
Quess Corp
SRF
S H Kelkar
Team Lease Serv.
Trident
V-Guard
1 Day (%)
-6.5
-3.3
-3.0
-2.5
-2.1
0.6
-7.0
-4.2
-3.2
-5.0
1.2
-2.7
-2.3
-5.5
-2.7
-1.2
-6.1
-2.7
-3.7
-2.3
-0.8
-2.1
-5.1
-5.4
-6.2
1M (%)
-13.9
-2.0
-8.3
-9.6
-5.8
1.1
10.8
-9.5
-1.9
-17.8
0.2
-8.5
-18.4
-19.0
1.1
-9.5
1.7
-5.9
-6.5
-15.3
-8.0
3.1
-7.1
-16.7
-9.0
12M (%)
0.8
41.9
5.4
-13.3
65.7
156.7
64.8
37.7
-47.9
61.8
3.7
18.2
-38.6
9.3
10.9
47.4
-2.9
58.2
47.9
5.3
-5.4
125.1
7.1
44.9
5 February 2018
37

THEMATIC/STRATEGY RESEARCH GALLERY

REPORT GALLERY
RECENT INITIATING COVERAGE REPORTS
Rs

DIFFERENTIATED PRODUCT GALLERY

NOTES
5 February 2018
38

Explanation of Investment Rating
Investment Rating
BUY
SELL
NEUTRAL
UNDER REVIEW
NOT RATED
Expected return (over 12-month)
>=15%
< - 10%
> - 10 % to 15%
Rating may undergo a change
We have forward looking estimates for the stock but we refrain from assigning recommendation
*In case the recommendation given by the Research Analyst becomes inconsistent with the investment rating legend, the Research Analyst shall within 28 days of the inconsistency, take appropriate measures to make the recommendation consistent with the investment rating legend.
Disclosures:
The following Disclosures are being made in compliance with the SEBI Research Analyst Regulations 2014 (herein after referred to as the Regulations).
Motilal Oswal Securities Ltd. (MOSL) is a SEBI Registered Research Analyst having registration no. INH000000412. MOSL, the Research Entity (RE) as defined in the Regulations, is engaged in the business of providing Stock broking services,
Investment Advisory Services, Depository participant services & distribution of various financial products. MOSL is a subsidiary company of Motilal Oswal Financial Service Ltd. (MOFSL). MOFSL is a listed public company, the details in respect of
which are available on
www.motilaloswal.com.
MOSL is registered with the Securities & Exchange Board of India (SEBI) and is a registered Trading Member with National Stock Exchange of India Ltd. (NSE) and Bombay Stock Exchange Limited
(BSE), Metropolitan Stock Exchange Of India Ltd. (MSE) for its stock broking activities & is Depository participant with Central Depository Services Limited (CDSL) & National Securities Depository Limited (NSDL) and is member of Association of
Mutual Funds of India (AMFI) for distribution of financial products. Details of associate entities of Motilal Oswal Securities Limited are available on the website at
http://onlinereports.motilaloswal.com/Dormant/documents/Associate%20Details.pdf
Regulatory Enquiries against Motilal Oswal Securities Limited by SEBI:
SEBI pursuant to a complaint from client Shri C.R. Mohanraj alleging unauthorized trading, issued a letter dated 29th April 2014 to MOSL notifying appointment of an Adjudicating Officer as per SEBI regulations to hold inquiry and
adjudge violation of SEBI Regulations; MOSL requested SEBI to provide all documents, records, investigation report relied upon by SEBI which were referred in Show Cause Notice. The matter is closed and MOSL had to pay Rs. 2
lakhs towards penalty for misplacement of original POA of client.
MOSL, it’s associates, Research Analyst or their relative may have any financial interest in the subject company. MOSL and/or its associates and/or Research Analyst may have beneficial ownership of 1% or more securities in the subject company at
the end of the month immediately preceding the date of publication of the Research Report.
MOSL and its associate company(ies), their directors and Research Analyst and their relatives may; (a) from time to time, have a long or short position in, act
as principal in, and buy or sell the securities or derivatives thereof of companies mentioned herein. (b) be engaged in any other transaction involving such securities and earn brokerage or other compensation or act as a market maker in the financial
instruments of the company(ies) discussed herein or act as an advisor or lender/borrower to such company(ies) or may have any other potential conflict of interests with respect to any recommendation and other related information and opinions.;
however the same shall have no bearing whatsoever on the specific recommendations made by the analyst(s), as the recommendations made by the analyst(s) are completely independent of the views of the associates of MOSL even though there
might exist an inherent conflict of interest in some of the stocks mentioned in the research report.
Research Analyst may have served as director/officer, etc. in the subject company in the last 12 month period. MOSL and/or its associates may have
received any compensation from the subject company in the past 12 months.
In the last 12 months period ending on the last day of the month immediately preceding the date of publication of this research report, MOSL or any of its associates may have:
a)
managed or co-managed public offering of securities from subject company of this research report,
b)
received compensation for investment banking or merchant banking or brokerage services from subject company of this research report,
c)
received compensation for products or services other than investment banking or merchant banking or brokerage services from the subject company of this research report.
d)
Subject Company may have been a client of MOSL or its associates during twelve months preceding the date of distribution of the research report.
MOSL and it’s associates have not received any compensation or other benefits from the subject company or third party in connection with the research report. To enhance transparency, MOSL has incorporated a Disclosure of Interest Statement in
this document. This should, however, not be treated as endorsement of the views expressed in the report. MOSL and / or its affiliates do and seek to do business including investment banking with companies covered in its research reports. As a result,
the recipients of this report should be aware that MOSL may have a potential conflict of interest that may affect the objectivity of this report. Compensation of Research Analysts is not based on any specific merchant banking, investment banking or
brokerage service transactions.
Terms & Conditions:
This report has been prepared by MOSL and is meant for sole use by the recipient and not for circulation. The report and information contained herein is strictly confidential and may not be altered in any way, transmitted to, copied or distributed, in part
or in whole, to any other person or to the media or reproduced in any form, without prior written consent of MOSL. The report is based on the facts, figures and information that are considered true, correct, reliable and accurate. The intent of this report
is not recommendatory in nature. The information is obtained from publicly available media or other sources believed to be reliable. Such information has not been independently verified and no guaranty, representation of warranty, express or implied,
is made as to its accuracy, completeness or correctness. All such information and opinions are subject to change without notice. The report is prepared solely for informational purpose and does not constitute an offer document or solicitation of offer to
buy or sell or subscribe for securities or other financial instruments for the clients. Though disseminated to all the customers simultaneously, not all customers may receive this report at the same time. MOSL will not treat recipients as customers by
virtue of their receiving this report.
Analyst Certification
The views expressed in this research report accurately reflect the personal views of the analyst(s) about the subject securities or issues, and no part of the compensation of the research analyst(s) was, is, or will be directly or indirectly related to the
specific recommendations and views expressed by research analyst(s) in this report.
Disclosure of Interest Statement
Analyst ownership of the stock
Companies where there is interest
No
A graph of daily closing prices of securities is available at
www.nseindia.com, www.bseindia.com.
Research Analyst views on Subject Company may vary based on Fundamental research and Technical Research. Proprietary trading desk of MOSL or
its associates maintains arm’s length distance with Research Team as all the activities are segregated from MOSL research activity and therefore it can have an independent view with regards to subject company for which Research Team have
expressed their views.
Regional Disclosures (outside India)
This report is not directed or intended for distribution to or use by any person or entity resident in a state, country or any jurisdiction, where such distribution, publication, availability or use would be contrary to law, regulation or which would subject
MOSL & its group companies to registration or licensing requirements within such jurisdictions.
For Hong Kong:
This report is distributed in Hong Kong by Motilal Oswal capital Markets (Hong Kong) Private Limited, a licensed corporation (CE AYY-301) licensed and regulated by the Hong Kong Securities and Futures Commission (SFC) pursuant to the Securities
and Futures Ordinance (Chapter 571 of the Laws of Hong Kong) “SFO”. As per SEBI (Research Analyst Regulations) 2014 Motilal Oswal Securities (SEBI Reg No. INH000000412) has an agreement with Motilal Oswal capital Markets (Hong Kong)
Private Limited for distribution of research report in Hong Kong. This report is intended for distribution only to “Professional Investors” as defined in Part I of Schedule 1 to SFO. Any investment or investment activity to which this document relates is only
available to professional investor and will be engaged only with professional investors.” Nothing here is an offer or solicitation of these securities, products and services in any jurisdiction where their offer or sale is not qualified or exempt from
registration. The Indian Analyst(s) who compile this report is/are not located in Hong Kong & are not conducting Research Analysis in Hong Kong.
For U.S.
Motilal Oswal Securities Limited (MOSL) is not a registered broker - dealer under the U.S. Securities Exchange Act of 1934, as amended (the"1934 act") and under applicable state laws in the United States. In addition MOSL is not a registered
investment adviser under the U.S. Investment Advisers Act of 1940, as amended (the "Advisers Act" and together with the 1934 Act, the "Acts), and under applicable state laws in the United States. Accordingly, in the absence of specific exemption
under the Acts, any brokerage and investment services provided by MOSL, including the products and services described herein are not available to or intended for U.S. persons. This report is intended for distribution only to "Major Institutional
Investors" as defined by Rule 15a-6(b)(4) of the Exchange Act and interpretations thereof by SEC (henceforth referred to as "major institutional investors"). This document must not be acted on or relied on by persons who are not major institutional
investors. Any investment or investment activity to which this document relates is only available to major institutional investors and will be engaged in only with major institutional investors. In reliance on the exemption from registration provided by Rule
15a-6 of the U.S. Securities Exchange Act of 1934, as amended (the "Exchange Act") and interpretations thereof by the U.S. Securities and Exchange Commission ("SEC") in order to conduct business with Institutional Investors based in the U.S.,
MOSL has entered into a chaperoning agreement with a U.S. registered broker-dealer, Motilal Oswal Securities International Private Limited. ("MOSIPL"). Any business interaction pursuant to this report will have to be executed within the provisions of
this chaperoning agreement.
The Research Analysts contributing to the report may not be registered /qualified as research analyst with FINRA. Such research analyst may not be associated persons of the U.S. registered broker-dealer, MOSIPL, and therefore, may not be subject
to NASD rule 2711 and NYSE Rule 472 restrictions on communication with a subject company, public appearances and trading securities held by a research analyst account.
For Singapore
Motilal Oswal Capital Markets Singapore Pte Limited is acting as an exempt financial advisor under section 23(1)(f) of the Financial Advisers Act(FAA) read with regulation 17(1)(d) of the Financial Advisors Regulations and is a subsidiary of Motilal
Oswal Securities Limited in India. This research is distributed in Singapore by Motilal Oswal Capital Markets Singapore Pte Limited and it is only directed in Singapore to accredited investors, as defined in the Financial Advisers Regulations and the
Securities and Futures Act (Chapter 289), as amended from time to time. In respect of any matter arising from or in connection with the research you could contact the following representatives of Motilal Oswal Capital Markets Singapore Pte Limited:
Disclaimer:
The report and information contained herein is strictly confidential and meant solely for the selected recipient and may not be altered in any way, transmitted to, copied or distributed, in part or in whole, to any other person or to the media or reproduced
in any form, without prior written consent. This report and information herein is solely for informational purpose and may not be used or considered as an offer document or solicitation of offer to buy or sell or subscribe for securities or other financial
instruments. Nothing in this report constitutes investment, legal, accounting and tax advice or a representation that any investment or strategy is suitable or appropriate to your specific circumstances. The securities discussed and opinions expressed in
this report may not be suitable for all investors, who must make their own investment decisions, based on their own investment objectives, financial positions and needs of specific recipient. This may not be taken in substitution for the exercise of
independent judgment by any recipient. Each recipient of this document should make such investigations as it deems necessary to arrive at an independent evaluation of an investment in the securities of companies referred to in this document
(including the merits and risks involved), and should consult its own advisors to determine the merits and risks of such an investment. The investment discussed or views expressed may not be suitable for all investors. Certain transactions -including
those involving futures, options, another derivative products as well as non-investment grade securities - involve substantial risk and are not suitable for all investors. No representation or warranty, express or implied, is made as to the accuracy,
completeness or fairness of the information and opinions contained in this document. The Disclosures of Interest Statement incorporated in this document is provided solely to enhance the transparency and should not be treated as endorsement of the
views expressed in the report. This information is subject to change without any prior notice. The Company reserves the right to make modifications and alternations to this statement as may be required from time to time without any prior approval.
MOSL, its associates, their directors and the employees may from time to time, effect or have effected an own account transaction in, or deal as principal or agent in or for the securities mentioned in this document. They may perform or seek to perform
investment banking or other services for, or solicit investment banking or other business from, any company referred to in this report. Each of these entities functions as a separate, distinct and independent of each other. The recipient should take this
into account before interpreting the document. This report has been prepared on the basis of information that is already available in publicly accessible media or developed through analysis of MOSL. The views expressed are those of the analyst, and
the Company may or may not subscribe to all the views expressed therein. This document is being supplied to you solely for your information and may not be reproduced, redistributed or passed on, directly or indirectly, to any other person or
published, copied, in whole or in part, for any purpose. This report is not directed or intended for distribution to, or use by, any person or entity who is a citizen or resident of or located in any locality, state, country or other jurisdiction, where such
distribution, publication, availability or use would be contrary to law, regulation or which would subject MOSL to any registration or licensing requirement within such jurisdiction. The securities described herein may or may not be eligible for sale in all
jurisdictions or to certain category of investors. Persons in whose possession this document may come are required to inform themselves of and to observe such restriction. Neither the Firm, not its directors, employees, agents or representatives shall
be liable for any damages whether direct or indirect, incidental, special or consequential including lost revenue or lost profits that may arise from or in connection with the use of the information.
The person accessing this information specifically agrees
to exempt MOSL or any of its affiliates or employees from, any and all responsibility/liability arising from such misuse and agrees not to hold MOSL or any of its affiliates or employees responsible for any such misuse and further agrees to hold MOSL
or any of its affiliates or employees free and harmless from all losses, costs, damages, expenses that may be suffered by the person accessing this information due to any errors and delays.
Registered Office Address: Motilal Oswal Tower, Rahimtullah Sayani Road, Opposite Parel ST Depot, Prabhadevi, Mumbai-400025; Tel No.: 022-3980 4263; www.motilaloswal.com. Correspondence Address: Palm Spring Centre, 2nd Floor, Palm
Court Complex, New Link Road, Malad (West), Mumbai- 400 064. Tel No: 022 3080 1000. Compliance Officer: Neeraj Agarwal, Email Id:
na@motilaloswal.com,
Contact No.:022-30801085.
Registration details of group entities.: MOSL: SEBI Registration: INZ000158836 (BSE/NSE/MSE); CDSL: IN-DP-16-2015; NSDL: IN-DP-NSDL-152-2000; Research Analyst: INH000000412. AMFI: ARN 17397. Investment Adviser: INA000007100.
Motilal Oswal Asset Management Company Ltd. (MOAMC): PMS (Registration No.: INP000000670) offers PMS and Mutual Funds products. Motilal Oswal Wealth Management Ltd. (MOWML): PMS (Registration No.: INP000004409) offers wealth
management solutions. *Motilal Oswal Securities Ltd. is a distributor of Mutual Funds, PMS, Fixed Deposit, Bond, NCDs, Insurance and IPO products. * Motilal Oswal Commodities Broker Pvt. Ltd. offers Commodities Products. * Motilal Oswal Real
Estate Investment Advisors II Pvt. Ltd. offers Real Estate products. * Motilal Oswal Private Equity Investment Advisors Pvt. Ltd. offers Private Equity products
13 December 2016
39