8 February 2018
Market snapshot
Equities - India
Close
Chg .%
Sensex
34,083
-0.3
Nifty-50
10,477
-0.2
Nifty-M 100
19,480
0.4
Equities-Global
Close
Chg .%
S&P 500
2,682
-0.5
Nasdaq
7,052
-0.9
FTSE 100
7,279
1.9
DAX
12,590
1.6
Hang Seng
12,433
-2.0
Nikkei 225
21,645
0.2
Commodities
Close
Chg .%
Brent (US$/Bbl)
65
-2.5
Gold ($/OZ)
1,319
-0.4
Cu (US$/MT)
6,836
-2.8
Almn (US$/MT)
2,162
-0.5
Currency
Close
Chg .%
USD/INR
64.3
0.1
USD/EUR
1.2
-1.0
USD/JPY
109.6
0.2
YIELD (%)
Close
1MChg
10 Yrs G-Sec
7.5
-0.04
10 Yrs AAA Corp
8.1
-0.04
Flows (USD b)
7-Feb
MTD
FIIs
-0.2
-0.2
DIIs
0.1
0.5
Volumes (INRb)
7-Feb
MTD*
Cash
381
451
F&O
7,270
8,988
Note: YTD is calendar year, *Avg
YTD.%
0.1
-0.5
-7.8
YTD.%
0.3
2.2
-5.3
-2.5
6.2
-4.9
YTD.%
-2.0
1.2
-5.1
-4.2
YTD.%
0.6
2.2
-2.8
YTDchg
0.2
0.2
YTD
2.0
0.4
YTD*
431
7,594
Today’s top research idea
Eicher Motors: Operating performance in line; RE margins
stable; VECV below est.
Consol. revenue grew 23.7% YoY to INR22.7b (est. of INR22.1b), with EBITDA
growth of 23% YoY to INR7.1b (est. of INR6.9b). Consol. EBITDA margin of
31.2% was in-line.
Higher depreciation and lower other income restricted PAT to INR5.2b (+25%
YoY; est. of INR5.5b).
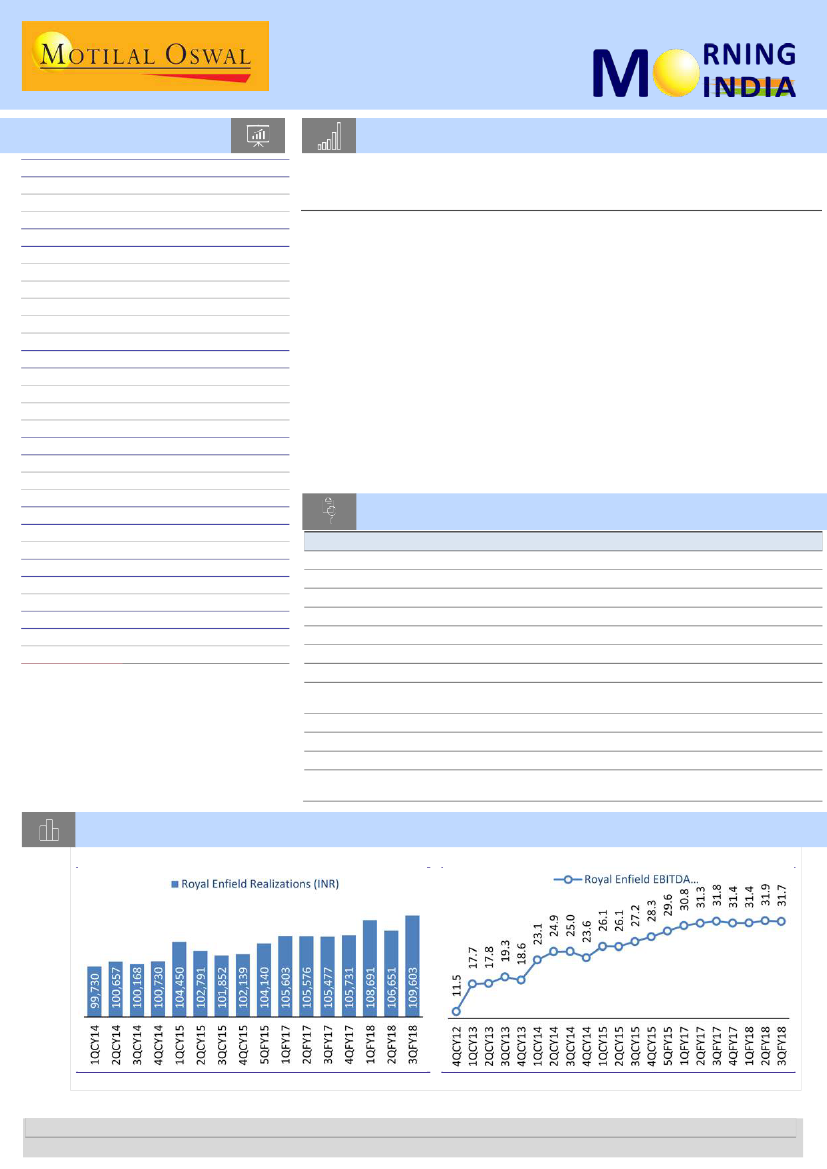
RE’s realization improved 2.8% QoQ (+3.9% YoY) to ~INR109.6k (est. of
INR106.9k).
VECV’s realization was flat QoQ (+2.4% YoY) at INR1.6m (est. of INR1.57m).
RE took price increase of 1% on 350cc models, effective Feb’18.
Plan for Phase-II at Vallam plant would be finalized in May-18; in the absence of
expansion, capacity would be 900k in FY19E.
Management expects strong growth in 7 out of top 10 states, where RE has
market share of 2-4%.
Management indicated that VECV should see continued strong demand
momentum.
Research covered
Cos/Sector
Technology
Ecoscope
Eicher Motors
Cipla
Aurobindo Pharma
Dalmia Bharat
Indraprastha Gas
Voltas
Castrol India
Thermax
Other Results
Results Expectation
Key Highlights
Early cues to CY18: Only so much acceleration from Digital?
RBI maintains status quo
Operating performance in line; RE margins stable; VECV below est.
India business shines; Margins improve strongly
Strong results; healthy growth in US and Europe business
Volumes beat; EBITDA below estimate due to higher other expenses
EBITDA below estimate; strong volume growth continues
Ahead of estimates driven by strong sales in UCP segment; project
segment margins at 7.1%
EBITDA beat led by higher volumes and realizations
Miss led by weak execution, pressure on margins
HEXW | SRF | GETD | SOIL | DITV | RIB | IPCA | BLSTR
ABB | ACC | BHEL | BHFC | CDH | CESC | GNP | GRAN | GUJS | MUTH |
PAG | PARAG | PLNG | SAIL | TCOM | TRP
Chart of the Day: Eicher Motors: Operating performance in line; RE margins stable; VECV below est.
RE’s realizations improve by ~3% QoQ
EBITDA Margin remains stable at 31.7%; -20bp QoQ
Source: Company, MOSL
Research Team (Gautam.Duggad@MotilalOswal.com)
Investors are advised to refer through important disclosures made at the last page of the Research Report.
Motilal Oswal research is available on www.motilaloswal.com/Institutional-Equities, Bloomberg, Thomson Reuters, Factset and S&P Capital.

In the news today
Kindly click on textbox for the detailed news link
1
Suzuki to invest $3 billion in
India over 3 years
Suzuki Motor Corp has lined up an
investment of about $3 billion (Rs
20,000 crore) in the Indian market
over the next three years as it
aims to maintain its dominance of
the Indian passenger vehicle
market and ready itself for the
next big leap into electric and
hybrid vehicle technology. ...
2
RBI: Growth to accelerate, but inflation threat looms
The Reserve Bank of India (RBI) on Wednesday kept interest rates
unchanged and warned that inflation risks were skewing upwards. The
central bank raised its March quarter Consumer Price Index (CPI) inflation
forecast to 5.1% and projected an inflation range of 5.1-5.6% in the first
half of the next fiscal year. However, RBI posits a revival in growth—
projecting an acceleration in economic growth to 7.2% from a level of 6.6%
in the current fiscal year. It premises this on a host of factors including
revival in investment demand and strengthening exports.
3
Mutual funds add Rs 1.06 lakh
crore in January
Assets under management for the
mutual fund industry rose by Rs
1.06 lakh crore, touching Rs 22.41
lakh crore for the month of
January reports industry body
AMFI. Liquid and short term funds
which had seen outflows of Rs
1.38 lakh crore on account of year
end considerations, buybacks by
corporates in December saw some
inflows with Rs 96,000 crore of …
4
Manulife leads race to acquire
IDBI Federal for up to $650
million
ManuLife, or the Manufacturers
Life Insurance, the largest life
insurance firm in Canada, has
emerged as a surprise lead
contender to acquire a controlling
stake in insurance firm IDBI-
Federal for about $550- $650
million, as per the indicative bids
submitted by various firms,
multiple sources close to the …
5
JSW offer Rs 300 bn for
Bhushan Steel, Rs 50 bn more
than Tata's bid
JSW Steel, one of India’s leading
integrated steel manufacturers
with a capacity of 18 million
tonnes per annum (mtpa), has
offered Rs 300 billion to take
over debt-laden Bhushan Steel,
Rs 50 billion more than rival
bidder Tata Steel’s offer,
according to a source close to
the development. The takeover,
if successful, would boost JSW
Steel’s capacity by 5.6 mtpa,
even as the lenders would have
to take a 50 per cent haircut on
their dues, totalling Rs 590
billion.
6
Govt gives administrative
approval, financial sanction to
build 12 nuclear power
reactors
The government has accorded
administrative approval and
financial sanction for construction
of 12 nuclear power reactors in the
country, Parliament was informed
today. Out of these, 10 will be
indigenous Pressurised Heavy
Water Reactors (PHWRs) with a
capacity of 700 MW each …
8 February 2018
7
Power firms hit by surge in
imported coal prices
Imported coal prices are on the rise
again, and it is unclear if they will
subside soon. On Tuesday,
Indonesia’s Ministry of Energy and
Mineral Resources set its February
thermal coal reference price, also
known as Harga Batubara Acuan, or
HBA, at $100.69/tonne, up 20.8 per
cent year-on-year and 5.4 per cent
from January, reported Platts. The
prices (FOB) of 4,200 Kcal …
2

Sector Update | 7 February 2018
Technology
Companies
Accenture
Cognizant
TCS
Infosys
Wipro
HCL Tech
Tech Mahindra
Rating
Not Rated
Not Rated
Neutral
Buy
Neutral
Neutral
Buy
Early cues to CY18: Only so much acceleration from Digital?
Caution + (lack of) visibility potentially provide room for growth surprise
Commentaries by IT Services biggies, healthy deal wins, a buoyant outlook on Digital,
and expectations of investment pick-up all mean a sanguine growth recovery.
However, revenue growth guidance by CTSH and Accenture defy that. TCS may reach
double-digits, going by its commentary.
After two years of sluggish growth, it is understandable that the optimistic stance
comes with some caution. Also, the visibility on how client spending eventually pans
out is limited. Both these factors contributed to the last material positive surprise we
saw in FY11, on the base of acceleration that was already guided for.
One key difference this time is the degree of homogeneity within the sector, which has
come off in recent years. Hence, while we do not rule out 2-3pp (or even higher)
growth acceleration in overall IT Services, there may be polarization in terms of
beneficiaries of the same.
Better CY18 has been a unanimous outlook…
CY17 was a subdued year for multiple macro and micro reasons for IT Services
vendors – [1] fresh from political developments in the US, [2] clamor around
hostile visa reforms, [3] dampened hopes of a pick-up in BFS spending on the
back of tax and deregulation sops, and [4] management changes/restructuring
exercise in multiple firms.
Stepping into CY18, commentary across the board – big and small companies
alike – has been of improved growth outlook on the back of: [1] digital
momentum, [2] a great quarter of deal activity and [3] citations of the worse in
troubled verticals such as BFS and Retail behind.
This is also reflected in some uptick in aggregated organic growth across the
top-5 IT companies (TCS, Cognizant, Infosys, Wipro and HCLT) for the first time
in seven quarters. We see 5.8% YoY CC organic growth in 4QCY17 v/s 5% in the
previous quarter.
TCS also cited that it should be able to clock double-digit revenue growth in
FY19, supported by the announcements of multiple mega deals – which had
seemingly disappeared – in the span of 3-4 months.
Exhibit 1: Comparative valuations
Company
TCS
Infosys
Wipro
HCL Tech
TechM
Rating
Neutral
Buy
Neutral
Neutral
Buy
TP (INR)
2,700
1,250
300
950
700
Upside
(%)
-8.6
12.7
3.6
1.2
16.1
FY18E
130.6
64.4
17.9
61.7
39.6
EPS (INR)
FY19E
147.3
70.7
18.5
64.1
41.4
FY20E
161.0
78.6
21.2
68.9
48.3
FY18E
22.6
17.2
16.1
15.2
15.2
P/E (x)
FY19E
20.1
15.7
15.6
14.6
14.6
FY20E
18.4
14.1
13.6
13.6
12.5
RoE (%)
FY18-20E CAGR (%)
FY18E FY19E FY20E USD rev.
EPS
30.4
32.9
31.3
8.5
11.0
24.3
23.1
23.2
8.5
10.5
17.2
16.7
17.0
7.4
8.8
25.1
23.9
23.5
8.3
5.7
20.6
19.5
19.8
9.9
10.4
Source: MOSL, Company
8 February 2018
3

E
CO
S
COPE
RBI maintains status quo
We don’t expect change in policy rate in 2018
7 February 2018
The Economy Observer
The Monetary Policy Committee (MPC) maintained status quo today, in line with market consensus. Interestingly, while
the vote share was unchanged at 5-1 in favor of the decision, this time, the dissenting vote was in favor of a rate hike
(by Dr Michael Patra) as opposed to a rate cut (by Dr Ravindra Dholakia) last time.
The RBI revised its inflation projections for 4QFY18 upwards while GVA forecasts were revised downwards. It now sees
inflation at 5.1% in 4QFY18, as against its previous expectation of 4.3-4.7% in 2HFY18, and projects it to be in the range
of 5.1-5.6% during 1HFY19, before moderating to 4.5-4.6% in 2HFY19 owing to a favorable base effect. It stressed that
risks to inflation are tilted to the upside, while they is balanced for GVA growth.
We expect inflation to peak at ~6% in 1QFY19 on account of an adverse base, after which it should start moderating and
end FY19 at ~4%. Further, real GVA growth of 6.6% for FY18 and 7.2% next year still appears a tall task. Consequently,
we expect RBI to keep policy rates unchanged in 2018.
RBI maintains status quo:
In its sixth and last bi-monthly Monetary Policy
Review in FY18, the MPC kept rates unchanged – the repo rate at 6%, the
reverse repo rate at 5.75% and the marginal standing facility (MSF) rate at
6.25%
(Exhibit 1),
while maintaining a neutral policy stance. The MPC’s decision
was in line with market expectations. Interestingly, while the vote share was
unchanged at 5-1 in favor of the decision, the dissenting vote this time was in
favor of a rate hike (by Dr Michael Patra) as opposed to a rate cut (by Dr
Ravindra Dholakia) last time.
Inflation projections revised upwards…:
As against its previous projection of
4.3-4.7% in 2HFY18, the RBI has revised the inflation forecast for 4QFY18 to
5.1%. Further, the central bank expects inflation to rise to 5.1-5.6% during
1HFY19, before moderating to 4.5-4.6% in 2HFY19 owing to a favorable base
effect. It also believes that there are upside risks to inflation, primarily stemming
from (1) higher MSPs for kharif crops as stated in the Union Budget, (2) increase
in customs duties, and (3) fiscal slippage.
…while growth projections revised downwards:
The RBI cut its FY18 GVA
growth projection marginally to 6.6% from 6.7% earlier. It expects GVA growth
to improve to 7.2% in FY19, with a projection of 7.3-7.4% in 1H and 7.1-7.2% in
2HFY19.
Expect status quo in 2018:
Although we expect inflation to be higher than RBI’s
projection, real GVA could be lower. CPI-inflation could be ~6% in 1QFY19 on
account of an adverse base, which is likely to ease to ~4% by end-FY19. Further,
while GVA growth is expected to improve in FY19, 7% looks like a tall task. These
two contradictory forces make us believe that the RBI is likely to keep policy
rates unchanged in 2018.
8 February 2018
4

7 February 2018
3QFY18 Results Update | Sector: Automobiles
Eicher Motors
Buy
BSE SENSEX
34,083
Bloomberg
Equity Shares (m)
M.Cap.(INRb)/(USDb)
52-Week Range (INR)
1, 6, 12 Rel. Per (%)
Avg. Val, INRm
Free float (%)
S&P CNX
10,477
EIM IN
Operating performance in line; RE margins stable; VECV below est.
27.2
Consolidated revenue grew 23.7% YoY to ~INR22.7b (est. of INR22.1b), with
761.8 / 11.4
EBITDA growth of 23% YoY to INR7.1b (est. of INR6.9b). However, higher
33,484 / 19,571
depreciation and lower other income restricted PAT to INR5.2b (+25% YoY;
4/11/27
1,326.8
est. of INR5.5b).
49.5
RE’s
net realization improved 2.8% QoQ (+3.9% YoY) to ~INR109.6k (est. of
CMP: INR27,998
TP: INR34,764(+24%)
Financials & Valuations (INR b)
Y/E Mar
2018E
2019E
Net Sales
89.4
107.7
EBITDA
28.4
35.3
PAT
22.6
28.7
EPS (INR)
829.4 1,053.0
Gr. (%)
34.5
27.0
BV/Sh (INR)
2,613
3,465
RoE (%)
36.2
34.6
RoCE (%)
31.7
30.9
P/E (x)
33.8
26.6
P/BV (x)
10.7
8.1
2020E
129.5
44.1
36.3
1,335.0
26.8
4,570
33.2
30.7
21.0
6.1
Estimate change
TP change
Rating change
INR106.9). EBITDA margin contracted ~20bp QoQ (flat YoY) to 31.7%,
higher than our estimate of 31.2% due to lower RM cost (despite
commodity pressures) on efficiency gains. PAT grew 14% YoY to INR4.7b.
VECV’s
realizations grew 2.4% QoQ (flat YoY) to INR1.6m (est. of
INR1.57m). EBITDA margin expanded 180bp YoY (-50bp QoQ) to 8.7% (est.
of 9.4%), led by efficiency gains and operating leverage. PAT grew 134%
YoY to INR1.3b (est. of INR1.4m).
Earnings call highlights:
a) Plan for Phase-II at the Vallam plant would be
finalized in May-18; in absence of expansion, capacity to be 900k in FY19. b)
Expect strong growth in 7 out of top 10 states, where RE has market share
of 2-4%. c) Price increase of 1% taken on 350cc models effective Feb-18. d)
Domestic dealership network to be expanded to 825/925 by FY18/FY19. d)
Expect strong demand momentum to continue for VECV.
Valuation view:
We cut FY19E EPS by 2% to mainly factor in higher tax. We
cut our RE multiple to 27x (30x earlier) to factor in normalization of RE’s
volume growth. Maintain
Buy
with a TP of INR34,764 (Mar-20 SOTP based).
(INR m)
4Q
18,881
23.2
5,848
31.0
4,594
33.9
1Q
20,006
28.6
6,207
31.0
32.1
4,596
22.1
FY18
2Q
3Q
21,673 22,690
23.5
23.7
6,825
7,072
31.5
31.2
25.9
22.6
5,180
5,205
25.4
24.5
FY17
4QE
25,016
32.5
8,335
33.3
42.5
7,587
65.1
70,334
42.4
21,740
60.9
178.2
16,780
56.8
FY18E
89,386
58.9
28,439
31.8
30.8
22,568
68.1
FY18E VAR (%)
3QE
22,074
2.8
20.3
6,884
2.7
31.2
0bp
17.7
5,480
-5.0
31.0
0.0
2.6
50bp
-2.8
Quarterly performance (Consolidated)
Y/E March
Net Operating income
Growth (%)
EBITDA
EBITDA Margins (%)
Change (%)
Recurring PAT
Growth (%)
1Q
15,557
42.0
4,700
30.2
34.0
3,763
58.6
FY17
2Q
3Q
17,549 18,348
35.0
42.9
5,422
5,770
30.9
31.4
51.6
29.1
4,132
4,182
45.2
50.0
Standalone (Royal Enfield)
Royal Enfield (units)
Growth (%)
Net Realn (INR/unit)
Change - YoY (%)
EBITDA Margins (%)
Recurring PAT
Growth (%)
147,483 166,941 173,838 178,228 183,998 202,867 206,586 228,178 666,490 821,629 206,586
38.3
30.8
38.2
20.3
24.8
21.5
18.8
28.0
38.8
54.1
18.8
105,603 105,576 105,477 105,731 108,691 106,651 109,603 110,039 105,598 108,791 106,851
2.7
3.7
3.3
1.5
2.9
1.0
3.9
4.1
2.4
3.0
1.3
30.8
31.3
31.8
31.4
31.4
31.9
31.7
32.2
31.3
31.8
31.2
3,371
3,962
4,152
4,116
4,943
4,864
4,720
5,500 15,600 20,028
4,855
69.6
54.2
64.5
8.5
46.6
22.8
13.7
33.6
48.9
60.5
16.9
16,071
32.5
1,331
-9.6
9.1
1,082
40.9
13,408
15.0
1,470
-3.8
7.2
650
-4.0
11,784 17,230
-7.1
10.8
1,600
1,482
1.9
11.2
6.9
8.2
570
1,203
-36.0 1,890.9
11,583
-27.9
1,557
16.9
8.3
650
-39.9
15,013
12.0
1,558
6.0
9.2
950
46.2
16,231
37.7
1,596
-0.2
8.7
1,328
133.0
22,121
28.4
1,594
7.5
9.6
2,145
78.4
58,493
16.0
1,452
-0.9
7.9
3,474
10.1
64,948
38.8
1,579
8.8
9.0
5,313
91.2
16,231
37.7
1,574
-1.6
9.4
1,358
138.2
VECV
Total CV Volumes
Growth (%)
Net Realn (INR '000/unit)
Change - YoY (%)
EBITDA Margins (%)
Recurring PAT
Growth (%)
E: MOSL Estimates
0.0
1.4
-70bp
-2.2
8 February 2018
5

7 February 2018
3QFY18 Results Update | Sector: Financials
Cipla
Neutral
BSE SENSEX
34,083
Bloomberg
Equity Shares (m)
M.Cap.(INRb)/(USDb)
52-Week Range (INR)
1, 6, 12 Rel. Per (%)
Avg Val, INRm
Free float (%)
S&P CNX
10,477
CIPLA IN
India business shines; Margins improve strongly
805
3QFY18 revenue grew 7% YoY to INR39.1b (est. of INR39.1b). Gross margin
458.2 / 7.1
improved to 64.1% from 63.3% in 3QFY17 and 61.1% in 2QFY18. EBITDA
663 / 479
came in at INR8.2b, with the margin at 20.9% v/s our estimate of 20%.
-7/-4/-25
Depreciation included one-time impairment charge of INR1.7b (net of tax;
841.0
this was regarding certain product-related intangible assets of US business
63.3
CMP: INR569
TP: INR600(+5%)
Financials & Valuations (INR b)
2018E 2019E
Y/E Mar
Net Sales
158.2
179.1
EBITDA
31.3
36.4
PAT
17.3
21.7
EPS (INR)
21.6
27.0
Gr. (%)
35.7
25.3
BV/Sh (INR)
174.7
198.7
RoE (%)
12.3
13.6
RoCE (%)
10.1
11.4
P/E (x)
26.4
21.0
P/BV (x)
3.3
2.9
Estimate change
TP change
Rating change
arising out of increased competitive headwinds and adverse regulatory
developments). Also, there was a one-time positive impact of INR1.1b on
2020E
deferred tax due to a change in the US tax system. Reported PAT of INR4.0b
202.3
came in lower than our estimate of INR4.8b. However adjusted for one-time
42.3
impairment and deferred tax, PAT stood at ~INR4.65b.
26.5
Strong growth in domestic business; US story on track:
Domestic business
33.0
grew ~14% YoY (on a like-to-like basis, GST adj. growth was at 22% YoY) due
22.0
to strong inherent growth and channel refilling post GST rollout. US sales
228.6
grew 2% YoY and 5% QoQ. Sequential increase in sales was driven by the
14.4
launch of gPulmicort and gDecitabine. We expect US business growth to be
12.4
driven by ramp-up of recent launches and key upcoming approvals, including
17.2
Nano-paclitaxel and Albuterol MDI.
2.5
Earnings call takeaways:
a) CIPLA plans to file two complex ANDAs by late
4Q/early 1QFY19. b) Effective tax rate is expected to be at ~25% in FY18E. c)
FCF post capex was ~INR4.8b in 3Q. d) Net debt/equity stood at 0.13x at 9M
FY18E end. e) Filed 2 ANDA in 3Q and plans to file ~10 ANDAs in 4Q. f) In
neurology and respiratory therapy, the company is looking at assets in late
phase-II, phase-III stages, which will be through balance sheet. g) Company
expects to file ~10 ANDAs in 4Q (total 20 ANDA filings in FY18). h) R&D
expense stood at ~7.6% of sales (+150bp QoQ). i) Advair trial on track; two
additional clinical trials expected to begin soon.
Valuation and view:
Unlike other large cap peers, Cipla is well poised to
deliver robust growth in the US due to a lower base and a significant pick-up
in the filing quality and rate (filed 32 ANDAs in FY17 and planning to file 20
in FY18E). We maintain our
Neutral
rating on the stock with a TP of INR600
@ 20x 1HFY20E PER.
8 February 2018
6

RESULTS
FLASH
Aurobindo Pharma
BSE SENSEX
34,083
S&P CNX
10,477
7 February 2018
Results Flash | Sector: Healthcare
CMP: INR617
TP: INR900(+46%)
Buy
Strong results; healthy growth in US and Europe business
Conference Call Details
Date:
8th Feb 2018
Time:
08:30am IST
Dial-in details:
+91-22-3960 0689
Financials & Valuations (INR b)
2017
2018E
Y/E Mar
Net Sales
150.9
166.9
EBITDA
34.3
39.7
NP
23.0
26.1
EPS (INR)
39.3
44.6
EPS Gr. (%)
13.5
13.5
BV/Sh. (INR)
160.0
202.1
RoE (%)
27.6
24.6
RoCE (%)
19.0
19.6
P/E (x)
15.7
13.8
P/BV (x)
3.9
3.1
2019E
185.7
44.6
29.5
50.3
12.8
249.9
22.3
18.7
12.3
2.5
Net sales increased 1% YoY (-2% QoQ) to ~INR43.4b (v/s est of ~INR42.6b).
Company’s US business grew by ~9% YoY (-9% QoQ) to INR19.1b. On a constant
currency basis, sales increased ~14% YoY.
Europe and RoW revenues increased significantly by 36% YoY to INR14.2b.
Gross margins improved by ~200bp YoY (-200bp QoQ) to 58%.
EBITDA increased by ~15% YoY to ~INR10.3b (v/s est of INR10b).
EBITDA margin saw improvement of ~70bp YoY to 23.7% (-150bp QoQ).
PAT, although increased by ~3% YoY to INR5.9b (v/s est. of INR6.4b), was
impacted by one-time charge of INR664m, as the company re-measured its US
deferred tax assets and liabilities based on the new tax law.
Debt during the quarter came down by ~USD76m to USD550m.
Key questions for management
Injectable business growth outlook in FY18/19E
Uptake of key launches during the quarter
Update on M&A strategy
Whether strong growth in Europe and RoW market is sustainable going
forward
Impact of price erosion in base business and future outlook.
Valuation and view:
We have a Buy rating on Aurobindo Pharma.
8 February 2018
7

RESULTS
FLASH
Dalmia Bharat
BSE SENSEX
34,083
S&P CNX
10,477
7 February 2018
Results Flash | Sector: Cement
CMP: INR2,705
TP: INR3,517(+30%)
Buy
Conference Call Details
Date:
8 Feb 2018
Time:
10:00 am IST
Dial-in details:
+91 22 3938 1073
+91-7045671221
th
Financials & Valuations (INR b)
2018E 2019E 2020E
Y/E Mar
Sales
82.9
93.8 107.2
EBITDA
20.8
23.2
26.8
NP
5.4
7.4
9.9
Adj EPS (INR)
60.8
83.7 111.7
EPS Gr. (%)
56.8
37.6
33.5
BV/Sh (INR)
617
697
804
RoE (%)
10.3
12.7
14.9
RoCE (%)
9.1
10.3
11.7
Payout (%)
3.8
4.2
4.2
Valuations
P/E (x)
44.5
32.3
24.2
P/BV (x)
4.4
3.9
3.4
EV/EBITDA (x)
14.4
12.5
10.5
EV/Ton (USD)
175
170
164
Volumes beat; EBITDA below estimate due to higher other expenses
Volumes grew 17% YoY to 4.15mt (est. of 3.88mt) in 3QFY18, led by healthy
growth in eastern operations. Revenue rose 21% YoY to INR20.9b (est. of
INR19.4b).
Blended realizations stood at INR5,037/ton (+4% YoY, flat QoQ), higher than
our estimate. Cement realizations increased 5% YoY to INR4,941/t (flat QoQ).
EBITDA grew 10% YoY to INR4.5b (est. of INR4.7b), with the margin at 21.7% (-
2.3pp YoY, -2.3pp QoQ). EBITDA/t stood at INR1,095 (-6% YoY/-10% QoQ; est.
of INR1,232). Sequential decline in EBITDA can be attributed to higher other
expenses and raw material cost.
Interest cost declined 33% YoY to INR1.42b due to reversal of forex fluctuations
and debt reduction by INR2.28b/INR7.37b in 3QFY18/9MFY18. Other income
declined 25% YoY due to lower yield.
Tax rate in 3QFY18 was 32% (33% in 3QFY17). Hence, adj. PAT of INR979m (est.
of INR1.14b) increased 145% YoY/4% QoQ. Net debt has been reduced by
INR3.2b to INR39.5b in 3QFY18.
OCL performance: Strong volume growth of 21% YoY
Volume grew 21% YoY to 1.64mt in 3QFY18. Revenue grew 25% YoY to INR8.6b
(+25% YoY).
Cement realizations stood at INR5,239/t (+INR175/t QoQ) due to higher prices
sequentially in the eastern market. Cost/t at INR4,202 increased 8% YoY and
4% QoQ . The QoQ increase was due to an increase in RM cost/t (increase in
slag prices) and freight cost/t (due to increase in prices of diesel).
Hence, EBITDA stood at INR1.7b (+8% YoY). EBITDA/t came in at INR1,038
(+INR17/t QoQ) due to higher realization, partially offset by cost push. PAT
stood at INR1.17m (+47%YoY), with a tax rate of 3.6% v/s 30.7% in 3QFY17.
Valuation view:
The stock trades at 12.5x/10.5x FY19/20E EV/EBITDA. Maintain
Buy
with a target price of INR3,517 (13.5x FY20 EV/EBITDA).
1Q
3.76
21.7
4,727
-3.0
17,775
11.1
5,084
28.6
1,338
2,412
766
2,100
0
2,100
911
43.4
1,189
250
940
78.3
FY17
2Q
3Q
3.42
3.56
20.0
20.3
5,010
4,837
6.0
-3.5
17,134
17,219
20.8
16.4
4,207
4,147
24.6
24.1
1,587
1,887
2,291
2,105
796
676
1,125
831
0
8
1,125
823
662
273
58.9
33.2
463
550
152
151
311
399
149.8
33.3
FY18
4Q
4.55
17.3
4,802
-0.7
21,850
15.6
5,517
25.2
1,509
1,998
715
2,724
-139
2,863
704
24.6
2,159
319
1,736
83.2
1Q
3.99
6.1
5,129
6.8
20,466
15.1
5,566
27.2
1,532
2,117
700
2,617
-267
2,885
889
30.8
1,996
357
1,454
54.7
2Q
3.64
6.4
5,038
-1.8
18,337
7.0
4,408
24.0
1,653
1,974
922
1,703
33
1,669
556
33.3
1,113
193
942
202.9
3Q
4.15
16.6
5,037
0.0
20,905
21.4
4,546
21.7
1,776
1,419
507
1,858
-299
2,157
698
32.3
1,460
279
979
145.3
(INR Million)
FY18
3QE
Var (%)
3.88
7
9.0
5,001
1
-0.7
19,407
8
11.6
4,780
-5
24.6
1,550
1,900
750
2,080
-11
0
2,080
832
40.0
1,248
17
100
179
1,148
-15
221.7
Quarterly Performance (Consolidated)
Y/E March
Sales Dispatches (m ton)
YoY Change (%)
Realization (INR/ton)
QoQ Change (%)
Net Sales
YoY Change (%)
EBITDA
Margins (%)
Depreciation
Interest
Other Income
PBT before EO Expense
Extra-Ord expense
PBT after EO Expense
Tax
Rate (%)
Reported PAT (pre minority)
Minority + associate
PAT Adj for EO items
YoY Change (%)
8 February 2018
8

Indraprastha Gas
BSE SENSEX
34,083
Bloomberg
Equity Shares (m)
M.Cap.(INRb)/(USDb)
52-Week Range (INR)
1, 6, 12 Rel. Per (%)
Avg Val, INRm
Free float (%)
S&P CNX
10,477
IGL IN
EBITDA below estimate; strong volume growth continues
700
IGL reported EBITDA of INR2.6b (+3% YoY, -7% QoQ), below our estimate of
205.1 / 3.2
INR2.8b, led by higher gas cost. EBITDA/scm declined to INR5.4 (v/s our
344 / 194
estimate of INR6; INR6.0 in 3QFY17, INR5.9 in 2QFY18). PBT rose 17% YoY (-
-11/13/23
630.0
4% QoQ) to INR2.5b (est. of INR2.7b). Adj. PAT stood at INR1.66b (est. of
55.0
INR1.8b; +10% YoY, -2% QoQ); the differential at PAT level declined due to
7 February 2018
3QFY18 Results Update | Sector: Oil & Gas
CMP: INR293
TP: INR416(42%)
Buy
Financials & Valuations (INR b)
2018E 2019E
Y/E March
45.6
51.5
Net Sales
10.8
12.4
EBITDA
6.6
7.7
PAT
9.4
11.1
EPS (INR)
7.4
17.2
Gr. (%)
48.9
57.6
BV/Sh (INR)
20.8
20.8
RoE (%)
19.7
19.8
RoCE (%)
31.0
26.5
P/E (x)
6.0
5.1
P/BV (x)
2019E
57.7
13.8
8.8
12.5
13.2
66.6
20.2
19.3
23.4
Valuation view
4.4
Due to the strong focus on curbing pollution in the NCR, CNG sales volume is
higher other income of INR326m (est. of INR280m; +114% YoY, +30% QoQ)
and a lower tax rate of 33.6% v/s our estimate of 34% (35.3% in 2QFY18,
32.5% in 3QFY17).
Strong CNG/PNG volume growth continues:
CNG volumes grew 12% YoY (-
1% QoQ) to 3.89mmscmd, while PNG volumes increased 21% YoY (+5%
QoQ) to 1.37mmscmd. Total volumes grew 14% YoY (+1% QoQ) to
5.26mmscmd.
PAT for IGL’s subsidiaries (CUGL and MNGL) stood at INR340m (IGL’s share:
~50% at INR170m in 3QFY18).
Estimate change
TP change
Rating change
likely to grow strongly. The expected restriction on the usage of dirty fuel
would propel volume further for the company. We model FY19/20 volume
growth at 11%/12% and EBITDA/scm at INR5.9/5.8/scm.
We believe (a) IGL’s consistent operational outperformance, (b)
government’s thrust for the usage of gas and (c) sustainable high-growth
market warrant premium valuation. We value IGL at 30x average FY20E EPS
to arrive at a fair value of INR416, implying an upside of 42%. Maintain
Buy.
FY18
2Q
3Q
11,261 11,839
17.0
25.1
2,816
2,631
5.9
5.4
25.0
22.2
9.4
3.0
450
453
4
4
249.7
325.5
2,612
2,499
0
0
2,612
2,499
923
840
35.3
33.6
1,689
1,659
1,689
1,659
2.4
2.4
FY17
4QE
12,372
23.5
2,857
5.8
23.1
17.9
486
0
337.3
2,708
0
2,708
921
34.0
1,787
1,787
2.6
FY18E
(INR Million)
FY18 Variance
3QE vs Est
11,439
3.5%
20.8
2,874
-8.5%
6.0
-9.9%
25.1
12.5
465
-2.5%
0
280.0
16.3%
2,689
-7.0%
0
2,689
-7.0%
914
-8.1%
34.0
1,774
-6.5%
1,774
-6.5%
2.5
-6.5%
Quarterly performance
Y/E MARCH
Net Sales
Change (%)
EBITDA
EBITDA (Rs/scm)
% of Net Sales
% Change
Depreciation
Interest
Other Income
PBT before EO
EO
PBT after EO
Tax
Rate (%)
PAT
Adj. PAT
EPS (INR)
E: MOSL Estimates
1Q
8,970
-0.3
2,570
6.5
28.7
32.7
466
0
106.5
2,211
0
2,211
731
33.1
1,480
1,480
2.1
FY17
2Q
9,624
-0.3
2,575
6.1
26.8
37.0
483
0
251.4
2,344
-167
2,177
735
33.8
1,442
1,552
2.2
3Q
9,467
2.1
2,554
6.0
27.0
38.0
479
0
152.4
2,227
-83
2,144
696
32.5
1,448
1,504
2.1
4Q
10,019
13.1
2,422
5.6
24.2
36.2
244
12
208.8
2,375
-300
2,075
734
35.4
1,341
1,535
2.2
1Q
10,492
17.0
2,773
6.2
26.4
7.9
439
4
178.8
2,509
0
2,509
897
35.7
1,613
1,613
2.3
38,081 45,964
3.5
20.7
10,121 11,076
6.1
5.8
26.6
24.1
35.9
9.4
1,671
1,828
12
11
719.1 1,091.3
9,157 10,329
-550
0
8,607 10,329
2,896
3,581
33.7
34.7
5,711
6,748
6,076
6,748
8.7
9.6
8 February 2018
9

RESULTS
FLASH
1 February 2018
Results Flash | Sector: Engineering
Voltas
Neutral
BSE SENSEX
34,083
S&P CNX
10,477
CMP: INR600
TP: INR580(-3.0%)
Financials & Valuations (INR b)
2018E 2019E
Y/E Mar
Sales
66.8
75.8
EBITDA
7.1
7.9
NP
6.0
6.7
Adj EPS (INR)
18.0
20.2
EPS Gr. (%)
16.7
12.2
BV/Sh (INR)
113.3 128.2
RoE (%)
16.9
16.8
RoCE (%)
16.2
16.1
Payout (%)
26.2
26.2
Valuations
P/E (x)
33.3
29.6
P/BV (x)
5.3
4.7
EV/EBITDA (x)
27.0
23.9
Div. Yield (%)
0.7
0.8
Ahead of estimates driven by strong sales in UCP segment; project
segment margins at 7.1%
2020E
86.8
9.0
7.6
23.0
13.8
145.2
16.9
16.2
26.2
26.0
4.1
20.6
0.9
Sales came in at INR13.8b (+17% YoY) v/s our estimate of INR13.8b (consensus:
INR13.4b). UCP segment sales were up 32% YoY v/s our estimate of +15%,
while projects segment sales were up 7% YoY. As was seen with Hitachi (+45%
YoY growth in 3QFY18), Blue Star (+28% LTL growth) and Lloyd Electric
(+16% YoY), there would have been channel filling in 3QFY18 to clear the old
energy rated room aircon models before Jan’18.
Gross margin stood at 29.6% (-110bp YoY).
EBITDA stood at INR1.2b (+33% YoY), with the margin at 8.6% (+110bp YoY) v/s
our estimate of 7% (consensus: 7.6%), led by a better mix of the UCP segment
(40% of sales in 3QFY18 v/s 34% in 3QFY17). UCP segment margin stood at 13%
(+240bp YoY), while project segment margin expanded to 7.1% (+320bp YoY).
Note that Blue Star’s EBIT margin in the UCP segment expanded to 7.4% in
3QFY18 (+200bp QoQ, +420bp YoY)
Other income came in at INR170m v/s our estimate of INR450m.
PAT stood at INR1b (+23% YoY) v/s our estimate of INR0.9b (consensus:
INR1.09b).
Orders stood at INR5.6b (+24% YoY) with the order book at INR48.4b.
Valuation view:
The stock trades at 29x FY19E EPS and 26x FY20E EPS. We have a
Neutral
rating with a target price of INR580.
Quarterly Performance (Consolidated)
FY17
Y/E March
Sales
Change (%)
EBITDA
Change (%)
As of % Sales
Depreciation
Interest
Other Income
Extra-ordinary Items
PBT
Tax
Effective Tax Rate (%)
Reported PAT
Change (%)
Adj PAT
Change (%)
E: MOSL Estimates
1Q
18,500
18.7
1,995
52.0
10.8
66
48
357
-9
2,248
651
28.9
1,597
55.7
1,587
54.8
FY18
FY17
FY18
2Q
3Q
4Q
1Q
2Q
3QE
4QE
9,672 11,805 20,351 19,446 10,367 13,747 23,262 60,328 66,822
-7.0
-6.7
9.7
5.1
7.2
16.5
14.3
5.5
10.8
687
890 2,219 2,123
857 1,186 2,945 5,791 7,111
6.4
58.0
22.7
6.4
24.8
33.3
32.7
33.8
22.8
7.1
7.5
10.9
10.9
8.3
8.6
12.7
9.6
10.6
63
60
56
61
61
61
67
245
250
33
22
58
35
22
19
34
160
110
658
597
386
550
512
170
352 1,998 1,585
0
0
-2
-20
0
0
0
11
0
1,249 1,405 2,493 2,596 1,287 1,277 3,196 7,395 8,335
421
437
496
727
343
301 1,047 2,089 2,417
33.7
31.1
19.9
28.0
26.6
23.6
32.8
28.2
29.0
782
815 2,005 1,879
954 1,004 2,151 5,114 5,968
20.9
42.2
22.1
17.7
22.0
23.2
7.3
38.8
16.7
782
815 2,003 1,859
954 1,004 2,151 5,103 5,968
20.9
47.9
45.7
17.1
22.0
23.2
7.4
42.6
17.0
FY17
3QE
13,768
16.6
951
6.9
6.9
65
20
450
-
1,316
395
30.0
901
10.5
901
10.5
(INR M)
Var.
Vs Est
0%
25%
-3%
11%
11%
8 February 2018
10

7 February 2018
4QCY17 Results Update | Sector: Others
Castrol India
Buy
BSE SENSEX
34,083
Bloomberg
Equity Shares (m)
M.Cap.(INRb)/(USDb)
52-Week Range (INR)
1, 6, 12 Rel. Per (%)
Avg Val, INRm
Free float (%)
S&P CNX
10,477
CSTRL IN
495
195.1/2.9
227 / 172
-3/-8/-30
422.0
49.0
CMP: INR188
TP: INR242(+29%)
EBITDA beat led by higher volumes and realizations
CSTRL’s 4QCY17 revenue grew 25% YoY (and 13% QoQ) to INR9.7b, ahead of
our estimate of INR8.8b, led by (a) higher volumes at 54.4m liters (+16% YoY,
+11% QoQ; our estimate was 50.3m liters), and (b) better realizations at
INR178.4/liter (+8% YoY, +2% QoQ; our estimate was INR175.5/liter). For CY17,
revenue grew 6.7% to INR35.8b, led by volumes of 205m liters (+2.6%) and
realizations of INR175/liter (+4%).
Reported EBITDA of INR3.1b (+42% YoY, +21% QoQ) was significantly above our
estimate of INR2.4b, aided by lower than expected raw material cost of
INR80.7/liter (+4% YoY, +1% QoQ; our estimate was INR84.4/liter). EBITDA
margin expanded to 31.6% in 4QCY17 (29.4% in 3QCY17; 27.8% in 4QCY16). For
CY17, EBITDA was INR10.3b (+4%), with margin at 28.8% (v/s 29.6% in CY16).
PAT grew 26% YoY and 10% QoQ to INR1.96b against our estimate of INR1.5b.
For CY17, PAT grew 2.9% to INR6.9b, with margin at 19.3% (v/s 20% in CY16).
Volumes up 16% YoY:
CSTRL’s total volumes grew 16% YoY, led by double-digit
volume growth in the PCMO segment (~45% volume share) and CVO segment
(~40% volume share).
The management declared a final dividend of INR2.5/share for CY17; this is in
addition to an interim dividend of INR2.25/share. Total dividend for CY17 stood
at INR4.75/share v/s INR5.5/share for CY16.
CSTRL’s >80% payout policy, RoE/RoCE of ~70% and FCF to PAT conversion at
>80% reflect its superior balance sheet and high-quality cash flows, which
warrant higher valuation multiples, in our view.
The stock is trading at 27.2x CY19E EPS of INR6.9. Our fair value stands at
INR242 (35x CY19E EPS), implying 29% upside. Maintain
Buy.
CY16
2Q
3Q
56.6
45.7
171
167
9,679 7,617
5.2
-2.5
6,535 5,488
3,144 2,129
15.2
0.1
32.5
28.0
149
107
7
1
202
155
3,190 2,176
1,121
778
35
36
2,069 1,398
12.1
-2.4
21.4
18.4
CY17
2Q
3Q
50.9
49.1
171
175
8,704 8,614
-10.1
13.1
6,609 6,078
2,095 2,536
-33.4
19.1
24.1
29.4
118
111
1
2
155
333
2,131 2,756
752
974
35
35
1,379 1,782
-33.3
27.5
15.8
20.7
CY16
CY17
(INR Million)
CY17 Var (%)
4QE
50.3
8%
176
2%
8,823
10%
13.2
6,451
3%
2,372
29%
9.6
26.9
119
-14%
4
50%
146
12%
2,395
30%
866
33%
36
1,529
29%
-1.9
17.3
Financials & Valuations (INR b)
Dec
2017 2018E 2019E
Net Sales
35.8
36.6
37.3
EBITDA
10.3
9.8
9.5
PAT
6.9
6.5
6.8
EPS (INR)
7.0
6.6
6.9
Gr. (%)
2.9
-5.7
4.7
BV/Sh (INR)
10.3
11.0
11.7
RoE (%)
69.1
61.9
61.0
RoCE (%)
69.2
62.0
61.1
P/E (x)
26.9
28.5
27.2
P/BV (x)
18.2
17.1
16.1
Estimate change
TP change
Rating change
Valuation and view
Quarterly Performance
Y/E December
Volume (m litres)
Realization
Net Sales
YoY Change (%)
Total Expenditure
EBITDA
YoY Change (%)
Margins (%)
Depreciation
Interest
Other Income
PBT
Tax
Rate (%)
PAT
YoY Change (%)
Margins (%)
E: MOSL Estimates
1Q
50.2
170
8,521
7.1
6,005
2,516
34.3
29.5
86
4
223
2,649
925
35
1,724
48.4
20.2
4Q
47.0
166
7,791
-1.2
5,627
2,164
3.4
27.8
108
3
389
2,442
884
36
1,558
10.7
20.0
1Q
50.2
176
8,822
3.5
6,189
2,633
4.7
29.8
123
3
185
2,692
902
34
1,790
3.8
20.3
4Q
54.4
200
205
168
178
175
9,703 33,608 35,843
24.5
2.3
6.7
6,637 23,655 25,513
3,066 9,953 10,330
41.7
12.8
3.8
31.6
29.6
28.8
103
450
455
6
15
12
164
969
837
3,121 10,457 10,700
1,154 3,708 3,782
37
35
35
1,967 6,749 6,918
26.3
15.4
2.5
20.3
20.1
19.3
8 February 2018
11

7 February 2018
3QFY18 Results Update | Sector: Capital Goods
Thermax
Neutral
BSE SENSEX
34,083
Bloomberg
Equity Shares (m)
M.Cap.(INRb)/(USDb)
52-Week Range (INR)
1, 6, 12 Rel. Per (%)
Avg Val, INRm
Free float (%)
S&P CNX
10,477
TMX IN
Miss led by weak execution, pressure on margins
119.2
Operational results below expectations due to weak execution and
146.0 / 2.2
pressure on margins:
3QFY18
operating performance at the consolidated
1375 / 834
level was below expectations. Sales grew 18% YoY to INR11.2b (est. of
-4/29/17
68.0
INR12.1b), impacted by a weak performance in the environment (+3% YoY,
38.0
INR1.7b) and chemicals (7% YoY, INR0.9b) segments. Gross margin shrunk
CMP: INR980
TP: INR1,250(+6%)
Financials & Valuations (INR b)
Y/E Mar
2018 2019E
Net Sales
48.1
53.0
EBITDA
4.8
5.9
PAT
3.2
3.9
EPS (INR)
28.6
34.7
Gr. (%)
-7.4
21.4
BV/Sh (INR)
246.2
272.4
RoE (%)
12.1
13.4
RoCE (%)
12.4
13.3
P/E (x)
42.9
35.3
P/BV (x)
5.0
4.5
2020E
59.2
6.6
4.4
39.0
12.5
302.0
13.6
13.4
31.4
4.1
Estimate change
TP change
Rating change
Thermax Consolidated
Y/E March
Sales
Change (%)
EBITDA
Change (%)
As of % Sales
Depreciation
Interest
Other Income
PBT
Tax
Effective Tax Rate (%)
Reported PAT
Change (%)
Adj PAT
Change (%)
E: MOSL Estimates
1Q
9,791
-20.4
804
-21.2
8.2
194
32
231
809
277
34.3
532
(26.4)
490
(10.4)
590bp YoY to 47.4% due to adverse raw material price movement and
execution of lower-margin orders. Despite a 590bp contraction in the gross
margin, the operating margin shrunk by only 80bp YoY to 8.5% (est. of 9.0%)
due to lower other expenses (-320bp YoY to 23.5%). EBIDTA grew 9% YoY to
INR0.96b. Adj. net profit rose 9% YoY to INR0.6b (est. of INR0.78b).
Weak performance at subsidiaries:
Subsidiaries’ revenue declined 14% YoY
to INR1.4b and EBIDTA fell 55% YoY to INR30m. Subsidiaries recorded a loss
of INR46m, mainly due to a loss at Danstoker and Chinese subsidiary
Zheijang. At the standalone level, TMX’s revenue stood at INR9.8b (+25%
YoY), led by a pick-up in execution of orders in hand. EBIDTA stood at
INR924m (+14.6% YoY), with the margin at 9.4% (-90bp YoY). Adj. PAT grew
11.5% YoY to INR632m.
Valuation view:
We maintain
Neutral
with a revised TP of INR1,250 (32x
FY20E EPS of INR39), given the improving domestic end-market outlook.
(INR Million)
FY17
2Q
3Q
10,703
9,440
-15.4
-22.6
919
-16.8
8.6
199
24
361
1,057
350
33.1
708
(4.8)
783
32.4
875
3.6
9.3
197
17
252
913
335
36.7
578
(5.5)
536
(1.2)
4Q
14,905
-0.2
1,732
30.9
11.6
229
25
297
1,775
598
33.7
1,177
1.9
615
(46.2)
1Q
8,718
-11.0
721
-10.3
8.3
189
16
241
757
284
37.5
473
(11.1)
406
(17.0)
FY18
2Q
3Q
10,331 11,170
-3.5
18.3
952
3.6
9.2
189
51
236
947
370
39.0
578
(18.3)
568
(27.4)
955
9.1
8.5
208
25
238
961
378
39.3
583
0.9
586
9.3
FY17E
4Q
17,843
19.7
2,153
24.3
12.1
194
8
361
2,312
661
28.6
1,651
40.3
1,655
169.1
44,831
-18.5
4,740
5.8
10.6
819
97
1,141
4,964
1,560
31.4
2,640
(6.0)
3,473
23.0
FY18E
48,124
4,781
0.9
9.9
779
100
1,076
4,977
1,692
34.0
3,215
21.8
3,215
(7.4)
MOSL
3Q Est
12,050
23.9
1,090
24.6
9.0
190
17
280
1,163
380
32.7
783
35.4
778
42.0
Var.
Vs Est
-7.3%
-12.4%
-17.4%
-25.5%
-24.7%
8 February 2018
12

Hexaware Technologies
BSE SENSEX
34,083
Bloomberg
Equity Shares (m)
M.Cap.(INRb)/(USDb)
52-Week Range (INR)
1, 6, 12 Rel. Per (%)
Avg Val, INRm
Free float (%)
S&P CNX
10,477
HEXW IN
Double-digit growth despite client issues; exhibits strong underlying
297
momentum
105.5 / 1.6
Strong underlying momentum:
Revenue growth of 1.4% QoQ was ahead of
395 / 196
our estimate of -1%, which had baked in ramp-down of one of its top
0/32/60
customers. Growth of 12.4% YoY, despite these headwinds, is a testimony to
341.0
the underlying strength in the business – fuelled by the same bits: Europe
28.8
7 February 2018
Q4CY17 Results Update | Sector: Technology
CMP: INR355
TP: INR340(-4%)
Neutral
Financials & Valuations (INR b)
2017 2018E
Y/E Dec
39.4
44.6
Net Sales
6.6
7.3
EBITDA
5.0
5.5
PAT
16.6
18.4
EPS (INR)
21.2
10.9
Gr. (%)
66.0
76.0
BV/Sh (INR)
26.9
25.8
RoE (%)
24.6
25.0
RoCE (%)
21.4
19.3
P/E (x)
5.4
4.7
P/BV (x)
Estimate change
TP change
Rating change
and APAC among geographies, and ADM, BPS and IMS among services.
Conservative guidance:
Despite the residual impact of ramp-downs (spread
equally over CY17 and CY18), HEXW guided for 10-12% revenue growth for
2019E
CY18 – compared to 15.7% delivered in CY17. This implies a CQGR of 3% in
50.8
CY18, the same that was delivered in the previous year, despite a neat
8.3
6.3
uptick in deal wins from new customers at USD72m, breaking the average of
20.9
~USD40m per quarter and taking the total for the year to USD180m (+19%
13.4
YoY). Comments around the guidance indicated conservatism – to avoid a
87.2
downward revision in the future. We are baking in 12.5% revenue growth, a
25.6
notch higher than indicated.
25.2
Margins to remain steady:
Pressure from customer ramp-downs, wage
17.0
hikes and transition costs in new deals resulted in a 160bp contraction in
4.1
EBITDA margin, a miss of 60bp. PAT at INR1.2b was above expectations by
5%, led by the strong beat on revenue growth. HEXW guided for margin
stability, led by the offsetting of headwinds (currency, wage hikes and
transition costs) by continued momentum in revenue growth, operating
leverage and pyramid rationalization.
Valuation view:
We have upgraded our revenue/EPS estimates by 4/13% for
both CY18/19 to account for the beat in 4Q. ~4% upgrade in PAT is also
because of lower ETR expectations. HEXW trades at 19.3/17.0x CY18/19E
earnings. Our target price of INR340 discounts forward earnings by 16x (v/s
14x earlier), driven by continued outperformance despite top client
headwinds and an increased payout (40% payout ratio, 2.3% yield).
However, with multiples at a 15/25% premium to larger/mid-cap peers, we
do not see potential for further re-rating.
Neutral.
-0.5%
CY16
CY17
CY16
CY17
Quarterly Perform ance (Indian GAAP)
Y/E Dec
Revenue (USD m)
QoQ (%)
Revenue (INR m)
YoY (%)
GPM (%)
SGA (%)
EBITDA
EBITDA Margin (%)
EBIT Ma rgi n (%)
Other i ncome
ETR (%)
PAT
QoQ (%)
YoY (%)
EPS (INR)
Headcount
Uti l i za ti on (%)
Attri ti on (%)
Offs hore rev. (%)
E: MOSL Es ti ma tes
1Q
121.7
-1.9
8,202
15.0
33.6
19.0
1,194
14.6
12.9
55
24.2
842
-15.3
1.0
2.8
11,599
69.6
16.0
36.9
2Q
129.7
6.6
8,697
12.6
34.6
19.0
1,353
15.6
14.0
132
25.8
999
18.6
1.0
3.3
11,875
70.0
16.6
38.6
3Q
135.2
4.2
9,041
10.5
35.4
18.0
1,576
17.4
15.9
67
25.8
1,114
11.5
-0.1
3.7
11,859
74.1
16.5
36.8
4Q
138.9
2.7
9,409
14.8
34.6
17.3
1,624
17.3
15.8
140
25.1
1,216
9.2
22.3
4.0
12,115
78.6
16.1
38.1
1Q
144.7
4.2
9,605
17.1
34.1
17.2
1,623
16.9
15.3
28
23.8
1,139
-6.3
35.3
3.8
12,734
78.9
14.9
35.5
2Q
152.6
5.5
9,836
13.1
33.7
17.4
1,598
16.2
14.6
146
22.9
1,224
7.4
22.5
4.1
13,098
80.8
13.8
35.3
3Q
154.0
0.9
9,931
9.8
35.2
17.7
1,734
17.5
15.8
178
18.9
1,420
16.0
27.5
4.7
13,488
79.7
13.7
34.6
4Q
156.1
1.4
10,048
6.8
32.8
16.9
1,599
15.9
14.3
132
23.0
1,211
-14.7
-0.4
4.0
13,705
80.9
13.1
34.9
525
8.2
35,349
13.2
34.6
18.3
5,747
16.3
14.7
394
25.3
4,171
6.1
13.7
12,115
73.9
37.6
607
15.7
39,420
11.5
33.9
17.3
6,554
16.6
15.0
484
22.0
4,994
19.7
16.6
13,705
81.4
35.1
(INR Million)
Est. Var. (% /
bp)
4QCY17
152.5
2.4
-1.0
237bp
9,879
1.7
5.0
180bp
-48bp
33.3
11bp
16.8
1,631 -3152bp
16.5
-59bp
14.9
-57bp
42
215.1
24.0
5.3
1,151
-19.0
426bp
-5.4
498bp
3.8
13,409
2.2
79.0
190bp
34.3
58bp
8 February 2018
13

7 February 2018
3QFY18 Results Update | Sector: Textiles
SRF
Buy
BSE SENSEX
34,083
Bloomberg
Equity Shares (m)
M.Cap.(INRb)/(USDb)
52-Week Range (INR)
1, 6, 12 Rel. Per (%)
Avg Val, INRm
Free float (%)
S&P CNX
10,477
SRF IN
Above-estimate; New refrigerants, healing agchem to stabilize growth
57
Above estimates:
SRF’s revenue grew 23.3% YoY to INR13.97b (est. of
101.3 / 1.7
INR13.26b) in 3QFY18. Chemicals segment grew by 18.5% YoY, Packaging
2045 / 1420
rose by 28.3% YoY, and Technical textile grew by 5.3% YoY. EBITDA margin
-9/12/-19
374.0
contracted 230bp YoY to 18.1% (est. of 17.8%) in 3QFY18 due to higher-
47.6
than-expected raw material cost (52.6% of net sales v/s est. of 48.0%).
CMP: INR1,777
TP: INR2040 (+15%)
Financials & Valuations (INR b)
2018E 2019E
Y/E Mar
Sales
54.0
64.0
EBITDA
9.4
11.8
NP
4.8
6.0
EPS (INR)
82.9
103.0
EPS Gr. (%)
-3.5
24.2
BV/Sh. (INR)
607.5
687.3
RoE (%)
14.1
15.9
RoCE (%)
15.7
20.3
P/E (x)
23.2
18.7
P/BV (x)
3.2
2.8
2020E
73.5
14.3
8.0
136.0
32.1
800.1
18.3
24.7
14.1
2.4
Estimate change
TP change
Rating change
EBITDA rose by 9.3% YoY to INR2,527m (est. of INR2,360m) and adj. PAT
grew by 17.2% YoY to INR1,312m (est. of INR1,030m). PBIT margin came in
at 14.9% for Technical textile v/s 13.4% in 3QFY17; 16.6% for Chemical v/s
16.3% in 3QFY17; and 12.1% for Packaging v/s 14.2% in 3QFY17.
Chemicals segment to see strong growth:
SRF is expected to end FY18 with
90-95% utilization in R22 and R134a, and thus, has decided to incur capex of
INR3.6b, which includes acquisition cost for HFC125 assets and for technical
know-how from a global HFC player, gaining the unique advantage of
manufacturing all three major HFCs: HFC134a, 32 and 125. Capacity
expansion would double its existing capacities, driving growth. The company
expects better growth in specialty chemicals to continue in FY19, which
should help improve utilization rates and margins. Within BOPET films, the
company expects pricing to remain firm, which should ensure healthy
margins, as bulk of the supply over the last one year gets absorbed by
growth in demand.
Valuation and view:
SRF has started to see green shoots in the chemicals
business, which should drive growth and margins in FY19. While we upgrade
our FY18 EPS by 8% to factor in higher revenue growth, we largely keep our
FY19 and FY20 numbers unchanged. We value the stock at 15x FY20E EPS
and maintain
Buy
with a target price of INR2,040.
8 February 2018
14

RESULTS
FLASH
7 February 2018
Results Flash | Sector: Engineering
GE T&D
Neutral
BSE SENSEX
34,083
S&P CNX
10,477
CMP: INR387
TP: INR440(+14%)
Conference Call Details
Date:
9 Feb 2018
Time:
16:00 hrs
Dial-in
details:
022
39600603
th
Financials & Valuations (INR b)
2018E 2019E 2020E
Y/E Mar
Sales
46.5
50.1
54.6
EBITDA
4.2
4.8
5.6
NP
2.4
2.9
3.6
Adj. EPS (INR)
9.4
11.2
14.0
EPS Gr. (%)
64.4
19.4
24.5
Valuation view:
The stock trades at 38x FY19E EPS and 30x FY20E EPS. We have a
BV/Sh (INR)
46.2
53.2
61.9
Neutral
rating with a target price of INR440.
RoE (%)
21.8
22.6
24.3
RoCE (%)
26.3
28.6
32.0
Payout (%)
31.4
31.4
31.4
Valuations
P/E (x)
45.2
37.9
30.4
P/BV (x)
9.2
8.0
6.9
EV/EBITDA (x)
25.9
22.2
18.3
Div. Yield (%)
0.7
0.8
1.0
Quarterly Performance
Y/E March
Sales
Change (%)
EBITDA
Change (%)
As of % Sales
Depreciation
Interest
Other Income
PBT
Tax
Effective Tax Rate (%)
Reported PAT
Change (%)
Adj PAT
Change (%)
1Q
8,546
11.6
21
-70.3
0.2
217
226
326
-2,425
-455
18.8
-1,970
-2,041.0
360
254.6
FY17
2Q
3Q
8,350 11,652
-4.3
63.2
349
751
-48.7 -241.2
4.2
6.4
220
221
240
343
425
493
314
679
109
236
34.7
34.7
205
443
-43.2 -215.4
205
443
-43.2 -215.4
4Q
1Q
11,963 12,093
26.9
41.5
1,097
1,055
81.7 4,875.9
9.2
8.7
224
224
344
278
177
421
705
974
244
358
34.6
36.8
461
616
70.9 -131.3
461
616
70.9
71.1
FY18
2Q
3Q
8,700 14,386
4.2
23.5
805
728
130.6
-3.0
9.3
5.1
228
218
225
238
344
630
695
1,099
220
381
31.6
34.7
475
718
131.6
62.0
475
521
131.6
17.6
FY17
4Q
11,355
-5.1
1,576
43.6
13.9
172
184
-138
1,083
283
26.2
800
73.4
800
73.4
40,521
22.7
2,230
-9.0
5.5
873
589
427
1,195
508
42.5
687
0.0
687
2.0
FY18
46,532
14.8
4,164
-9.0
8.9
873
589
427
3,129
508
16.2
2,621
0.0
2,621
2.0
Miss at the operating level despite strong execution during the quarter
Sales stood at INR14.4b (+24% YoY) v/s our estimate of INR12.7b (consensus:
INR12.8b).
Gross margin stood at 26% (-150bp YoY) v/s our estimate of 28.3%.
Adj. EBITDA stood at INR728m (-3% YoY), with the margin at 5.1% v/s our
estimate of 8% (consensus EBITDA at INR1.08b and margins at 8%). A provision
of INR224m was made for bad debt.
Adj. other income came in at INR630m v/s our estimate of INR 250m. Reported
other income includes INR60.7m on slump sale of Global Finance Shared
business to GE India and INR360m for tax reversal provision.
Adj. PAT stood at INR521m (+18% YoY) v/s our estimate of INR534m
(consensus: INR573m).
(INR Million)
MOSL
Var.
3Q Vs Est
12,700
13
9.3
1,012
-28
40
8.0
228
220
250
814
35
280
34.4
534
34
20.5
534
-2
20.5
8 February 2018
15

RESULTS
FLASH
Solar Industries
BSE SENSEX
34,083
S&P CNX
10,477
7 February 2018
Results Flash | Sector: Engineering
CMP: INR1,045
TP: INR1,160(+11%)
Neutral
Financials & Valuations (INR b)
2018E 2019E
Y/E Mar
Sales
20.3
23.7
EBITDA
4.4
5.2
NP
1.6
1.9
Adj. EPS (INR)
26.2
31.3
EPS Gr. (%)
27.3
19.5
BV/Sh (INR)
133.3 158.4
RoE (%)
21.4
21.5
RoCE (%)
23.9
25.5
Payout (%)
16.6
16.6
Valuations
P/E (x)
44.1
36.9
P/BV (x)
8.7
7.3
EV/EBITDA (x)
24.6
20.8
Div. Yield (%)
0.3
0.4
Result miss led by weaker-than-estimated domestic performance
2020E
30.6
6.2
2.5
39.3
25.4
189.9
22.6
28.3
16.6
29.5
6.1
17.1
0.4
Sales stood at INR4.7b (+7.5% YoY) v/s our estimate of INR5.9b, led by lower-
than-estimated domestic sales (+3% YoY).
EBITDA stood at INR1.0b (30% YoY), below our estimate of INR1.3b, led by
negative operating leverage.
EBIDTA margin stood at 22.4% (+50bp YoY) v/s our estimate of 22.5%.
Adj. PAT stood at INR577m (+16% YoY) v/s our estimate of INR733m.
Valuation view:
The stock trades at 37x FY19E EPS and 30x FY20E EPS. We have a
Neutral
rating with a target price of INR1,160.
Quarterly Performance (Consolidated)
Y/E March
Sales
Change (%)
EBITDA
Change (%)
As of % Sales
Depreciation
Interest
Other Income
PBT
Tax
Effective Tax Rate (%)
Reported PAT
Change (%)
Adj PAT
Change (%)
E: MOSL Estimates
1Q
4,030
4.8
868
20.7
21.5
94
68
32
738
237
32.1
501
9.6
471
13.9
FY17
2Q
3Q
3,174
4,331
-4.3
12.6
696
799
0.2
4.4
21.9
18.4
98
95
73
68
0
16
525
653
133
157
25.4
24.1
391
495
-5.2
12.1
391
495
6.1
20.3
4Q
4,338
5.5
836
-2.7
19.3
101
63
44
716
240
33.5
477
4.4
477
10.0
1Q
4,691
16.4
1,035
19.2
22.1
125
50
0
860
261
30.4
599
19.5
548
16.3
FY18
2QE
3QE
4,117
4,657
29.7
7.5
905
1,043
30.0
30.6
22.0
22.4
128
137
79
106
0
26
699
826
216
249
30.9
30.2
483
577
23.3
16.4
483
577
23.3
16.4
FY17
4QE
5,919
36.5
566
-32.2
9.6
231
55
54
335
343
102.6
-9
-101.8
-9
-101.8
15,800
9.1
3,239
6.5
20.5
387
269
132
2,715
767
28.3
1,947
3.6
1,947
FY18
20,255
28.2
4,420
36.5
21.8
621
289
80
3,589
1,070
29.8
2,520
4.5
1,598
FY18
3QE
5,563
28.4
1,253
56.8
22.5
155
70
20
1,047
314
30.0
733
48.0
733
48.0
(INR m)
Var.
Vs Est
(16.3)
(16.7)
(21.2)
(21.4)
(21.4)
8 February 2018
16

7 February 2018
3QFY18 Results Update | Sector: Media
Dish TV India
Buy
BSE SENSEX
34,083
Bloomberg
Equity Shares (m)
M.Cap.(INRb)/(USDb)
52-Week Range (INR)
1, 6, 12 Rel. Per (%)
Avg Val, INRm
Free float (%)
S&P CNX
10,477
DITV IN
1,066
79.9 / 1.2
111 / 68
-11/-3/-34
488.0
35.6
CMP: INR75
TP: INR101(+34%)
ARPU decline, higher operating cost drag down EBITDA; all eyes on
merger synergies
Double whammy to margins:
Subscription revenue fell 1.7% QoQ (flat YoY) to
INR6.9b, primarily due to a decline in APRU, partly offset by a rise in net subs
adds. Consol. revenue fell 1% QoQ/YoY to INR7.4b (7.5% miss). This, coupled with
a significant 23% QoQ rise in SGA expenses, led to a 7.2% QoQ (-15.6% YoY)
decline in EBITDA to INR2b (23% miss). EBITDA margin shrunk 180bp QoQ (-
470bp YoY) to 27.1% (560bp miss). However, other income and interest cost
savings provided support, with net loss down to INR8m from INR162m in 2QFY18.
ARPU decline – a negative surprise:
ARPU dropped again (-3.4% QoQ to
INR144), after showing reversal over the last two quarters (INR149 in 2QFY18),
due to increased competitive intensity (leading to higher discounts). However,
an increase in net subscriber additions by 250k (+33% QoQ, 188k in 2QFY18) to
16.1m reduced the overall impact. Monthly churn remained steady at ~0.8%.
Key concall highlights:
1) Merger with Videocon D2H is expected to conclude by
end of Feb’18; maintain merger synergies of INR5.1b/INR7.6b for FY19/20, of
which 50% are expected to be derived from content and the rest from set-top
box, backend and interest cost. 2) Net debt of the merged entity at INR21.6b.
Additional combined license fee liability, which is under litigation, stands at
INR15.3b. 3) ARPU has seen pressure, with absorption of premium HD
subscription (~23% of subscribers) offset by downtrading of SD subscribers.
Maintain Buy with a revised TP of INR101:
We believe merger synergies,
coupled with monetization of Phase III/IV markets, increasing share of HD
subscribers and relaxation of custom duty to 10% (20% earlier) on STB, bode
well. However, given fierce competition in the industry, we believe APRUs will
remain under pressure. We thus cut revenue/EBITDA by 1-5% for FY19/20E. We
expect revenue/EBITDA CAGR of 12/29% over FY18-20 for the merged entity.
We remain positive on DITV with a TP of INR101 (8x FY19E combined EBITDA of
INR25.9b, including merger synergies of INR2.4b).
FY18
4Q
7,086
-11.4
5,180
1,906
26.9
1,728
573
104
-291
-7
2.4
0.0
-284
-284
-105.9
-4.0
1Q
7,389
-5.1
5,377
2,012
27.2
1,822
590
98
-302
-162
53.8
(22.7)
-117
-117
-128.2
-1.6
2Q
7,486
-3.9
5,325
2,161
28.9
1,899
611
77
-272
-93
34.3
(17.1)
-162
-162
-123.0
-2.2
3Q
7,408
-1.0
5,403
2,005
27.1
1,847
502
158
-186
-150
80.7
(28.3)
-8
-8
-107.2
-0.1
4QE
7,678
8.4
5,424
2,254
29.4
1,864
584
112
-81
178
(219.1)
0.0
-260
-260
-8.6
-3.4
FY17
30,144
-1.5
20,415
9,729
32.3
6,631
2,239
475
1,334
241
18.1
0.0
1,093
1,093
-84.2
3.6
FY18E
29,961
-0.6
21,529
8,432
28.1
7,432
2,286
445
-840
-227
27.0
(68.1)
-545
-545
-149.9
-1.8
3Q
7,480
-3.0
5,104
2,376
31.8
1,718
613
153
198
114
57.6
(20.2)
104
104
-84.8
1.4
3Q
FY18E
8,008
7.1
5,396
2,612
32.6
1,870
375
76
443
151
34.0
0.0
292
292
9.7
3.7
Est.
Var %
-8
0
-23
-555
-1
34
109
-142
Financials & Valuations (INR b)
2018E 2019E
Y/E Mar
Net Sales
30.0
34.2
EBITDA
8.4
11.2
PAT
-0.5
1.7
EPS (INR)
-0.5
1.6
Gr. (%)
-149.9 -413.2
BV/Sh (INR)
4.0
5.6
RoE (%)
-11.9
33.2
RoCE (%)
6.6
15.8
P/E (x)
-147.1
46.9
P/BV (x)
18.7
13.4
EV/EBITDA (x)
10.8
7.8
2020E
38.2
13.6
3.6
3.4
109.9
9.0
46.0
23.4
22.4
8.4
5.9
Estimate change
TP change
Rating change
Consolidated Quarterly Performance (INR m)
Y/E March
Net Sales
YoY Change (%)
Total Expenditure
EBITDA
EBITDA margin (%)
Depreciation
Interest
Other Income
PBT
Tax
Rate (%)
MI & P/L of Asso. Cos.
Reported PAT
Adjusted PAT
YoY Change (%)
PAT margin (%)
1Q
7,786
5.7
5,139
2,647
34.0
1,649
526
115
587
189
32.2
(15.3)
414
414
-22.1
5.3
2Q
7,793
3.6
5,136
2,657
34.1
1,683
574
174
574
-116
(20.3)
(13.7)
704
704
-19.1
9.0
FY17
-103
-103
-375
8 February 2018
17

IRB Infrastructure
BSE SENSEX
34,083
Bloomberg
Equity Shares (m)
M.Cap.(INRb)/(USDb)
52-Week Range (INR)
1, 6, 12 Rel. Per (%)
Avg Val, INRm
Free float (%)
S&P CNX
10,477
IRB IN
Operational results below expectations led by weak EPC performance
351.5
Operating performance marginally below expectations:
IRB’s revenue
82.9 / 1.3
declined 8% YoY to INR11.2b, below our estimate of INR13.7b, due to
272 / 194
weaker-than-estimated EPC revenue. Operating profit stood at INR6.7b (-
-10/1/-26
9.0% YoY), below our estimate of INR7.1b. Operating margin shrunk 70bp
573.0
42.6
YoY to 52% due to an adverse revenue mix (higher contribution from the
7 February 2018
3QFY18 Results Update | Sector: Infrastructure
CMP:INR220
TP:INR250 (+14)
Neutral
Financials & Valuations (INR b)
FY18E FY19E
Y/E March
Net Sales
58.8
64.1
EBITDA
29.0
31.6
NP
8.9
8.6
EPS (INR)
25.4
24.6
EPS Gr. (%)
24.8
-3.0
BV/Sh. (INR)
173.5
193.3
RoE (%)
15.5
13.4
RoCE (%)
9.6
11.2
Payout (%)
18.9
19.5
Div. Yield
1.7
1.7
Estimate change
TP change
Rating change
Quarterly Performance
Y/E March
Net Sales
YoY Change (%)
Total Expenditure
EBITDA
Margins (%)
Depreciation
Interest
Other Income
PBT before EO expense
Extra-Ord expense
PBT
Tax
Rate (%)
Min Int & P/Lof Asso. Cos.
Reported PAT
Adj PAT
YoY Change (%)
Margins (%)
E: MOSL Estimates
1Q
15,173
36.8
7,434
7,740
51.0
2,207
3,282
308
2,558
0
2,558
740
28.9
0
1,818
1,818
10.4
12.0
low-margin construction business). Adj. profit of INR2.5b was meaningfully
above our estimate of INR1.6b, led by lower-than-estimated interest cost
FY20E
and higher-than-estimated other income.
62.8
BoT revenue registers strong growth:
Toll revenue from continuing projects
29.9
grew 24% QoQ to INR4.6b, supported by strong traffic growth across
7.5
projects. Toll revenue for the key Mumbai-Pune project grew 9% YoY and for
21.3
the Ahmedabad-Vadodara project rose 16% YoY. Chittorgarh-Gulabpura also
-13.6
212.2
started contributing to revenue from this quarter.
10.5
Muted EPC revenue growth:
EPC revenue grew at a muted 3% YoY to
10.0
INR8.5b. EPC EBIT margin improved 160bp YoY to 29% on account of lower
9.4
contribution from the utility shifting segment, where margins are weak. IRB
0.8
has six projects under construction, of which Solapur-Yedeshi has been
almost completed and should commence commercial operations from
4QFY18. Order book stands robust at INR74b; IRB incrementally expects
order inflow from the upcoming finalization of the HAM and ToT projects.
Valuation view:
We raise our estimate for FY18/19/20E by 11/6/8% to
factor in lower-than-estimated interest cost. We maintain
Neutral
on the
stock with a target price of INR250, valuing the EPC business at INR123 (8x
FY20 EPS), BoT at INR104 and INR25 for its stake in InvIT.
(INR m)
Var
-6
FY17
2Q
3Q
12,906 14,109
12.3
5.8
5,816
6,674
7,090
7,435
54.9
52.7
2,274
1,803
3,396
3,389
336
298
1,757
2,541
0
0
1,757
2,541
335
699
19.1
27.5
0
0
1,422
1,842
1,422
1,842
-4.6
8.6
11.0
13.1
4QE
16,271
5.9
8,053
8,218
50.5
2,264
3,260
289
2,983
0
2,983
911
30.5
0
2,072
2,072
37.1
12.7
1Q
18,169
19.7
9,991
8,178
45.0
1,816
2,854
535
4,044
0
4,044
1,665
41.2
0
2,379
2,379
30.8
13.1
FY18
2Q
3Q
11,227 12,962
-13.0
-8.1
5,503
6,222
5,724
6,740
51.0
52.0
1,260
1,212
2,356
2,366
424
455
2,532
3,616
1,041
0
3,573
3,616
1,225
1,100
34.3
30.4
2
2
2,346
2,514
1,503
2,514
5.7
36.5
13.4
19.4
FY17E
4QE
16,416
0.9
8,078
8,338
50.8
1,418
3,588
376
3,707
0
3,707
987
26.6
2
2,718
2,718
31.2
16.6
58,459
14.0
27,976
30,483
52.1
8,548
13,327
1,232
9,839
0
9,839
2,685
27.3
8
7,146
7,146
11.8
12.2
FY18E
58,774
0.5
29,793
28,981
49.3
5,706
11,165
1,790
13,899
0
13,899
4,977
35.8
6
8,916
8,916
24.8
15.2
Mosl
3QFY18
13,743
-2.6
6,597
7,146
52.0
1,050
3,700
300
2,696
0
2,696
1,100
40.8
2
1,594
1,594
-13.4
11.6
-6
34
34
58
58
8 February 2018
18

RESULTS
FLASH
7 February 2018
Results Flash | Sector: Healthcare
IPCA Labs
Neutral
BSE SENSEX
33,147
S&P CNX
10,344
CMP: INR574
TP: INR550(-4%)
Strong recovery in margins; numbers above estimate
Financials & Valuations (INR b)
2017 2018E
Y/E Mar
32.1
32.3
Net Sales
4.4
4.4
EBITDA
2.0
2.2
NP
16.1
17.8
EPS (INR)
52.8
10.9
EPS Gr. (%)
194.6 209.7
BV/Sh. (INR)
8.6
8.8
RoE (%)
7.5
7.9
RoCE (%)
35.7
32.2
P/E (x)
3.0
2.7
P/BV (x)
2019E
36.4
6.0
3.3
26.2
47.0
232.0
11.9
10.4
21.9
2.5
IPCA’s 3QFY18 revenues grew by 16% YoY to INR8.6b (v/s est. of INR8.3b),
primarily led by robust growth in the formulation segment by ~15% YoY.
Domestic formulation increased by 14% YoY to INR3.8b, while international
business increased by ~17% YoY to INR2.7b. API business grew by 18% YoY to
INR1.9b
Gross Margin for the company stood at 65.8% (v/s 65.9% in 2Q FY18 & 66.8% in
3Q FY17).
EBITDA grew by 46% YoY to INR1.6b, mainly led by strong improvement in
margin by ~380bp YoY to 18.8% (17.2% in 2QFY18).
PAT during the quarter more than doubled to INR1.1b v/s INR414m in 3QFY17
on back of operational efficiency and lower tax rate at 14% v/s 32.9% in
3QFY17
Valuation and view:
We have a Neutral rating on IPCA
8 February 2018
19

7 February 2018
Q3FY18 Results Update | Sector: Others
Blue Star
Neutral
BSE SENSEX
34,083
Bloomberg
Equity Shares (m)
M.Cap.(INRb)/(USDb)
52-Week Range (INR)
1, 6, 12 Rel. Per (%)
Avg Val, INRm
Free float (%)
Financials & Valuations (INR b)
2018E 2019E
Y/E Mar
47.8
57.5
Net Sales
2.9
3.9
EBITDA
1.6
2.3
PAT
16.6
24.6
EPS (INR)
36.0
48.2
Gr. (%)
83.6
90.0
BV/Sh (INR)
20.4
28.3
RoE (%)
18.5
26.5
RoCE (%)
44.7
30.2
P/E (x)
8.9
8.2
P/BV (x)
S&P CNX
10,477
BLSTR IN
Results above estimates on strong UCP performance
96
3QFY18 results beat estimates at operating level.
Sales grew 7% YoY to
59.0/ 0.9
INR9.8b, in line with our estimate of INR9.97b. EBITDA grew 39% YoY to
845 / 540
INR540m, ahead of our estimate of INR460m, driven by strong growth in the
-10/3/15
77.0
UCP segment (28% LTL growth). Adjusted net profit increased 30% YoY to
61.1
INR188m, below our estimate of INR200m, on losses in JVs (INR21m) and
CMP: INR732
TP: INR780(+5%)
2020E
65.4
4.7
3.0
31.2
26.9
98.2
33.1
32.1
23.8
7.6
Estimate change
TP change
Rating change
lower other income.
UCP
segment reported LTL revenue growth of 28% YoY (15% YoY on
reported basis) to INR3.7b, higher than our estimate of INR3.2b. Room air
conditioner segment sales grew 25% YoY on channel restocking prior to the
implementation of the new energy rating norms effective January 2018. EBIT
margin expanded 420bp YoY to 7.4%, driven by higher volumes, price hikes
taken to offset higher RM cost, and higher realizations. The management
has guided 9-9.5% margin, excluding the 100-120bp impact from water
purifiers.
EMP segment reported revenue of INR5.8b (up 8% YoY on a LTL basis).
Overall market demand remains muted, with government spending on
infrastructure the key driver – private capex remains weak. EBIT margin
expanded 140bp YoY to 6.3% on higher volumes and execution of higher-
margin projects. FY18 guidance stands at 4.5-5% of sales.
Valuation and view
We maintain
Neutral,
with a revised SOTP-based price target of INR780 (UCP
business at 30x FY20E EPS, MEP at 15x, and professional electronics at 15x). We
marginally tweak our estimates to factor in higher margins in the UCP segment
in 3QFY18.
FY17
FY18
2Q
8,390
-5.8
492
16.6
5.9
158
59
12
288
84
29.3
204
5.5
208
4.0
3Q
4QE
9,835 14,977
6.6
8.9
535 1,054
38.8
39.4
5.4
7.0
172
113
74
96
14
153
303
998
93
300
30.7
30.1
210
48.3
188
29.7
698
83.3
702
89.0
FY17
FY18E
(INR m)
FY18
Var.
3QE Vs Est
9,960
-1
8.5
460
16
31.1
4.6
170
60
50
280
8
85
30.4
195
37.5
200
36.3
8
Quarterly perf. (Consolidated)
Y/E March
Sales
Change (%)
EBITDA
Change (%)
As of % Sales
Depreciation
Interest
Other Income
PBT
Tax
Effective Tax Rate (%)
Rep. PAT (before MI and share of
associates)
Change (%)
Adj PAT
Change (%)
1Q
12,117
18.8
791
5.1
6.5
135
92
85
649
145
22.3
504
35.7
514
38.3
2Q
8,911
6.2
422
-4.6
4.7
150
88
81
266
73
27.6
193
-1.3
200
-4.6
3Q
4Q
1QE
9,224 13,756 14,611
17.1
17.8
20.6
386
756
903
9.5
25.6
14.1
4.2
5.5
6.2
155
166
125
85
114
48
11
37
37
157
514
766
15
133
183
9.7
25.9
23.9
142
-10.6
145
-7.0
381
-2.5
372
-6.5
583
15.7
585
13.8
44,008 47,812
15.4
8.6
2,355 2,987
2.0
26.9
5.4
6.2
606
568
378
276
215
215
1,586 2,358
367
660
23.1
28.0
1,231
5.5
1,231
5.5
1,686
37.0
1,686
37.0
8 February 2018
20

December 2017 Results Preview | Sector: Capital Goods
ABB
Bloomberg
Equity Shares (m)
M. Cap. (INR b)/(USD b)
52-Week Range (INR)
1,6,12 Rel Perf. (%)
ABB IN
211.9
300 / 5
1619 / 1030
-1 / -10 / 9
CMP: INR1,417 TP: INR1,230 (-13%)
Sell
Financial Snapshot (INR b)
Y/E Dec
2016 2017E 2018E 2019E
Net Sales
EBITDA
Adj. PAT
Adj. EPS (INR)
EPS Gr (%)
BV/Sh (INR)
RoE (%)
RoCE (%)
Payout (%)
Valuations
P/E (x)
P/BV (x)
EV/EBITDA (x)
Div. Yield (%)
71.9
9.1
30.4
0.3
74.5
8.1
23.4
0.3
50.1
7.3
17.8
0.4
41.6
6.4
13.3
0.5
86.6
7.9
3.7
19.7
25.0
154.9
12.7
18.3
19.9
90.5
7.3
4.0
19.0
-3.4
173.9
10.9
15.7
22.5
107.0
10.4
6.0
28.3
48.7
194.8
14.5
20.7
22.5
118.8
12.3
7.2
34.1
20.4
220.0
15.5
22.3
22.5
ABB has received orders of INR1.4b for supply of traction
equipment to Railways.
During the quarter, we expect ABB to register 10% YoY growth in
revenue, led by 12% growth in the discrete automation segment.
We expect gross margin to remain stable on YoY basis at 35.3%.
We expect EBITDA margin to remain stable at 11.2%.
Net profit growth is expected to remain robust at 27% YoY to
INR1.9b on account of lower interest cost (INR205m v/s INR285m
in 4QCY17). Maintain
Sell.
Key issues to watch
Management commentary suggests cautious optimism. Continued focus
on exports and services to be an important driver of projected strong
double-digit revenue and profit growth.
Continued preference for cash generation vis-à-vis profits.
Quarterly Performance
Y/E December
Sales
Change (%)
EBITDA
Change (%)
As % of Sales
Depreciation
Interest
Other Income
PBT
Tax
Effective Tax Rate (%)
Repoted PAT
Adj. PAT
Change (%)
1Q
20,035
10.4
1,808
25.9
9.0
359
223
149
1,376
442
32.1
854
934
72.0
CY16
2Q
3Q
20,947 20,550
8.4
4.4
1,136
1,183
-29.5
-24.1
5.4
5.8
357
406
197
196
299
299
881
880
324
389
36.8
44.2
556
646
556
706
-18.7
20.1
4Q
24,915
2.7
2,819
7.1
11.3
389
285
95
2,241
773
34.5
1,468
1,468
13.4
1Q
21,689
8.3
1,715
-5.2
7.9
376
212
186
1,312
428
32.6
884
884
-5.3
CY17
2Q
3Q
22,237
19,154
6.2
(6.8)
1,473
1,042
29.7
-11.9
6.6
5.4
383
389
231
152
326
378
1,185
878
435
344
36.7
39.2
751
834
751
534
34.9
-24.3
CY16
4Q
27,454
10.2
3,088
9.5
11.2
425
205
89
2,547
683
26.8
1,864
1,864
27.0
85,318
6.4
7,901
5.8
9.3
1510
919
658
6,131
1,957
31.9
3,687
4,175
25.0
CY17E
89,165
4.5
7,317
-7.4
8.2
1573
800
978
5,922
1,890
31.9
4,032
4,032
-3.4
8 February 2018
21

December 2017 Results Preview | Sector: Cement
ACC
Bloomberg
Equity Shares (m)
M. Cap. (INR b)/(USD b)
52-Week Range (INR)
1,6,12 Rel Perf. (%)
ACC IN
188.0
333 / 5
1869 / 1316
3/3/5
CMP: INR1,770 TP: INR1,795 (1%)
Neutral
Financial Snapshot (INR Billion)
Y/E Dec
2016 2017E 2018E 2019E
Sales
EBITDA
NP
Adj. EPS (INR)
EPS Gr. (%)
BV/Sh (INR)
RoE (%)
RoCE (%)
Payout (%)
Valuations
P/E (x)
P/BV (x)
EV/EBITDA (x)
EV/Ton (x)
49
4
25
140
36
4
20
138
26
3
15
131
22
3
12
127
108
13
7
36
-4
461
8
8
88
129
15
9
49
35
479
10
10
62
144
19
13
68
39
511
14
13
53
162
23
15
80
19
507
16
15
105
Dispatches in 4QCY17 are estimated at 6.6mt (+21% YoY), led by
capacity ramp-up at Jamul and Sindri, and a favorable base from
the previous year. Average realizations are expected to increase
1.3% QoQ (8% YoY) to INR4,705/ton due to strong pricing in most
regions.
Revenues are expected to increase 32% YoY to INR34.7b. EBITDA
margin is expected to be 10%, down 1.43pp QoQ (+1.6pp YoY).
EBITDA/ton is estimated at INR532 (+INR122 YoY, -INR61 QoQ) due
to higher cost QoQ. PAT is likely to increase 64% YoY to INR2.02b.
The stock trades at a P/E of 26x (CY18E) and 22x (CY19E),
EV/EBITDA of 15x (CY18E) and 12x (CY19E), and EV/ton of USD131
(CY18E) and USD127 (CY19E). Maintain Neutral.
Key issues to watch for
Cement pricing recovery.
Volume growth and demand revival.
Ramp-up of new plant in the East.
Quarterly Performance (Standalone)
Y/E December
Cement Sales (m ton)
YoY Change (%)
Cement Realization
YoY Change (%)
QoQ Change (%)
Net Sales
YoY Change (%)
Total Expenditure
EBITDA
Margins (%)
Depreciation
Interest
Other Income
PBT before EO Item
EO Income/(Expense)
PBT after EO Item
Tax
Rate (%)
Reported PAT
Adjusted PAT
Margins (%)
YoY Change (%)
E: MOSL Estimates
1Q
6.36
9.3
4,109
-9.4
-5.3
28,727
-0.4
24,953
3,774
13.1
1,434
188
1,131
3,283
0
3,283
937
28.5
2,346
2,346
8.2
-6.0
CY16
2Q
3Q
6.12
5.07
-1.3
-9.6
4,206
4,371
-4.1
-1.5
2.4
3.9
28,326 24,706
-4.3
-9.8
24,190 22,458
4,136
2,247
14.6
9.1
1,410
1,529
208
197
730
744
3,248
1,265
0
0
3,248
1,265
824
424
25.4
33.5
2,424
841
2,424
841
8.6
3.4
84.5
-28.1
4Q
5.45
-9.0
4,353
0.3
-0.4
26,346
-7.4
24,116
2,231
8.5
1,679
209
934
1,277
-428
849
44
5.2
805
1,233
4.7
-49.4
1Q
6.60
3.8
4,265
3.8
-2.0
30,997
7.9
27,579
3,418
11.0
1,650
252
1,101
2,617
0
2,617
502
19.2
2,115
2,115
6.8
-9.9
CY17
2Q
3Q
6.74
5.96
10.1
17.6
4,509
4,645
7.2
6.3
5.7
3.0
33,125 30,545
16.9
23.6
28,175 27,015
4,951
3,530
14.9
11.6
1,621
1,551
225
213
1,663
858
4,768
2,624
0
0
4,768
2,624
1,550
847
32.5
32.3
3,218
1,777
3,218
1,777
9.7
5.8
32.7
111.3
(INR m)
CY16
CY17E
4QE
6.61
21.3
4,705
8.1
1.3
34,704
31.7
31,189
3,515
10.1
1,781
211
978
2,502
0
2,502
479
19.1
2,023
2,023
5.8
64.1
22.99
-2.7
4,218
-4.6
25.91
12.7
4,528
7.3
107,676 129,371
-5.8
20.1
95,159 113,957
12,518 15,413
11.6
11.9
6,052
6,603
826
900
3,503
4,600
9,143 12,510
-428
0
8,715 12,510
2,244
3,378
25.8
27.0
6,470
9,132
6,898
9,132
6.4
7.1
-7.4
32.4
8 February 2018
22

December 2017 Results Preview | Sector: Capital Goods
BHEL
Bloomberg
Equity Shares (m)
M. Cap. (INR b)/(USD b)
52-Week Range (INR)
1,6,12 Rel Perf. (%)
BHEL IN
3671.4
361 / 6
122 / 81
5 / 0 / -9
CMP: INR98
TP: INR78 (-21%)
Sell
Financial Snapshot (INR b)
Y/E March
2017 2018E 2019E 2020E
Net Sales
EBITDA
PAT
EPS (INR)
EPS Gr. (%)
BV/Sh. INR
RoE (%)
RoCE (%)
Payout (%)
Valuations
P/E (x)
P/BV (x)
EV/EBITDA (x)
Div Yield (%)
* Consolidated
67.9
1.0
27.8
0.9
31.0
1.0
15.2
1.9
38.7
1.0
15.1
1.5
26.3
1.0
11.5
2.3
282.2 291.0
8.3
4.9
1.3
NM
88.0
1.5
0.7
59.8
14.2
10.8
2.9
119.0
88.9
3.3
2.5
59.8
311.2
15.5
8.6
2.3
-19.9
89.6
2.6
1.7
59.8
354.9
22.5
12.7
3.5
-19.9
90.7
3.8
3.0
59.8
We expect muted revenue growth of 5% YoY, led by lower
availability of orders for execution.
We expect gross margin to expand 210bp YoY to 39.5%, led by a
better product mix. However, operating profit is likely to decline
23% YoY to INR1.7b, driven by higher employee expenses.
We estimate net profit at INR715m, as against profit of INR935m in
3QFY17.
During the quarter, BHEL has secured a contract for supplying 146
sets of IGBT-based, third -phase electrics for 25KV AC mainline
EMU trains worth INR6.7b.
During the quarter, BHEL bagged an order for setting up 1320mw
super critical thermal power project in Tamil Nadu worth INR73b.
BHEL is L1 in 3.7GW of orders, which it expects to be finalized in
FY18.
Sell.
Key issues to watch
Continued constraint on execution due to operational issues.
Trends in provisions, particularly for liquidated damages on project
completion.
Quarterly Performance
Y/E March
Sales (Net)
Change (%)
EBITDA
Change (%)
As a % Sales
Interest
Depreciation
Other Income
PBT
Tax
Effective Tax Rate (%)
Reported PAT
Change (%)
Adj. PAT
Change (%)
E: MOSL Estimates
1Q
56,118
28.7
710
-133.9
1.3
57
2,182
2,493
965
188
19.4
778
129.5
778
129.5
FY17
2Q
66,645
12.2
1,551
-135.4
2.3
50
2,080
1,961
1,382
292
21.1
1,090
-160.3
1,090
-160.3
3Q
63,254
18.7
2,239
-113.9
3.5
263
2,088
1,358
1,245
310
24.9
935
-108.6
935
-108.6
4Q
96,882
-2.9
6,509
-24.9
6.7
3,136
2,139
1,452
2,686
530
19.7
2,156
-57.4
2,156
-57.4
1Q
55,056
-1.9
-883
-224.3
-1.6
657
2,001
4,622
1,080
272
25.2
808
3.9
808
3.9
FY18
2Q
62,971
-5.5
-954
-161.5
-1.5
552
1,872
4,850
1,473
318
21.6
1,154
5.9
1,154
5.9
FY17
3Q
66,565
5.2
1,715
-23.4
2.6
500
2,200
2,000
1,015
300
29.6
715
-23.6
715
-23.6
4Q
106,411
9.8
14,361
120.6
13.5
2,097
3,531
2,059
44,496
2,700
6.1
8,093
275.5
8,093
275.5
282,222
10.8
8,270
-160.5
2.9
3,506
8,488
3,189
6,237
1,320
21.2
4,917
-169.3
4,917
-169.3
FY18E
291,002
3.1
14,239
72.2
4.9
3,806
9,604
6,187
14,360
3,590
25.0
10,770
119.0
10,770
119.0
8 February 2018
23

December 2017 Results Preview | Sector: Automobiles
Bharat Forge
Bloomberg
Equity Shares (m)
M. Cap. (INR b)/(USD b)
52-Week Range (INR)
1,6,12 Rel Perf. (%)
Financial Snapshot (INR b)
Y/E Mar
2017 2018E 2019E
Sales
EBITDA
EPS (INR)
EPS Gr. (%)
BV/Sh. (INR)
RoE (%)
RoCE (%)
Valuations
P/E (x)
P/BV (x)
EV/Sales (x)
Consolidated
56.0
8.3
5.8
37.8
7.1
20.7
4.5
27.8
6.0
16.3
3.8
21.3
4.9
13.1
3.2
64.0
12.5
6.1
13.1
-7.2
88.4
16.2
80.4
17.3
9.0
19.4
48.1
20.3
92.9
21.6
12.3
26.3
35.9
23.4
BHFC IN
465.7
341 / 5
749 / 425
4 / 24 / 32
CMP: INR732
TP: INR859 (+17%)
Buy
2020E
107.1
26.2
16.0
34.4
30.5
149.5
25.2
102.7 122.7
BHFC’s shipment tonnage is expected to increase by 27.7% YoY
(+2.5% QoQ) to 60,125 tons, as build data for class 8 trucks was
strong, along with support from oil & gas and industrial segments.
Net realization is expected to increase 7.5% YoY (+0.5% QoQ) to
~INR215.5k/ton.
As a result, net revenue would increase 37.3% YoY (+3.0% QoQ) to
~INR12.9b.
EBITDA margin is likely to expand 205bp YoY (+30bp QoQ) to
29.7%.
PAT is expected to increase by 64.6% YoY (+4.0% QoQ) to INR2.1b.
We marginally upgrade our FY18 and FY19 earnings by 1.3% and
1.2%, respectively.
The stock trades at 27.8x FY19E and 21.3x FY20E EPS; maintain
Buy.
EV/EBITDA(x) 29.6
Key issues to watch
Outlook for oil & gas and mining segments, primarily with regard to
price recovery.
Update on ramp-up of new orders under commercial vehicles, PVs,
aerospace and rail.
Quarterly performance
Y/E March
Tonnage
Change (%)
Realization (INR '000/ton)
Change (%)
Net operating income
Change (%)
RM/Sales (%)
Staff Cost (% of Sales)
Other Exp. (% of Sales)
EBITDA
EBITDA Margins (%)
Non-Operating Income
Interest
Depreciation
EO Exp / (Inc)
PBT after EO items
Eff. Tax Rate (%)
Adj. PAT
Change (%)
E: MOSL Estimates
1Q
49,098
-5.6
184.2
-15.9
9,044
-20.6
34.4
10.1
28.5
2,444
27.0
256
170
740
0
1,791
31.8
1,221
-37.7
FY17
2Q
3Q
46,203 47,068
-15.3
-7.2
192.8
200.5
-6.4
-4.0
8,909
9,437
-20.7
-11.0
34.4
32.6
10.1
9.6
27.6
30.2
2,477
2,606
27.8
27.6
309
208
189
183
726
739
0
0
1,870
1,892
32.2
32.0
1,269
1,286
-26.3
-22.8
4Q
55,189
5.3
204.0
5.7
11,257
11.3
35.1
9.2
27.3
3,200
28.4
222
185
744
-380
2,872
27.8
1,801
8.7
1Q
55,100
12.2
217.9
18.3
12,008
32.8
35.0
8.9
28.3
3,333
27.8
259
185
774
0
2,633
33.5
1,751
43.4
FY18
2Q
3QE
58,659 60,125
27.0
27.7
214.5
215.5
11.2
7.5
12,580 12,959
41.2
37.3
35.0
34.8
8.5
8.3
27.1
27.3
3,694
3,844
29.4
29.7
366
340
217
200
781
800
0
0
3,063
3,184
33.5
33.5
2,037
2,118
60.5
64.6
FY17
4QE
61,227
10.9
218.1
6.9
13,351
18.6
34.8
8.3
27.1
3,982
29.8
315
162
813
0
3,321
33.5
2,208
22.6
197,573
-5.8
195.6
-4.7
38,647
-10.2
34.2
9.7
28.3
10,726
27.8
995
728
2949
-380
8,425
30.6
5,587
-16.9
(INR m)
FY18E
235,112
19.0
216.5
10.7
50,899
31.7
34.9
8.5
27.4
14,854
29.2
1,280
764
3,168
0
12,201
33.5
8,114
45.2
8 February 2018
24

December 2017 Results Preview | Sector: Healthcare
Cadila Healthcare
Bloomberg
Equity Shares (m)
M. Cap. (INR b)/(USD b)
52-Week Range (INR)
1,6,12 Rel Perf. (%)
CDH IN
1023.7
513 / 8
558 / 334
-3 / -27 / -6
CMP: INR428
TP:INR555 (+30%)
Buy
Financial Snapshot (INR Billion)
y/e march
2017 2018E 2019E 2020E
Sales
EBITDA
NP
EPS (INR)
EPS Gro. (%)
BV/Sh. (INR)
RoE (%)
RoCE (%)
Valuations
P/E (x)
P/BV (x)
30.1
6.3
24.5
5.3
16.6
18.0
4.3
12.7
16.2
3.5
11.1
94.3
19.0
14.5
14.2
-7.9
68.0
23.0
15.2
118.3
27.8
17.9
17.5
23.0
81.1
23.4
15.0
141.1
35.6
24.3
23.7
35.8
100.5
26.1
18.0
161.2
40.3
27.1
26.4
11.3
122.6
23.7
18.0
EV/EBITDA (x) 24.7
Cadila Healthcare's (CDH) 3QFY18 revenue is likely to grow
significantly by 35.4% YoY to INR31.1b, driven by strong growth in
the US formulations business, with growth of ~70% YoY to
INR15.1b on back of launch of gLialda in last quarter and ramp-up
of other key products.
Overall export formulations are expected to grow ~58% YoY to
INR17.9b, while domestic formulation is likely to grow 14% YoY to
INR11.6b.
We expect EBITDA to significantly increase by 100% YoY to INR8.1b
and margin to expand ~850bp. Adj. PAT is also likely to increase
~95% YoY to INR5.5b on the back of significant margin expansion.
We believe CDH has made investments in the right areas, and will
start accruing benefits over next 2-3 years. We expect strong EPS
growth from FY17-19E (29% CAGR) on the back of Moraiya
resolution and strong launch pipeline in US, with better return
ratios over next two years.
Strong launch momentum and limited-competition launches (like
Lialda) should drive strong margin improvement (FY19E EBITDA
margin to be ~25%). Maintain Buy with a TP of INR555 @22x
1HFY20E PER.
Key issues to watch out
Outlook for recovery in domestic formulations.
Progress on improvement in balance sheet.
Quarterly Performance
Y/E March
1Q
Net Revenues
YoY Change (%)
EBITDA
Margins (%)
Depreciation
Interest
Other Income
PBQ before EO Income
EO Exp/(Inc)
PBQ after EO Income
Tax
Rate (%)
Min. Int/Adj on Consol
Adj PAT
YoY Change (%)
Margins (%)
E: MOSL Estimates
22,871
-1.2
5,239
22.9
843
140
153
4,409
2
4,407
966
21.9
-121
3,564
-13.0
15.6
FY17
2Q
23,531
1.0
5,160
21.9
864
187
236
4,345
0
4,345
1,068
24.6
-99
3,376
-26.5
14.3
3Q
23,111
-4.8
4,043
17.5
898
66
166
3,245
0
3,245
504
15.5
-76
2,817
-27.8
12.2
4Q
24,782
1.2
4,636
18.7
1,145
99
731
4,123
0
4,123
19
0.5
249
3,855
-0.7
15.6
1Q
21,973
-3.9
2,773
12.6
1,220
219
210
1,544
0
1,544
293
19.0
133
1,384
-61.2
6.3
FY18E
2Q
32,340
37.4
8,571
26.5
1,267
406
225
7,123
0
7,123
2,123
29.8
33
5,033
49.1
15.6
3QE
31,281
35.4
8,133
26.0
1,000
405
257
6,986
0
6,986
1,397
20.0
-84
5,505
95.4
17.6
4QE
32,693
31.9
8,320
25.5
654
-16
337
8,019
0
8,019
1,631
20.3
-417
5,971
54.9
18.3
94,295
-1.0
19,036
20.2
3,750
450
1,286
16,122
0
16,122
1,289
8.0
47
14,880
3.7
15.8
118,287
25.4
27,798
23.5
4,141
1,014
1,029
23,672
0
23,672
5,444
23.0
-335
17,893
20.2
15.1
(INR Million)
FY17
FY18E
8 February 2018
25

December 2017 Results Preview | Utilities
CESC
Bloomberg
Equity Shares (m)
M. Cap. (INR b)/(USD b)
52-Week Range (INR)
1,6,12 Rel Perf. (%)
CESC IN
133.2
141 / 2
1080 / 637
4 / 13 / 38
CMP: INR1,060
TP: INR1,360 (+31%)
Buy
Financial Snapshot (INR Million)
Y/E March
FY17 FY18E FY19E FY20E
Sales
EBITDA
NP
EPS (INR)
EPS Gr. (%)
BV/Sh. (INR )
RoE (%)
RoCE (%)
Payout (%)
VALUATION
139.0
31.6
6.9
51.9
14.7
797.4
6.5
7.3
19.3
20.4
1.3
9.1
0.9
149.1
36.7
11.9
89.1
71.7
874.4
10.7
8.4
11.2
11.9
1.2
7.7
0.9
160.6
38.9
13.6
102.1
14.7
11.1
8.7
9.8
10.4
1.1
7.0
0.9
169.2
40.3
14.8
110.7
8.5
10.9
8.7
9.0
9.6
1.0
6.5
0.9
We expect CESC’s standalone PAT to increase 3.9% YoY to INR1.6b,
driven by savings in transmission and distribution losses, partly
offset by delay in approval of tariff for FY18.
Regulated equity is estimated to grow by 7.2% YoY/1.8% QoQ to
INR39.5b.
Spencer EBITDA should improve with a better performance after
initial GST hiccups, and transitory impact due to regulatory issues
in certain states in 2Q. The company expects to turn PAT positive
in 4QFY18. Buy.
964.5 1,063.3
P/E (x)
P/BV (x)
EV/EBITDA (x)
Div. Yield (%)
Key issues to watch for
Performance of Spencer.
Progress on demerger.
Quarterly Performance - Standalone
Y/E March
Sales
Change (%)
EBITDA
Change (%)
As of % Sales
Depreciation
Interest
Other Income
Regulatory (inc)/exp
PBT
Tax
Effective Tax Rate (%)
Reported PAT
Adjusted PAT
Change (%)
1Q
20,120
18.1
5,110
32.4
25.4
960
1,150
260
620
2,640
900
34.1
1,740
1,740
14.5
FY17
2Q
3Q
20,160 16,200
13.8
5.3
5,910
3,150
34.9
5.7
29.3
19.4
990
980
1,160
1,080
320
300
600
-960
3,480
2,350
1,060
830
30.5
35.3
2,420
1,520
2,420
1,520
24.1
35.7
4Q
15,720
6.3
2,040
-57.1
13.0
1,160
1,090
590
-3,410
3,790
840
22.2
2,950
2,950
19.0
1Q
21,840
8.5
6,070
18.8
27.8
1,050
1,210
400
1,940
2,270
490
21.6
1,780
1,780
2.3
FY18
2Q
3QE
20,880 16,368
3.6
1.0
5,050
3,975
-14.6
26.2
24.2
24.3
1,080
1,028
1,260
1,197
350
275
-90
0
3,150
2,024
680
445
21.6
22.0
2,470
1,579
2,470
1,579
2.1
3.9
4QE
14,236
-9.4
4,513
121.2
31.7
1,134
1,299
322
-1,850
4,252
958
22.5
3,294
3,294
11.7
INR million
FY17
72,200
12.2
16,210
1.4
22.5
4,090
4,480
1,470
-3,150
12,260
2,380
19.4
9,880
8,630
22.1
FY18E
73,324
1.6
19,607
21.0
26.7
4,292
4,966
1,347
0
11,696
2,573
22.0
9,123
9,123
5.7
8 February 2018
26

December 2017 Results Preview | Sector: Healthcare
Glenmark Pharma
Bloomberg
Equity Shares (m)
M. Cap. (INR b)/(USD b)
52-Week Range (INR)
1,6,12 Rel Perf. (%)
GNP IN
282.3
167 / 2.6
973 / 528
4 / -16 / -61
CMP: INR592
TP:INR650 (+10%)
Neutral
Financial Snapshot (INR Billion)
y/e Mar
2017 2018E 2019E 2020E
Sales
EBITDA
NP
EPS (INR)
EPS Gro. (%)
BV/Sh. (INR)
RoE (%)
RoCE (%)
Valuations
P/E (x)
P/BV (x)
EV/EBITDA (x)
D. Yield (%)
15.1
3.7
11.2
0.5
15.6
3.1
11.0
0.5
13.8
2.5
9.9
0.5
11.7
2.1
8.5
0.5
89.7
18.2
11.1
39.3
58.0
24.7
19.1
94.4
18.0
10.7
37.9
-3.4
19.6
17.1
106.9 120.8
19.6
12.1
42.8
12.9
18.4
19.2
22.3
14.3
50.5
18.0
18.1
19.7
159.2 193.5 232.7 279.6
We expect Glenmark Pharmaceuticals (GNP) to report 5.9% YoY
decline in overall revenues to INR23.2b. Decline in sales is
primarily attributed to decline in the US business due to Zetia FTF
launch in 3QFY17 (6 months exclusivity ended in 1QFY18).
The India branded business is likely to grow 18% YoY, while LatAm
business is expected to grow at 15% YoY; RoW and Europe
businesses are expected to grow 15% and 20% YoY, respectively.
EBITDA is likely to decrease 38% YoY to INR4.3b and margin to
contract ~960bp due to Zetia sales in 3QFY17 which has margin of
>85%.
Weak cash flow conversion and high net debt remain key
concerns for GNP. Maintain Neutral with a TP of INR650 @ 15x
FY19E EPS.
Key issues to watch out
New ANDA filings in complex category.
Update on free-cash generation and debt repayment schedule.
Progress of NCE/NBE pipeline and potential out-licensing prospects.
Quarterly Performance (INR m)
Y/E March
1Q
Net Revenues (Core)
YoY Change (%)
EBITDA
Margins (%)
Depreciation
Interest
Other Income
PBT before EO Expense
Extra-Ord Expense
PBT after EO Expense
Tax
Rate (%)
Reported PAT (incl one-offs)
Reported PAT (excl MI)
YoY Change (%)
Margins (%)
E: MOSL Estimates
19,095
17.4
3,192
16.7
642
430
1,358
3,477
0
3,477
1,209
34.8
2,268
2,268
24.0
11.9
FY17
2Q
21,732
17.9
3,978
18.3
770
629
491
3,070
0
3,070
876
28.5
2,193
2,193
9.4
10.1
3Q
24,630
42.8
6,929
28.1
625
617
866
6,553
0
6,553
1,782
27.2
4,771
4,771
180.8
19.4
4Q
24,244
11.5
4,110
17.0
689
697
-185
2,539
809
1,730
-107
-6.2
1,837
1,837
23.5
7.6
1Q
23,294
22.0
5,438
23.3
777
709
489
4,441
0
4,441
1,108
24.9
3,334
3,334
47.0
14.3
FY18E
2Q
22,234
2.3
3,552
16.0
752
698
629
2,731
0
2,731
589
21.6
2,141
2,141
-2.4
9.6
3QE
23,180
-5.9
4,294
18.5
775
600
500
3,419
0
3,419
855
25.0
2,564
2,564
-46.3
11.1
4QE
25,690
6.0
4,706
18.3
809
597
382
3,683
0
3,683
1,017
27.6
2,666
2,666
45.1
10.4
(INR Million)
FY17
89,701
18.2
18,211
20.3
2,644
2,373
2,530
15,724
809
15,724
3,827
24.3
11,897
11,897
56.5
13.3
FY18E
94,398
5.2
17,991
19.1
3,114
2,604
2,000
14,273
0
14,273
3,568
25.0
10,705
10,705
-10.0
11.3
8 February 2018
27

December 2017 Results Preview | Sector: Healthcare
Granules India
Bloomberg
Equity Shares (m)
M. Cap. (INR b)/(USD b)
52-Week Range (INR)
1,6,12 Rel Perf. (%)
GNP IN
229
30.9 / 0.5
157 / 98
5 / -12 / -6
CMP: INR135
TP:INR200 (+48%)
Buy
Financial Snapshot (INR Billion)
y/e Mar
2017 2018E 2019E 2020E
Sales
EBITDA
NP
EPS (INR)
EPS Gro. (%)
BV/Sh. (INR)
RoE (%)
RoCE (%)
Valuations
P/E (x)
P/BV (x)
EV/EBITDA (x)
D. Yield (%)
18.7
3.4
10.9
0.4
19.7
2.4
9.9
0.5
15.1
2.2
7.5
0.7
10.4
1.9
5.7
1.1
14.4
3.0
1.7
7.2
32.3
39.5
21.1
17.9
16.5
3.3
1.6
6.8
-5.4
55.1
14.2
14.1
21.7
4.6
2.3
9.0
31.1
61.4
15.4
15.7
28.5
6.1
3.3
13.0
45.1
70.5
19.7
20.0
We expect Granules India (GRAN) to post healthy 13% YoY growth
in 3QFY18 reported sales to INR4.1b.
EBITDA is likely to increase 10% YoY to INR837m, though EBITDA
margin is expected to marginally contract by ~60bp YoY to 20.6%.
Depreciation is expected to increase by ~34% YoY and
sequentially due to new facility getting operational. We expect
reported PAT to increase 11.2% YoY to INR433m.
GRAN trades at 15.1x FY19E EPS (despite assuming >10% equity
dilution). We believe the stock has the potential to deliver >50%
return in 12-18 months on the back of multiple re-rating (to >18x
forward earnings) and strong PAT CAGR of ~27% till FY20E. At 18x
1HFY20E EPS, fair value of the stock works out to INR200.
Key issues to watch out
New ANDA filings in complex category.
Update on free-cash generation and debt repayment schedule.
Progress of NCE/NBE pipeline and potential out-licensing prospects.
Quarterly Performance (INR Million)
Y/E March
(Consolidated)
Net Sales
YoY Change (%)
Total Expenditure
EBITDA
Margins (%)
Depreciation
Interest
Other Income
PBT before EO expense
Tax
Rate (%)
MI & Profit/Loss of Asso. Cos.
PAT (Ex associate income)
Reported PAT
YoY Change (%)
Margins (%)
E: MOSL Estimates
1Q
3,498
8.4
2,813
685
19.6
163
79
30
472
154
32.5
-71
319
390
33.8
11.1
FY17
2Q
3Q
3,638
3,595
3.1
4.2
2,896
2,832
742
763
20.4
21.2
185
187
83
84
39
43
513
535
156
176
30.4
32.9
-51
-31
357
359
408
390
28.1
43.5
11.2
10.8
4Q
3,634
-2.4
2,848
785
21.6
180
77
0
529
166
31.4
-94
363
457
13.4
12.6
1Q
3,860
10.3
3,090
769
19.9
176
82
4
515
177
34.4
-30
338
368
-5.5
9.5
FY18E
2Q
3QE
3,926
4,062
7.9
13.0
3,156
3,225
769
837
19.6
20.6
186
250
104
90
68
35
547
532
193
144
35.2
27.0
-49
-45
355
388
403
433
-1.2
11.2
10.3
10.7
FY17
4QE
4,276
17.7
3,379
898
21.0
330
83
33
518
141
27.3
-51
377
428
-6.3
10.0
14,353
0.4
11,364
2,988
20.8
715
323
99
2,050
652
31.8
-247
1,398
1,645
44.3
11.5
FY18E
16,124
12.3
12,851
3,273
20.3
942
359
140
2,113
655
31.0
-175
1,458
1,633
-0.8
10.1
8 February 2018
28

December 2017 Results Preview | Sector: Oil & Gas
Gujarat State Petronet
Bloomberg
Equity Shares (m)
M. Cap. (INR b)/(USD b)
52-Week Range (INR)
1,6,12 Rel Perf. (%)
GUJS IN
563.0
124 / 2
236 / 136
7 / 16 / 31
CMP: INR221
TP: INR183 (-17%)
Neutral
Financial snapshot (INR b)
y/e march
2017 2018E 2019E 2020E
Sales
EBITDA
Adj. PAT
Adj. EPS (INR)
EPS Gr. (%)
BV/Sh.(INR)
RoE (%)
RoCE (%)
Payout (%)
Valuations
P/E (x)
P/BV (x)
EV/EBITDA (x)
Div. Yield (%)
25.1
2.8
14.2
0.8
17.7
2.5
10.2
1.1
17.0
2.2
9.5
1.1
15.8
2.0
8.7
1.2
10.3
8.9
5.0
8.8
11.5
80
11.6
9.9
22.6
13.6
12.0
7.0
12.5
41.4
89.4
14.7
12.4
22.5
13.9
12.3
7.3
13.0
4.2
99.5
13.7
11.6
22.5
14.4
12.7
7.9
14.0
7.9
110.3
13.4
11.4
22.6
We expect GUJS to report net sales of INR3.8b and PAT of INR1.9b
(+63% QoQ, +9% YoY).
We model transmission volume at 34mmscmd (+30% YoY, +8%
QoQ), led by increased gas demand from power sector, and
transmission tariff at INR1,200/mscm (+10% YoY, +8% QoQ).
GUJS had won the bids for three cross-country pipelines (Mehsana-
Bhatinda, Bhatinda-Srinagar, Mallavaram-Bhilwara). We await
clarity on the current status, timelines and other details regarding
these pipelines.
We build in gas transmission volumes of 31mmscmd for FY18 and
31/32mmscmd for FY19/20, and model tariff at INR1,200/mscm for
FY18/19/20.
The stock trades at 15.8x FY20E EPS of INR14. Maintain
Neutral.
Key issues to watch for
Transmission volumes and tariffs
Progress on clearances of the three pipelines
Quarterly Performance
Y/E March
Net Sales
Change (%)
EBITDA
% of Net Sales
% Change
Depreciation
Interest
Other Income
PBT
Tax
Rate (%)
PAT
Adj. PAT
Change (%)
EPS (INR)
Transmission Vol. (mmscmd)
Implied adj. tariff (INR/mscm)
E: MOSL Estimates
1Q
2,579
-0.5
2,330
90.4
2.6
430
167
147
1,881
668
35.5
1,213
1,213
8
2.2
25.1
1,073
FY17
2Q
2,564
-0.7
2,245
87.6
-3.8
436
148
304
1,965
666
33.9
1,298
1,298
7
2.3
24.6
1,079
3Q
2,668
3.4
2,275
85.3
0.6
465
165
177
1,822
636
34.9
1,186
1,186
-9
2.1
26.2
1,095
4Q
2,446
5.5
2,013
82.3
-1.6
460
116
273
1,710
441
25.8
1,270
1,270
28
2.3
23.4
1,197
1Q
2,963
14.9
2,760
93.1
18.4
430
106
164
2,389
864
36.2
1,525
1,525
26
2.7
26.9
1,157
FY18
2Q
3,348
30.6
2,855
85.3
27.2
438
90
278
2,605
836
32.1
1,770
1,770
36
3.1
31.6
1,112
(INR Million)
FY17
FY18E
3QE
3,780
41.7
3,319
87.8
45.9
507
130
253
2,935
1,007
34.3
1,928
1,928
63
3.4
34.0
1,200
4QE
3,524
44.0
3,094
87.8
53.7
545
125
316
2,740
941
34.3
1,800
1,800
42
3.2
32.0
1,202
10,256
1.8
8,864
86.4
-0.5
1,791
596
901
7,378
2,411
32.7
4,966
4,966
7
8.8
24.8
1,111
13,615
32.8
12,028
88.3
35.7
1,920
452
1,012
10,669
3,647
34.2
7,022
7,022
41
12.5
31.1
1,168
8 February 2018
29

December 2017 Results Preview | Sector: Financials
Muthoot Finance
Bloomberg
Equity Shares (m)
M. Cap. (INR b)/(USD b)
52-Week Range (INR)
1,6,12 Rel Perf. (%)
MUTH IN
399.5
183 / 3
526 / 270
1 / -8 / 33
CMP: INR458
TP: INR515 (+12%)
Neutral
Financial Snapshot (INR b)
Y/E March
NII
PPP
PAT
EPS (INR)
BV/Sh.(INR)
RoA on AUM (%)
RoE (%)
Div. Yld. (%)
P/E (x)
P/BV (x)
2017 2018E 2019E 2020E
33.6
22.0
11.8
29.5
4.6
19.4
1.3
16.1
2.9
39.7
28.2
17.0
42.6
6.0
23.8
1.8
11.1
2.4
40.5
27.7
16.8
42.0
5.5
19.9
1.8
11.3
2.1
46.1
31.8
19.2
48.1
5.6
19.6
2.0
9.9
1.8
AUM is expected to grow 5% YoY to INR285b.
Margins are expected to improve drastically due to re-pricing of
borrowings. Margins should expand over 300bp YoY to 14.4%.
As a result, total income is expected to grow 35% YoY to INR10b.
Asset quality is likely to improve significantly. GNPL ratio in the
prior quarter was 4.6%.
We estimate provisions of INR200m as against INR1.17b in 2QFY18.
PAT is expected to grow 51% YoY to INR4.4b.
The stock trades at 2.4x FY18E and 2.1x FY19E BV. Maintain
Neutral.
163.1 195.4 227.3 263.8
Key issues to watch for
Management commentary on business growth and steps taken to
sustain AUM growth.
Plan of branch expansion.
Movement in yields and margins, with declining cost of funds.
Progress in gold auctions.
Quarterly Performance
Y/E March
Income from operations
Other operating income
Total Operating income
YoY Growth (%)
Other income
Total Income
YoY Growth (%)
Interest Expenses
Net Income
Operating Expenses
Operating Profit
YoY Growth (%)
Provisions
Profit before Tax
Tax Provisions
Net Profit
YoY Growth (%)
E: MOSL Estimates
1Q
12,712
252
12,964
13.7
44
13,008
13.8
5,571
7,437
3,025
4,413
50.1
176
4,237
1,534
2,703
47.6
FY17
2Q
13,497
320
13,817
21.6
45
13,862
21.6
5,937
7,925
3,130
4,795
69.5
171
4,624
1,657
2,967
70.0
3Q
13,225
184
13,409
17.8
56
13,464
18.0
5,970
7,494
3,000
4,495
51.2
39
4,456
1,545
2,911
55.9
4Q
16,962
135
17,096
18.2
36
17,132
18.0
5,460
11,672
3,349
8,323
37.6
2,430
5,893
2,675
3,218
21.3
1Q
13,758
165
13,923
7.4
63
13,986
7.5
5,326
8,660
3,075
5,585
26.6
66
5,518
2,007
3,511
29.9
FY18
2Q
16,385
264
16,649
20.5
50
16,699
20.5
4,889
11,810
3,114
8,696
81.4
1,170
7,526
2,985
4,542
53.1
FY17E
3Q
14,747
200
14,947
11.5
60
15,007
11.5
4,914
10,093
3,145
6,948
54.6
200
6,748
2,362
4,386
50.7
4Q
14,840
171
15,011
-12.2
66
15,077
-12.0
4,925
10,152
3,197
6,955
-16.4
337
6,618
2,022
4,596
42.8
56,395
891
57,286
17.8
181
57,467
17.9
22,938
34,529
12,503
22,026
48.9
2,816
19,211
7,411
11,799
45.7
(INR m)
FY18E
59,729
800
60,529
5.7
240
60,769
5.7
20,054
40,715
12,531
28,183
28.0
1,773
26,411
9,376
17,035
44.4
8 February 2018
30

December 2017 Results Preview | Consumer
Page Industries
Bloomberg
Equity Shares (m)
M. Cap. (INR b)/(USD b)
52-Week Range (INR)
1,6,12 Rel Perf. (%)
PAG IN
11.2
274 / 4
25779 / 13605
10 / 33 / 52
CMP: INR24,564 TP: INR28,650 (+17%)
Buy
We expect Page to report net sales of INR6.2b, up 16.5% YoY, led
by ~8% overall volume growth. We note that volume growth in
men’s innerwear has a low base of 2%.
Gross margin is likely to come in at 60.7% (up by 100bp YoY). Yarn
costs have been stable QoQ.
We expect EBITDA margin to grow by 50bp YoY to 19.3%. Thus,
EBITDA should grow by 19.6% YoY to INR1.2b.
Adj. PAT is likely to post 17% YoY growth to INR736m.
The stock trades at 59.5x/45.1x FY19E/20E EPS of
INR413.1/INR544.5; maintain Buy.
Financial Snapshot (INR b)
Y/E March
2017 2018E 2019E 2020E
Sales
EBITDA
Adj. PAT
Adj. EPS (INR)
EPS Gr. %
FCF to PAT
BV/Sh.INR
RoE (%)
RoCE (%)
Payout (%)
Valuations
P/E (x)
EV/EBITDA (x)
102.9
66.3
82.8
52.4
59.5
38.4
45.1
29.4
21.3
4.1
2.7
238.7
15.0
0.7
596.9
40.0
40.4
43.7
25.4
5.2
3.3
296.6
24.3
1.1
745.2
39.8
41.2
50.0
32.3
7.1
4.6
413.1
39.3
0.5
44.4
47.1
55.0
41.1
9.2
6.1
544.5
31.8
0.8
47.4
51.2
60.0
931.1 1148.9
Key issues to watch for
Performance of kidswear.
Competitive intensity.
Minimum wage hike in Karnataka for textile industry.
Quarterly Performance
Y/E MARCH
Net Sales
YoY Change (%)
COGS
Gross Profit
Gross margin (%)
Other Expenditure
% to sales
EBITDA
Margins (%)
YoY Change
Depreciation
Interest
Other Income
PBT
Tax
Rate (%)
PAT
YoY Change (%)
E: MOSL Estimates
27%
1Q
5,686
26.7
2,570
3,116
54.8
2,024
35.6
1,092
19.2
8.8
59
39
59
1,053
373
35.5
679
8.5
25%
FY17
2Q
5,344
14.6
2,156
3,188
59.7
2,113
39.5
1,075
20.1
6.3
60
40
62
1,037
350
33.8
687
14.0
25%
3Q
5,283
19.2
2,131
3,151
59.7
2,160
40.9
991
18.8
19.6
62
45
20
904
275
30.4
629
20.9
23%
4Q
4,989
12.8
1,766
3,223
64.6
2,249
45.1
974
19.5
5.3
65
56
103
955
287
30.1
668
17.9
1Q
6,962
22.5
3,187
3,775
54.2
2,410
34.6
1,365
19.6
25.0
67
45
40
1,294
441
34.1
853
25.5
FY18
2Q
6,257
17.1
2,651
3,606
57.6
2,321
37.1
1,284
20.5
19.5
68
36
49
1,229
389
31.6
841
22.4
FY17
3QE
6,154
16.5
2,421
3,733
60.7
2,547
41.4
1,186
19.3
19.6
69
45
20
1,092
356
32.6
736
17.0
4QE
6,030
20.9
3,426
2,604
43.2
1,242
20.6
1,362
22.6
39.8
70
16
18
1,294
415
32.0
879
31.6
21,301
18.3
8,623
12,678
59.5
8,546
40.1
4,132
19.4
9.7
247
180
243
3,948
1,285
32.6
2,663
15.0
FY18E
25,403
19.3
11,685
13,718
54.0
8,521
33.5
5,197
20.5
25.8
273
142
127
4,909
1,600
32.6
3,309
24.2
8 February 2018
31

December 2017 Results Preview | Consumer
Parag Milk Foods
Bloomberg
Equity Shares (m)
M. Cap. (INR b)/(USD b)
52-Week Range (INR)
1,6,12 Rel Perf. (%)
PARAG IN
84.1
26 / 0
313 / 203
23 / 31 / -11
CMP: INR304
TP: INR314 (+7%)
Neutral
We expect Parag to report net sales of INR4.9b, up 10% YoY. Both
liquid milk and milk products are expected to see decent growth.
3QFY18 is likely to see festive-led demand as well as good growth
in the institutional business, which had suffered in the base
quarter due to price hikes taken ahead of peers.
Raw milk prices have been stable on a QoQ basis. Gross margin is
likely to expand 700bp YoY to 29.1% due to a low base (3QFY17
was impacted by higher milk prices and a weak product mix).
We estimate EBITDA margin of 9.3% in 3QFY18.
EBITDA and adj. PAT likely to touch INR454m and INR190m,
respectively.
The stock trades at 24.5x/18.1x FY19E/20E EPS of
INR12.4/INR16.8. Maintain Neutral.
Key issues to watch for
Raw milk prices and global SMP price movement.
Growth in value-added products, especially whey protein.
Competitive intensity.
Financial Snapshot (INR b)
Y/E March
2017 2018E 2019E 2020E
Net Sales
EBITDA
PAT
EPS (INR)
Gr. (%)
BV/Sh (INR)
RoE (%)
RoCE (%)
Valuations
P/E (x)
P/BV (x)
EV/EBITDA (x)
EV/Sales (x)
17.3
1.1
0.3
3.6
78.2
6.0
6.9
84.2
3.9
25.0
1.6
19.2
1.7
0.8
8.9
87.1
10.8
10.5
34.0
3.5
15.1
1.4
22.8
2.1
1.0
12.4
38.7
99.5
13.3
12.0
24.5
3.1
12.5
1.2
26.3
2.7
1.4
16.8
35.6
116.3
15.6
14.0
18.1
2.6
94.7
9.7
-46.4 147.7
Consolidated - Quarterly Earning Model
Y/E March
Net Sales
YoY Change (%)
Gross Profit
Margin (%)
Total Expenditure
EBITDA
YoY Change (%)
Margins (%)
Depreciation
Interest
Other Income
PBT
Tax
Rate (%)
Adj PAT
YoY Change (%)
Margins (%)
E: MOSL Estimates
1Q
3,835
2.6
1,095
28.6
777
318
11.8
8.3
98
96
16
140
38
27.2
102
45.5
2.7
FY17
2Q
4,728
0.7
1,341
28.4
1,004
338
-18.4
7.1
115
51
31
204
76
37.1
128
32.0
2.7
3Q
4,461
15.1
987
22.1
1,131
-145
-137.8
-3.2
109
89
20
-322
-54
16.8
-268
-284.5
-6.0
4Q
4,283
3.4
1,390
32.4
871
519
29.6
12.1
168
88
59
322
3
0.9
319
98.4
7.5
1Q
4,129
7.7
1,199
29.0
905
294
-7.7
7.1
116
79
15
115
9
8.1
105
3.0
2.5
FY18
2Q
3QE
5,045
4,907
6.7
10.0
1,415
1,429
28.1
29.1
916
975
500
454
47.9
LP
9.9
9.3
129
119
74
89
36
20
333
266
84
76
25.3
28.5
249
190
94.5
LP
4.9
3.9
FY17
4QE
5,153
20.3
1,527
29.6
1,051
475
-8.3
9.2
136
90
38
287
81
28.2
206
-35.3
4.0
17,307
5.2
4,813
27.8
3,783
1,030
-30.5
6.0
490
323
127
344
62
18.1
282
-40.4
1.6
FY18E
19,234
11.1
5,570
29.0
17,511
1,723
67.3
9.0
500
331
110
1,001
250
25.0
751
166.5
3.9
8 February 2018
32

December 2017 Results Preview | Sector: Oil & Gas
Petronet LNG
Bloomberg
Equity Shares (m)
M. Cap. (INR b)/(USD b)
52-Week Range (INR)
1,6,12 Rel Perf. (%)
PLNG IN
1500.0
381 / 6
275 / 176
1 / 10 / 7
CMP: INR254
TP: INR312 (+23%)
Buy
Financial snapshot (INR b)
Y/E march
2017 2018E 2019E 2020E
Sales
EBITDA
Adj. PAT
Adj. EPS (INR)
EPS Gr. (%)
BV/Sh.(INR)
RoE (%)
RoCE (%)
Payout (%)
Valuation
P/E (x)
P/BV (x)
EV/EBITDA (x)
Div. Yield (%)
22.3
4.7
15.1
1.0
16.9
3.9
11.5
1.4
15.2
3.3
9.8
1.6
12.5
2.8
7.5
1.9
246.2 278.9 292.7 345.7
25.9
17.1
11.4
102.7
54.0
23.2
20.2
25.7
33.2
22.6
15.0
32.3
64.8
25.3
22.3
28.1
36.6
25.1
16.7
11.3
76.8
23.6
22.3
28.1
44.9
30.5
20.3
21.4
91.4
24.2
24.1
28.1
We expect PLNG to report PAT of INR5.6b (+41% YoY, -5% QoQ)
and EBITDA of INR8.2b (+35% YoY, -9% QoQ) for 3QFY18.
We model Dahej LNG volumes at 205tbtu, with 108% utilization
and Kochi LNG volumes at 9.5tbtu, with 15% utilization in 3QFY18.
PLNG’s long-term growth would depend on Dahej’s ramp-up and
Kochi terminal’s pipeline connectivity.
As against 15mmt capacity, PLNG has ~16mmt long-term take-or-
pay contracts.
The stock trades at 12.5x FY20E EPS of INR20.3. Maintain Buy.
Key issues to watch for
Utilization at Dahej terminal
Progress on Kochi-Mangalore pipeline
Spot volumes and marketing margin on spot volumes
Standalone - Quarterly Earnings Model
Y/E March
Net Sales
YoY Change (%)
EBITDA
Margins (%)
Depreciation
Interest
Other Income
PBT
Tax
Rate (%)
PAT
YoY Change (%)
Margins (%)
Key Assumptions
Regas volume (tbtu)
Sales volume (tbtu)
E: MOSL Estimates
1Q
53,373
-36.3
6,425
12.0
806
556
494
5,556
1,777
32
3,779
115.8
7.1
50.1
118.1
FY17
2Q
3Q
66,144 62,993
-12.3
22.4
7,264
6,071
11.0
9.6
860
1,009
554
517
915
550
6,765
5,095
2,170
1,121
32
22
4,596
3,975
84.7
122.8
6.9
6.3
60.7
128.2
75.3
116.1
4Q
63,651
4.9
6,163
9.7
1,016
469
1,508
6,186
1,478
24
4,708
96.8
7.4
71.1
108.9
1Q
64,351
20.6
7,442
11.6
1,027
465
707
6,658
2,282
34
4,376
15.8
6.8
80.5
111.1
FY18
2Q
3QE
77,702 68,546
17.5
8.8
8,987
8,198
11.6
12.0
1,039
1,078
465
267
1,019
1,145
8,504
7,998
2,616
2,399
31
30
5,888
5,599
28.1
40.9
7.6
8.2
79.0
141.0
94.3
120.0
4QE
68,269
7.3
8,534
12.5
1,078
267
1,145
8,334
2,500
30
5,834
23.9
8.5
94.3
117.4
(INR Million)
FY17
FY18E
246,160
-9.3
25,923
10.5
3,691
2,097
3,466
23,602
6,545
28
17,057
102.7
6.9
257.1
471.2
278,868
13.3
33,161
11.9
4,220
1,463
4,015
31,493
9,797
31
21,696
27.2
7.8
348.0
489.5
8 February 2018
33

December 2017 Results Preview | Sector: Metals
SAIL
Bloomberg
Equity Shares (m)
M. Cap. (INR b)/(USD b)
52-Week Range (INR)
1,6,12 Rel Perf. (%)
Financial Snapshot (INR Billion)
2018E
2019E
Y/E Mar
559.8
666.1
Net Sales
42.0
81.3
EBITDA
-5.6
18.6
PAT
-1.4
4.5
EPS (INR)
-78.5
-430.3
Gr. (%)
87.3
91.4
BV/Sh (INR)
-1.5
5.0
RoE (%)
1.8
6.2
RoCE (%)
-73.3
22.2
P/E (x)
1.1
1.1
P/BV (x)
SAIL IN
4130.4
387 / 6
95 / 50
17 / 51 / 55
2020E
689.5
105.0
27.0
6.5
44.8
97.4
6.9
8.8
15.3
1.0
CMP: INR94
TP: 75
Sell
SAIL’s EBITDA is expected to increase ~31% QoQ to INR11.9b.
Volumes would increase 3% QoQ / 11% YoY to 3.7mt. EBITDA per
ton would increase by ~INR700/t to INR3,278/t on higher steel
prices and operating leverage gains from higher volumes.
PAT loss is likely to decline QoQ from INR3.2b to INR1.1b.
Key issues to watch for
Commissioning of Bhilai capacity and steel prices.
Quarterly Performance
Y/E March
(Standalone)
Sales (m tons)
Change (YoY %)
Realization (INR per ton)
Change (YoY %)
Net Sales
Change (%)
EBITDA
Change (YoY %)
EBITDA per ton (INR)
EBITDA per ton (USD)
Interest
Depreciation
Other Income
PBT (before EO Inc.)
EO Income(exp)
PBT (after EO Inc.)
Total Tax
% Tax
Reported PAT
Adjusted PAT
Change (YoY %)
E: MOSL Estimates
1Q
2.8
4.1
32,993
-6.6
92,381
-2.8
2,338
-386.2
835
12
5,941
6,002
893
-8,712
-542
-9,254
-3,899
42.1
-5,355
-5,042
56.8
FY17
2Q
3Q
3.6
3.3
31.4
13.8
31,182
34,237
-7.7
11.1
112,256 112,982
21.3
26.4
1,114
-428
-114.5
-96.9
310
-130
5
-2
6,028
6,108
6,659
6,699
682
688
-10,890
-12,547
-1,640
11
-12,531
-12,536
-5,215
-4,587
41.6
36.6
-7,316
-7,948
-6,358
-7,956
-18.1
-48.0
4Q
3.4
-8.6
36,827
22.1
126,905
11.6
-2,644
-76.5
-767
-11
7,202
7,439
3,094
-14,192
3
-14,188
-6,475
45.6
-7,713
-7,715
-37.3
1Q
3.0
8.1
38,242
15.9
115,796
25.3
-839
-135.9
-277
-4
5,879
6,947
893
-12,771
-101
-12,872
-4,859
37.7
-8,014
-7,951
57.7
FY18
2Q
3QE
3.5
3.7
-1.7
10.6
38,467
39,528
23.4
15.5
136,174 144,277
21.3
27.7
9,143
11,964
720.5 -2,898.0
2,583
3,278
40
51
6,435
6,492
7,622
7,138
486
549
-4,428
-1,118
-2,975
-7,403
-1,118
-2,013
-34
27.2
3.0
-5,391
-1,084
-3,224
-1,084
-49.3
-86.4
4QE
3.8
10.3
40,950
11.2
155,610
22.6
14,324
-641.8
3,769
58
6,720
7,546
546
604
604
133
22.0
471
471
-106.1
(INR Million)
FY17
13.1
8.6
33,814
4.7
444,524
13.8
380
-101.1
29
0
25,278
26,800
5,356
-46,341
-2,167
-48,509
-20,176
41.6
-28,332
-27,066
-29.8
FY18E
14.0
6.6
39,368
16.4
551,857
24.1
34,592
8,993.6
2,468
38
25,526
29,253
2,474
-17,713
-3,077
-20,789
-6,772
32.6
-14,017
-11,943
-55.9
8 February 2018
34

December 2017 Results Preview | Sector: Telecom
Tata Communications
Bloomberg
Equity Shares (m)
M. Cap. (INR b)/(USD b)
52-Week Range (INR)
1,6,12 Rel Perf. (%)
TCOM IN
285.0
191 / 3
782 / 570
-5 / -15 / -20
CMP: INR669
TP: INR780 (+17%)
Buy
Tata Communications’ revenue is expected grow 1% QoQ (decline
2% YoY) to INR42.7b on weak voice and data revenues.
Data revenue is likely to grow 2.3% QoQ to INR28.5b. We expect
voice revenue to decline 1% QoQ (and 14% YoY) to INR14.2b.
Core EBITDA is expected to grow 2% QoQ to INR5.7b on the back
of data EBITDA, while EBITDA margin would remain flat at 13.4%.
Data EBITDA is expected to grow 5% QoQ to INR4.8b, led by 40bp
improvement in data EBITDA margin to 17%.
The stock trades at an EV/EBITDA of 12.1x FY18E and 9.6x FY19E.
Maintain Buy.
Financial Snapshot (INR Million)
Y/E March
2017 2018E 2019E 2020E
Net Sales
EBITDA
Adj. NP
AdjEPS (INR)
Adj.EPSGr(%)
BV/Sh(INR)
RoE (%)
RoCE (%)
Valuations
P/E (x)
P/BV (x)
EV/EBITDA(x)
Div. Yield (%)
67.1 153.7
12.0
11.6
13.3
12.1
41.9
10.1
9.6
41.9
22.2
6.9
7.1
22.2
176.2 171.6 183.0 198.3
24.1
2.8
10.0
192.1
55.9
46.3
9.9
23.1
1.2
4.4
50.4
8.2
45.9
28.5
4.6
16.0
66.4
27.4
5.9
35.8
8.6
30.1
88.4
96.5
37.0
9.0
-56.4 267.3
Key monitorables
Data revenue performance (we expect 2.3% QoQ growth).
Data EBITDA margin (we expect ~40bp QoQ improvement).
67.1 153.7
Cons. Quarterly Earning Model
Y/E March
Revenue from operations
YoY Change (%)
Total Expenditure
EBITDA
Margins (%)
Depreciation
Interest
Other Income
PBT before EO expense
Exceptional expense
PBT
Tax
Rate (%)
Minority Int & P/L of Asso. Cos.
Reported PAT
Adj PAT
YoY Change (%)
Margins (%)
E: MOSL Estimates
1Q
44,569
-14.0
37,849
6,720
15.1
4,660
933
954
2,081
0
2,081
734
35.3
-6
1,353
1,353
212.5
3.0
FY17
2Q
3Q
4Q
45,091 43,601 42,937
-12.1
-14.5
-16.5
38,466 37,910 37,914
6,625
5,691
5,024
14.7
13.1
11.7
4,644
4,677
4,677
960
999
780
728
909
1,012
1,750
924
578
0
0 10,633
1,750
924 -10,055
899
923
-192
51.4
99.9
1.9
-5
-17
-49
856
18 -9,815
856
18
616
1,321.3
-91.9
136.0
1.9
0.0
1.4
1Q
43,100
-3.3
37,514
5,586
13.0
4,447
761
444
822
0
822
461
56.0
39
322
322
-76.2
0.7
FY18
2Q
3QE
42,176 42,684
-6.5
-2.1
36,531 36,951
5,645
5,733
13.4
13.4
4,837
4,998
877
699
292
354
223
390
2,134
0
-1,911
390
588
129
-30.8
33.0
1
13
-2,500
249
291
249
-66.0 1,297.8
0.7
0.6
FY17
4QE
43,626 1,76,197
1.6
-2.9
37,539 1,52,138
6,087
24,059
14.0
13.7
5,158
18,658
687
3,672
308
3,603
550
5,332
0
10,633
550
-5,301
182
2,364
33.0
-44.6
-9
-25
378
-7,640
378
2,843
-38.6
192.1
0.9
1.6
(INR m)
FY18E
1,71,587
-2.6
1,48,535
23,052
13.4
19,439
3,023
1,397
1,986
2,134
-148
1,359
-917.3
43
-1,551
1,240
-56.4
0.7
8 February 2018
35

December 2017 Results Preview | Sector: Pharmaceutical
Torrent Pharmaceuticals
Bloomberg
Equity Shares (m)
M. Cap. (INR b)/(USD b)
52-Week Range (INR)
1,6,12 Rel Perf. (%)
TRP IN
169.2
233 / 3.6
1572 / 1144
5 / 5 / -24
CMP: INR1,379 TP:INR1,400 (+2%)
Neutral
Financial Snapshot (INR Billion)
y/e march
2017 2018E 2019E 2020E
Sales
EBITDA
NP
EPS (INR)
EPS Gro. (%)
BV/Sh. (INR)
RoE (%)
RoCE (%)
Valuations
P/E (x)
P/BV (x)
EV/EBITDA (x)
D. Yield (%)
25.0
5.4
17.9
1.2
27.8
4.8
16.6
1.1
22.5
4.2
11.9
1.3
17.6
3.6
9.9
1.7
58.6
13.8
9.3
55.2
-7.7
23.8
18.6
62.4
14.5
8.4
49.7
-9.9
18.2
15.4
77.9
19.9
10.4
61.4
23.6
19.9
18.7
88.5
23.0
13.3
78.5
27.9
22.2
19.9
257.1 288.8 328.0 378.2
We expect Torrent Pharmaceuticals (TRP) to post ~10% YoY
growth in 3QFY18 reported sales to INR15.5b. US business is
expected to decline ~13% YoY owing to continued pressure due to
increased competition, while India business is expected to
witness 17% YoY growth with successful integration of Elder’s
portfolio.
Reported EBITDA is likely to increase 15% YoY to INR3.6b, with
marginal increase in EBITDA margin by ~100bp YoY.
Although EBITDA is expected to increase, we expect PAT to
remain flattish at INR2.1b due to a higher tax rate at 20%, as
against 6.5% in 3QFY17, and increase in depreciation cost.
Although TRP remains one of the better plays on India’s growth
story (because of chronic heavy portfolio and one of the best
margins), lack of growth catalyst in near term will keep the stock
range bound. Our TP is INR1,400@20x 1H FY20E PER.
Contribution of Elder Pharma portfolio and growth strategy.
Performance of Brazilian operations amid market pressure.
Outlook on future ANDA launches.
Update on the recent acquisition of Unichem’s India business
Key issues to watch out
Quarterly Performance
Y/E March
INR m
Net Revenues
YoY Change (%)
EBITDA
Margins (%)
Depreciation
Interest
Other Income
PBT before EO Expense
Extra-Ord Expense
PBT after EO Expense
Tax
Rate (%)
Reported PAT
YoY Change (%)
Margins (%)
E: MOSL Estimates
1Q
15,070
-22.6
4,370
29.0
680
490
260
3,460
0
3,460
540
15.6
2,920
-35.0
19.4
FY17
2Q
14,060
-27.8
3,300
23.5
690
510
430
2,530
0
2,530
460
18.2
2,070
-53.9
14.7
3Q
14,130
-8.2
3,160
22.4
730
480
500
2,450
0
2,450
160
6.5
2,290
-34.2
16.2
4Q
13,810
-7.9
2,950
21.4
970
580
1,040
2,440
0
2,440
380
15.6
2,060
-42.3
14.9
1Q
13,480
-10.6
2,970
22.0
800
560
1,050
2,660
0
2,660
780
29.3
1,880
-35.6
13.9
FY18E
2Q
14,290
1.6
3,290
23.0
840
510
780
2,720
0
2,720
680
25.0
2,040
-30.1
14.3
3QE
15,516
9.8
3,624
23.4
840
550
375
2,609
0
2,609
522
20.0
2,087
0.8
13.5
4QE
18,878
36.7
4,660
24.7
953
1,114
195
2,788
0
2,788
389
14.0
2,399
4.8
12.7
(INR Million)
FY17
58,570
-12.3
13,774
23.5
3,070
2,060
2,230
10,874
0
10,874
1,540
14.2
9,334
-49.9
15.9
FY18E
62,423
6.6
14,545
23.3
3,433
2,734
2,400
10,778
0
10,778
2,371
22.0
8,406
-9.9
13.5
8 February 2018
36

In conversation
1. TVS MOTOR: Will be seen to be a young, aspirational brand;
Sudarshan Venu, Joint MD
Scooters account for a third of company’s business and have a market share of
17-18%. Company’s aspiration is to continue to gain market share - plan to
launch two scooters this year.
NTORQ is first foray in the 125-cc segment. Marks the launch of an exclusive
technology platform — TVS SmartXonnect — making it India's first connected
scooter with a connected cluster including satellite navigation. Looking at
15,000 to 20,000 vehicle sales in a month.
Company always puts the customer first and will continue to do so. Will focus on
the market as a whole with launches in many segments. Would also be
launching the new Apache 160 soon.
This fiscal year, the investment has moved up to Rs 650 crore. Continue to invest
as required. For 2018- 2019, will be investing Rs 500 crore, which will be used in
investments behind tech, capacity building and maintenance.
Electric is the future and investing on it. Company is working on both electric
and hybrid options. Company also has an ethanol-based Apache, and have
electric and hybrid scooters available. One can expect the electric scooter
launch soon.
2. CASTROL: Expect 3-5% growth in CV lubricants segment over
long-term; Rashmi Joshi, CFO and Whole Time Director
Have delivered remarkably well despite touch operating environment during
2017 and growth strategy is on track.
Have gained momentum in Q4 and saw volume growth across categories.
Another price increase will depend on crude movement.
Expect crude to be range bound at USD 55-60/bbl for the year.
50 percent of lubricant market comes from commercial vehicles. Therefore,
expect 3-5% growth in the commercial vehicle lubricants segment over long-
term.
Continue to hold 20 percent market share.
3. THERMAX: Order intake good; consumer cos placing orders,
see traction in chemical Ind; MS Unnikrishnan, MD
In the quarter the order intake was very positive. For the first 9 months of the
fiscal year the order intake has gone up by 47 percent and the order book has
gone up by 27 percent. The enquiry pipeline is also improving. The revenues for
the company in Q3 were good.
Consumption sector companies have started placing orders. In the medium-
sized projects there has been traction in chemical and fertilizer industry.
In the current quarter, the company has picked large orders from refinery sector
for the Bharat VI quality improvement programme.
There is also positive news coming in from North America and Europe despite
crude oil prices on the rise.
8 February 2018
37

4. KEC INTERNATIONAL: Confident of achieving 10-15% revenue
growth in FY18; Rajeev Aggarwal, CFO
Revenue growth led by higher execution order momentum continues to be
strong.
Confident of achieving 10-15 percent revenue growth in FY18.
Seeing traction in cable business post goods and services tax (GST) rate
reduction.
Expect 5-10 percent cable business growth in Q4.
5. GULF OIL LUBRICANTS : Chennai plant to add capacity; diesel
engine oil biz seeing growth; Ravi Chawla, Managing Director
Volumes this quarter compared to same quarter last year look very good on
back of base effect of demonetisation.
The volume growth usually trends around 11-12 percent. However, going
forward hope to achieve closer to 22 percent growth.
The company has seen a double–digit growth in diesel engine oils, which is 35-
40 percent of the portfolio. Usually grows in single-digits.
Similarly, motorcycle which is around 14-15 percent has gone to 35 percent this
quarter. Demand scenario is very positive in the market.
Hope to maintain margins around 17-18 percent. Company has added a new
plant in Chennai, which will add capacity of 40,000 Kilo Litre (KL), which sets up
the company to cater to new customers, and look at new segments which so far
had lower presence.
Moreover, as distribution grows, company plans to add new products like
greases, coolants.
8 February 2018
38

From the think tank
1. Farmers need economic freedom
Since this was a pre-election Union budget, it was expected to cater prominently
to the voting constituency most in need of supportive signals. After the Gujarat
election, it was clear that the rural and agriculture sectors would receive greater
attention. Some commentators recalled the fate of the former chief minister of
undivided Andhra Pradesh, who received a drubbing in the 2004 election,
presumably because he neglected the rural and agriculture constituency. All
election analyses are inherently flawed, and outcomes gloriously uncertain, but
it’s accepted wisdom that the software magic in Hyderabad could not prevent the
backlash from the hinterland in 2004. Cut to the present, and we find farm
incomes have virtually stagnated for the past four years, mostly owing to falling
prices, an output glut, large untimely imports and demonetisation.
2. India’s tax collections are in line with its GDP
Finance minister Arun Jaitley has, on more than one occasion, said that India is a
nation of poor tax compliance, and that characterisation is also in keeping with
the large estimates of the country’s black economy. What really matters,
however, is whether India is the laggard when it comes to poor compliance or
whether, once you account for India’s low per capita income, the tax ratios look
as bad; equally important, is the role of tax policy in this state of affairs. The
Economic Survey of 2016 had some interesting points to make. In its words, “a
simple comparison of aggregates with other countries indicates that India
under-taxes and under-spends”, but “controlling for the level of economic
development, India neither under-taxes nor under-spends”.
3. Slower deficit reduction raises risk of rate hikes
We had hoped that the FY18-19 Union budget would surprise markets positively by
setting a fiscal deficit target of 3% of gross domestic product (GDP). Instead, the
authorities chose to adopt a slower consolidation agenda to support the ongoing
recovery in growth; targeting fiscal deficit at 3.3% of GDP for FY19, with an upward
revised 3.5% of GDP in FY18. The FY19 budget targets revenue at 9.7% of GDP,
unchanged from the likely FY18 out-turn, while total expenditure is expected to
reduce to 13% of GDP (from 13.2% of GDP in FY18). The revenue estimates are
broadly realistic and credible; indeed, revenue as a share of GDP is expected to
remain unchanged at 9.7%, while nominal GDP growth is expected to improve to
11.5% year-on-year (y-o-y) in FY19 (from 9.5-10% y-o-y in FY18). The authorities
have targeted a 0.3% percentage point GDP increase in net tax revenue (to 7.9% of
GDP in FY19 vs 7.6% of GDP in FY18), but total revenue remains unchanged at 9.7%
of GDP, as non-tax revenue is estimated to be lower by 0.3% percentage points of
GDP in FY19 compared to FY18 (1.8% of GDP vs 2.1% of GDP).
8 February 2018
39

4. Making sense of the global rout
The global equity markets have behaved like a petulant drug addict who has been
denied his daily fix of easy money. The prospect of monetary policy normalization
in the US has pulled down share prices at a time when the global economy is in the
early stages of the strongest synchronized expansion since the financial crisis. This
paradox of a sharp market correction in the midst of an economic expansion
underlines the influence that extraordinary monetary policy has had on asset
prices over the past decade. It is too early to either say why global markets have
suddenly reversed course or whether the recent tumble is just a bull market
correction rather than something deeper.
International
5. Volatility’s return is a lifeline for becalmed bankers
There’s a silver lining to this week’s stock market rout: the likely end of Wall
Street’s Asia woes. The return of volatility will help buoy trading income for
investment banks from Goldman Sachs Group Inc. to Deutsche Bank AG, which
have slimmed down their businesses in response to a prolonged period of calm.
Asia-Pacific revenue at investment banks dropped for a third year, to $25.7
billion in 2017 from $27.4 billion in 2016 and $29.6 billion in 2015, according to
data from Coalition Development Ltd, a London-based analytics company. A
global slump in fixed-income trading has weighed on fees, with the end of the
China M&A boom delivering an added Asian drag. What investment banks
needed was good old-fashioned uncertainty, and this week’s stock market
tumble seems to have delivered that. FICC, or fixed income, currency and
commodities trading, has typically been the main driver of banks’ revenue.
8 February 2018
40

Click excel icon
for detailed
valuation guide
Valuation snapshot
Company
Automobiles
Amara Raja
Ashok Ley.
Bajaj Auto
Bharat Forge
Bosch
CEAT
Eicher Mot.
Endurance Tech.
Escorts
Exide Ind
Hero Moto
M&M
Mahindra CIE
Maruti Suzuki
Motherson Sumi
Tata Motors
TVS Motor
Aggregate
Banks - Private
AU Small Finance
Axis Bank
DCB Bank
Equitas Hold.
Federal Bank
HDFC Bank
ICICI Bank
IDFC Bank
IndusInd
J&K Bank
Kotak Mah. Bk
RBL Bank
South Indian
Yes Bank
Aggregate
Banks - PSU
BOB
BOI
Canara
Indian Bk
PNB
SBI
Union Bk
Aggregate
NBFCs
Aditya Birla Cap
Bajaj Fin.
Capital First
Cholaman.Inv.&Fn
Dewan Hsg.
GRUH Fin.
HDFC
HDFC Stand. Life
Indiabulls Hsg
L&T Fin Holdings
Reco
Buy
Buy
Buy
Buy
Neutral
Buy
Buy
Buy
Sell
Buy
Neutral
Buy
Buy
Buy
Buy
Buy
Neutral
CMP TP % Upside
EPS (INR)
EPS Gr. YoY (%)
P/E (x)
P/B (x)
ROE (%)
(INR) (INR) Downside FY18E FY19E FY20E FY18E FY19E FY20E FY18E FY19E FY18E FY19E FY18E FY19E
790 984
133 158
3137 4031
706 859
19241 21951
1524 1899
27998 34678
1182 1554
909 714
204 268
3564 3986
747 881
214 297
8920 10972
355 458
378 515
648 741
24
19
28
22
14
25
24
32
-21
31
12
18
39
23
29
36
14
28.7 34.2 41.1
4.9
6.2
7.7
150.3 174.1 201.6
19.4 26.3 34.4
459.1 595.2 731.7
63.1 84.7 111.7
823.8 1,071.3 1,343.8
27.6 38.5 51.8
36.6 45.6 54.9
8.0 10.2 11.6
185.0 200.1 212.6
37.6 44.3 48.8
9.0 12.0 14.9
275.6 369.9 471.3
10.0 14.4 18.3
28.0 57.9 58.5
13.9 25.1 33.9
2.6
7.8
6.5
48.1
-3.0
-32.3
33.6
17.5
90.4
-1.3
9.4
37.5
94.3
10.8
30.0
41.1
18.5
20.8
-42.8
-4.4
5.3
-81.6
13.3
18.0
-18.3
0.4
27.0
LP
22.0
33.0
-22.6
24.8
15.6
18.9
26.7
15.8
35.9
29.6
34.1
30.1
39.6
24.3
27.5
8.2
17.6
33.0
34.2
43.9
107.1
80.5
45.1
43.9
111.4
22.2
616.0
19.1
20.3
32.0
7.0
29.2
41.6
26.9
43.7
97.1
31.2
35.1
20.2
24.0
15.8
30.5
22.9
31.9
25.4
34.5
20.6
13.6
6.2
10.1
24.3
27.4
27.2
1.1
34.9
14.6
27.5
27.1
20.9
36.4
41.9
24.1
34.0
42.8
24.8
25.5
19.3
19.8
23.8
32.4
35.4
13.5
46.5
24.9
23.1
21.4
18.0
26.8
32.3
18.0
26.1
30.7
20.0
20.0
17.8
16.9
17.9
24.1
24.6
6.5
25.8
17.1
39.7
18.0
18.3
21.0
14.4
23.2
20.2
16.2
21.1
5.7
24.9
21.1
7.1
14.0
20.1
6.8
28.7
8.4
8.6
18.5
15.0
20.8
13.2
30.1
26.6
15.2
17.6
10.5
43.6
36.4
80.8
12.1
14.4
4.5
5.7
4.8
6.9
6.1
2.3
10.7
8.1
3.7
3.2
6.1
3.1
2.2
6.5
7.7
1.8
10.6
4.5
7.5
2.1
2.0
2.1
1.5
4.1
2.5
1.1
4.3
0.7
4.2
3.1
1.0
3.0
3.0
0.9
0.6
0.7
1.0
0.9
1.2
0.6
0.9
3.9
4.9
4.3
5.8
5.5
2.1
8.1
6.7
3.2
2.9
5.3
2.8
2.0
5.6
6.3
1.4
8.0
3.7
6.3
1.9
1.8
1.9
1.4
3.6
2.3
1.1
3.7
0.7
3.6
2.7
0.9
2.6
2.7
17.6
22.1
24.2
20.3
15.2
10.1
36.0
20.5
17.2
12.6
34.0
14.1
9.9
19.8
23.4
14.7
24.9
18.0
14.1
5.9
10.1
1.4
9.4
16.7
8.1
6.8
17.0
8.9
13.2
12.2
6.9
17.6
11.0
18.1
24.7
25.3
23.4
17.9
12.3
35.2
23.8
17.3
14.4
32.0
14.6
11.8
22.8
28.1
24.3
35.3
21.8
17.2
11.1
10.4
9.5
9.8
16.6
10.1
6.9
19.1
11.9
14.3
13.8
12.7
19.9
13.3
Neutral
Buy
Neutral
Buy
Buy
Buy
Buy
Neutral
Buy
Buy
Buy
Buy
Buy
Buy
607
559
165
140
93
1871
332
52
1663
70
1035
479
27
333
705
710
188
205
149
2350
405
65
2076
100
1220
680
38
410
16
27
14
47
60
26
22
25
25
44
18
42
41
23
10.6
14.7
7.4
0.9
5.5
67.0
12.5
3.0
61.1
8.6
32.7
15.8
1.9
18.2
15.3
31.0
9.0
6.6
6.5
80.6
16.5
3.2
78.9
12.2
41.5
22.7
3.8
23.9
21.6
44.6
10.9
10.2
8.2
100.9
21.0
3.9
101.4
16.8
54.2
30.3
4.9
30.8
41.1 57.1
43.7 38.1
21.4 22.4
53.4 150.6
26.1 17.1
25.2 27.9
27.6 26.6
21.9 17.3
28.5 27.2
37.7 8.1
30.5 31.6
33.2 30.3
30.4 14.0
28.8 18.3
29.8 27.1
31.1
108.6
89.1
10.3
84.7
78.6
158.0
73.4
42.8
34.2
27.5
21.5
26.1
23.4
16.3
25.2
22.1
23.2
8.6
NM
24.9
9.6
27.6
25.6
NM
32.3
44.1
36.0
19.8
20.9
13.4
51.8
41.5
92.1
14.0
21.2
Buy
Neutral
Neutral
Buy
Buy
Buy
Neutral
154
141
314
330
157
293
123
217
175
415
438
215
415
145
41
24
32
33
37
42
17
17.9
-1.2
12.6
34.4
5.7
11.5
-40.5
22.6
4.9
37.3
38.3
8.5
19.6
5.9
29.7 199.6 26.2
10.3 Loss
LP
70.6 -33.0 196.8
42.3 17.6 11.4
15.7
-8.8 49.5
34.9 3,751.8 70.8
15.3
PL
LP
170.2 145.2
NA
42.3
38.9
34.5
26.5
22.1
8.0
5.4
32.8
42.2
46.5
35.4
30.2
18.7
26.8
18.8
14.0
13.9
15.4
47.1
0.8 6.4 9.4
0.6 -0.4 1.8
0.6 2.3 6.8
0.9 10.9 11.2
0.8 2.9 4.3
1.1 5.3 8.0
0.5 -16.7 2.7
0.8 2.7 6.1
Buy
Buy
Buy
Buy
Buy
Neutral
Buy
Buy
Buy
Buy
164
1641
677
1293
500
515
1785
434
1271
158
231
2330
960
1520
720
540
2260
485
1630
240
41
42
42
18
44
5
27
12
28
52
3.7
5.4
7.8
45.6 61.7 82.8
34.2 44.6 56.8
61.8 73.3 89.1
37.4 47.5 59.9
9.9 11.8 14.6
43.0 49.0 57.0
4.7
5.4
6.7
91.1 105.1 128.3
7.4 11.0 13.5
4.2 3.2 12.5 12.3
5.8 4.9 20.1 19.8
2.6 2.2 13.7 15.6
3.9 3.3 20.4 20.2
1.8 1.6 14.0 15.8
15.5 12.8 32.9 32.2
4.9 4.2 17.6 16.5
2.9 2.4 21.7 21.1
3.9 3.5 29.9 30.4
3.1 2.6 15.9 19.7
8 February 2018
41

Click excel icon
for detailed
valuation guide
CMP
(INR)
504
594
441
403
1239
598
1961
1323
TP % Upside
EPS (INR)
EPS Gr. YoY (%)
(INR) Downside FY18E FY19E FY20E FY18E FY19E FY20E
608
21
38.5 44.3 52.6
0.6 15.2 18.7
750
26
18.6 24.2 30.0 24.0 29.6 24.1
575
30
13.9 19.2 23.0 95.8 38.7 19.4
515
28
42.6 42.0 48.1 44.4 -1.4 14.5
1750
41
51.4 69.0 92.3 62.4 34.4 33.7
800
34
36.0 41.9 50.0 23.5 16.5 19.3
2500
27
114.2 140.0 166.8 35.4 22.6 19.2
1750
32
78.7 104.8 125.9 42.1 33.1 20.2
28.2 22.6 22.8
1230
210
78
685
305
90
1040
440
640
385
1650
1285
1120
1150
745
580
-22
33
-17
-6
26
5
27
14
27
6
24
6
7
-3
33
-3
19.0
7.1
2.9
17.6
5.1
1.4
23.2
9.4
11.4
16.1
49.0
19.8
26.2
28.4
34.5
17.5
28.3
7.9
2.3
25.1
6.5
2.3
31.3
11.2
13.9
18.7
58.1
30.4
31.3
34.5
37.2
19.6
34.1
8.4
3.5
33.3
7.7
3.0
37.1
14.0
17.2
24.1
69.3
34.6
39.3
38.0
41.9
22.4
-3.4
12.6
119.0
37.0
9.8
-64.9
-12.4
64.4
19.4
35.5
15.7
10.9
27.3
-8.0
15.2
13.4
15.9
48.7
12.0
-19.9
42.0
26.1
57.4
34.6
19.4
21.6
16.6
18.8
53.8
19.5
21.6
8.0
12.0
18.7
20.4
6.3
47.1
33.0
18.4
31.9
18.6
24.5
24.1
28.5
19.2
13.8
25.4
10.1
12.6
13.8
19.3
Valuation snapshot
P/E (x)
P/B (x)
ROE (%)
FY18E FY19E FY18E FY19E FY18E FY19E
13.1 11.4
2.0 1.8 16.4 16.5
31.9 24.6
4.5 3.9 20.2 17.0
31.8 22.9
3.0 2.8 10.9 12.5
9.4
9.6
2.1 1.8 23.8 19.9
24.1 18.0
3.3 2.9 14.7 17.4
16.6 14.3
2.8 2.4 18.1 17.9
17.2 14.0
2.3 2.0 14.1 15.2
16.8 12.6
2.4 2.1 14.9 17.5
28.3 23.1
4.2 3.6 15.0 15.8
83.1
22.3
32.0
41.5
47.3
59.5
35.3
41.1
44.1
22.6
27.2
61.6
39.8
41.7
16.3
34.2
32.9
40.0
32.7
32.0
44.5
12.9
26.2
23.2
43.4
29.9
46.0
44.4
35.8
20.2
40.0
45.9
31.2
51.9
53.8
45.8
44.7
46.7
48.3
39.0
56.9
30.7
43.6
55.9
19.9
40.0
29.2
37.5
37.8
26.2
34.4
36.2
19.4
22.9
40.0
33.3
34.3
15.1
30.6
27.7
31.9
23.5
18.1
32.3
9.1
14.5
18.2
22.0
23.8
27.6
24.5
17.8
13.2
38.8
30.0
22.4
43.7
42.5
38.8
37.5
35.8
42.0
34.4
47.1
27.0
33.1
9.1 8.1 10.9 14.5
4.0 3.6 17.9 18.0
1.1 1.0 3.3 2.6
8.7 7.9 21.5 28.4
20.7 17.0 50.6 49.8
1.3 1.2 2.1 3.3
5.7 5.3 16.7 20.8
8.4 7.3 21.8 22.6
8.5 7.5 19.4 20.8
4.9 4.1 21.6 21.0
3.4 3.1 13.0 14.1
5.6 5.2 9.1 12.9
7.8 6.6 21.4 21.5
4.8 4.3 12.0 13.3
2.7 2.3 17.5 16.4
5.3 4.7 16.5 16.3
3.6 3.3 11.0 12.0
2.4
3.3
2.3
4.4
1.4
0.9
3.5
3.2
4.1
3.0
5.8
2.3
2.1
6.5
4.3
3.1
13.8
16.7
22.3
10.6
12.7
10.2
7.7
43.2
6.7
6.1
2.3
3.1
2.1
3.9
1.2
0.9
3.0
2.8
3.6
2.7
4.8
2.0
1.8
5.7
3.8
2.8
12.2
13.6
20.9
9.5
11.2
8.9
7.0
43.0
6.2
6.0
6.2
10.3
7.3
10.3
11.5
3.5
16.4
7.7
14.4
6.6
13.7
6.5
10.8
17.6
9.7
9.9
26.9
34.0
49.9
25.4
29.0
23.6
20.7
76.5
22.8
13.8
7.4
13.7
12.0
12.7
14.5
6.0
17.8
13.8
15.9
10.3
21.3
12.0
14.6
15.7
13.5
12.4
29.6
35.2
55.5
26.7
33.2
22.6
21.4
91.4
23.8
18.3
Company
LIC Hsg Fin
MAS Financial
M&M Fin.
Muthoot Fin
PNB Housing
Repco Home
Shriram City Union
Shriram Trans.
Aggregate
Capital Goods
ABB
Bharat Elec.
BHEL
Blue Star
CG Cons. Elec.
CG Power & Indu.
Cummins
GE T&D
Havells
K E C Intl
L&T
Siemens
Solar Ind
Thermax
Va Tech Wab.
Voltas
Aggregate
Cement
Ambuja Cem.
ACC
Birla Corp.
Dalmia Bharat
Grasim Inds.
India Cem
J K Cements
JK Lakshmi Ce
Ramco Cem
Orient Cem
Prism Cem
Sagar Cements
Sanghi Inds.
Shree Cem
Ultratech
Aggregate
Consumer
Asian Paints
Britannia
Colgate
Dabur
Emami
Godrej Cons.
GSK Cons.
HUL
ITC
Jyothy Lab
Reco
Neutral
Buy
Buy
Neutral
Buy
Buy
Buy
Buy
Sell
Buy
Sell
Neutral
Buy
Neutral
Buy
Neutral
Buy
Neutral
Buy
Neutral
Neutral
Neutral
Buy
Neutral
1581
158
94
732
243
86
820
387
503
363
1333
1216
1045
1183
562
600
Neutral
Neutral
Buy
Buy
Neutral
Neutral
Buy
Buy
Buy
Buy
Buy
Not Rated
Buy
Buy
Buy
245 275
1590 1795
1029 1435
2705 3568
1060 1286
153 188
1030 1343
406 470
727 847
151 179
122 130
901
-
117 157
16920 22424
4081 5131
12
13
40
32
21
23
30
16
16
18
7
34
33
26
6.1
48.6
32.2
60.8
81.9
5.8
44.4
9.4
24.3
3.3
2.7
25.2
5.8
423.0
89.0
7.7
67.8
56.7
83.7
116.8
10.5
56.5
18.5
30.5
5.5
5.0
50.6
8.9
435.8
136.2
9.8
25.5 25.3 27.3
80.4 34.5 39.5 18.7
61.6 12.8 76.1 8.6
111.7 56.8 37.6 33.5
133.5 20.8 42.5 14.3
12.1
3.9 80.4 14.9
76.9 31.8 27.3 36.0
25.0 34.7 97.2 35.2
38.8 -10.8 25.3 27.2
10.3
LP
66.8 88.7
6.6 905.1 81.3 32.7
70.6
LP 101.0 39.7
12.0 102.0 53.5 34.6
724.2 10.0 3.0 66.2
178.4 -7.4 53.0 31.1
16.0 39.2 27.3
2.7
14.7
12.9
4.5
-9.6
10.6
3.0
17.6
6.6
-27.7
18.8
26.4
17.9
19.2
30.5
15.1
13.4
20.7
13.7
32.0
20.2
25.2
19.7
16.2
19.1
14.2
13.2
18.1
12.4
24.2
Neutral
Buy
Buy
Buy
Buy
Neutral
Neutral
Buy
Neutral
Neutral
1121
4546
1098
339
1121
1011
6272
1314
275
354
1270
6098
1365
415
1505
1065
5785
1585
278
380
13
34
24
23
34
5
-8
21
1
7
21.6
84.5
24.0
7.6
24.0
20.9
160.8
23.1
9.0
8.1
25.6 30.8
106.9 133.8
28.3 33.8
9.0
10.5
31.3 37.3
24.1 27.5
182.3 206.5
27.9 32.9
10.2 11.4
10.7 13.3
8 February 2018
42

Click excel icon
for detailed
valuation guide
CMP TP % Upside
EPS (INR)
EPS Gr. YoY (%)
Reco
(INR) (INR) Downside FY18E FY19E FY20E FY18E FY19E FY20E
Neutral
300 355
18
6.2
7.7
9.3
-1.2 24.3 20.2
Neutral
7014 8173
17
128.6 146.9 177.7 4.0 14.2 20.9
Buy
19328 28650
48
296.6 413.1 544.5 24.3 39.3 31.8
Neutral
276 314
14
8.9 12.4 16.8 147.7 38.7 35.6
Buy
866 1050
21
17.7 20.8 24.1
5.7 17.8 15.5
Neutral
9060 9303
3
142.1 171.3 200.8 6.9 20.5 17.3
Not Rated 184
-
3.5
6.4
9.7
-2.0 83.8 52.1
Buy
1095 1380
26
14.1 17.4 22.9 62.0 23.9 31.2
Neutral
3122 3515
13
32.9 57.0 78.7 22.9 73.4 38.1
8.5 18.7 17.2
Neutral
Buy
Buy
Buy
Neutral
Buy
Neutral
Neutral
Neutral
Buy
Neutral
Buy
Neutral
Neutral
Buy
Buy
Buy
Buy
Buy
Buy
Buy
Neutral
537
2152
1330
617
591
396
569
1012
2112
124
570
119
2440
574
1007
500
808
4800
509
694
549
1371
555
2500
1840
900
600
555
600
1100
2575
185
650
200
2500
550
1110
631
940
5000
797
1074
610
1400
3
16
38
46
2
40
5
9
22
50
14
68
2
-4
10
26
16
4
56
55
11
2
23.9
68.0
54.0
44.6
7.6
17.5
22.6
32.9
68.9
1.9
37.9
6.8
49.1
17.8
47.8
19.0
31.5
140.1
18.1
36.3
14.5
49.7
25.3 30.1
89.5 109.1
65.8 81.4
50.3 55.3
10.9 19.8
23.7 26.4
27.0 33.3
44.0 52.7
113.2 145.0
4.9
8.4
42.8 50.5
9.0
13.0
54.9 61.1
26.2 35.2
62.6 72.5
29.1 35.7
40.2 54.1
157.4 180.5
29.9 37.8
62.5 77.9
22.1 27.5
61.4 78.5
10.8
-8.9
-5.8
13.5
-25.3
23.0
42.3
-17.7
-5.1
-81.8
-3.4
-5.4
42.9
10.9
29.5
7.0
-44.4
8.5
29.3
12.6
-44.5
-9.9
-14.1
LP
12.5
11.5
29.3
5.9
31.7
21.9
12.8
43.1
35.8
19.5
33.9
64.2
160.8
12.9
31.1
11.9
47.0
30.9
52.7
27.7
12.4
65.1
71.9
52.0
23.6
33.0
19.0
21.9
23.6
9.9
81.5
11.3
23.1
19.7
28.0
71.9
18.0
45.1
11.2
34.2
15.8
22.8
34.6
14.7
26.2
24.7
24.6
27.9
23.4
Valuation snapshot
P/E (x)
FY18E FY19E
48.4 38.9
54.5 47.7
65.2 46.8
30.9 22.2
49.0 41.6
63.8 52.9
52.9 28.8
77.8 62.8
95.0 54.8
45.0 37.9
22.5
31.7
24.6
13.8
77.6
22.7
25.2
30.8
30.6
65.7
15.0
17.4
49.7
32.2
21.0
26.3
25.7
34.3
28.1
19.1
37.8
27.6
27.6
21.2
24.0
20.2
12.3
54.2
16.7
21.0
23.0
18.7
25.2
13.3
13.3
44.4
21.9
16.1
17.2
20.1
30.5
17.0
11.1
24.9
22.3
20.8
23.8
9.4
21.1
27.6
15.7
14.3
26.1
11.9
21.8
P/B (x)
ROE (%)
FY18E FY19E FY18E FY19E
14.7 13.9 32.3 36.8
20.3 18.4 39.1 40.4
25.9 20.8 39.8 44.4
3.2 2.8 10.8 13.3
11.4 9.8 25.2 25.4
35.8 30.0 61.2 61.8
2.5 2.4 4.9 8.5
10.9 9.5 14.9 16.2
16.4 12.2 17.3 22.3
12.1 10.9 26.8 28.7
4.5 3.9 21.8 19.7
5.0 4.3 17.0 19.4
6.0 4.8 26.4 25.7
3.1 2.5 24.6 22.3
6.9 6.3 8.9 11.6
4.9 3.9 23.4 26.1
3.2 2.8 12.8 13.5
5.2 4.6 16.6 21.2
2.7 2.4 9.2 13.7
1.0 1.0 1.6 3.9
2.9 2.4 19.6 18.4
2.2 1.9 14.2 15.4
11.9 13.6 23.9 30.5
2.7 2.5 8.8 11.9
3.8 3.1 19.7 21.4
3.5 2.9 14.1 18.3
2.5 2.3 10.2 12.0
5.9 5.4 17.2 17.7
3.9 3.2 14.7 20.5
2.1 1.7 11.4 17.0
3.4 3.1 9.3 13.2
4.7 4.2 18.2 19.9
3.6 3.2 13.0 15.2
2.2
1.3
4.1
3.7
2.1
2.3
3.5
2.3
3.1
2.0
1.2
3.4
3.3
1.9
2.1
3.3
2.1
2.9
5.5
14.1
19.1
13.7
12.3
14.1
11.2
9.2
11.1
8.9
12.9
17.5
12.6
12.0
15.4
12.9
18.2
13.2
Company
Marico
Nestle
Page Inds
Parag Milk
Pidilite Ind.
P&G Hygiene
Prabhat Dairy
United Brew
United Spirits
Aggregate
Healthcare
Alembic Phar
Alkem Lab
Ajanta Pharma
Aurobindo
Biocon
Cadila
Cipla
Divis Lab
Dr Reddy’s
Fortis Health
Glenmark
Granules
GSK Pharma
IPCA Labs
Jubilant Life
Laurus Labs
Lupin
Sanofi India
Shilpa Medicare
Strides Shasun
Sun Pharma
Torrent Pharma
Aggregate
Infrastructure
Ashoka Buildcon
IRB Infra
KNR Constructions
Sadbhav Engineering
Aggregate
Logistics
Allcargo Logistics
Concor
Gateway Distriparks
Aggregate
Media
Dish TV
D B Corp
Den Net.
Ent.Network
Hathway Cable
Hind. Media
HT Media
Jagran Prak.
Music Broadcast
Buy
Neutral
Buy
Buy
226
219
307
405
290
240
325
445
28
10
6
10
5.3
22.9
13.3
14.2
9.5
23.2
14.5
14.6
19.1
19.7
16.0
17.0
79.9 101.0 42.8
1.4 -15.1 9.6
9.0 10.0 23.0
3.5 16.4 28.6
17.1
17.4
32.0
24.8
28.0
Buy
Neutral
Buy
189 242
1339 1469
219 282
28
10
29
10.9
41.9
8.8
13.3
51.2
18.4
15.3
58.2
21.3
10.7 22.0 15.5
10.3 22.3 13.5
29.6 109.2 15.3
11.5 28.2 14.1
PL
-7.6
Loss
-27.7
Loss
0.2
59.3
-6.9
27.8
Buy
Buy
Neutral
Buy
Buy
Buy
Neutral
Buy
Buy
75
326
103
698
38
244
94
163
348
106
420
90
820
47
305
117
215
469
41
29
-13
18
25
25
25
32
35
0.0
18.8
-2.9
8.3
-0.2
25.9
11.8
9.9
8.2
1.3
23.0
0.1
16.4
0.8
28.8
12.1
12.5
13.5
2.9
27.6
4.0
28.7
2.0
32.4
12.7
15.2
17.8
LP 114.1 NM
56.3 16.7 12.9 -0.5 25.8
22.0 20.1 17.3 14.2
3.2 2.7 20.1 20.9
LP 5,545.2 NM 1,456.9 2.3 2.3 -6.3 0.2
98.0 75.7 84.4 42.6
3.7 3.5 4.5 8.4
LP 161.9 NM
49.5
2.7 2.5 -1.2 5.2
11.3 12.6 9.4
8.5
1.3 1.2 15.1 14.6
2.6
4.9
8.0
7.8
0.9 0.8 11.5 10.6
26.4 21.5 16.4 13.0
2.6 2.2 15.3 18.4
64.9 31.4 42.3 25.7
3.3 3.0 8.2 12.2
8 February 2018
43

Click excel icon
for detailed
valuation guide
CMP
(INR)
1380
101
20
931
580
Valuation snapshot
Company
PVR
Prime Focus
Siti Net.
Sun TV
Zee Ent.
Aggregate
Metals
Hindalco
Hind. Zinc
JSPL
JSW Steel
Nalco
NMDC
SAIL
Rain Industries
Vedanta
Tata Steel
Aggregate
Oil & Gas
BPCL
GAIL
Gujarat Gas
Gujarat St. Pet.
HPCL
IOC
IGL
Mahanagar Gas
MRPL
Oil India
ONGC
PLNG
Reliance Ind.
Aggregate
Retail
Jubilant Food
PC Jeweller
Titan Co.
Aggregate
Technology
Cyient
HCL Tech.
Hexaware
Infosys
KPIT Tech
L&T Infotech
Mindtree
Mphasis
NIIT Tech
Persistent Sys
Tata Elxsi
TCS
Tech Mah
Wipro
Zensar Tech
Aggregate
Reco
Buy
Buy
Neutral
Buy
Buy
TP % Upside
EPS (INR)
EPS Gr. YoY (%)
P/E (x)
P/B (x)
ROE (%)
(INR) Downside FY18E FY19E FY20E FY18E FY19E FY20E FY18E FY19E FY18E FY19E FY18E FY19E
1760
28
22.1 37.3 51.5
7.8 68.7 37.9 62.4 37.0
6.1 5.3 10.2 15.3
148
46
3.2
6.1
9.2 164.0 90.5 49.1 31.4 16.5
4.6 3.6 15.9 24.7
27
36
-0.9
0.1
0.6
Loss
LP 411.6 NM 156.8 3.8 3.7 -15.8 2.4
1155
24
28.1 35.7 41.8 13.0 27.0 17.3 33.1 26.1
8.4 7.6 26.4 30.7
705
22
13.7 17.6 21.0
2.1 28.7 19.3 42.4 32.9
7.2 6.1 18.2 20.0
14.9 39.7 27.4 36.9 26.4
5.3 4.6 14.3 17.5
344
354
361
339
81
215
75
492
416
858
40
23
43
17
14
66
-9
36
32
30
19.5
21.6
-11.5
20.7
4.6
14.3
-1.4
25.5
23.8
62.7
27.0
33.3
7.3
24.0
5.3
14.0
4.5
38.9
42.7
85.3
27.9
32.1
11.9
23.7
5.4
14.7
6.5
43.0
44.5
67.2
127.9
9.6
Loss
39.8
24.8
43.7
Loss
165.2
57.4
65.0
67.2
-15.3
15.8
28.2
41.4
-12.8
-3.9
14.4
23.6
-15.0
-11.7
16.7
32.3
19.6
7.3
186.2
44.4
38.8
48.6
18.1
3.1
20.1
2.6
0.8
18.5
31.5
12.9
17.4
14.4
30.8
-2.1
26.8
6.0
4.0
4.2
38.6 3.0
54.6 -3.8
LP
63.4
15.9 -1.0
13.1 2.4
-2.0
4.7
LP
44.8
52.3 10.7
79.4 4.2
36.0 -21.2
55.9 0.2
25.0
19.3
59.6
4.2
20.2
-1.5
15.2
-1.1
-7.7
37.7
21.8
11.3
11.8
13.7
29.6
26.6
27.0
27.2
12.1
3.8
-1.1
9.7
10.5
13.7
24.6
14.8
16.9
22.8
18.4
12.8
4.5
3.2
18.3
5.0
5.8
4.9
28.7
7.9
6.2
4.5
16.2
1.2
5.0
3.3
-3.1
21.4
13.7
6.4
31.3
27.6
24.1
26.0
13.2
7.5
13.8
11.2
29.1
15.2
17.2
8.3
16.2
14.3
18.2
9.3
16.6
14.7
33.1
11.1
12.6
13.4
NM
14.0
15.2
9.1
NM
14.2
13.2
10.5
14.4
11.7
17.7
41.7
16.3
11.2
10.1
29.1
17.9
9.2
12.0
9.9
16.3
14.8
12.4
65.9
24.6
62.5
50.9
16.7
15.2
21.6
17.2
17.5
19.7
21.9
19.0
18.7
17.6
26.4
22.6
15.4
16.1
17.1
19.0
9.1
8.7
34.8
12.1
13.5
9.3
18.4
9.3
7.4
7.7
9.3
9.3
14.8
26.1
15.6
9.3
10.2
25.3
18.1
10.0
8.7
8.1
14.7
13.2
10.9
50.8
19.5
49.2
40.0
14.9
14.6
21.9
15.7
15.9
17.3
17.6
16.6
16.0
14.3
22.3
20.1
14.7
15.6
14.4
18.1
1.7
4.3
0.8
2.6
1.3
1.7
0.9
3.2
1.8
1.8
1.8
2.6
1.9
6.3
2.3
2.5
1.7
5.9
4.6
1.7
0.9
1.1
3.8
1.8
1.6
1.4
3.3
0.8
2.2
1.2
1.5
0.9
2.4
1.6
1.5
1.5
2.2
1.8
5.3
2.0
2.2
1.5
5.0
4.2
1.5
0.9
1.0
3.2
1.6
1.5
14.0
30.8
-3.6
20.2
8.6
19.1
-1.5
25.2
14.1
18.0
12.1
24.0
11.2
16.1
14.7
24.5
17.5
22.0
27.3
20.2
8.0
10.9
25.3
12.9
13.3
16.8
42.7
2.3
19.5
9.2
17.2
5.0
29.7
23.1
21.0
16.7
25.4
12.4
22.0
13.7
25.1
15.4
21.4
24.4
16.2
10.5
12.8
23.6
13.1
13.8
Buy
Neutral
Buy
Buy
Neutral
Buy
Sell
Buy
Buy
Neutral
246
289
252
290
71
130
83
362
315
661
Buy
Sell
Buy
Neutral
Buy
Buy
Buy
Neutral
Neutral
Buy
Buy
Buy
Buy
477 632
462 371
859 1014
203 183
397 576
405 533
293 416
972 1219
116 114
358 420
190 234
246 312
894 1069
32
-20
18
-10
45
32
42
25
-1
17
23
27
20
40.9
26.1
20.6
12.5
35.5
40.2
10.1
54.4
12.6
29.8
19.2
15.0
60.4
51.2
31.2
32.9
13.0
42.7
39.6
11.6
53.8
11.6
41.0
23.4
16.7
67.5
54.1
32.7
42.3
14.0
45.3
41.4
13.5
54.5
12.2
42.3
22.6
20.3
76.8
Neutral
Buy
Buy
1999 2185
380 685
784 990
9
80
26
30.3
15.4
12.5
39.3
19.5
15.9
51.6
24.9
19.8
14.8 15.1 22.5 29.8
3.9 3.3 16.9 18.4
13.3 12.3 23.4 25.9
9.8 8.9 19.2 22.2
2.9
3.7
5.4
4.0
2.4
5.6
4.5
3.2
3.0
3.0
8.5
7.1
3.1
2.8
2.5
4.8
2.6
3.4
4.5
3.4
2.1
4.5
4.0
3.0
2.7
2.9
6.8
6.1
2.7
2.4
2.2
4.2
17.4
25.1
26.6
24.3
14.3
32.1
19.9
15.3
16.1
17.8
36.0
30.4
20.6
17.2
15.7
25.0
17.8
23.9
22.4
23.1
13.8
29.0
24.0
18.7
17.6
21.0
33.8
32.9
19.5
16.7
16.4
23.0
Buy
Neutral
Neutral
Buy
Neutral
Buy
Buy
Neutral
Neutral
Buy
Buy
Neutral
Buy
Neutral
Buy
606
938
355
1109
211
1294
717
836
835
758
973
2955
603
289
924
675
950
270
1250
219
1400
725
800
800
900
1236
2700
700
300
1100
11
1
-24
13
4
8
1
-4
-4
19
27
-9
16
4
19
36.2
61.7
16.4
64.4
12.0
65.7
32.7
43.9
44.6
43.1
36.8
130.6
39.2
17.9
54.2
40.6 45.9
64.1 68.9
16.3 18.5
70.7 78.6
13.3 17.2
74.7 86.1
40.8 47.8
50.4 54.6
52.2 60.6
53.0 60.5
43.6 51.5
147.3 161.0
40.9 47.7
18.5 21.2
64.1 85.2
8 February 2018
44

Click excel icon
for detailed
valuation guide
Valuation snapshot
Company
Telecom
Bharti Airtel
Bharti Infratel
Idea Cellular
Tata Comm
Aggregate
Utiltites
Coal India
CESC
JSW Energy
NHPC
NTPC
Power Grid
Tata Power
Aggregate
Others
Arvind
Avenue Supermarts
Bata India
BSE
Castrol India
Coromandel Intl
Delta Corp
Eveready Inds.
Interglobe
Indo Count
Info Edge
Kaveri Seed
Manpasand
MCX
Monsanto
Navneet Education
Oberoi Realty
Quess Corp
PI Inds.
Piramal Enterp.
SRF
S H Kelkar
Team Lease Serv.
Trident
TTK Prestige
V-Guard
Reco
Buy
Neutral
Buy
Buy
CMP TP % Upside
EPS (INR)
EPS Gr. YoY (%)
P/E (x)
P/B (x)
ROE (%)
(INR) (INR) Downside FY18E FY19E FY20E FY18E FY19E FY20E FY18E FY19E FY18E FY19E FY18E FY19E
430
339
84
602
680
380
110
780
58
12
31
30
3.5
3.9
14.0 16.2
-11.9 -12.9
4.4 16.0
7.2
17.8
-11.7
30.1
-68.7
-6.1
Loss
-56.4
PL
23.7
71.7
11.4
-19.3
7.5
20.7
-0.5
14.4
12.2 84.4 123.5 110.1
16.5 9.7 24.3 20.8
Loss Loss NM
NM
267.3 88.4 138.3 37.6
Loss
LP -509.5 -5,650.3
45.0
14.7
-15.4
30.3
15.1
20.9
12.2
26.7
16.2
8.5
10.7
18.2
9.5
4.6
3.1
11.4
34.1
33.4
16.6
8.6
1.9
4.5
34.0
24.1
44.4
15.8
27.1
17.4
35.6
18.5
18.4
17.6
-3.5
27.3
16.4
27.1
26.6
17.7
47.9
25.8
15.4
12.1
16.1
11.0
19.1
12.0
12.8
11.6
11.5
13.5
33.9
89.5
43.7
20.2
28.7
22.5
54.2
32.9
18.9
12.4
50.2
13.8
43.0
34.9
23.7
18.3
34.4
43.0
28.1
31.9
23.2
35.5
49.9
9.9
50.4
47.0
11.1
9.6
22.6
9.2
11.1
9.6
10.2
10.6
27.3
65.1
36.2
18.6
28.6
18.7
38.5
23.1
15.9
9.3
44.6
11.5
29.2
24.7
19.7
14.2
9.7
29.1
23.3
22.8
16.9
27.0
36.3
7.8
39.4
35.4
2.5
4.2
1.4
11.9
2.7
7.2
1.1
1.3
1.0
1.3
1.8
1.8
2.0
2.5 2.1 2.3
4.3 17.0 20.4
1.8 -19.4 -24.4
9.1 8.2 27.4
2.8 -0.5 0.0
6.8
1.0
1.2
1.0
1.2
1.6
1.5
1.8
44.6
10.7
6.7
8.4
10.5
16.5
16.2
14.8
60.8
11.1
5.5
10.8
11.3
17.5
15.9
17.3
Buy
Buy
Sell
Buy
Buy
Buy
Sell
298 356
980 1360
82
61
29
37
165 210
196 282
85
73
20
39
-25
29
27
44
-14
18.5 26.8 31.1
89.1 102.1 110.7
4.3
3.6
4.0
2.4
3.1
3.7
12.9 14.8 16.2
16.9 20.4 21.3
7.4
8.3
8.5
Neutral
Sell
Sell
Neutral
Buy
Buy
Buy
Buy
Neutral
Neutral
Buy
Buy
Buy
Buy
Buy
Buy
Buy
Buy
Buy
Buy
Buy
Buy
Buy
Buy
Neutral
Neutral
384
1123
696
846
188
543
321
387
1211
100
1172
471
387
728
2494
138
470
951
823
2649
1777
281
2161
71
6943
211
402
920
578
950
235
523
382
458
1307
128
1550
738
467
1100
3293
194
608
1300
988
3500
2202
343
2700
114
5281
167
5
-18
-17
12
25
-4
19
18
8
29
32
57
21
51
32
40
29
37
20
32
24
22
25
60
-24
-21
11.3
12.6
15.9
41.8
6.6
24.1
5.9
11.7
64.0
8.0
23.4
34.1
9.0
20.8
105.0
7.6
13.6
22.1
29.3
83.1
76.7
7.9
43.3
7.2
137.8
4.5
14.1
17.2
19.3
45.5
6.6
29.0
8.3
16.7
76.4
10.7
26.3
41.0
13.2
29.4
126.6
9.7
48.2
32.7
35.4
116.4
104.9
10.4
59.6
9.2
176.1
6.0
18.8
-8.4 23.8
23.0 63.6 37.4
22.4 17.8 21.0
49.4
2.0
8.7
6.7
-3.5
0.3
30.3 45.1 20.4
11.2 93.7 40.7
20.8
-8.7 42.5
110.4 48.2 19.3
12.4 -38.2 32.9
33.4 49.0 12.5
48.1 78.9 20.2
17.9 41.6 47.2
34.9 -16.0 41.1
149.9 21.9 20.6
11.4
3.6 28.4
46.5 22.3 253.5
41.6 124.2 47.7
41.2 -12.2 20.6
147.9 14.5 40.0
132.7 -10.7 36.7
12.2
9.1 31.6
88.1 11.6 37.5
11.6
8.4 28.1
203.2 4.4 27.8
6.7
25.3 32.9
2.6 2.5 8.0 9.4
16.0 13.6 19.0 22.6
6.0 5.3 14.6 15.7
1.7 1.4 8.5 7.4
28.3 25.8 103.8 94.6
4.7 4.1 22.5 23.4
5.4 4.8 12.6 13.2
8.2 6.7 27.1 32.0
6.9 6.5 46.8 42.1
1.9 1.6 17.0 18.5
6.6 6.0 13.7 14.0
3.4 2.9 23.3 27.4
3.6 3.3 7.4 11.8
2.8 2.7 7.9 11.0
7.3 6.3 32.5 34.5
4.1 3.6 23.9 26.9
2.6 2.1 7.8 24.2
5.3 4.3 21.7 21.0
5.8 4.9 22.6 22.9
2.4 2.2 8.9 10.2
3.0 2.6 13.2 16.3
4.6 4.1 13.4 16.0
8.1 6.6 17.7 20.1
1.2 1.1 12.6 14.5
8.6 7.7 18.0 20.7
11.5 9.1 26.9 28.8
8 February 2018
45

MOSL Universe stock performance
Company
Automobiles
Amara Raja
Ashok Ley.
Bajaj Auto
Bharat Forge
Bosch
CEAT
Eicher Mot.
Endurance Tech.
Escorts
Exide Ind
Hero Moto
M&M
Mahindra CIE
Maruti Suzuki
Motherson Sumi
Tata Motors
TVS Motor
Banks - Private
AU Small Fin. Bank
Axis Bank
DCB Bank
Equitas Hold.
Federal Bank
HDFC Bank
ICICI Bank
IDFC Bank
IndusInd
J&K Bank
Kotak Mah. Bk
RBL Bank
South Indian
Yes Bank
Banks - PSU
BOB
BOI
Canara
Indian Bk
PNB
SBI
Union Bk
NBFCs
Aditya Birla Cap
Bajaj Fin.
Capital First
Cholaman.Inv.&Fn
Dewan Hsg.
GRUH Fin.
HDFC
HDFC Stand. Life
Indiabulls Hsg
L&T Fin.Holdings
LIC Hsg Fin
M&M Fin.
Muthoot Fin
1 Day (%)
3.7
4.8
0.0
0.8
-1.4
1.0
1.6
2.6
1.9
0.5
0.6
-1.0
4.1
-0.7
-0.1
0.8
-0.2
0.6
-1.0
0.5
2.3
0.4
-1.4
0.5
1.8
-0.7
1.3
0.1
1.1
0.4
-1.6
-0.4
-1.1
-1.4
0.8
-2.2
0.4
-1.4
3.0
-1.2
2.5
0.5
-1.2
-1.0
-0.2
-1.0
-1.9
-1.3
0.4
-0.8
2.5
1M (%)
-8.3
4.3
-4.3
-4.0
-2.2
-23.2
-4.3
-12.4
14.5
-10.0
-4.7
-1.2
-15.9
-5.4
-6.9
-12.4
-15.6
-12.9
-0.8
-16.1
-11.3
-16.3
0.6
6.3
-10.4
-2.1
-14.5
3.2
-11.2
-18.1
0.0
-4.9
-18.2
-13.8
-12.9
-10.8
-4.4
-15.0
-11.4
-9.4
-6.6
-1.2
-18.2
3.2
3.4
6.6
6.1
-10.2
-11.7
-8.8
-14.9
12M (%)
-10.9
41.2
13.1
44.0
-14.1
32.6
18.0
86.1
130.8
-1.6
9.4
18.7
10.5
43.7
57.7
-25.5
65.3
Company
MAS Financial Serv.
PNB Housing
Repco Home
Shriram City Union
Shriram Trans.
Capital Goods
ABB
Bharat Elec.
BHEL
Blue Star
CG Cons. Elec.
CG Power & Inds Sol.
Cummins
GE T&D
Havells
K E C Intl
L&T
Siemens
Solar Ind
Thermax
Va Tech Wab.
Voltas
Cement
Ambuja Cem.
ACC
Birla Corp.
Dalmia Bharat
Grasim Inds.
India Cem
J K Cements
JK Lakshmi Ce
Ramco Cem
Orient Cem
Prism Cem
Sagar Cements
Sanghi Inds.
Shree Cem
Ultratech
Consumer
Asian Paints
Britannia
Colgate
Dabur
Emami
Godrej Cons.
GSK Cons.
HUL
ITC
Jyothy Lab
Marico
Nestle
Page Inds
Parag Milk
Pidilite Ind.
P&G Hygiene
1 Day (%)
-1.1
-3.3
-0.1
3.3
-3.1
-1.9
6.0
2.0
1.4
-0.1
2.7
0.9
2.6
-0.5
4.4
-1.6
-2.8
2.3
2.2
3.5
2.4
-3.8
-1.7
2.1
-0.5
-0.3
1.9
-2.7
1.0
-0.7
5.2
-0.2
-0.4
4.6
0.1
-0.3
0.9
0.4
-0.1
0.1
0.8
-0.1
-0.6
-1.1
0.4
-0.2
0.6
0.0
-2.5
4.5
-0.1
0.5
1M (%)
-2.3
-5.2
-16.3
-7.9
-10.6
9.9
-13.3
-8.3
-10.5
-13.0
-7.5
-14.3
-15.4
-10.9
-2.9
1.4
-5.5
-11.1
-4.3
-10.7
-7.0
-10.4
-11.9
-16.8
-12.8
-12.5
-23.0
-9.4
-9.3
-9.0
-13.5
-10.0
-17.8
-15.4
-11.0
-7.1
-5.3
-2.1
-0.3
-5.2
-15.6
2.1
-1.9
-3.2
4.5
-8.0
-7.8
-10.5
-21.1
-8.0
-4.9
-2.8
12M (%)
24.8
-19.5
-0.5
39.6
34.0
11.2
-7.2
35.0
25.9
19.5
-9.3
25.4
15.1
135.9
33.3
-1.2
42.6
36.9
14.3
81.2
4.5
9.3
37.8
41.3
34.0
-6.8
30.6
3.4
6.8
11.3
13.8
20.9
86.3
6.4
10.2
12.5
41.0
22.8
27.1
0.9
28.2
23.6
53.6
-0.8
1.9
11.2
13.9
34.9
0.7
28.8
30.1
13.4
22.1
-22.3
12.7
43.1
27.0
-17.1
25.5
-3.5
33.7
22.0
28.6
19.3
-17.9
5.8
3.5
13.5
3.4
5.5
-26.8
54.8
0.4
23.2
68.5
43.6
27.0
53.5
51.6
-9.1
46.8
17.9
8 February 2018
46

MOSL Universe stock performance
Company
Prabhat Dairy
United Brew
United Spirits
Healthcare
Alembic Phar
Alkem Lab
Ajanta Pharma
Aurobindo
Biocon
Cadila
Cipla
Divis Lab
Dr Reddy’s
Fortis Health
Glenmark
Granules
GSK Pharma
IPCA Labs
Jubilant Life
Lupin
Laurus Labs
Sanofi India
Shilpa Medicare
Strides Shasun
Sun Pharma
Torrent Pharma
Infrastructure
Ashoka Buildcon
IRB Infra.Devl.
KNR Construct.
Sadbhav Engg.
Logistics
Allcargo Logistics
Concor
Gateway Distriparks
Media
Dish TV
D B Corp
Den Net.
Ent.Network
Hathway Cab.
Hind. Media
HT Media
Jagran Prak.
Music Broadcast
PVR
Prime Focus
Siti Net.
Sun TV
Zee Ent.
Metals
Hindalco
Hind. Zinc
JSPL
JSW Steel
1 Day (%)
2.1
-2.8
-0.3
3.7
0.8
2.9
3.4
1.0
-2.1
0.6
0.9
0.8
8.1
-0.4
3.6
-0.4
3.2
9.1
0.8
-0.9
1.0
-1.5
3.5
-0.6
2.7
6.1
-0.5
1.5
1.9
2.4
2.3
2.7
1.9
1.5
1.2
2.5
2.2
3.6
1.1
-0.3
-3.2
4.0
-0.5
2.6
-0.6
1.2
0.5
2.0
-0.6
2.3
1M (%)
-20.6
-4.8
-21.0
2.3
-2.9
-12.6
-8.1
9.2
-10.0
-7.2
-8.4
-14.4
-24.3
-3.8
-14.5
-1.6
-1.5
30.8
-10.1
-9.3
3.3
-16.1
-15.1
-5.2
-3.3
-10.3
-10.1
-2.0
-2.4
-12.1
-2.9
-8.8
-10.8
-9.7
-5.8
-6.7
-5.6
-2.8
-13.4
-9.7
-11.9
-2.7
-21.1
-21.9
-10.5
-1.6
-11.2
-8.0
5.5
1.6
12M (%)
38.3
34.0
37.0
-3.4
19.0
-23.7
-11.9
61.4
7.9
-4.7
37.5
-31.1
-33.3
-40.6
-5.2
-10.7
9.2
43.1
-45.0
-10.6
17.1
-28.7
-42.5
-18.0
6.7
19.3
-6.1
64.8
47.8
7.8
32.8
-15.5
-14.0
-14.4
23.4
-13.2
3.3
-12.1
14.2
-13.6
8.8
22.1
-49.1
34.1
15.3
32.2
-7.1
180.4
53.4
Company
Nalco
NMDC
Rain Industries
SAIL
Vedanta
Tata Steel
Oil & Gas
BPCL
GAIL
Gujarat Gas
Gujarat St. Pet.
HPCL
IOC
IGL
Mahanagar Gas
MRPL
Oil India
ONGC
PLNG
Reliance Ind.
Retail
Jubilant Food
PC Jeweller
Titan Co.
Technology
Cyient
HCL Tech.
Hexaware
Infosys
KPIT Tech
L&T Infotech
Mindtree
Mphasis
NIIT Tech
Persistent Sys
Tata Elxsi
TCS
Tech Mah
Wipro
Zensar Tech
Telecom
Bharti Airtel
Bharti Infratel
Idea Cellular
Tata Comm
Utiltites
Coal India
CESC
JSW Energy
NHPC Ltd
NTPC
Power Grid
Tata Power
1 Day (%)
0.6
1.6
9.6
-1.0
-2.0
-0.7
1.6
1.9
2.7
5.5
5.0
0.5
0.8
2.9
0.9
2.7
2.2
0.9
0.1
1.0
-2.9
0.5
0.7
-1.7
-3.3
0.0
2.3
9.2
-0.6
-0.8
0.4
-3.4
0.6
-1.3
-0.5
-1.8
0.4
-2.0
-2.1
-1.1
0.0
2.5
-1.0
-1.4
2.1
-0.3
0.5
2.4
1M (%)
-18.8
-18.0
-14.0
-15.0
-7.0
-9.0
-2.1
-6.6
-1.5
-9.0
-4.4
5.5
-11.2
-11.4
-10.3
-5.9
-4.0
-2.4
-3.1
5.1
-22.8
-13.8
5.1
4.3
-0.2
9.5
4.2
16.5
19.1
17.6
24.7
5.6
-3.2
10.1
15.1
-6.6
6.5
-20.4
-9.2
-27.4
-10.4
6.9
-10.0
-10.9
-14.8
-7.1
-2.5
-14.9
12M (%)
-3.3
-11.4
357.6
24.9
27.0
48.1
0.3
29.2
39.2
23.0
6.7
3.4
43.6
4.5
3.4
6.8
-1.8
29.2
73.5
100.2
101.1
99.2
30.3
15.2
80.5
17.4
59.1
88.9
58.5
46.3
98.2
25.8
34.1
31.7
28.0
26.5
2.4
22.1
12.1
-21.8
-19.3
-5.6
21.6
31.5
-8.5
-4.9
-2.2
4.2
8 February 2018
47

MOSL Universe stock performance
Company
Others
Arvind
Avenue Super.
Bata India
BSE
Castrol India
Coromandel Intl
Delta Corp
Eveready Inds.
Interglobe
Indo Count
Info Edge
Kaveri Seed
Manpasand
MCX
Monsanto
Navneet Educat.
Oberoi Realty
PI Inds.
Piramal Enterp.
Quess Corp
SRF
S H Kelkar
Team Lease Serv.
Trident
V-Guard
1 Day (%)
0.6
1.4
1.9
2.6
4.6
-0.3
-1.3
2.4
1.2
5.0
-2.9
3.0
3.3
3.6
0.8
1.2
2.0
0.1
3.8
1.4
3.0
0.3
3.7
3.5
-1.0
1M (%)
-13.8
-9.7
-8.9
-10.6
-3.7
-4.4
5.9
-13.1
1.1
-17.6
-16.9
-12.6
-20.5
-20.8
-0.3
-12.2
-4.2
-16.2
-6.6
-15.8
-8.9
-3.6
-9.1
-20.8
-11.2
12M (%)
4.0
38.0
-16.0
-9.7
61.7
149.1
55.2
43.1
-45.9
40.4
1.0
12.7
-36.7
8.2
5.9
41.2
-10.2
52.6
39.6
1.6
-9.7
133.8
1.3
35.5
8 February 2018
48

THEMATIC/STRATEGY RESEARCH GALLERY

REPORT GALLERY
RECENT INITIATING COVERAGE REPORTS
Rs

DIFFERENTIATED PRODUCT GALLERY

Explanation of Investment Rating
Investment Rating
BUY
SELL
NEUTRAL
UNDER REVIEW
NOT RATED
Expected return (over 12-month)
>=15%
< - 10%
> - 10 % to 15%
Rating may undergo a change
We have forward looking estimates for the stock but we refrain from assigning recommendation
*In case the recommendation given by the Research Analyst becomes inconsistent with the investment rating legend, the Research Analyst shall within 28 days of the inconsistency, take appropriate measures to make the recommendation consistent with the investment rating legend.
Disclosures:
The following Disclosures are being made in compliance with the SEBI Research Analyst Regulations 2014 (herein after referred to as the Regulations).
Motilal Oswal Securities Ltd. (MOSL) is a SEBI Registered Research Analyst having registration no. INH000000412. MOSL, the Research Entity (RE) as defined in the Regulations, is engaged in the business of providing Stock broking services,
Investment Advisory Services, Depository participant services & distribution of various financial products. MOSL is a subsidiary company of Motilal Oswal Financial Service Ltd. (MOFSL). MOFSL is a listed public company, the details in respect of
which are available on
www.motilaloswal.com.
MOSL is registered with the Securities & Exchange Board of India (SEBI) and is a registered Trading Member with National Stock Exchange of India Ltd. (NSE) and Bombay Stock Exchange Limited
(BSE), Metropolitan Stock Exchange Of India Ltd. (MSE) for its stock broking activities & is Depository participant with Central Depository Services Limited (CDSL) & National Securities Depository Limited (NSDL) and is member of Association of
Mutual Funds of India (AMFI) for distribution of financial products. Details of associate entities of Motilal Oswal Securities Limited are available on the website at
http://onlinereports.motilaloswal.com/Dormant/documents/Associate%20Details.pdf
Regulatory Enquiries against Motilal Oswal Securities Limited by SEBI:
SEBI pursuant to a complaint from client Shri C.R. Mohanraj alleging unauthorized trading, issued a letter dated 29th April 2014 to MOSL notifying appointment of an Adjudicating Officer as per SEBI regulations to hold inquiry and
adjudge violation of SEBI Regulations; MOSL requested SEBI to provide all documents, records, investigation report relied upon by SEBI which were referred in Show Cause Notice. The matter is closed and MOSL had to pay Rs. 2
lakhs towards penalty for misplacement of original POA of client.
MOSL, it’s associates, Research Analyst or their relative may have any financial interest in the subject company. MOSL and/or its associates and/or Research Analyst may have beneficial ownership of 1% or more securities in the subject company at
the end of the month immediately preceding the date of publication of the Research Report.
MOSL and its associate company(ies), their directors and Research Analyst and their relatives may; (a) from time to time, have a long or short position in, act
as principal in, and buy or sell the securities or derivatives thereof of companies mentioned herein. (b) be engaged in any other transaction involving such securities and earn brokerage or other compensation or act as a market maker in the financial
instruments of the company(ies) discussed herein or act as an advisor or lender/borrower to such company(ies) or may have any other potential conflict of interests with respect to any recommendation and other related information and opinions.;
however the same shall have no bearing whatsoever on the specific recommendations made by the analyst(s), as the recommendations made by the analyst(s) are completely independent of the views of the associates of MOSL even though there
might exist an inherent conflict of interest in some of the stocks mentioned in the research report.
Research Analyst may have served as director/officer, etc. in the subject company in the last 12 month period. MOSL and/or its associates may have
received any compensation from the subject company in the past 12 months.
In the last 12 months period ending on the last day of the month immediately preceding the date of publication of this research report, MOSL or any of its associates may have:
a)
managed or co-managed public offering of securities from subject company of this research report,
b)
received compensation for investment banking or merchant banking or brokerage services from subject company of this research report,
c)
received compensation for products or services other than investment banking or merchant banking or brokerage services from the subject company of this research report.
d)
Subject Company may have been a client of MOSL or its associates during twelve months preceding the date of distribution of the research report.
MOSL and it’s associates have not received any compensation or other benefits from the subject company or third party in connection with the research report. To enhance transparency, MOSL has incorporated a Disclosure of Interest Statement in
this document. This should, however, not be treated as endorsement of the views expressed in the report. MOSL and / or its affiliates do and seek to do business including investment banking with companies covered in its research reports. As a result,
the recipients of this report should be aware that MOSL may have a potential conflict of interest that may affect the objectivity of this report. Compensation of Research Analysts is not based on any specific merchant banking, investment banking or
brokerage service transactions.
Terms & Conditions:
This report has been prepared by MOSL and is meant for sole use by the recipient and not for circulation. The report and information contained herein is strictly confidential and may not be altered in any way, transmitted to, copied or distributed, in part
or in whole, to any other person or to the media or reproduced in any form, without prior written consent of MOSL. The report is based on the facts, figures and information that are considered true, correct, reliable and accurate. The intent of this report
is not recommendatory in nature. The information is obtained from publicly available media or other sources believed to be reliable. Such information has not been independently verified and no guaranty, representation of warranty, express or implied,
is made as to its accuracy, completeness or correctness. All such information and opinions are subject to change without notice. The report is prepared solely for informational purpose and does not constitute an offer document or solicitation of offer to
buy or sell or subscribe for securities or other financial instruments for the clients. Though disseminated to all the customers simultaneously, not all customers may receive this report at the same time. MOSL will not treat recipients as customers by
virtue of their receiving this report.
Analyst Certification
The views expressed in this research report accurately reflect the personal views of the analyst(s) about the subject securities or issues, and no part of the compensation of the research analyst(s) was, is, or will be directly or indirectly related to the
specific recommendations and views expressed by research analyst(s) in this report.
Disclosure of Interest Statement
Analyst ownership of the stock
Companies where there is interest
No
A graph of daily closing prices of securities is available at
www.nseindia.com, www.bseindia.com.
Research Analyst views on Subject Company may vary based on Fundamental research and Technical Research. Proprietary trading desk of MOSL or
its associates maintains arm’s length distance with Research Team as all the activities are segregated from MOSL research activity and therefore it can have an independent view with regards to subject company for which Research Team have
expressed their views.
Regional Disclosures (outside India)
This report is not directed or intended for distribution to or use by any person or entity resident in a state, country or any jurisdiction, where such distribution, publication, availability or use would be contrary to law, regulation or which would subject
MOSL & its group companies to registration or licensing requirements within such jurisdictions.
For Hong Kong:
This report is distributed in Hong Kong by Motilal Oswal capital Markets (Hong Kong) Private Limited, a licensed corporation (CE AYY-301) licensed and regulated by the Hong Kong Securities and Futures Commission (SFC) pursuant to the Securities
and Futures Ordinance (Chapter 571 of the Laws of Hong Kong) “SFO”. As per SEBI (Research Analyst Regulations) 2014 Motilal Oswal Securities (SEBI Reg No. INH000000412) has an agreement with Motilal Oswal capital Markets (Hong Kong)
Private Limited for distribution of research report in Hong Kong. This report is intended for distribution only to “Professional Investors” as defined in Part I of Schedule 1 to SFO. Any investment or investment activity to which this document relates is only
available to professional investor and will be engaged only with professional investors.” Nothing here is an offer or solicitation of these securities, products and services in any jurisdiction where their offer or sale is not qualified or exempt from
registration. The Indian Analyst(s) who compile this report is/are not located in Hong Kong & are not conducting Research Analysis in Hong Kong.
For U.S.
Motilal Oswal Securities Limited (MOSL) is not a registered broker - dealer under the U.S. Securities Exchange Act of 1934, as amended (the"1934 act") and under applicable state laws in the United States. In addition MOSL is not a registered
investment adviser under the U.S. Investment Advisers Act of 1940, as amended (the "Advisers Act" and together with the 1934 Act, the "Acts), and under applicable state laws in the United States. Accordingly, in the absence of specific exemption
under the Acts, any brokerage and investment services provided by MOSL, including the products and services described herein are not available to or intended for U.S. persons. This report is intended for distribution only to "Major Institutional
Investors" as defined by Rule 15a-6(b)(4) of the Exchange Act and interpretations thereof by SEC (henceforth referred to as "major institutional investors"). This document must not be acted on or relied on by persons who are not major institutional
investors. Any investment or investment activity to which this document relates is only available to major institutional investors and will be engaged in only with major institutional investors. In reliance on the exemption from registration provided by Rule
15a-6 of the U.S. Securities Exchange Act of 1934, as amended (the "Exchange Act") and interpretations thereof by the U.S. Securities and Exchange Commission ("SEC") in order to conduct business with Institutional Investors based in the U.S.,
MOSL has entered into a chaperoning agreement with a U.S. registered broker-dealer, Motilal Oswal Securities International Private Limited. ("MOSIPL"). Any business interaction pursuant to this report will have to be executed within the provisions of
this chaperoning agreement.
The Research Analysts contributing to the report may not be registered /qualified as research analyst with FINRA. Such research analyst may not be associated persons of the U.S. registered broker-dealer, MOSIPL, and therefore, may not be subject
to NASD rule 2711 and NYSE Rule 472 restrictions on communication with a subject company, public appearances and trading securities held by a research analyst account.
For Singapore
Motilal Oswal Capital Markets Singapore Pte Limited is acting as an exempt financial advisor under section 23(1)(f) of the Financial Advisers Act(FAA) read with regulation 17(1)(d) of the Financial Advisors Regulations and is a subsidiary of Motilal
Oswal Securities Limited in India. This research is distributed in Singapore by Motilal Oswal Capital Markets Singapore Pte Limited and it is only directed in Singapore to accredited investors, as defined in the Financial Advisers Regulations and the
Securities and Futures Act (Chapter 289), as amended from time to time. In respect of any matter arising from or in connection with the research you could contact the following representatives of Motilal Oswal Capital Markets Singapore Pte Limited:
Disclaimer:
The report and information contained herein is strictly confidential and meant solely for the selected recipient and may not be altered in any way, transmitted to, copied or distributed, in part or in whole, to any other person or to the media or reproduced
in any form, without prior written consent. This report and information herein is solely for informational purpose and may not be used or considered as an offer document or solicitation of offer to buy or sell or subscribe for securities or other financial
instruments. Nothing in this report constitutes investment, legal, accounting and tax advice or a representation that any investment or strategy is suitable or appropriate to your specific circumstances. The securities discussed and opinions expressed in
this report may not be suitable for all investors, who must make their own investment decisions, based on their own investment objectives, financial positions and needs of specific recipient. This may not be taken in substitution for the exercise of
independent judgment by any recipient. Each recipient of this document should make such investigations as it deems necessary to arrive at an independent evaluation of an investment in the securities of companies referred to in this document
(including the merits and risks involved), and should consult its own advisors to determine the merits and risks of such an investment. The investment discussed or views expressed may not be suitable for all investors. Certain transactions -including
those involving futures, options, another derivative products as well as non-investment grade securities - involve substantial risk and are not suitable for all investors. No representation or warranty, express or implied, is made as to the accuracy,
completeness or fairness of the information and opinions contained in this document. The Disclosures of Interest Statement incorporated in this document is provided solely to enhance the transparency and should not be treated as endorsement of the
views expressed in the report. This information is subject to change without any prior notice. The Company reserves the right to make modifications and alternations to this statement as may be required from time to time without any prior approval.
MOSL, its associates, their directors and the employees may from time to time, effect or have effected an own account transaction in, or deal as principal or agent in or for the securities mentioned in this document. They may perform or seek to perform
investment banking or other services for, or solicit investment banking or other business from, any company referred to in this report. Each of these entities functions as a separate, distinct and independent of each other. The recipient should take this
into account before interpreting the document. This report has been prepared on the basis of information that is already available in publicly accessible media or developed through analysis of MOSL. The views expressed are those of the analyst, and
the Company may or may not subscribe to all the views expressed therein. This document is being supplied to you solely for your information and may not be reproduced, redistributed or passed on, directly or indirectly, to any other person or
published, copied, in whole or in part, for any purpose. This report is not directed or intended for distribution to, or use by, any person or entity who is a citizen or resident of or located in any locality, state, country or other jurisdiction, where such
distribution, publication, availability or use would be contrary to law, regulation or which would subject MOSL to any registration or licensing requirement within such jurisdiction. The securities described herein may or may not be eligible for sale in all
jurisdictions or to certain category of investors. Persons in whose possession this document may come are required to inform themselves of and to observe such restriction. Neither the Firm, not its directors, employees, agents or representatives shall
be liable for any damages whether direct or indirect, incidental, special or consequential including lost revenue or lost profits that may arise from or in connection with the use of the information.
The person accessing this information specifically agrees
to exempt MOSL or any of its affiliates or employees from, any and all responsibility/liability arising from such misuse and agrees not to hold MOSL or any of its affiliates or employees responsible for any such misuse and further agrees to hold MOSL
or any of its affiliates or employees free and harmless from all losses, costs, damages, expenses that may be suffered by the person accessing this information due to any errors and delays.
Registered Office Address: Motilal Oswal Tower, Rahimtullah Sayani Road, Opposite Parel ST Depot, Prabhadevi, Mumbai-400025; Tel No.: 022-3980 4263; www.motilaloswal.com. Correspondence Address: Palm Spring Centre, 2nd Floor, Palm
Court Complex, New Link Road, Malad (West), Mumbai- 400 064. Tel No: 022 3080 1000. Compliance Officer: Neeraj Agarwal, Email Id:
na@motilaloswal.com,
Contact No.:022-30801085.
Registration details of group entities.: MOSL: SEBI Registration: INZ000158836 (BSE/NSE/MSE); CDSL: IN-DP-16-2015; NSDL: IN-DP-NSDL-152-2000; Research Analyst: INH000000412. AMFI: ARN 17397. Investment Adviser: INA000007100.
Motilal Oswal Asset Management Company Ltd. (MOAMC): PMS (Registration No.: INP000000670) offers PMS and Mutual Funds products. Motilal Oswal Wealth Management Ltd. (MOWML): PMS (Registration No.: INP000004409) offers wealth
management solutions. *Motilal Oswal Securities Ltd. is a distributor of Mutual Funds, PMS, Fixed Deposit, Bond, NCDs, Insurance and IPO products. * Motilal Oswal Commodities Broker Pvt. Ltd. offers Commodities Products. * Motilal Oswal Real
Estate Investment Advisors II Pvt. Ltd. offers Real Estate products. * Motilal Oswal Private Equity Investment Advisors Pvt. Ltd. offers Private Equity products
13 December 2016
50