12 February 2018
Market snapshot
Equities - India
Close
Chg .%
Sensex
34,006
-1.2
Nifty-50
10,455
-1.2
Nifty-M 100
19,872
0.2
Equities-Global
Close
Chg .%
S&P 500
2,620
1.5
Nasdaq
6,874
1.4
FTSE 100
7,092
-1.1
DAX
12,107
-1.2
Hang Seng
11,902
-3.9
Nikkei 225
21,383
-2.3
Commodities
Close
Chg .%
Brent (US$/Bbl)
62
-2.6
Gold ($/OZ)
1,316
-0.2
Cu (US$/MT)
6,712
-1.4
Almn (US$/MT)
2,121
-2.5
Currency
Close
Chg .%
USD/INR
64.4
0.2
USD/EUR
1.2
0.0
USD/JPY
108.8
0.1
YIELD (%)
Close
1MChg
10 Yrs G-Sec
7.5
0.02
10 Yrs AAA Corp
8.1
0.02
Flows (USD b)
9-Feb
MTD
FIIs
-0.2
-0.8
DIIs
0.1
0.9
Volumes (INRb)
9-Feb
MTD*
Cash
356
431
F&O
5,281
9,213
Note: YTD is calendar year, *Avg
YTD.%
-0.1
-0.7
-6.0
YTD.%
-2.0
-0.4
-7.7
-6.3
1.6
-6.1
YTD.%
-6.6
1.0
-6.9
-6.0
YTD.%
0.8
2.1
-3.5
YTDchg
0.2
0.2
YTD
1.5
0.9
YTD*
427
7,744
Today’s top research idea
State Bank of India - Asset quality disappoints
Expect gradual recovery over FY19E
SBIN reported a weak quarter with net slippages spiking up to INR267.8b
(adversely impacted by divergence). Provisioning increased to INR188.8b,
resulting in a loss of INR24.2b. On the positive side, 89% of corporate slippages
came from stressed assets, resulting in a decline in net stressed assets to 8.4%
of total loans. Core PPoP held stable led by modest growth in core other
income while NII growth stood flat on sequential basis. While the core portfolio
performance remains healthy, cleanup of residual stressed assets will remain
an overhang in near term. We cut our FY18E/19E/20E earnings by
75%/20%/22% respectively and build in capital infusion of INR88b as
announced by the government. We revise our PT to INR375 (1.4x FY20E ABV for
bank) and maintain our BUY rating.
Research covered
Cos/Sector
Automobile
State Bank of India
ONGC
Coal India
Hindustan Zinc
BPCL
M&M
Tata Steel
HPCL
Sun TV Network
Aditya Birla Cap
Bank of Baroda
Key Highlights
Auto Expo 2018: Action in 125cc scooters and EVs
Asset quality disappoints; Expect gradual recovery over FY19E
EBITDA below estimate; gas production up 4% YoY
In-line; e-auction offset drag of power sector priority
Getting more aggressive on volume growth
EBITDA significantly below estimate; core GRM at USD6.5/bbl
Operating performance miss led by higher other expense
Lower cost of production driving EBITDA beat
EBITDA significantly below estimate; core GRM at USD6.1/bbl
Ad growth revives; digitization-led subscription revenue to witness robust gr.
Robust growth and healthy asset quality intact
Strong operational performance; stressed assets declining rapidly
SAIL | ABB | OINL | ALKEM | JSP | VOLT | TCOM | MUTH | GNP | NACL |
Other Results
AMRJ | GETD | MAHCL | BCORP | STR | ICEM | KSCL | VATW | GRAN | TTMT
Results Expectation BOI | BRIT | CGPOWER | GAIL | SKB | INBK | NHPC | SADE
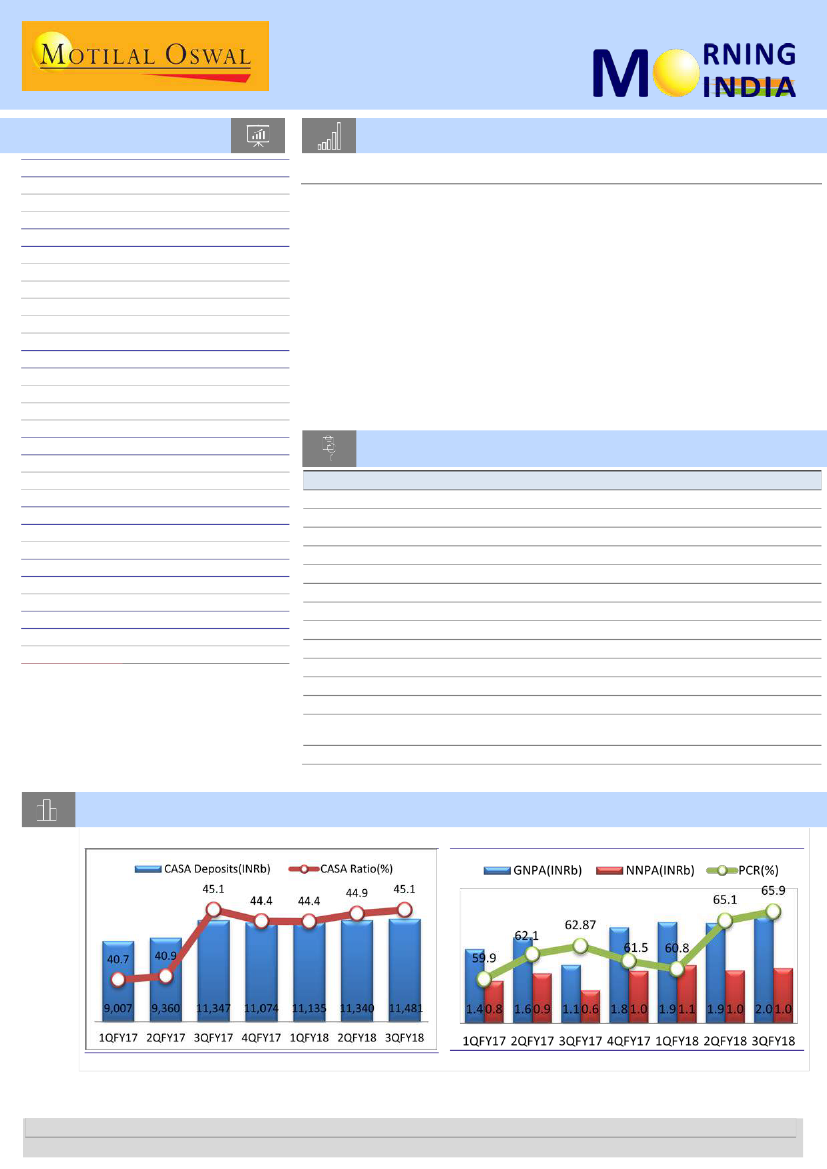
Chart of the Day:
State Bank of India - Asset quality disappoints; Expect gradual recovery over FY19E
CASA ratio improved marginally to 45.1%
PCR improved by 80bp sequentially
Source: MOSL, Company
Research Team (Gautam.Duggad@MotilalOswal.com)
Investors are advised to refer through important disclosures made at the last page of the Research Report.
Motilal Oswal research is available on www.motilaloswal.com/Institutional-Equities, Bloomberg, Thomson Reuters, Factset and S&P Capital.

In the news today
Kindly click on textbox for the detailed news link
1
SGX looks to bypass curbs
placed by Indian bourses
The Singapore Stock Exchange
(SGX) on Sunday said it will
develop new products to provide
investors with access to Indian
securities after exchanges in the
country abruptly decided to end
licensing their products and data
to overseas bourses. Indian stock
exchanges, in a joint statement …
2
Tatas want Paper Boat in their fleet to spice up portfolio of group
company Tata Global Beverages
Tata Group has approached key shareholders of Hector Beverages with a
proposal to buy out the company along with its popular brand Paper Boat
to spice up the portfolio of group company Tata Global Beverages Limited
(TGBL), said multiple people aware. Tata Sons chairman N Chandrasekaran
has been keen to add fizz to the group company, wanting them to move
beyond its tea, coffee and water offerings to leapfrog into a holistic food
and beverage powerhouse like Pepsico or Nestle, said group officials.
3
Earnings improve, but not yet in
high gear; India Inc net up
10.6% in Q3
A year after demonetisation-
induced economic disruption,
corporate earnings are yet to
move into high gear as expected
by the Street. Companies focused
on the domestic market,
especially consumer goods
players, have recovered some of
their mojo in the third quarter
ended December 2017 …
4
ONGC Videsh-led consortium
picks up 10% stake in UAE’s
Zakum oilfield
A consortium of Indian companies
led by state-owned Oil and
Natural Gas Corp. Ltd (ONGC)’s
overseas arm, ONGC Videsh Ltd,
has bought a 10% stake in the
UAE’s offshore oil and gas field
Zakum, as India pursues overseas
hydrocarbon assets while oil-rich
nations resort to ways of reducing
risk and balancing their budget …
5
Income Tax panel refuses to
stay Rs 110 crore tax demand
on Flipkart
An income tax panel refused to
stay a demand of Rs 110 crore on
Flipkart, India's largest online
retailing platform, after it was
asked to reclassify discounts and
marketing spend as capital
expenditure. This may have
implications for rival Amazon,
which faces a similar liability,
and others. The Income Tax
Appellate Tribunal (ITAT) in
Bengaluru asked Flipkart to
deposit Rs 55 crore and provide
bank guarantees to the tune of
Rs 55 crore by February 28.
6
Aditya Birla Capital to launch
ARC business this quarter
Aditya Birla Capital Ltd (ABCL), the
financial services business of the
$50 billion Aditya Birla Group, will
begin investing in its asset
reconstruction company (ARC) and
start business this quarter, a top
company executive said. The
company, which has presence
across insurance, asset
management and private equity,
among others, is trying to tap …
12 February 2018
7
NTPC plans to borrow about
₹16,000
crore
State-run power giant NTPC may
borrow about ₹16,000 crore
next
financial year for adding 6,900
MW of fresh electricity
generation capacity by March
2019. “The corporation may hit
the bonds or debt market to
borrow about ₹16,000 crore
during the next financial year for
financing the ongoing projects,”
a source said.
2

8 February 2018
Automobile
Auto Expo 2018: Action in 125cc scooters and EVs
No big new launch in PVs
We attended Auto Expo 2018 held at Greater Noida, NCR. While there were no
major new launches in PVs, the 2W segment witnessed several launches in 125cc
scooters and the premium segment. Also, on expected lines, there was high focus
on EVs in all the segments, with several concepts on display and few launches as
well. Key highlights:
No major new launches in 4Ws:
In PVs, no major new launch was announced
except MSIL’s new Swift, which has already touched bookings of ~40k units and
waiting period of 8-10 weeks. Honda has launched new Amaze, new CR-V, and
new Civic while Toyota has launched Yaris in the mid size sedan segment. M&M
showcased G4 Rexton in the premium SUV segment under the Mahindra badge
while Tata Motors showcased H5X concept (expected launch by 4QFY19; to
compete with Hyundai’s Creta and M&M’s XUV 500) in the mid-SUV segment.
High focus on 125cc scooters and premium motorcycles:
In 2Ws, rising OEM
focus on the 125cc scooter segment was visible, with five new product launches
– TVS’ NTORQ 125, Hero’s Duet 125 and Maestro Edge 125, Suzuki’s Burgman
maxi-scooter and Piaggio Aprillia SR125. The premium motorcycle segment
witnessed further heating up of competition, with HMCL launching xPulse 200
and HMSI unveiling its third 160cc bike, X-Blade, which will be competing with
Bajaj Pulsar 160, Suzuki Gixxer and TVS Apache.
EVs – several concepts, a few launches:
As expected, there was high focus on
EVs across segments, with a slew of concepts unveiled in the PV and 2W
segments. 2W EV start-up, Twenty Two Motors launched lithium-ion based BEV
scooter, Flow at INR74,740 (post subsidy). Mahindra showcased its production-
ready eKUV100 apart from eVerito and e2o plus, which will further strengthen
its position to ride the EV wave. Ashok Leyland unveiled its first electric bus,
Circuit S, powered with Sun Mobility's Swappable Smart Battery.
Mahindra to strengthen EV presence through MESMA, a 380-volt powertrain:
M&M unveiled a range of electric vehicles (EVs) and of significant interest
among these was a preview of MESMA (Mahindra Electric Scalable Modular
Architecture). It’s a flexible platform and will be used to develop EVs – from
hatchbacks to SUVs. It showed concepts of lithium-ion battery powered three-
wheeler – Treo (e-Auto - 1st in India) and Atom – as a part of urban mobility
solutions.
TVS Motors showcased interesting concepts like Zeppelin – a premium 200cc
cruiser, Apache RTR – an ethanol-based concept, and CREON, an e-scooter
concept along with recent launch of NTORQ 125cc scooter.
Royal Enfield – competition gearing up: UM launched two cruiser bikes,
Renegade Duty S and Renegade Duty Ace at competitive price of INR110k (ex-
showroom Delhi). It also launched its first electric cruiser, Renegade Thor with a
price tag of INR490k (ex-showroom Delhi). Also, TVSL's Zeppelin concept is
aimed at cruiser segment.
12 February 2018
3

State Bank of India
BSE SENSEX
34,006
Bloomberg
Equity Shares (m)
M.Cap.(INRb)/(USDb)
52-Week Range (INR)
1, 6, 12 Rel. Per (%)
Avg Val, INRm
Free float (%)
S&P CNX
10,455
SBIN IN
8,946
2,648.1 / 41.1
352 / 241
-1/-3/-13
5600.0
43.4
9 February 2018
3QFY18 Results Update | Sector: Financials
CMP: INR296
TP: INR375 (+27%)
Buy
Asset quality disappoints; expect gradual recovery over FY19E
SBIN reported a weak quarter, with slippages spiking up to INR267.8b
(adversely impacted by divergence) and revenue missing estimate by 4%.
Provisioning increased to INR188.8b, resulting in a loss of INR24.16b. However,
on a positive side, 89% of the corporate slippages came from stressed assets,
resulting in a decline in net stressed assets to 8.4% of total loans.
Core PPoP held stable (1% QoQ growth),
led by modest growth in core other
income, while NII growth stood flat on a sequential basis. Operating expenses
grew 3% QoQ, led by a rise in employee costs, as management provided
toward potential wage increase. SBIN continues to see a net reduction in its
employee base (down by 8,708 over the past six months).
Loan growth was muted
at 1.3% QoQ due to a continued run-down in large
and mid-corporates, even as retail advances grew 3%/14% QoQ/YoY. SME
portfolio showed some signs of revival, with 6% QoQ growth. Margins
improved 2bp QoQ to 2.45%, aided by a stable CASA mix and re-pricing of the
deposit portfolio. SBIN guided for 10% advances growth over FY19E.
GNPLs/NNPLs increased
by 7%/4.6% QoQ, adversely impacted by a divergence
amount of INR232.3b. GNPL/NNPL ratios, thus, increased 52bp/18bp QoQ to
10.35%/5.61%. The PCR ratio improved 120bp QoQ to 48.6% (65.9% including
technical write-offs). The bank has made 60% provisions on its aggregate NCLT
exposure of INR783.1b (39% of total GNPLs). SBIN guided for 2% slippage and
credit cost each for FY19. We expect asset quality to improve from FY19E
onward and expect net NPL ratio to decline to 2.7% by FY20E.
Other highlights:
a) SBIN reversed revaluation reserves amounting to
INR112.1b in respect of certain leasehold properties. This contributed to a
66bp QoQ fall in Tier-1 to 10.3%. The bank also recognized DTA of INR22.8b.
Valuation view:
While core portfolio performance remains healthy, the purging
of the residual stressed assets will remain an overhang in the near term. We
cut FY18E/19E/20E earnings by 75%/20%/22%, and build in capital infusion of
INR88b, as announced by the government. We revise our PT to INR375 (1.4x
FY20E ABV for bank) and maintain our
Buy
rating.
3Q
177,690
115,070
292,760
148,750
144,010
95,010
89,428
54,582
9,904
44,677
1,082
7.2
614
4.2
43.2
4Q
210,660
122,220
332,880
159,780
173,100
153,130
209,320
-36,220
-1,810
-34,410
1,779
9.1
970
5.2
45.5
1Q
176,060
80,057
256,117
137,376
118,741
101,041
89,295
29,446
9,391
20,055
1,881
10.0
1078
6.0
42.7
FY18E
2Q
3Q
185,857 186,875
160,170
80,842
346,027 267,717
146,028 150,171
199,999 117,546
114,339 115,536
191,374 188,762
8,625 -71,216
-7,198 -47,053
15,823 -24,164
1,861
9.8
979
5.4
47.4
1,991
10.4
1024
5.6
48.6
FY17
FY18
4Q
204,933
753,483
753,726
129,285
428,627
450,354
334,219 1,182,110 1,204,079
154,130
585,150
587,706
180,088
596,960
616,373
180,088
400,983
465,879
160,515
609,844
629,947
19,573
-12,884
-13,573
4,141
7,355
-40,719
15,432
-20,239
27,146
2,041
10.8
1037
5.5
49.2
1,779
9.1
970
5.2
45.5
2,041
10.8
1037
5.5
49.2
Financials & Valuations (INR b)
Y/E March
2018E 2019E 2020E
NII
753.7 910.4 1,011.7
OP
616.4 740.8 817.3
NP
27.1 162.4 271.4
NIM (%)
2.7
2.7
2.7
EPS (INR)
3.2
18.0
29.7
EPS Gr. (%)
NA 459.4
65.3
Cons. BV (INR)
223.6 240.2 265.8
ABV (INR)
127.6 167.2 205.8
RoE (%)
1.6
8.4
12.7
RoA (%)
0.1
0.5
0.7
P/E (x)
92.2
16.5
10.0
P/ABV (x)
1.7
1.3
1.1
Quarterly performance
Y/E March, INRm
Net Interest Income
Other Income
Total Income
Operating Expenses
Operating Profit
Core Operating Profit
Other Provisions
Profit before Tax
Tax Provisions
Net Profit
Asset Quality
Gross NPA (INR b)
Gross NPA (%)
Net NPA (INR b)
Net NPA (%)
PCR (%)
1Q
182,450
87,610
270,060
132,450
137,610
103,240
130,370
7,240
3,510
3,730
1,377
7.4
782
4.4
43.2
FY17
2Q
181,190
101,460
282,650
142,770
139,880
107,120
148,300
-8,420
-2,840
-5,580
1,598
8.5
923
5.1
42.2
12 February 2018
4

9 February 2018
3QFY18 Results Update | Sector: Oil & Gas
ONGC
Buy
BSE SENSEX
34,006
Bloomberg
Equity Shares (m)
M.Cap.(INRb)/(USDb)
52-Week Range (INR)
1, 6, 12 Rel. Per (%)
Avg Val, INRm
Free float (%)
S&P CNX
10,455
ONGC IN
12,833
2,438.3 / 37.5
213 / 155
-3/8/-23
1476.0
32.3
CMP: INR188
TP: INR230 (+23%)
EBITDA below estimate; gas production up 4% YoY
ONGC’s reported revenue of INR230b (+15% YoY, +21% QoQ) came in below
our estimate of INR243b due to lower production/sales and marginally lower
realization. Reported EBITDA of INR125b (+22% YoY, +20% QoQ) was below our
estimate of INR134b, led by higher other expenditure (USD7.2/boe v/s
estimate of USD6.8/boe).
PAT grew 15% YoY (-2% QoQ) to INR50b, missing our estimate of INR67b, led
by lower other income of INR11b (est. of INR14b; +16% YoY, -42% QoQ) and
higher depreciation of INR58.6b (est. INR44b; +25% YoY, +21% QoQ). D,D&A
was higher led by higher depletion and higher dry well write-offs.
Net realization grew 21% YoY (+18% QoQ) to USD60.6/bbl. Subsidy sharing was
nil; we model nil subsidy sharing for FY18, FY19 and FY20 as well. At USD60-
70/bbl of Brent, we do not see much concern. However, if crude were to rise
further, then it may result in subsidy sharing, thereby adversely impacting the
profitability.
Oil sales declined 1.3% YoY (+1.4% QoQ) to 5.92mmt, and gas sales grew 7.3%
YoY (+1.2% QoQ) to 5.0bcm. Oil production declined ~1% YoY (-1.7% QoQ) to
6.34mmt and gas production grew 1.5% YoY (flat QoQ) to 6.28bcm.
Gas production is expected to increase again, led by completion of its
development projects. We expect gas production to increase 10-15% annually.
Valuation and view
Rising crude oil prices, growth in oil & gas production, and declining opex led
by cost efficiencies place ONGC on a strong footing. We model Brent crude
price at USD60/bbl for FY19/20 and INR/USD at 64.6/66/67.
We expect EPS of INR23.3/24.3 for FY19/20. The stock trades at 7.7x FY20E
EPS, and EV of 3.4x FY19E EBITDA. Using SOTP, we value the stock at
INR230/share, implying a 23% upside. Maintain
Buy.
(INR Million)
FY18E
FY18 Var vs
3QE est (%)
852,271 242,940
-5%
9.8
21.9
387,868 109,389
-4%
464,403 133,551
-6%
54.5
55.0
196,658 44,451
32%
11,643 2,500
24%
53,246 14,060
-20%
309,348 100,660
-26%
100,491 33,550
-27%
32
33.3
208,857 67,110
-25%
208,857 67,110
-25%
16.7
54.2
24.5
27.6
Financials & Valuations (INR b)
2018E 2019E 2020E
Y/E Mar
1,549 1,788 1,840
Net Sales
631
754
780
EBITDA
226
299
311
PAT
17.6 23.3 24.3
EPS (INR)
7.1 32.5
4.1
Gr. (%)
179
187
195
BV/Sh (INR)
10.0 12.8 12.7
RoE (%)
8.8 10.8 10.5
RoCE (%)
10.7
8.1
7.7
P/E (x)
P/BV (x)
1.1
1.0
1.0
EV/EBITDA (x)
4.2
3.6
3.4
Estimate change
TP change
Rating change
Standalone - Quarterly Earning Model
Y/E March
Net Sales
YoY Change (%)
Total Expenditure
EBITDA
Margins (%)
Depreciation
Interest
Other Income
PBT
Tax
Rate (%)
Reported PAT
Adj PAT
YoY Change (%)
Margins (%)
FY17
1Q
2Q
3Q
4Q
176,704 182,866 199,338 217,140
-21.5 -11.1
9.2
33.7
83,942 87,476 96,440 149,889
92,761 95,391 102,898 67,252
52.5
52.2
51.6
31.0
36,997 34,529 47,039 53,875
2,920 3,034 3,062 3,202
10,668 12,920 9,727 45,195
63,512 70,748 62,524 55,371
21,186 20,999 19,001 11,969
33.4
29.7
30.4
21.6
42,325 49,749 43,523 43,402
42,325 49,749 43,523 43,402
-21.2
2.7
3.3
-0.3
24.0
27.2
21.8
20.0
FY18
1Q
2Q
3Q
4QE
190,735 189,649 229,959 241,928
7.9
3.7
15.4
11.4
91,929 84,957 104,711 106,271
98,807 104,692 125,247 135,657
51.8
55.2
54.5
56.1
45,204 48,389 58,614 44,451
2,769 3,274 3,099 2,500
8,544 19,315 11,265 14,122
59,378 72,343 74,800 102,828
20,530 21,036 24,653 34,273
34.6
29.1
33.0
33.3
38,847 51,307 50,147 68,555
38,847 51,307 50,147 68,555
-8.2
3.1
15.2
58.0
20.4
27.1
21.8
28.3
FY17
776,048
0.1
417,746
358,302
46.2
172,440
12,217
78,511
252,155
73,155
29.0
179,000
179,000
-8.3
23.1
12 February 2018
5

11 February 2018
3QFY18 Results Update | Sector: Utilities
Coal India
BSE SENSEX
34, 0006
Bloomberg
Equity Shares (m)
M.Cap.(INRb)/(USDb)
52-Week Range (INR)
1, 6, 12 Rel. Per (%)
Avg Val, INRm
Free float (%)
S&P CNX
10,455
COAL IN
6316.4
1929.6 / 28.6
Earnings CAGR of 30%; valuations attractive; reiterate BUY
332 / 234
Coal India’s (COAL) 3QFY18 revenue grew ~6% YoY to INR216b (2% miss) on
0/18/-27
~7% YoY growth in offtake. FSA realization at INR1,182/t (down 8% YoY / 3%
1338.0
QoQ) missed our estimate of INR1,249/t, which we believe is due to lower
21.5
CMP: INR300
TP: INR401(+33%)
Buy
In-line; e-auction offset drag of power sector priority
Financials & Valuations (INR b)
Y/E Mar
2018E 2019E 2020E
Sales
842.7
941.6 1,002.9
Adj. EBITDA
174.2
251.9
292.8
NP
114.7
166.2
193.0
EPS (INR)
18.5
26.8
31.1
EPS Gr. (%)
23.8
44.9
16.2
BV/Sh. (INR)
41.4
44.0
47.1
RoE (%)
44.7
60.8
66.0
Valuations attractive; reiterate BUY
RoCE (%)
45.5
62.2
67.6
We believe COAL will continue to be the key fuel for electricity generation
P/E (x)
16.2
11.2
9.6
growth in India for 5-10 years at the least. Solar power is the only viable
P/BV (x)
7.3
6.8
6.4
dispatches to non-power customers (these fetch a premium). Preference
was given to the power sector due to spike in demand. E-auction realization
surprised positively, increasing 24% QoQ to INR1,998/t (our estimate:
INR1,800/t), which finally reflected the rising price trend for 6-8 months.
Adjusted EBITDA (ex-OBR) increased 19% YoY to INR55.4b (in-line) aided by
slightly lower cost of production. Though we are keeping overall estimates
unchanged, we have increased e-auction prices at the cost of FSA
realization, accounting for temporary priority to the power sector.
Estimate change
TP change
Rating change
competition but its growth will be capped by land shortage and variability.
Therefore, we believe COAL will be able to achieve 6-7% volume growth.
Concerns around grade slippage and wage hike are now behind. COAL is
planning to move to GCV-based pricing, in line with the global practice. This
is unlikely to impact margins because some consumers may pay less, but
there will be another set of consumers who will have to pay more. Volume
growth, operating leverage, closure of unviable underground mines and high
natural attrition are key drivers of earnings. We expect 30% earnings CAGR
over two years (FY18-20E). Valuations are attractive at 5.4x FY20E
EV/EBITDA and 5-8% dividend yield. We value the stock at INR401/share
based on 7.5x FY20E EV/EBITDA. Reiterate
Buy.
1Q
191,617
4.0
34,151
17.8
6,699
-1,069
1,209
12,066
39,378
15,860
40.3
23,518
23,518
-23.3
FY18
FY17 FY18E
2Q
3Q
4QE
181,483 216,433 252,869 782,206 842,688
11.9
6.0
9.1
0.3
7.7
12,888 55,405 69,961 149,121 172,691
7.1
25.6
27.7
19.1
20.5
7,146
7,511
8,025 29,101 29,380
578
9,226
3,444 26,722 12,180
1,007
974
385
4,117
3,575
6,107
8,409 13,014 55,156 39,596
10,264 46,102 71,121 144,337 167,151
6,576 16,052 15,471 51,660 53,958
64.1
34.8
21.8
35.8
32.3
3,689 30,050 55,649 92,677 113,193
3,689 30,050 55,649 92,677 113,193
-38.5
4.2
104.8
-34.9
22.1
FY18
Var.
3QE
(%)
219,894 (2)
7.7
55,376 0
25.2
7,078 6
3,641
961 1
5,191 62
48,886 (6)
15,644 3
32.0
33,243 (10)
33,243 (10)
15.2
E: MOSL estimates
Quarterly performance INR million
Y/E March
Sales
Change (%)
Adj. EBITDA
As of % Sales
Depreciation
OBR
Interest
Other Income
PBT
Tax
Tax Rate (%)
Reported PAT
Adjusted PAT
Change (%)
1Q
184,219
-5.6
44,879
24.4
6,672
2,331
890
11,306
46,293
15,641
33.8
30,653
30,653
-19.1
FY17
2Q
3Q
4Q
162,125 204,146 231,716
-7.3
4.2
8.3
8,851 46,673 48,719
5.5
22.9
21.0
6,921
7,011
8,498
1,425
8,124 14,843
970
1,107
1,151
14,125 11,167 18,558
13,661 41,598 42,784
7,660 12,754 15,606
56.1
30.7
36.5
6,001 28,845 27,179
6,001 28,845 27,179
-76.2
-21.7
-35.9
12 February 2018
6

Hindustan Zinc
BSE SENSEX
34,006
S&P CNX
10,455
9 February 2018
Update
| Sector:
Metals
CMP: INR304
TP: INR342(+13%)
Getting more aggressive on volume growth
Expect special dividend again; maintain Neutral
Neutral
Stock Info
Bloomberg
Equity Shares (m)
52-Week Range (INR)
1, 6, 12 Rel. Per (%)
M.Cap. (INR b)
M.Cap. (USD b)
Avg Val, INRm
Free float (%)
HZ IN
4,225
331 / 227
-3/3/-24
1,283.9
19.9
674.0
35.1
Financials Snapshot (INR b)
Y/E March
2018E 2019E 2020E
Sales
220
295
285
EBITDA
122.9 181.4 170.5
NP
91.1 140.9 135.6
Adj. EPS (INR)
21.6
33.3
32.1
EPS Gr(%)
9.6
54.6
-3.8
BV/Sh. (INR)
49.2
70.5
91.1
RoE (%)
35.3
55.7
39.7
RoCE (%)
44.8
76.5
52.8
P/E (x)
14.5
9.4
9.8
P/BV
12.2
8.2
8.4
Shareholding pattern (%)
As On
Dec-17 Sep-17 Dec-16
Promoter
64.9
64.9
64.9
DII
31.3
1.7
1.3
FII
2.2
2.2
3.0
Others
1.7
31.2
30.8
FII Includes depository receipts
Stock Performance (1-year)
Hind.Zinc
Sensex - Rebased
440
380
320
260
200
We met the management of Hindustan Zinc (HZ). Key highlights:
HZ’s mine production ramp-up to 1.2mtpa (v/s 907kt in FY17) is on schedule.
The production run-rate is likely to be achieved in any one of the quarters
during FY19 itself.
This makes us more comfortable on our estimates of 1.05mt
for FY19 and 1.16mt for FY20. There is a possibility of some upside in FY19.
As the mix of silver-rich ore increases,
silver production will increase at a
faster rate.
With the commissioning of Fumers and ramp-up at SK mine, HZ
expects silver production to increase to 700-800t and ultimately to 1,000t.
HZ has
strong focus on enhancing Reserves and Resources (R&R).
Exploration
activities are intensifying further, encouraged by the findings so far. HZ is
strengthening its exploration team with the best in the world. Exploratory
drilling is likely to increase from 70km in FY17 to 200km in FY19. R&R has
increased from 146mt in FY04 to 404mt in FY17 and the plan is to increase it to
550mt. Strong focus on enhancing resources has ensured mine life of more
than 30 years at any time despite 10-fold increase in production in 12-13 years.
Cost of production is likely to decline by ~USD100/t to USD850/t
on full ramp-
up of vertical shaft, availability of coal linkage and operating leverage.
HZ is firming up plans to
further increase mine production by 25% to 1.5mt
at
a capex of USD1.5b over the next 3-4 years, as it is getting more confident on
new R&R findings. HZ is also exploring gold (Bagmara mine) and sulfate
resources, and is optimistic of finding sizable economical reserves.
The
pricing outlook for zinc remains bullish,
as demand continues to outstrip
supply. Though few new supplies (Gamsberg, HZ expansion, Century tailings,
etc) will begin in the near future, the market is expected to remain in deficit.
Expect special dividend in FY18:
With strong free cash flows, HZ is likely to
announce special dividend again. However, the dividend payout policy remains
unchanged at minimum of 30% payout. We have increased payout from 36% to
120% for FY18, while keeping it unchanged at 36% for FY19 onwards. At CMP,
the dividend yield is attractive at ~7% for FY18 and at least 3% thereafter.
We believe HZ will continue to deliver strong volumes
due to strong
management focus, investment in drilling and human resources. We maintain a
bullish zinc price outlook and expect LME to average at USD3,800/t in FY19 and
little lower at USD3,200/t in FY20. EBITDA is expected to increase 45-50%,
driven by volume growth, cost reduction and favorable LME.
We roll over our target price to FY20E and adjust for special dividend. New
target price at INR342 (earlier INR354) implies 12-13% upside and 7% dividend
yield.
Maintain Neutral.
Recent volatility in stock price is an opportunity to buy
the stock, as business fundamentals remain strong, in our view.
12 February 2018
7

9 February 2018
3QFY18 Results Update | Sector: Oil & Gas
BPCL
BSE SENSEX
34,006
Bloomberg
Equity Shares (m)
M.Cap.(INRb)/(USDb)
52-Week Range (INR)
1, 6, 12 Rel. Per (%)
Avg Val, INRm
Free float (%)
S&P CNX
Buy
10,455
BPCL IN
EBITDA significantly below estimate; core GRM at USD6.5/bbl
655.6
BPCL reported core EBITDA of INR15.9b (est. of INR25.9b; -21% YoY, -44%
1,027 / 15.8
QoQ). This was lower than our estimate (despite above-estimate core
550 / 400
marketing margin) due to higher other expenditure (+15% YoY, +10% QoQ).
-3/-11/-22
It reported inventory gain of INR10.3b in refining and INR5.7b in marketing,
1881.0
resulting in EBITDA of INR32b (est. of 34.3b; -8% YoY, -10% QoQ). Forex loss
45.7
CMP: INR475
TP: INR549(+16%)
Financials & Valuations (INR b)
2018E
2019E
Y/E Mar
Sales
2395.2 2651.6
EBITDA
134.5
162.7
Adj. PAT
84.7
102.5
EPS (INR)
43.1
52.1
EPS Gr.%
4.7
7.8
BV/Sh.INR
184.6
218.6
RoE (%)
25.2
25.8
RoCE (%)
13.4
14.2
P/E (x)
11.9
9.8
P/BV (x)
2.8
2.3
2020E
2734.9
171.5
109.3
55.6
29.0
256.8
23.4
13.7
9.2
2.0
Estimate change
TP change
Rating change
Valuation view
stood at INR4.8b, as against a loss of INR1.5b in 3QFY17 and a gain of
INR5.6b in 2QFY18. Lower tax rate resulted in PAT of INR21.4b (-6% YoY, -9%
QoQ), higher than our estimate of INR20.9b.
Core GRM of USD4.9/bbl
was slightly higher than our estimate of
USD4.7/bbl. Core GRM stood at USD3.6/bbl in 3QFY17 and USD6.5/bbl in
2QFY18. Inventory gain stood at USD3/bbl in 3QFY18 v/s USD2.3/bbl in
3QFY17 and USD1.5/bbl in 2QFY18. Kochi refinery reported core GRM of
meager 4.1/bbl, suggesting that expansion there is yet to stabilize.
Domestic sales volume grew 9% YoY
(+9% QoQ) to 10.7mmt in 3QFY18.
Throughput in 3QFY18 stood at 7.3mmt v/s 6.8mmt in 3QFY17 and 7.0mmt
in 2QFY18. Implied gross marketing margin, including inventory gain,
declined 14% YoY and 12% QoQ to INR3.8/lit.
BPCL is expected to stabilize its Kochi expansion over the next few weeks,
which should expand the Kochi refinery GRM by ~USD2/bbl. The OMCs had
not taken commensurate price hikes in auto fuels in the latter part of CY17.
As a result, we have seen margin pressure on marketing margins.
Current decline in crude oil price provides ample room for normalization of
marketing margins. However, keeping in mind that there are several
elections scheduled over the coming months, we cut our assumption of
gross marketing margin on auto fuels from ~INR3/lit to INR2.5/lit in FY19
and INR2.75/lit in FY20.
As a result, we cut our FY19/20 estimates by 21%/17%. We value BPCL
based on an SOTP-based fair value of INR549/share (Mar-19 TP), which
includes INR375/share for its core business and INR175/share for
investments. Maintain
Buy.
12 February 2018
8

Mahindra & Mahindra
BSE SENSEX
34,006
Bloomberg
Equity Shares (m)
M.Cap.(INRb)/(USD b)
52-Week Range (INR)
1, 6, 12 Rel. Per (%)
Avg Val, (INRm)
Free float (%)
S&P CNX
10,455
MM IN
592.6
807.2 / 12.5
803 / 613
0/2/-4
1813.0
79.5
9 Feb 2018
Q3FY18 Results Update | Sector: Automobiles
CMP: INR750
TP: INR889 (+19%)
Buy
Operating performance miss led by higher other expense
3QFY18 volume grew 6.5% YoY (-3.8% QoQ) to 210.2k units, as tractor, UV and
3W volumes increased 6.3%, 5% and 8.5% YoY, respectively. Net realizations
grew 3.6% YoY (-0.6% QoQ) to INR546.6k (est. of INR553.3k). Net revenue grew
10.3% YoY (-4.4% QoQ) to INR114.9b (est. of INR116.3k).
EBITDA margin expanded 110bp YoY (-130bp QoQ) to 14.7% (est. of 16.1%), led
by higher-than-expected other expense (+21.4% YoY to INR13.9b). EBITDA
grew 19.6% YoY to INR16.9b (est. of INR18.7b). PBIT margin of Auto business
expanded 140bp YoY (-230bp QoQ) to 8.5%, and that of FES expanded 110bp
YoY (-80bp QoQ) to 20.5%. MM reported INR3.85b exceptional gain on
liquidation of its long-term investment in a subsidiary. Adj. PAT grew 22% YoY
(-28.1% QoQ) to INR10.1b (est. of INR10.3b).
Takeaways from the earnings call:
a) FY19 industry growth guidance: Tractor
8-10%, PVs 10-12% and CVs 10% (higher for LCVs). b) Strong product pipeline,
with launch of four new products in PV, two in tractors and one new ICV by
1HFY19. c) Tractor utilization level at ~90% at Mahindra and full utilization at
Swaraj; has enough scope to accommodate 8-10% volume growth in FY19. d)
RM cost pressure in 9MFY18: <2% for Autos (~2% price hike) and 3.5% for
Tractors (price hikes with lag effect). e) EVs – expect fast penetration of electric
3W; E-Alfa contribution ~20% of 3W passenger sales. f) Launching lighter and
efficient BS-6 engine. g) Focus on backward integration for EV.
Valuation and view:
We maintain FY19/FY20E EPS. The stock trades at 17.1x
FY19E and 15.5x FY20E consol. EPS. Maintain
Buy
with an SOTP-based TP of
INR889 (Mar-20 SOTP-based).
Financials & Valuations (INRb)
Y/E Mar
2018E 2019E 2020E
Sales
470.9 531.0 589.0
EBITDA
58.4
66.8
75.5
NP (incl. MVML)
40.1
46.2
52.5
Adj. EPS (INR) *
33.8
38.9
44.2
EPS Gr. (%)
7.2
15.2
13.5
Cons. EPS (INR)
37.7
43.9
48.4
BV/Sh. (INR)
241
268
300
RoE (%)
14.4
14.4
14.7
RoCE (%)
13.2
13.5
13.8
Cons. P/E (x)
19.9
17.1
15.5
* incl. MVML
Estimate change
TP change
Rating change
12 February 2018
9

9 February 2018
Q3FY18 Results Update | Sector: Metals
Tata Steel
BSE SENSEX
34,006
Bloomberg
Equity Shares (m)
M.Cap.(INRb)/(USDb)
52-Week Range (INR)
1, 6, 12 Rel. Per (%)
Avg Val, INRm
Free float (%)
S&P CNX
10,455
TATA IN
971.4
664/10.4
747 / 404
-5/13/38
3263.0
68.7
CMP: INR684
TP: INR778 (+14%)
Neutral
Lower cost of production driving EBITDA beat
Margin outlook robust, but rights issue drags valuations
TATA reported a strong operating performance in 3QFY18. Consol. EBITDA rose
21% QoQ to INR57b, driven by 7% volumes growth and expansion in EBITDA per
ton for Indian operations (TSI). Other businesses, however, were muted. A 10%
beat to EBITDA estimate was driven by lower-than-expected cost of production at
TSI. Reported PAT was impacted by INR11b provision toward various regulatory
demands against Indian mines. Adj. PAT grew robustly by 86% QoQ to INR24.4b.
Key highlights of results
TSI:
EBITDA per ton rose INR3,066 QoQ to INR14,025/t, led by average net
realization (NSR) increase of INR1,330/t, while the rest is explained by lower
cost of coking coal, specific consumption of coke, and lower purchase of
pellets, among others.
Europe (TSE):
Sales declined 6% QoQ to 2.44mt due to seasonal factors.
EBITDA/t declined USD4 QoQ to USD40 due to manufacturing expenses,
despite an expansion of spreads by EUR34 to EUR270/t.
Margin outlook robust; rights issue drags valuations; Maintain Neutral
Margins for both TSI and TSE are expected to expand further in 4QFY18 due to
expansion of steel spreads in India and operating leverage at TSE. There will be
a loss of 15 days production at the Odisha plant due to a breakdown.
The steel market outlook has improved for the near-to-medium term, led by
declining exports from China and improving industrial production across the
world. This augurs well for TATA.
TATA has launched an INR127b rights issue, which will expand equity by 24%,
and dilute FY20E EPS by 10% and target price by 9% to INR778 (Exhibit 4),
implying a 14% upside. TATA is also bidding for stressed assets under NCLT. It
remains to be seen if it will be value-accretive. Maintain
Neutral.
4Q
6,830
-1.6
338,960
14.9
70,252
218.6
20.7
154
12,631
15,892
1,522
43,250
-45,199
-1,948
9,760
22.6
-11,708
33,435
1Q
5,830
7.8
295,568
17.2
49,740
53.4
16.8
132
13,437
15,011
1,555
22,846
-6,289
16,557
7,405
32.4
9,152
15,352
FY18
2Q
3Q
6,450 6,560
14.2
7.4
324,641 334,466
23.1
19.6
47,207 56,969
58.9
61.0
14.5
17.0
112
134
13,499 13,273
14,733 14,751
2,532 2,259
21,507 31,205
-147 -11,235
21,359 19,969
11,380 9,508
52.9
30.5
9,980 10,461
10,205 24,100
FY17
FY18E
3QE
6,447
5.5
312,131
11.6
51,952
46.8
16.6
124
13,657
15,086
1,343
24,553
24,553
9,109
37.1
15,444
15,517
4QE
6,791 24,000 25,631
-0.6
-7.4
6.8
331,525 1,134,532 1,286,200
-2.2
-3.2
13.4
61,233 167,764 215,149
-13
121.2
28.2
18.5
14.8
16.7
141
104
130
13,694 50,723 53,903
15,113 56,784 59,608
1,932
5,274
8,277
34,358 65,531 109,916
-79,512 -17,672
34,358 -13,981 92,244
12,012 27,782 40,306
35.0
42.4
36.7
22,346 -41,762 51,939
22,399 37,742 72,056
vs Est
(%)
2
33
7
69
10
30
2
8
-3
-2
68
27
-19
4
-18
-32
55
Financials & Valuations (INR b)
Y/E March
2018E 2019E 2020E
Net Sales
1,286 1,279
691
EBITDA
215
228
164
PAT
69
84
74
EPS (INR)
57.7
69.4
61.5
Gr. (%)
51.9
20.4 -11.5
BV/Sh (INR)
397
457
509
RoE (%)
15.9
16.3
12.7
RoCE (%)
11.8
11.7
9.7
P/E (x)
11.9
9.9
11.1
P/BV (x)
1.7
1.5
1.3
Estimate change
TP change
Rating change
Quarterly Performance (Consolidated) INR million
Y/E March
1Q
Sales (k tons)
5,410
Change (YoY %)
-14.5
Net Sales
252,298
Change (YoY %)
-16.7
EBITDA
32,420
Change (YoY %)
16.9
(% of Net Sales)
12.8
EBITDA(USD/tss)
90
Interest
10,707
Depreciation
12,417
Other Income
1,367
PBT (before EO Inc.)
10,662
EO Income(exp)
-35,231
PBT (after EO Inc.)
-24,568
Total Tax
7,405
% Tax
69.4
Reported PAT
-31,973
Adj. PAT (after MI & asso)
3,400
FY17
2Q
3Q
5,650 6,110
-10.2
-4.1
263,710 279,565
-10.0
-0.3
29,700 35,393
62.3 356.3
11.3
12.7
79
86
13,511 13,874
14,677 13,797
1,084 1,301
2,597 9,022
634
284
3,230 9,306
3,634 6,984
139.9
77.4
-403 2,322
-1,127 2,035
12 February 2018
10

9 February 2018
3QFY18 Results Update | Sector: Oil & Gas
HPCL
Buy
BSE SENSEX
34,006
Bloomberg
Equity Shares (m)
M.Cap.(INRb)/(USDb)
52-Week Range (INR)
1, 6, 12 Rel. Per (%)
Avg Val, INRm
Free float (%)
S&P CNX
10,455
HPCL IN
EBITDA significantly below estimate; core GRM at USD6.1/bbl
1526
HPCL’s reported EBITDA of INR31.6b (+7% YoY, +9% QoQ) in 3QFY18 was
602.6 / 9.5
higher than our estimate of INR27.9b. However, EBITDA adjusted for inventory
493 / 327
gains stood at INR16.9b (-8% YoY, -20% QoQ), much below our estimate of
-4/-17/-17
1903.0
INR23.2b, primarily led by lower core marketing margin and GRM. HPCL
48.9
reported total inventory gain of INR14.8b in 3QFY18: INR6.4b (~USD2.94/bbl)
CMP: INR395
TP: INR530(+35%)
Financials & Valuations (INR b)
Y/E Mar
2018E 2019E
Net Sales
2,185 2,433
EBITDA
102.0 125.3
PAT
55.5
65.3
EPS (INR)
36.4
42.8
Gr. (%)
(10.6)
17.6
BV/Sh (INR)
157.0 184.7
RoE (%)
25.1
25.0
RoCE (%)
14.1
13.9
P/E (x)
11.5
9.8
P/BV (x)
2.7
2.3
EV/EBITDA(x)
8.5
7.1
2020E
2,504
133.9
69.5
45.6
6.5
214.2
22.8
13.1
9.2
2.0
6.8
Estimate change
TP change
Rating change
in refining and INR8.4b in marketing. The quarter witnessed a forex gain of
INR2.7b. PAT rose 11% YoY (+12% QoQ) to INR19.5b (est. of INR14.7b).
Core GRM stood at USD6.1/bbl,
lower than our estimate of USD7.1/bbl. GRM
in 3QFY17 and 2QFY18 stood at USD3.9/bbl and USD5.6/bbl, respectively. After
declining from USD7.3/bbl in 3QFY18 to USD6.2/bbl in Jan’18, SG GRM has
been hovering at ~USD7/bbl over the past few days. We build in GRM of
USD6.5/bbl in FY19-20.
Marketing sales volume grew 2% YoY
(+8% QoQ) to 9.4mmt in 3QFY18.
Refining throughput stood at 4.5mmt in the quarter v/s 4.7mmt in 3QFY17 and
4.6mmt in 2QFY18. Implied gross marketing margin including inventory has
declined 21% YoY (-19% QoQ) to INR3.1/lit. Implied core gross marketing
margin has declined 29% YoY (-33% QoQ) to INR2.3/lit.
Valuation view:
The quarter witnessed a sharp decline in auto fuel margins, as the
OMCs were unable to pass on the increase in crude oil prices to end-consumers in
light of the Gujarat assembly elections. However, they have been increasing their
margins steadily post 3QFY18. A declining crude and stable exchange rate would
help them regain their marketing margins soon. However, we are in for a series of
elections this year. As a result, we cut our assumption for marketing margins from
~INR3/lit to INR2.5/lit in FY19E and INR2.75/lit in FY20E. We cut our EPS estimates
by 26% for FY19 and by 20% for FY20. We roll over our valuation to Mar’19. Valuing
refining at 6x EV/EBITDA, marketing at 8x EV/EBITDA and pipeline at 7.5x
EV/EBITDA, we reiterate
Buy
with a target price of INR530.
12 February 2018
11

10 February 2018
3QFY18 Results Update | Sector: Media
Sun TV
Buy
BSE SENSEX
34,006
Bloomberg
Equity Shares (m)
M.Cap.(INRb)/(USDb)
52-Week Range (INR)
1, 6, 12 Rel. Per (%)
Avg Val, INRm
Free float (%)
S&P CNX
10,455
SUNTV IN
394
383.2 / 6.0
1097 / 652
-5/29/12
1365.0
25.0
CMP: INR973
TP: INR1,225(+26%)
Ad growth revives; digitization-led subscription revenue to witness
robust growth
EBITDA up 12% YoY:
Standalone revenue grew 16% YoY to INR6.8b (in-line), led
by 22% ad revenue growth and 16% domestic subscription growth. EBITDA grew
12% YoY to INR4.9b (4% miss), with 260bp YoY margin contraction to 72%.
Production cost was high during the quarter due to shift from private to
commission model, and high-value fiction content. PAT grew 11% YoY to INR4.1b
(10% miss), below EBITDA growth, largely on lower other income. Board
declared an interim dividend of INR2.5/share.
Subscription, ad growth to fire:
SUNTV remains a sweet spot, with both
subscription and ad revenue firing on all cylinders. Management indicated that
potentially 10-12m Tamil Nadu analog subscribers are likely to move to digital
cable by FY19, offering INR3.5b incremental revenues. Of these, already 3m set
top boxes are seeded by Arasu and other MSOs. Further improvement in rating
across Tamil Nadu, Malayalam and Kannada channels is allowing healthy ad
growth. We expect revenue/PAT CAGR of 16%/24% over FY18-20.
Concall highlights:
1) Incremental INR3.5b revenue to come from 10-12m
digitized subscribers in TN. Of these, 3m are seeded, so revenues should be
recognized in coming quarter, and the rest by Sept’18 as per ARASU’s
notification to MIB. 2) Healthy ratings across Tamil Nadu, Malayalam and
Kannada genre should lead to double-digit ad revenue growth in FY19. 3)
Presently, two slots each in prime time and non-prime time are on commission
model. Overtime, it will be a 50:50 mix of both commission and PP model.
Maintain Buy with a revised TP of INR1,225:
Despite offering healthy 42%
returns over the past year, SUNTV is trading at attractive valuation of 27x/23x on
FY19E/20E EPS, at ~20% discount to ZEEL. SUNTV has garnered 26% RoCE, which
is likely to jump to over 30% in the next two fiscals. We value SUNTV on 30x on
Dec’19 EPS of INR41, arriving at a TP of INR1,225 (v/s earlier INR1,005). Our 30x
valuation is still at a 17% discount to ZEEL, providing further room as SUNTV
delivers healthy earnings growth.
FY17
FY18
4Q
5,825
3.1
1,889
3,936
67.6
767
2
374
3,541
1,182
33.4
0
2,359
2,359
5.4
40.5
1Q
7,863
3.4
3,380
4,484
57.0
1,035
1
371
3,819
1,302
34.1
0
2,516
2,516
8.0
32.0
2Q
6,759
8.1
1,798
4,961
73.4
1,027
1
372
4,306
1,459
33.9
0
2,847
2,847
5.3
42.1
3Q
6,833
15.9
1,912
4,920
72.0
1,145
1
291
4,066
1,397
34.3
0
2,670
2,670
11.2
39.1
4QE
6,947
19.3
1,938
5,009
72.1
957
3
360
4,408
1,511
34.3
0
2,898
2,898
22.8
41.7
FY17
25,583
6.8
8,221
17,361
67.9
3,911
13
1,466
14,904
5,109
34.3
0
9,794
9,794
14.2
38.3
FY18E
28,402
11.0
9,028
19,374
68.2
4,163
5
1,394
16,599
5,669
34.1
0
10,931
10,931
11.6
38.5
3Q
5,894
2.8
1,497
4,397
74.6
1,107
7
389
3,673
1,272
34.6
0
2,401
2,401
11.0
40.7
Est Var
3QFY18E (%)
6,826
0
15.8
1,708
12
5,118
-4
75.0 -296bp
1,043
10
3
-82
438
-34
4,510
-10
1,547
34.3
0
2,964
-10
2,964
-10
23.4
43.4 -434bp
Financials & Valuations (INR b)
2018E 2019E
Y/E Mar
Net Sales
28.4
33.6
EBITDA
19.4
23.4
PAT
10.9
14.1
EPS (INR)
27.7
35.8
Gr. (%)
11.6
29.1
BV/Sh (INR)
110.2
121.7
RoE (%)
26.1
30.9
RoCE (%)
26.1
30.9
P/E (x)
35.1
27.2
P/BV (x)
8.8
8.0
EV/EBITDA (x)
19.2
15.7
2020E
38.5
26.9
16.7
42.5
18.7
135.3
33.1
33.1
22.9
7.2
13.4
Estimate change
TP change
Rating change
Quarterly Performance (Standalone) (INR m)
Y/E March
Net Sales
YoY Change (%)
Total Expenditure
EBITDA
Margins (%)
Depreciation
Interest
Other Income
PBT
Tax
Rate (%)
MI & P/L of Asso. Cos.
Reported PAT
Adj PAT
YoY Change (%)
Margins (%)
1Q
7,608
10.4
3,244
4,364
57.4
1,008
1
216
3,571
1,240
34.7
0
2,331
2,331
19.0
30.6
2Q
6,255
10.2
1,592
4,663
74.6
1,030
2
488
4,119
1,415
34.4
0
2,704
2,704
21.7
43.2
12 February 2018
12

Aditya Birla Capital
BSE SENSEX
34,006
Bloomberg
Equity Shares (m)
M.Cap. (INR b) / (USD b)
52-Week Range (INR)
1, 6, 12 Rel. Per (%)
12M Avg Val (INR m)
Free float (%)
Financials & Valuations (INR b)
Y/E Mar
PBT Break-up
NBFC
Housing
AMC
Life Insurance
Consol PBT
Cons. PAT
Post MI
Growth (%)
RoE (%)
2018E
11.0
0.3
4.9
1.8
15.5
8.3
56.7
12.6
2019E
14.1
1.2
6.9
2.0
22.5
12.4
49.8
12.4
2020E
18.1
2.7
9.9
2.3
32.2
18.3
47.4
13.7
S&P CNX
10,455
ABCAP IN
2201
Robust growth and healthy asset quality intact
372/5.7
Aditya Birla Capital (ABCL) reported a healthy quarter, with consolidated PBT
264 / 156
growing 30% YoY to INR4.1b, but reported PAT increasing 12% YoY due to
-8/-/-
normalization of tax rate (36% v/s 21% in the year-ago period). Base quarter
1082.0
had a one-off tax gain of ~INR400m.
27.2
NBFC segment:
Loan book grew 2%/33% QoQ/YoY to INR398b, driven by
10 February 2018
3QFY18 Results Update | Sector: Financials
CMP: INR168
TP: INR225 (+34%)
Buy
35% YoY growth in 9MFY18 disbursements. The share of mid-corporate
loans declined from 17% in 2QFY18 to 15% in the quarter, mainly due to
heavy repayments in the structured finance book. RoA/RoE was stable at
1.9%/14.5%, while the GNPL ratio inched up to 0.7% (from 0.5% in 2QFY18).
AMC segment:
While overall AAUM grew 24% YoY to INR2.4t, equity AAUM
rose by a stupendous 84% YoY to INR800b. Its share is now 33% v/s 22% in
3QFY17. We expect the increasing share of equity AAUM to drive PAT
margin expansion from 10bp in FY17 to 15bp by FY20.
Others:
1) HFC loan growth remains robust (+17% QoQ to INR67b); the
share of home loans continues to inch up (+300bp YoY to 60%). 2) HFC
margins and C/I ratio remain stable at 3%/77%. 3) 13
th
month persistency
(cum.) improved 170bp QoQ to 72.1%. 4) Product mix was stable, with the
share of ULIP/PAR/Non-PAR/Protection at 35%/28%/32%/5%.
Valuation view:
ABCL is a strong play on financialization of savings and low
penetration across the financial services business. The company is expected
to report 25%+ PAT CAGR over FY17-20, driven by strong traction in the
lending and asset management businesses. Lending (>70%) and AMC (~18%)
businesses are the key valuation drivers. Other ventures are at a nascent
stage, and their profit contribution is likely to be marginal in the near term.
We largely maintain our estimates. Buy with a target price of INR225
(SOTP FY20E based).
(INR Million)
Quarterly Performance
* FY17 numbers pro forma merged for Life Insurance business; Hence Annual numb
12 February 2018
13

10 February 2018
3QFY18 Results Update | Sector: Financials
Bank of Baroda
Buy
BSE SENSEX
34,006
Bloomberg
Equity Shares (m)
M.Cap.(INRb)/(USDb)
52-Week Range (INR)
1, 6, 12 Rel. Per (%)
Avg Val, INR m
Free float (%)
S&P CNX
10,006
BOB IN
Strong operational performance; stressed assets declining rapidly
2,310.5
BoB reported muted PAT of INR1.18b in 3QFY18 due to elevated
412.8 / 6.4
provisioning expenses, even as revenue growth stood strong. NII stood at
207 / 134
INR43.9b (+40% YoY), although other income declined 6% YoY, led by a 39%
-3/1/-35
YoY decline in treasury gains. However, controlled opex (flat QoQ) enabled
2190.0
41% YoY growth in PPoP to INR36.5b (much ahead of our estimate), leading
41.3
CMP: INR156
TP: INR185 (+19%)
Financials & Valuations (INR b)
Y/E March
2018E
2019E
NII
155.7
175.8
OP
127.2
145.0
NP
NIM (%)
EPS (INR)
EPS Gr. (%)
BV/Sh. (INR)
ABV/Sh. (INR)
RoE (%)
RoA (%)
Valuations
P/E(X)
P/BV (X)
P/ABV (X)
8.6
2.3
9.8
182.1
161.3
112.4
2.0
0.1
16.0
1.0
1.4
25.9
2.5
16.7
70.7
168.2
124.7
5.5
0.3
9.4
0.9
1.3
2020E
195.3
165.4
44.1
2.5
23.7
42.0
182.1
145.0
8.8
0.5
6.6
0.9
1.1
to a 443bp improvement in the cost-income ratio to ~40%
NII growth was led by (i) continued traction in loan growth, (ii) 135bp QoQ
improvement in domestic CASA mix to 40.6%, (iii) slower growth of 8% YoY
in low-margin international business, and (iv) improvement in asset mix, led
by 33% YoY growth in retail loans. BOB further benefitted from interest on
income tax refund amounting to INR3.3b, adjusting for which,
global/domestic NIM expanded 21/29bp QoQ.
Overall advances portfolio grew 14% YoY (domestic loan book up 16.4% YoY
to INR2.9t), but deposit base fell 3% YoY/2% QoQ. CD ratio, thus, rose 326bp
QoQ to 69.7%.
Slippages were elevated at INR47.97b (annualized slippage ratio of 4.8%,
gross slippages of INR56.3b), led by INR31b of slippages from the
restructured book. Telecom sector NPL rose sharply to INR20.1b from
INR2.14b in 2QFY18. GNPLs, thus, rose 4.7% QoQ, but healthy provisioning
enabled a controlled 1.4% QoQ rise in NNPLs. PCR, thus, improved 200bp
QoQ to 59.7% (68% incl. technical write-offs). O/s restructured assets fell
23% QoQ to INR90.2b, driving net stressed assets lower to
6.7%
of loans.
BOB made provision of INR1.45b toward IBC accounts; has to provide
another INR8.57b in 4QFY18. Total exposure to NCLT account is INR113.4b.
Other highlights:
a) Average daily CASA ratio increased slightly to 38.6%. b)
Tier-1 ratio declined 9bp QoQ to 9.52%, while CET-1 ratio stood at 8.28%.
Valuation and view:
While near-term earnings volatility is likely to continue,
we like management’s focus on cleaning up the balance sheet and laying the
foundation for sustainable growth. We expect stress addition and credit
costs to moderate from FY19, but cut FY18E/FY19E/FY20E earnings by
68%/38%/16%. We build in government capital infusion of INR53.75b in our
estimates. Maintain
Buy
with a revised TP of INR185 (1.3x Mar-20E ABV).
FY17
2Q
34,261
15,614
49,875
22,973
26,902
21,442
17,958
8,944
3,422
5,521
5,675
3,541
429
11.4
193.4
5.5
63.0
3Q
31,344
17,750
49,093
23,141
25,952
17,562
20,795
5,157
2,630
2,527
5,899
3,500
426
11.4
190.1
5.4
64.5
4Q
33,283
19,773
53,056
25,390
27,666
23,432
26,230
1,436
2,425
-989
6,017
3,833
427
10.5
180.8
4.7
66.8
1Q
34,050
15,512
49,561
23,080
26,481
20,951
23,681
2,801
767
2,034
5,706
3,776
462
11.4
195.2
5.2
66.3
FY18
2Q
37,205
17,371
54,576
24,158
30,418
23,968
23,294
7,125
3,571
3,554
5,832
3,873
463
11.2
195.7
5.1
67.2
FY17
3Q
43,940
16,730
60,671
24,170
36,501
31,411
34,265
2,236
1,118
1,118
5,733
3,994
485
11.3
198.5
5.0
68.0
4Q
40,530
19,996
60,525
26,775
33,751
33,751
30,582
3,168
1,289
1,879
5,866
4,235
494
10.9
210.1
5.0
57.5
135,134
67,581
202,715
92,964
109,751
83,571
85,024
24,727
10,896
13,831
6,017
3,833
427
10.5
180.8
4.7
66.8
(INR Million)
FY18
155,725
69,608
225,333
98,182
127,151
104,898
111,821
15,330
6,745
8,585
5,866
4,235
494
10.9
210.1
5.0
57.5
Quarterly Performance
1Q
33,711
14,444
48,155
21,460
26,695
21,125
20,041
6,654
2,418
4,236
5,622
3,628
430
11.2
207.8
5.7
60.2
Net Interest Income
Other Income
Total Income
Opera ti ng Expens es
Operating Profit
Core Operating Profit
Provi s i ons
Profit before Tax
Ta x
Net Profit
Operating Parameters
Depos i t (INR b)
Loa n (INR b)
Asset Quality
Gros s NPA (INR B)
Gros s NPA (%)
Net NPA (INR B)
Net NPA (%)
PCR (%)
12 February 2018
14

9 February 2018
3QFY18 Results Update | Sector: Metals
SAIL
Sell
BSE SENSEX
34,006
Bloomberg
Equity Shares (m)
M.Cap.(INRb)/(USDb)
52-Week Range (INR)
1, 6, 12 Rel. Per (%)
Avg Val, INRm
Free float (%)
S&P CNX
10,455
SAIL IN
4,130
388.0 / 6.0
101 / 53
-3/57/23
709.0
25.0
CMP: INR94
TP: INR71(-24%)
Turns PAT positive after 10 quarters
Strong earnings momentum, but valuations are rich; Maintain Sell
SAIL turned PAT positive – albeit marginally – after 10 quarters, driven by strong
steel prices and higher volumes. EBITDA increased 58% QoQ to INR14.4b (ahead
of est. of INR11.7b) on higher steel spreads and volumes. Adj. PAT improved
from loss of INR3.2b in 2QFY18 to PAT of INR659m. Interest cost increased 10%
YoY to INR6.7b and depreciation rose by 13% YoY to INR7.6b (both higher than
estimates).
Sales increased 14% YoY (6% QoQ) to 3.8mt on strong domestic demand.
Net sales realization increased 6% QoQ to INR40,646/t. Steel realization rose
~5% QoQ to INR35,800/t. The differential was contributed by by-product
sales, particularly coal chemicals.
EBITDA per ton increased 48% QoQ to INR3,820 on higher steel spreads
(+5% QoQ to INR20,773) and positive operating leverage. Employee cost was
lower (-7% YoY), but offset by higher other operating expenses (+20% YoY).
Strong earnings momentum, but valuations are rich; Maintain Sell
Operating performance has improved over the last few quarters, driven by a
stronger steel market, stabilization of new capacities, and control over
employee cost. The trend is likely to continue in 4QFY18.
Bhilai:
The recently commissioned new 3mtpa blast furnace will reverse the
declining trend in the operating performance. Steel melt shop is likely to get
commissioned in FY19, reducing operating cost.
Although SAIL is guiding for 17.5/19mt sales in FY19/FY20, we believe it is
prudent to expect 16-17mt sales in FY19/20E (8% CAGR). The strong long
product market in India will help SAIL in ramping up volumes.
EBITDA is likely to more than double to ~INR107b by FY20. The stock is
already trading at a rich EV/EBITDA of 7.9x FY20E, leaving little room for
upside. Maintain
Sell.
vs Est
(%)
3
3
6
Financials & Valuations (INR b)
2018E 2019E
Y/E Mar
568.7
666.1
Net Sales
44.7
83.0
EBITDA
-3.6
17.8
PAT
-0.9
4.3
EPS (INR)
-86.1 -589.8
Gr. (%)
87.8
91.6
BV/Sh (INR)
-1.0
4.8
RoE (%)
2.2
6.1
RoCE (%)
-106.5
21.7
P/E (x)
1.1
1.0
P/BV (x)
2020E
689.5
106.9
26.8
6.5
50.2
97.6
6.9
8.7
14.5
1.0
Estimate change
TP change
Rating change
Quarterly Performance (Consolidated)
Y/E March
(Standalone)
Sales (m tons)
Change (YoY %)
Realization (INR per ton)
Change (YoY %)
Net Sales
Change (%)
NSR:RM Spread (INR/t)
EBITDA
Change (YoY %)
EBITDA per ton (INR)
Interest
Depreciation
Other Income
PBT (after EO Inc.)
Total Tax
% Tax
Reported PAT
Adjusted PAT
Change (YoY %)
1Q
2.8
4.1
32,993
-6.6
92,381
-2.8
21,555
2,338
-386.2
835
5,941
6,002
893
-9,254
-3,899
42.1
-5,355
-5,042
56.8
FY17
FY18
FY17
FY18E
FY18E
2Q
3Q
4Q
1Q
2Q
3Q
4QE
3QE
3.6
3.3
3.4
3.0
3.5
3.8
3.8
13.1
14.1
3.65
31.4
13.8
-8.6
8.1
-1.7
14.2
10.3
8.6
7.5
10.6
31,182 34,237 36,827 38,242 38,467 40,646 42,900 33,814 40,191 39,528
-7.7
11.1
22.1
15.9
23.4
18.7
16.5
4.7
18.9
15.5
112,256 112,982 126,905 115,796 136,174 153,237 163,020 444,524 568,226 144,277
21.3
26.4
11.6
25.3
21.3
35.6
28.5
13.8
27.8
27.7
15,462 17,625 16,797 18,065 19,776 20,773 22,635 17,653 20,444
1,114
-428 -2,644
-839
9,143 14,402 21,735
380 44,441 11,695
-114.5
-96.9
-76.5 -135.9
720.5 -3,468.1 -922.0 -101.1 11,582.6 -2,835.1
310
-130
-767
-277
2,583
3,820
5,720
29
3,143
3,204
6,028
6,108
7,202
5,879
6,435
6,745
6,563 25,278 25,622
6,492
6,659
6,699
7,439
6,947
7,622
7,596
7,698 26,800 29,863
7,138
682
688
3,094
893
486
1,195
546
5,356
3,120
549
-12,531 -12,536 -14,188 -12,872 -7,403
823
8,019 -48,509 -11,434 -1,387
-5,215 -4,587 -6,475 -4,859 -2,013
391
1,764 -20,176 -4,716
-42
41.6
36.6
45.6
37.7
27.2
47.5
22.0
41.6
41.2
3.0
-7,316 -7,948 -7,713 -8,014 -5,391
432
6,255 -28,332 -6,718 -1,345
-6,358 -7,956 -7,715 -7,951 -3,224
659
6,255 -27,066 -4,655 -1,345
-18.1
-48.0
-37.3
57.7
-49.3 -108.3 -181.1
-29.8
-82.8
-83.1
23
19
4
6
118
-159
-132
-149
12 February 2018
15

9 February 2018
4QCY17 Results Update | Sector: Capital Goods
ABB
Sell
BSE SENSEX
34,006
Bloomberg
Equity Shares (m)
M.Cap.(INRb)/(USDb)
52-Week Range (INR)
1, 6, 12 Rel. Per (%)
Avg Val, INRm
Free float (%)
S&P CNX
10,455
ABB IN
211.9
336.9 / 5.2
1744 / 1170
13/10/10
165.0
25.0
CMP: INR1,590
TP: INR1,240(-22%)
Operational performance marginally below expectations
Operational performance below expectations:
4QCY17 revenue rose 11%
to INR27.8b, broadly in line with our estimate of INR27.5b. EBIDTA margin of
10.6% (-100bp YoY) too was below our estimate of 11.2%. EBITDA grew by a
muted 1.4% YoY to INR2.9b, below our estimate of INR3.1b, led by an
adverse revenue mix and execution of lower-margin orders. PAT of INR1.7b
too missed our estimate of INR1.9b.
Gross margin shrinks 340bp YoY to 32.6%:
Gross margin contracted 340bp
YoY to 32.6%. Despite this, EBIDTA margin contraction was controlled to
100bp to 10.6%, led by better control on employee cost (-60bp YoY to 6.6%
of sales) and other expenses (-180bp YoY to 15.4%).
4Q order inflow declines on account of higher base:
Order inflow declined
48% YoY to INR29.1b in 4QCY17 on account of a higher base (4QCY16 had a
large HVDC order finalization of INR36b) and absence of finalization of large
orders. Excluding the large order of INR36b in 4QCY16, order inflow
improved 45% YoY. Key sectors driving order inflow are infrastructure and
transport, metals and mining; some green shoots are also visible on the
industrial capex side. Order backlog stands at INR115b (+5% YoY), providing
revenue visibility of 1.3x its CY17 revenue.
Valuation view:
Management is optimistic on digitalization opportunity on the
industrial side; early green shoots are visible in the industrial capex cycle. It
remains focused on margin expansion via its efforts toward operational
efficiency and localization. We marginally tweak our CY18/19 estimates by
+5/1% to factor in execution pick-up of order book in hand. We maintain
Sell,
given premium valuations, with a TP of INR1,240 (35x Dec’19E EPS of INR35).
(INR M)
Financials & Valuations (INR b)
Y/E Dec
2017 2018E
Net Sales
115.9
123.2
EBITDA
11.2
12.9
Adj PAT
6.4
7.4
Adj EPS (INR)
30.1
35.0
EPS Gr (%)
52.0
16.2
BV/Sh (INR)
195.2
221.0
RoE (%)
15.4
15.8
RoCE (%)
22.9
23.7
P/E (x)
52.8
45.4
P/BV (x)
8.1
7.2
2019E
122.0
15.0
9.2
35.5
1.5
247.3
14.4
21.7
44.7
6.4
Estimate change
TP change
Rating change
Quarterly Performance
Y/E December
Sales
Change (%)
EBITDA
Change (%)
As % of Sales
Depreciation
Interest
Other Income
PBT
Tax
Effective Tax Rate (%)
Reported PAT
Adj. PAT
Change (%)
1Q
20,035
10.4
1,808
25.9
9.0
359
223
149
1,376
442
32.1
854
934
72.0
CY16
2Q
3Q
20,947 20,550
8.4
4.4
1,136
1,183
-29.5
-24.1
5.4
5.8
357
406
197
196
299
299
881
880
324
389
36.8
44.2
556
646
556
706
-18.7
20.1
4Q
25,078
3.4
2,897
10.1
11.6
389
303
254
2,460
833
33.8
1,627
1,627
25.8
1Q
21,689
8.3
1,715
-5.2
7.9
376
212
186
1,312
428
32.6
884
884
-5.3
CY17
2Q
3Q
22,237 19,234
6.2
(6.4)
1,473
1,342
29.7
13.4
6.6
7.0
383
389
231
152
326
378
1,185
1,178
435
344
36.7
29.2
751
1,134
751
834
34.9
18.2
CY16
4Q
27,794
10.8
2,937
1.4
10.6
432
178
188
2,515
800
31.8
1,715
1,715
5.4
85,094
6.2
6,945
-7.0
8.2
1510
919
1216
5,733
1,988
34.7
3,745
3,745
12.2
CY17E
89,614
5.3
7,361
6.0
8.2
1580
773
1210
6,218
2,018
32.5
4,200
4,200
12.1
MOSL
4Q
27,454
10.2
3,088
9.5
11.2
425
205
89
2,547
683
26.8
1,864
1,864
27.0
Var.
(%)
1.2%
-4.9%
-1.2%
-8.0%
-8.0%
12 February 2018
16

10 February 2018
3QFY18 Results Update | Sector: Oil & Gas
Oil India
Buy
BSE SENSEX
34,006
Bloomberg
Equity Shares (m)
M.Cap.(INRb)/(USDb)
52-Week Range (INR)
1, 6, 12 Rel. Per (%)
Avg Val, INRm
Free float (%)
S&P CNX
10,455
OINL IN
801.5
285.6/4.4
389 / 258
-4/19/-17
204.0
33.9
CMP: INR356
TP: INR425 (+19%)
Significantly beat on EBITDA led by higher sales and lower opex
OINL’s revenue of INR28.5b (+20% YoY, +15% QoQ) was ahead of our estimate
of INR27.2b, led by higher-than-expected sales. Reported EBITDA of INR12.2b
(+84% YoY, +21% QoQ) was significantly above our estimate of INR10.5b, led by
lower other expenditure at USD5.9/boe v/s USD8.8/boe in 3QFY17 and
USD4.6/boe in 2QFY18. PAT came in at INR7.1b (in-line; +55% YoY, +9% QoQ) –
the difference at the PAT level declined due to lower other income of INR2.1b
(est. of INR4.5b; -34% YoY, -36% QoQ).
Realization at USD559.4/bbl:
In 3QFY18, gross realization stood at
USD59.4/bbl (+21% YoY, +19% QoQ), led by rising crude oil prices. Production
of crude oil stood at 0.86mmt (+3% YoY, +1% QoQ) and of gas at 0.73bcm (-1%
YoY, -4% QoQ). Total production grew 1% YoY (-2% QoQ) to 1.59mmtoe. Sales
of oil stood at 0.83mmt (+1% YoY, -1% QoQ) and of gas at 0.6bcm (flat YoY, -5%
QoQ). Total sales grew 1% YoY (-3% QoQ) to 1.44mmtoe.
Valuation view:
We model Brent of USD60/bbl and INR/USD at 65.5/65.7 in
FY19/20. We expect EPS of INR40.9/42.2 in FY19/20. Oil prices have started
declining. We believe USD60-70/bbl should not be a concern for return of
subsidy regime. Rising gas price would be positive for the stock. Our SOTP-
based fair value stands at INR425 (incl. investment value of INR142). We value
the company at 8x FY20E adj. EPS of INR39.6, and add investments of INR142 in
IOCL, NRL and BCPL. The stock trades at 8.4x FY20E EPS of INR42.2. Dividend
yield is attractive at ~5%. Maintain
Buy.
(INR Billion)
FY17
FY18
3Q
23.8
7.1
6.6
28.0
7.1
2.8
1.0
3.2
6.1
0.0
6.1
1.5
25.1
4.5
18.8
4Q
24.4
28.3
5.9
24.4
0.2
3.3
1.0
8.7
10.4
11.5
-1.1
-1.3
-12.5
0.2
-95.9
1Q
23.3
5.0
8.7
37.5
1.3
2.9
1.0
1.5
6.4
0.0
6.4
1.9
29.4
4.5
-8.9
2Q
24.7
6.1
10.1
40.9
21.0
3.2
1.1
3.3
9.1
0.0
9.1
2.7
29.3
6.5
11.3
3Q
28.5
20.0
12.2
42.9
84.2
3.6
1.0
2.1
9.8
0.0
9.8
2.7
28.0
7.1
55.1
4QE
25.8
6.0
7.7
29.8
29.2
3.9
0.8
3.2
6.2
0.0
6.2
2.0
33.0
4.1
2,044
Financials & Valuations (INR b)
2018E 2019E 2020E
Y/E Mar
Sales
102.5 113.9 115.8
EBITDA
38.5
45.8
46.5
Adj. PAT
20.9
32.8
33.8
Adj. EPS (INR)
26.1
40.9
42.2
EPS Gr. (%)
-22.6
56.7
3.3
BV/Sh.(INR)
376.8 398.5 420.9
RoE (%)
7.1
10.5
10.3
RoCE (%)
5.6
7.9
7.7
P/E (x)
13.7
8.7
8.4
P/BV (x)
0.9
0.9
0.8
EV/EBITDA (x)
8.0
6.4
6.0
Div. Yield (%)
2.8
4.5
4.5
Estimate change
TP change
Rating change
Quarterly Performance
Y/E March
1Q
Net Sales
Change (%)
EBITDA
% of Net Sales
Change (%)
D,D&A
Interest
OI (incl. Oper. other inc)
PBT before exceptional
Exceptional item
PBT after exceptional
Tax
Rate (%)
PAT
Change (%)
22.2
-19.2
8.6
38.8
-20.4
2.3
1.0
2.4
7.7
0.0
7.7
2.8
36.2
4.9
-36.2
2Q
23.3
-2.8
8.4
35.9
8.6
2.5
1.0
3.9
8.8
0.0
8.8
2.9
33.7
5.8
-14.0
FY17
93.6
1.1
29.6
31.6
-3.6
10.9
4.0
18.3
33.0
11.5
21.5
6.0
18.1
15.5
-32.8
FY18E
102.4
9.3
38.8
37.9
31.1
13.6
3.9
10.2
31.5
0.0
31.5
9.3
29.6
22.2
43.1
FY18
Var. vs
3QE est (%)
27.2
14.4
10.5
38.7
58.1
3.5
1.0
4.5
10.6
0.0
10.6
3.5
33.0
7.1
55.6
0%
-7%
-21%
2%
8%
-53%
-7%
17%
5%
12 February 2018
17

Alkem Laboratories
BSE SENSEX
34,006
Bloomberg
Equity Shares (m)
M.Cap.(INRb)/(USDb)
52-Week Range (INR)
1, 6, 12 Rel. Per (%)
Avg Val, INRm
Free float (%)
S&P CNX
10,455
ALKEM IN
Strong numbers; operating leverage impact visible
120
Revenue grew 17% YoY to INR17.4b (est. of INR16.7b) in 3QFY18. EBITDA
263.6 / 4.1
came in at INR3.6b, with the margin at ~20.7% (est. of ~20%). This is despite
2468 / 1578
higher other expense (+410bp QoQ) due to higher promotional charges
0/19/0
related to the OTC business and doctors’ conferences. R&D expense stood at
95.0
INR927m (or 5.3% of sales). PAT was at INR1.7b, lower than our estimate of
34.1
10 February 2018
3QFY18 Results Update | Sector: Healthcare
CMP: INR2,182
TP: INR2,500(+15%)
Buy
Financials & Valuations (INR b)
Y/E Mar
2018E 2019E
Net Sales
63.0
73.1
EBITDA
11.8
14.0
PAT
7.5
10.6
EPS (INR)
63.0
88.9
Gr. (%)
-15.5
41.1
BV/Sh (INR)
422.5
491.5
RoE (%)
15.8
19.5
RoCE (%)
14.9
21.8
P/E (x)
34.6
24.5
P/BV (x)
5.2
4.4
2020E
83.9
16.8
13.1
109.9
23.6
576.6
20.6
23.1
19.9
3.8
Estimate change
TP change
Rating change
INR2.4b due to a higher tax rate. Tax rate includes one-time charge of
~INR448m related to the change in US tax laws.
Strong domestic business growth; expect growth to accelerate further in
2H:
Alkem’s domestic business grew by a robust 22% YoY to INR12.6b, led by
strong inherent growth, a lower base and channel refilling. The company is
expanding its presence in the domestic business via new product launches
and expansion into new therapies. We expect this strong growth
momentum to continue for at least two more quarters, led by a lower base
(related to demonetization and GST impact).
US business: Two thirds of pending portfolio to get approval in next 24
months:
US sales came in at ~USD55m (up 18% QoQ). Sequential increase in
US sales can be attributed to a seasonally strong quarter for Benzonatate
and the launch of Nexium and Prasugrel. US business margins will continue
improving on the back of operating leverage, as ~30 ANDA approvals are
expected for Alkem in the next 24 months.
Key concall takeaways:
a) All six facilities have EIR from the USFDA, with no
pending 483s. b) Tax rate for 3Q (adjusted for one off) was ~32% due to a 2%
increase in FY18E tax rate to ~27%; FY19E tax rate to be ~27%. c) Capex in
FY18E/19E to be ~INR6b/INR5b. d) There was no off in India business sales.
e) Domestic business is expected to grow in mid-teens. f) Sikkim facility will
start manufacturing in the next few months.
Arguing for a multiple re-rating:
We maintain
Buy
with a TP of INR2,500
@24x Dec 19E PER. We argue for a multiple re-rating, given the superior
earnings growth profile (>25% EPS CAGR over FY18-20E), improving return
ratios (RoICs to improve to ~30% by FY20E from ~20% in FY18E), net cash
balance sheet, and high exposure to the domestic business (~90% of profit
comes from the domestic business).
12 February 2018
18

Jindal Steel & Power
BSE SENSEX
34,006
S&P CNX
10,455
9 February 2018
Update
| Sector:
Metals
CMP: INR272
TP: INR361(+33%)
Buy
Production ramp-up encouraging
Volume growth at inflection; maintain Buy
Stock Info
Bloomberg
Equity Shares (m)
52-Week Range (INR)
1, 6, 12 Rel. Per (%)
M.Cap. (INR b)
M.Cap. (USD b)
Avg Val, INRm
Free float (%)
We visited Jindal Steel and Power (JSP)’s Angul, Raigarh and Tamnar facilities. Key
JSP IN
916
294 / 86
11/105/177
248.9
3.7
1945.0
38.0
takeaways from our visit:
Financials Snapshot (INR b)
Y/E Mar
2018E 2019E 2020E
Net Sales
275.3 359.1 386.1
EBITDA
64.0
95.0 100.6
PAT
-10.5
6.6
10.9
EPS (INR)
-11.5
7.3
11.9
Gr. (%)
-44.9 -163.1
63.4
BV/Sh (INR)
315.1 321.9 333.4
RoE (%)
-3.6
2.3
3.6
RoCE (%)
2.8
5.9
6.4
P/E (x)
-23.7
37.5
22.9
P/BV (x)
0.9
0.8
0.8
Shareholding pattern (%)
As On
Dec-17 Sep-17 Dec-16
Promoter
62.0
61.9
61.9
DII
6.4
5.5
1.8
FII
17.6
15.7
17.6
Others
14.1
16.9
18.7
FII Includes depository receipts
Stock Performance (1-year)
Jindal Steel
Sensex - Rebased
320
260
200
140
80
Angul – crude steel production ramping up well:
The newly-commissioned blast
oxygen furnace (BOF) is ramping up well. Hot metal from the blast furnace (BF) is
transferred to the BOF through torpedoes. The BOF is operating at 45 minutes per
batch, which will be gradually optimized to 35-40 minutes per batch. It has already
touched a peak of 27 heats per day (against capacity of 36-41 at optimized rate).
Crude steel production was 165kt in January, and is likely to increase to 280kt in
February, with a target of 400ktpm by May 2018. By this time, the second 2.5mtpa
billet caster will have commissioned. This will take told casting capacity from
3.7mtpa to 6.2mtpa and pave the way for full ramp-up of steel-making capacity.
Bottlenecks will shift to rolling capacity at Angul. However, excess semis will be
rolled in Patratu site in Jharkhand.
Raigarh – production rate improving; awaiting approval from Indian Railways:
Crude steel production was ~280kt in January. A similar production is expected in
February, despite fewer days. A total production of 810kt is expected in 4QFY18.
Rail production is about 200kt against nameplate capacity of 600kt. DFCC and Iran
are key orders. JSP is expecting approval from Indian Railways. If successful,
another 140kt of order is possible. The outlook for plate business is also improving
with increasing activity in gas pipeline orders in India.
Tamnar – very competitive fuel cost under PPAs:
The 2x250MW EUP-1 in
merchant and 2x600MW in EUP-2 in PPA/merchant was operating at full capacity
(~50% utilization on the 3,400MW capacity). In EUP-2, it was running 900MW
under long-term PPAs, while the remaining was sold in merchant market
(IEX/DEEP). The fuel cost under PPAs is very competitive at INR1.6-1.7/kWh. Coal
availability under FSA is good. E-auction coal availability remains an issue, but it is
gradually improving. Prices under e-auction are high, as Coal India has stopped
special e-auction for power sector. Coal supply quality under FSA has improved and
grade slippage is no longer an issue.
Volume growth at inflection; maintain Buy:
Looking at the progress at Angul and
Raigarh, we believe our volume estimates of 1.2mt for 4QFY18 (v/s 970kt in 3Q)
and 5.8mt (v/s 3.8mt in FY18) for FY19 appear comfortable. Steel production is at
inflection – we expect 29% CAGR to 6.4mt over FY18-20. Strong long product prices
in India, operating leverage, and timely volume growth augur well for earnings.
Nearly 25% of raw material cost is insulated from input price risk due to captive iron
ore mines and coal linkage. We remain positive on the stock – Buy with a target price
of INR361 (Exhibit 6).
12 February 2018
19

9 February 2018
3QFY18 Results Update | Sector: Capital Goods
Voltas
Neutral
BSE SENSEX
34,006
Bloomberg
Equity Shares (m)
M.Cap.(INRb)/(USDb)
52-Week Range (INR)
1, 6, 12 Rel. Per (%)
Avg Val, INRm
Free float (%)
S&P CNX
10,455
VOLT IN
Results exceed expectations driven by strong UCP performance
331
Results above expectations:
Sales grew 17% YoY to INR13.7b (in-line) in
198.4 / 3.1
3QFY18. EBITDA rose 34% YoY to INR1.2b; margin stood at 8.6% (+110bp
675 / 333
YoY) v/s our estimate of 7%, led by higher margins and sales contribution
-7/6/53
791.0
(40% in 3QFY18 v/s 34% in 3QFY17) from the UCP segment. PAT stood at
69.7
INR1b (+23% YoY) v/s our estimate of INR0.9b.
CMP: INR600
TP: INR630(+4%)
Financials & Valuations (INR b)
2018E 2019E
Y/E Mar
Net Sales
66.5
75.7
EBITDA
7.1
7.9
PAT
6.0
6.7
EPS (INR)
18.0
20.2
Gr. (%)
16.4
12.4
BV/Sh (INR)
113.2
128.2
RoE (%)
16.9
16.8
RoCE (%)
16.2
16.1
P/E (x)
33.3
29.7
P/BV (x)
5.3
4.7
2020E
86.7
9.0
7.6
23.0
13.8
145.2
16.8
16.2
26.1
4.1
Estimate change
TP change
Rating change
Quarterly Performance (Consolidated)
Y/E March
Sales
Change (%)
EBITDA
Change (%)
As of % Sales
Depreciation
Interest
Other Income
Extra-ordinary Items
PBT
Tax
Effective Tax Rate (%)
Reported PAT
Change (%)
Adj PAT
Change (%)
1Q
18,500
18.7
1,995
52.0
10.8
66
48
357
-9
2,248
651
28.9
1,597
55.7
1,587
54.8
UCP sales rise 32% YoY to INR5.4b; EBIT margin up 240bp YoY:
Room air
conditioner growth of 32% YoY was ahead of our estimate of +15%, driven
by a) channel restocking post GST and b) pre-buy before the implementation
of the new energy ratings for ACs from Jan’18. Market share stood at 23.7%
v/s 21.7% in 3QFY17. Margin improved 240bp YoY, led by a) operating
leverage on higher volumes and b) lower SG&A costs in a lean quarter.
EMP revenue up 7% YoY; margin at 7.1%:
Sales of INR7.5b (+7% YoY) were
below our estimate of INR8b; however, the margin expanded 320bp YoY to
7.1% due to the focus on profitable orders and good execution in
domestic/overseas jobs. VOLT has exposure of INR1.8b for under
construction/completed jobs in Oman and Dubai, where Carillion PLC
(recently declared bankruptcy) is the main contractor along with local
partners. Orders stood at INR5.5b (+24% YoY), with order book at INR45b.
Maintain Neutral; TP at INR630.
Despite intense competitive pressures in
the room AC segment, VOLT has been able to take market share without
sacrificing margins. We would watch out for the company’s (a)
pricing/positioning on inverters with the ratings changes from Jan’18 – a
successful transition would make us turn positive on the stock and b) launch
of washing machines and refrigerators in 2HFY19. Moreover, the projects
business has also stabilized, with a) margins recovering to 5-6% and b) a
revival in the domestic projects business.
INR Million)
Var.
Vs Est
0%
25%
FY17
FY18
FY17
FY18
FY17
2Q
3Q
4Q
1Q
2Q
3QE
4QE
3QE
9,672 11,805 20,351 19,446 10,367 13,747 22,951 60,328 66,511 13,768
-7.0
-6.7
9.7
5.1
7.2
16.5
12.8
5.5
10.2
16.6
687
890 2,219 2,123
857 1,186 2,926 5,791 7,092
951
6.4
58.0
22.7
6.4
24.8
33.3
31.9
33.8
22.5
6.9
7.1
7.5
10.9
10.9
8.3
8.6
12.8
9.6
10.7
6.9
63
60
56
61
61
61
67
245
250
65
33
22
58
35
22
19
34
160
110
20
658
597
386
550
512
170
352 1,998 1,585
450
0
0
-2
-20
0
0
0
11
0
-
1,249 1,405 2,493 2,596 1,287 1,277 3,177 7,395 8,317 1,316
421
437
496
727
343
301 1,041 2,089 2,412
395
33.7
31.1
19.9
28.0
26.6
23.6
32.8
28.2
29.0
30.0
782
815 2,005 1,879
954 1,004 2,138 5,114 5,955
901
20.9
42.2
22.1
17.7
22.0
23.2
6.6
38.8
16.4
10.5
782
815 2,003 1,859
954 1,004 2,138 5,103 5,955
901
20.9
47.9
45.7
17.1
22.0
23.2
6.7
42.6
16.7
10.5
-3%
11%
11%
12 February 2018
20

Tata Communications
BSE SENSEX
34,006
Bloomberg
Equity Shares (m)
M.Cap.(INRb)/(USDb)
52-Week Range (INR)
1, 6, 12 Rel. Per (%)
Avg. Val, INRm
Free float (%)
S&P CNX
10,455
TCOM IN
285
176.7 / 2.6
782 / 570
-5/1/-38
519.0
25.0
9 February 2018
Q3FY18 Results Update | Sector: Telecom
CMP: INR639
TP: INR750 (+17%)
Buy
Data business delivers, offsetting the roughness in Voice
Consol. EBITDA up 9% QoQ:
Consol. revenue fell 2.4% QoQ (-5.6% YoY) to
INR41.1b (3.6% miss) due to subdued voice revenue, partly offset by better data
revenue. Data EBITDA growth of 17% QoQ (led by sharp cost-optimization
measures) led to an 8.6% QoQ (+7.7% YoY) increase in consol. EBITDA to INR6.1b
(7% beat) and a 150bp QoQ expansion in margins to 14.9%. Voice EBITDA
dropped 28% QoQ to INR738m. PAT stood at INR101m. However, adjusted for
INR298m of one-time interest income from Tata Sons and INR160m tax jump
due to DTA revaluation, PAT stood at -INR37m v/s INR291m in 2QFY18.
Traditional business fuels data growth:
Traditional business witnessed a steep
400bp QoQ margin improvement to 31.6%, led by 2% revenue growth, coupled
with 3% cost savings. This acted as a key catalyst, driving a 4%/17% QoQ rise in
data revenue/EBITDA to INR28.8b/INR5.4b, with the margin at 18.7% (+210bp
QoQ). Further, transformation segment EBITDA grew 20% QoQ to INR404m.
Growth segment reported a 9% QoQ increase in EBITDA loss to INR622m.
Near-term earnings headwinds; long-term growth intact:
Management
indicated that TCOM could see revenue/EBITDA impact of USD50-55m/USD7-8m
in FY19E due to the sale TTSL to Bharti Airtel. Further, management is exploring
acquisition of TTSL’s enterprise business, but the contours of the deal remain
unknown. Subsequently, we cut EBITDA by 1%/4% for FY19/20E. However, over
the next 2-3 years, (a) completion of transformation exercise should improve the
traditional segment margin and (b) growth and ATM segments should
breakeven, driving healthy EBITDA CAGR of 20% over FY18-20E.
Maintain Buy with a revised TP of INR750:
We value the stock on SOTP,
ascribing 9.5x on data EBITDA of INR29.9b and 2.5x on voice EBITDA of INR2.8b,
arriving at a TP of INR750 (INR780 earlier). The stock offers additional INR176
option value toward the likely land demerger in the next 6-8 months.
4Q
42,937
-16.5
37,914
5,024
11.7
4,677
780
1,012
578
10,633
-10,055
-192
1.9
-30
-9,833
597
128.8
1.4
1Q
43,100
-3.3
37,514
5,586
13.0
4,447
761
444
822
0
822
461
56.0
39
322
322
-76.0
0.7
FY18
FY17
FY18E
2Q
3Q
4QE
3QFY18E
42,176 41,146 42,125 1,76,197 1,68,548 42,684
-6.5
-5.6
-1.9
-2.9
-4.3
-2.1
36,531 35,019 35,864 1,52,138 1,44,927 36,951
5,645 6,128 6,261 24,059 23,621
5,733
13.4
14.9
14.9
13.7
14.0
13.4
4,837 4,728 5,403 18,658 19,415
4,998
877
896
853
3,672
3,387
699
292
740
158
3,603
1,634
354
223 1,244
164
5,332
2,453
390
2,134
0
0 10,633
2,134
0
-1,911 1,244
164
-5,301
319
390
588 1,050
54
2,364
2,153
129
-30.8
84.4
33.0
-44.6
674.9
33.0
1
92
1
-25
134
13
-2,500
101
109
-7,640 -1,967
249
291
-37
109
2,791
685
249
-65.6 -597.3 -82.3
186.8
-75.8 1,297.8
0.7
-0.1
0.3
1.6
0.4
0.6
Est.
var (%)
-4
-5
7
146bps
-5
28
109
219
219
357
629
-59
-115
Financials & Valuations (INR b)
2018E 2019E 2020E
Y/E Mar
Net Sales
168.5 177.1 193.0
EBITDA
23.6
28.1
34.2
PAT
0.7
3.3
6.7
EPS (INR)
2.4
11.6
23.6
Gr. (%)
-75.8 383.2 102.9
BV/Sh (INR)
49.0
60.6
84.1
RoE (%)
-30.6
5.5
8.5
RoCE (%)
-33.3
7.2
12.2
P/E (x)
265.6
55.0
27.1
P/BV (x)
13.0
10.5
7.6
EV/EBITDA (x)
11.5
9.5
7.3
Estimate change
TP change
Rating change
Quarterly Performance (Consolidated) (INR m)
Y/E March
Net Sales
YoY Change (%)
Total Expenditure
EBITDA
Margins (%)
Depreciation
Interest
Other Income
PBT before EO expense
Exceptional expense
PBT
Tax
Rate (%)
MI & P/L of Asso. Cos.
Reported PAT
Adj PAT
YoY Change (%)
Margins (%)
1Q
44,569
-14.0
37,849
6,720
15.1
4,660
933
954
2,081
0
2,081
734
35.3
6
1,341
1,341
209.8
3.0
FY17
2Q
3Q
45,091 43,601
-12.1 -14.5
38,466 37,910
6,625 5,691
14.7
13.1
4,644 4,677
960
999
728
909
1,750
924
0
0
1,750
924
899
923
51.4
99.9
6
-7
845
7
845
7
1,303.7 -96.6
1.9
0.0
-67bps
-146
12 February 2018
21

Muthoot Finance
BSE SENSEX
34,006
Bloomberg
Equity Shares (m)
M.Cap. (INR b) / (USD b)
52-Week Range (INR)
1, 6, 12 Rel. Per (%)
12M Avg Val (INR m)
Free float (%)
Financials & Valuations (INR b)
Y/E Mar
NII
PPP
PAT
EPS (INR)
BV/Sh.(INR)
RoA on AUM%
RoE (%)
Div. Yld. (%)
P/E (x)
P/BV (x)
2018E
40.9
29.6
17.5
43.8
196.3
6.2
24.3
2.1
9.7
2.2
2019E
41.7
29.4
17.9
44.8
230.2
5.9
21.0
2.1
9.5
1.8
2020E
46.1
32.5
19.7
49.3
267.6
5.9
19.8
2.3
8.6
1.6
S&P CNX
10,455
MUTH IN
Growth remains elusive; strong margins lead to PAT beat
399.5
Muthoot Finance’s (MUTH) 3QFY18 PAT grew 59% YoY to INR4.6b (6% beat),
173.4/2.6
driven by strong margins and controlled opex. AUM grew 2.4% QoQ / 5%
526 / 325
YoY to INR283b – the best sequential growth since demonetization.
-9/-14/4
NII was up a staggering 47% YoY, driven by 470bp improvement in margins
333.0
off a low base. Yields came in at 22% in the quarter v/s average of ~20% –
26.4
9 February 2018
3QFY18 Results Update | Sector: Financials
CMP: INR424
TP: INR475 (+12%)
Neutral
this is despite an increase in NPLs due to stronger collections from overdue
buckets. MUTH has grown its collection team as a strategy to focus more on
repayments/renewals by customers rather than auctions.
Cost of funds declined 20bp QoQ to 8.6% – we believe cost of funds has
bottomed out now and should stay put or even rise, going forward.
However, interestingly, MUTH reduced its borrowings by 6% QoQ – this is a
reflection that, in the absence of growth, profits generated by the company
are used to pay down debt. Another interesting thing to note is that the
share of term loans jumped from 46% to 57% sequentially while that of CPs
reduced from 15% to 7%.
MUTH has managed to keep its quarterly opex in a tight band of INR3b-3.3b
per quarter for the past seven quarters. With 7% YoY opex growth, the C/I
ratio came in at 29%.
Asset quality deteriorated sharply – GNPLs were up 26% QoQ to INR15.9b.
Note that GNPLs have gone up 2.5x in the past two quarters alone, as the
company now prefers overdue collections/renewals by customers rather
than auctions. The management has guided to INR5b-6b increase in GNPLs
post migration to 90dpd in 4QFY18.
Valuation and view:
Since demonetization, growth has been elusive for gold
financiers. We believe growth will remain modest in the medium term. Asset
quality, too, has witnessed some stress in the past two quarters. We
increase our FY18-20 estimates by 3-7% to factor in stronger yields.
Maintain NEUTRAL with a TP of INR475 (1.8x FY20E BV).
FY18
2Q
16,385
264
16,649
20.5
50
16,699
20.5
4,889
11,810
3,114
8,696
81.4
1,170
7,526
2,985
4,542
53.1
FY17
3Q
15,227
310
15,537
15.9
130
15,667
16.4
4,689
10,978
3,212
7,766
72.8
564
7,202
2,565
4,636
59.3
4Q
15,057
211
15,268
-10.7
107
15,375
-10.3
4,603
10,772
3,261
7,512
-9.8
234
7,278
2,489
4,789
48.8
56,395
891
57,286
17.8
181
57,467
17.9
22,938
34,529
12,503
22,026
48.9
2,816
19,211
7,411
11,799
45.7
(INR m)
FY18E
60,427
950
61,377
7.1
350
61,727
7.4
19,507
42,220
12,662
29,558
34.2
2,034
27,525
10,046
17,479
48.1
Quarterly Performance
Y/E March
Income from operations
Other operating income
Total Operating income
YoY Growth (%)
Other income
Total Income
YoY Growth (%)
Interest Expenses
Net Income
Operating Expenses
Operating Profit
YoY Growth (%)
Provisions
Profit before Tax
Tax Provisions
Net Profit
YoY Growth (%)
E: MOSL Estimates
1Q
12,712
252
12,964
13.7
44
13,008
13.8
5,571
7,437
3,025
4,413
50.1
176
4,237
1,534
2,703
47.6
FY17
2Q
3Q
13,497
13,225
320
184
13,817
13,409
21.6
17.8
45
56
13,862
13,464
21.6
18.0
5,937
5,970
7,925
7,494
3,130
3,000
4,795
4,495
69.5
51.2
171
39
4,624
4,456
1,657
1,545
2,967
2,911
70.0
55.9
4Q
16,962
135
17,096
18.2
36
17,132
18.0
5,460
11,672
3,349
8,323
37.6
2,430
5,893
2,675
3,218
21.3
1Q
13,758
165
13,923
7.4
63
13,986
7.5
5,326
8,660
3,075
5,585
26.6
66
5,518
2,007
3,511
29.9
12 February 2018
22

Glenmark Pharma
BSE SENSEX
34,006
Bloomberg
Equity Shares (m)
M.Cap.(INRb)/(USDb)
52-Week Range (INR)
1, 6, 12 Rel. Per (%)
Avg Val, INRm
Free float (%)
S&P CNX
10,455
GNP IN
282
151.0 / 2.4
968 / 524
-10/-22/-64
765.0
53.5
9 February 2018
Q3FY18 Results Update | Sector: Healthcare
CMP: INR535
TP: INR550(+3%)
Neutral
Weak results; pick-up in US some time away
Net sales fell ~12% YoY (-2% QoQ) to ~INR21.7b (est. of ~INR23.2b). Gross
margin shrunk ~1,170bp YoY (primarily on higher price erosion in the US
business) and ~220bp QoQ (largely on lower contribution of sales from India
business at 27% in 3QFY18 v/s 32% in 2QFY18) to 64%. EBITDA margin shrunk
~360bp QoQ to 13.4%. This, along with a decline in other income to INR90 from
INR866 in 3QFY17, led to a decline in PAT by 78% YoY to INR1b (est. of INR2.6b).
US business to remain under pressure; rest of the market to lead growth:
US
sales declined ~38% YoY to USD114m v/s USD183m in 3QFY17, primarily due to
contribution of gZetia in the previous year. GNP expects the US business to
remain under pressure in the absence of fast product approvals. On licensing
partnership, GNP is looking to out-license certain products, such as GBR830,
GBR1302 and GSP301 (it plans to partner in the next 12-15 months). Xolair
biosimilar is expected to enter phase-III by late-FY19. India business grew ~12%
YoY to INR5.8b; expected to grow 15%+ in FY19. Other geographies also
reported healthy growth (LatAm down 5%); expected to grow >15% in FY19.
Earnings call highlights:
1) Net debt continues to go up; stood at INR36b v/s
INR35b at end-2Q. 2) R&D as % of sales to stay at ~12%, of which ~8% is toward
innovation and specialty products development. 3) Epiduo approval is delayed
due to CRL. 4) GSP 301 filing is expected in next two months; approval expected
by beginning of FY20. 5) Price erosion for GNP in US business was ~13%. 6) GNP
expects strong growth in Russia led by five scheduled launches in FY19. 7) On
Baddi facility 483s, GNP has provided response to US FDA and awaiting a reply.
Maintain Neutral:
Weak cash flow conversion and high net debt remain key
concerns. Maintain
Neutral
with a TP of INR550 @ 15x 1HFY20E EPS (v/s INR650
@ 15x 1HFY20E. We cut FY19/20E EPS by 23/19%, as we build in slower ramp-up
in margins (GNP expects a tough business outlook in US over next two years at
least). Any big in-licensing deal in innovation business could act as a catalyst.
Financials & Valuations (INR b)
2018E 2019E
Y/E Mar
Net Sales
89.5
97.6
EBITDA
15.6
16.2
PAT
8.6
9.3
EPS (INR)
30.6
32.9
Gr. (%)
-22.2
7.7
BV/Sh (INR)
186.1
215.4
RoE (%)
16.4
15.3
RoCE (%)
14.8
16.6
P/E (x)
17.5
16.3
P/BV (x)
2.9
2.5
2020E
109.6
19.2
11.6
41.1
24.7
252.8
16.2
18.1
13.0
2.1
Estimate change
TP change
Rating change
12 February 2018
23

RESULTS
FLASH
11 February 2018
Update
| Sector:
Metals
NALCO
Neutral
BSE SENSEX
34,006
S&P CNX
10,455
CMP: INR 73
Maintain Neutral
TP: INR81 ( +10%)
Inline; Lower cost drives EBITDA growth
Financials & Valuations (INR b)
Y/E March
2018E 2019E
Net Sales
90.9
92.9
EBITDA
14.6
16.6
NP
-0.9
9.9
EPS (INR)
-0.5
5.1
EPS Gr. (%)
-113.0
nm
BV/Sh. (INR)
50.5
53.6
RoE (%)
-0.9
9.8
RoCE (%)
11.6
12.9
Payout (%)
-152.0
14.4
Div. Yield
1.5
1.4
2020E
94.1
17.0
10.2
5.3
2.6
56.8
9.5
12.6
14.0
1.3
NALCO’s 3QFY18 adj. EBITDA increased 39% QoQ (64% YoY) to INR4.7b on lower
cost. The EBITDA is adjusted for (a) provision of INR2.8b for increase in ceiling
limit of gratuity for non-executive employees and (b) reversal of INR1.6b
pertaining to current year charge on settlement of disputed water charges. Adj.
PAT increased 24% QoQ / 62% YoY to INR2.7b. PAT is adjusted for reversal of
INR7.8b on settlement of disputed water charges pertaining to previous years.
Alumina production increased 1% QoQ (down 9% YoY) to 516kt.
Aluminum production increased 5% QoQ / 12% YoY to 111kt.
Depreciation increased 11% QoQ / 6% YoY to INR1.2b.
Other income was down 5% QoQ / +1% YoY to INR766m.
The stock trades at 6.6x FY19E EV/EBITDA. We value the stock at 6.5x FY19E
EV/EBITDA at INR81/sh. Maintain Neutral.
Quarterly Performance (Standalone) – INR m
Y/E March
Alumina Production ('000 tons)
Aluminium Prod. ('000 tons)
Avg LME Aluminium (USD/ton)
Net Sales
Change (YoY %)
Total Expenditure
EBITDA
Change (YoY %)
As % of Net Sales
Interest
Depreciation
Other Income
PBT (before EO Item)
Extra-ordinary Income
PBT (after EO Item)
Total Tax
% Tax
Reported PAT
Adjusted PAT
1Q
524
94
1,570
15,490
3.9
13,544
1,946
-13.0
12.6
5
1,188
1,336
2,089
0
2,089
739
35.4
1,350
1,350
FY17
2Q
3Q
4Q
444
566
573
94
99
101
1,619 1,710 1,851
18,461 19,881 25,497
1.7
21.6
36.0
16,738 17,029 21,222
1,723 2,852 4,275
-49.2 109.2
79.1
9.3
14.3
16.8
6
6
10
1,353 1,177 1,086
1,369
759
620
1,733 2,428 3,798
0
-371
-30
1,733 2,057 3,768
521
618 1,084
30.1
30.0
28.8
1,212 1,439 2,684
1,212 1,699 2,705
1Q
526
101
1,910
18,027
16.4
15,752
2,275
16.9
12.6
4
1,170
859
1,960
0
1,960
670
34.2
1,289
1,289
FY18
2Q
3Q
4QE
509
516
566
105
111
112
2,011 2,097 2,000
24,548 23,888 24,428
33.0
20.2
-4.2
21,193 19,220 20,120
3,355 4,668 4,308
94.7
63.7
0.8
13.7
19.5
17.6
4
5
0
1,123 1,243 1,152
810
766
704
3,037 4,186 3,859
162 6,784
0
3,199 10,969 3,859
853 3,752 1,260
26.7
34.2
32.6
2,346 7,218 2,600
2,227 2,754 2,600
FY17
2,107
388
1,687
79,329
16.4
68,533
10,796
15.1
13.6
17
4,804
4,083
10,058
10,058
2,962
29.4
7,097
7,097
FY18E
2,117
429
2,005
90,891
14.6
76,285
14,606
35.3
16.1
4,689
3,138
13,055
13,055
6,534
50.0
6,521
6,521
FY18 vs Est
3QE
(%)
566
-9
112
-1
2,097
0
26,091
-8
31
21,193
-9
4,898
-5
72
18.8
0
1,157
7
647
18
4,388
-5
0
4,388
150
1,432
162
33
2,955
144
2,955
-7
12 February 2018
24

RESULTS
FLASH
Amara Raja Batteries
BSE SENSEX
34,006
S&P CNX
10,455
10 February 2018
Results Flash | Sector: Automobiles
CMP: INR798
TP: INR984(+23%)
BUY
Financials & Valuations (INR b)
2018E 2019E
Y/E Mar
Net Sales
59.9
70.1
EBITDA
9.2
11.0
NP
4.9
5.8
EPS (INR)
28.7
34.2
EPS Gr. (%)
2.6
18.9
BV/Sh. (INR)
175
203
RoE (%)
17.6
18.1
RoCE (%)
16.7
17.1
P/E (x)
27.8
23.3
P/BV (x)
4.6
3.9
2020E
81.1
12.9
7.0
41.1
20.2
237
18.7
17.7
19.4
3.4
Op. performance in-line; PAT above est. led by higher other income, low
depreciation
Revenues came in-line at INR15.5b (+17.7% YoY, +8.8% QoQ) led by healthy
growth in Automotive business across OE and aftermarket segments. This was
led by continued channel expansion of Amaron and Powerzone brands and
higher exports to South East Asia and Middle East countries.
Industrial battery segment too recorded growth backed by increase in sales in
UPS segment and sequential increase in volumes in Telecom segment.
Gross margins contracted 90bp YoY (-190bp YoY) to 33% (in-line). The
management indicated while lead price inflation continues to persist, AMRJ’s
cost management initiatives and pricing actions has helped company report
healthy operating performance.
Consequently EBITDA grew in-line by 18.4% YoY (+1.5% QoQ) to INR2.4b.
EBITDA margins came in-line at 15.6% (+20bp YoY, -110bp QoQ).
Adjusted PAT was above estimate at INR1.34b (est 1.24b), led by lower than
expected depreciation and higher other income.
AMRJ has appointed Mr. Marc D Andraca as an additional Director and has
been working for Johnson Controls since last 15 years in strategy, program
management and business development role in the buildings and battery
business segments.
We await call details.
Key questions for the management
Demand update from an automotive and industrial segment.
Comments on higher exports and increase in telecom segment volume QoQ.
Impact of increasing lead prices in coming quarters.
Comments on the shift from unorganised to organised segment due to GST.
Valuation and view:
The stock trades at 23.3x/19.4x FY19/20E EPS. We have Buy
rating on the stock with TP of INR INR984.
FY17
2Q
3Q
4Q
13,331 13,269 13,445
15.8
9.5
17.4
63.9
65.0
68.0
5.2
5.5
5.2
13.7
14.1
13.0
2,297 2,040 1,844
17.2
15.4
13.7
457
469
499
15
14
15
120
133
151
1,945 1,689 1,480
29.9
33.5
33.0
1,363 1,123
992
10.4
-17.9
-9.1
FY18
FY17 FY18E
2Q
3Q
4QE
14,275 15,535 15,109 53,172 59,893
7.1
17.1
12.4
15.1
12.6
66.0
66.9
66.7
65.6
67.4
5.2
4.9
5.5
4.7
4.2
12.1
12.0
11.1
13.9
11.6
2,381 2,416 2,525 8,499 9,250
16.7
15.6
16.7
16.0
15.4
584
587
677 1,912 2,392
13
11
14
58
51
122
168
148
492
575
1,907 1,985 1,982 7,022 7,382
33.3
32.3
34.8
31.9
33.5
1,272 1,345 1,293 4,785 4,909
-6.7
19.7
30.4
-2.7
2.6
FY18
3QE VAR (%)
15,073
3.1
13.5
67.0
-10bp
5.3
-40bp
12.0
0bp
2,365
2.1
15.7
-10bp
625
-6.0
12
-5.8
150
11.7
1,878
5.7
33.5
1,249
7.6
11.2
Quarterly Performance
Y/E March (INR m)
Net Sales
YoY Change (%)
RM Cost (% of sales)
Staff Cost (% of sales)
Other Exp (% of sales)
EBITDA
Margins (%)
Depreciation
Interest
Other Income
PBT
Rate (%)
Adj PAT
YoY Change (%)
E: MOSL Estimates
1Q
13,081
15.0
65.7
5.0
11.9
2,273
17.4
441
14
90
1,908
31.5
1,307
8.0
1Q
14,975
14.5
70.0
5.4
11.7
1,929
12.9
544
14
137
1,508
33.7
999
-23.6
12 February 2018
25

9 February 2018
3QFY18 Results Update | Sector: Capital Goods
GE T&D India
Neutral
BSE SENSEX
34,006
Bloomberg
Equity Shares (m)
M.Cap.(INRb)/(USDb)
52-Week Range (INR)
1, 6, 12 Rel. Per (%)
Avg. Val, INRm
Free float (%)
Financials & Valuations (INR b)
2018 2019E
Y/E Mar
Net Sales
48.5
49.5
EBITDA
4.2
4.8
PAT
2.7
3.0
EPS (INR)
10.6
11.6
Gr. (%)
84.1
9.6
BV/Sh (INR)
47.4
54.6
RoE (%)
24.1
22.7
RoCE (%)
28.5
29.1
P/E (x)
40.4
36.8
P/BV (x)
9.0
7.8
Estimate change
TP change
Rating change
S&P CNX
10,455
GETD IN
Operating performance miss led by below-expected margins
256
Performance impacted by margin contraction:
Sales grew strongly by 24%
109.7/1.6
YoY to INR14.4b in 3QFY18, ahead of our estimate of INR9.3b, led by smooth
473 / 277
execution of orders in hand. Adj. EBITDA (ECL provisioning of INR224m) of
-8/-4/13
INR728m was 3% lower than INR751m in 3QFY17 and meaningfully below
66.0
25.0
our estimate of INR1.0b due to execution of lower-margin orders. Adj.
CMP: INR407
TP: INR435 (+7%)
2020E
52.5
5.2
3.4
13.2
13.9
62.8
22.5
29.9
32.3
6.8
EBIDTA margin shrunk 130bp YoY to 5.1%, below our estimate of 8%. Adj.
PAT of INR521m was in line with our estimate of INR534m (3QFY17:
INR443m), led by higher other income (INR630m v/s INR493m in 3QFY17).
Adj. EBIDTA margin contracts on execution of lower-margin orders,
intensifying competition:
Adj. EBIDTA stood at INR728m v/s INR751m in
3QFY17, with the margin contracting 130bp YoY to 5.1% on intensifying
competition in the sector and execution of lower-margin orders. GETD
guided for sustainable gross margins of 30-31% v/s 26% in 3QFY18.
Order inflow declines sharply:
Order intake declined 30% YoY to INR7.8b in
3QFY18 due to a delay in finalization of orders. Order backlog stands at
INR72b, providing revenue visibility for the next 18 months. Key orders won
in 3Q were (1) order from Sterlite Power Grid Ventures for installation of a
substation in Tripura, (2) order from Gujarat Energy Transmission for 400Kv
GIS at Bhachinda, (3) order from Bhutan Power for 66Kv GIS substation at
Thimpu and 4) order from Delhi Transco for a busbar protection scheme.
Maintaining Neutral:
We marginally tweak our estimates for FY18/19 by
13%/2%, and maintain our
Neutral
rating with a TP of INR435, valuing the
stock at 33x FY20E EPS of INR13.2.
FY18
2Q
3Q
4Q
8,700 14,386 13,275
4.2
23.5
11.0
805
728 1,599
130.6
-3.0
45.7
9.3
5.1
12.0
228
218
172
225
238
140
344
630
362
695 1,099 1,650
220
381
561
31.6
34.7
34.0
475
718 1,090
131.6
62.0 136.2
475
521 1,090
131.6
17.6 136.2
FY17
FY18
(INR Million)
MOSL Var.
3Q Vs Est
12,700
13
9.3
1,012
-28
40
8.0
228
220
250
814
35
280
34.4
534
34
20.5
534
-2
20.5
Quarterly Performance
Y/E March
Sales
Change (%)
EBITDA
Change (%)
As of % Sales
Depreciation
Interest
Other Income
PBT
Tax
Effective Tax Rate (%)
Reported PAT
Change (%)
Adj PAT
Change (%)
E: MOSL Estimates
1Q
8,546
11.6
21
-70.3
0.2
217
226
326
-2,425
-455
18.8
-1,970
-2,041.0
360
254.6
FY17
2Q
3Q
4Q
8,350 11,652 11,963
-4.3
63.2
26.9
349
751 1,097
-48.7 -241.2
81.7
4.2
6.4
9.2
220
221
224
240
343
344
425
493
177
314
679
705
109
236
244
34.7
34.7
34.6
205
443
461
-43.2 -215.4
70.9
205
443
461
-43.2 -215.4
70.9
1Q
12,093
41.5
1,055
4,875.9
8.7
224
278
421
974
358
36.8
616
-131.3
616
71.1
40,521 48,453
22.7
19.6
2,230 4,187
-9.0
-9.0
5.5
8.6
873
873
589
589
427
427
1,195 3,152
508
508
42.5
16.1
687 2,644
0.0
0.0
687 2,644
2.0
2.0
12 February 2018
26

9 February 2018
3QFY18 Results Update | Sector: Oil & Gas
Mahanagar Gas
Upgrade to Buy
BSE SENSEX
34,006
Bloomberg
Equity Shares (m)
M.Cap.(INRb)/(USDb)
52-Week Range (INR)
1, 6, 12 Rel. Per (%)
Avg. Val, INRm
Free float (%)
S&P CNX
10,455
MAHGL IN
EBITDA above estimate; CNG/PNG volumes up 7%/8% YoY
89.3
MGL’s reported EBITDA of INR2b (+20% YoY, flat QoQ) was above our
87.0/1.4
estimate of INR1.9b, led by higher volumes and lower opex. EBITDA/scm
1345 / 845
stood at INR8.0 (our estimate: INR7.7; INR7.10 in 3QFY17, INR8.1 in
-10/-10/-15
230.0
2QFY18). PBT rose 22% YoY (flat QoQ) to INR1.9b (our estimate: INR1.8b).
35.0
PAT stood at INR1.24b (our estimate: INR1.2b; +25% YoY, -1% QoQ).
CMP: INR974
TP: INR1,228 (+26%)
Financials & Valuations (INR b)
2018E 2019E
Y/E March
23.0
24.5
Net Sales
8.1
7.8
EBITDA
5.0
4.8
PAT
55.9
53.9
EPS (INR)
27.0
-3.6
Gr. (%)
210.5
231.7
BV/Sh (INR)
28.0
24.4
RoE (%)
27.8
24.2
RoCE (%)
17.4
18.1
P/E (x)
4.6
4.2
P/BV (x)
2020E
27.1
7.9
4.9
54.6
1.2
Valuation and view
253.3
We expect 6%/8% volume growth for MAHGL in FY19/20. MHAGL has been
22.5
clocking EBITDA/scm of INR8 in recent quarters. We believe this is not
22.4
sustainable and expect EBITDA/scm of INR7.5/7 in FY19/20. Over FY17-20,
17.9
we expect EBITDA CAGR of 7% and EPS CAGR of 7%.
3.8
CNG/PNG volume grew 7%/8% YoY:
CNG volumes grew 7% YoY (+1% QoQ)
to 2.01mmscmd, while PNG volumes rose 8% YoY (+4% QoQ) to
0.73mmscmd. While PNG – domestic volumes grew 10% YoY (+5% QoQ) to
0.34mmscmd, PNG – industrial/commercial volumes rose 7% YoY (+3% QoQ)
to 0.39mmscmd. Total volumes grew 7% YoY (+1% QoQ) to 2.74mmscmd.
Estimate change
TP change
Rating change
Standalone - Quarterly Earning Model
Y/E March
1Q
Net Sales
4,834
YoY Change (%)
-5.9
Total Expenditure
3,311
EBITDA
1,524
EBITDA/SCM
6.7
Margins (%)
31.5
Depreciation
216
Interest
5
Other Income
123
PBT
1,425
Tax
498
Rate (%)
34.9
Reported PAT
927
Adj PAT
927
YoY Change (%)
19.1
Margins (%)
19.2
Sales Volumes (mmscmd)
CNG
1.86
PNG - Domestic
0.29
PNG - Industry/ Commercial
0.35
PNG - Total
0.64
Total Volumes
2.50
E: MOSL Estimates
The stock trades at 17.9x FY20E EPS of INR54.6. We value MGL at 22.5x (25%
discount to IGL) FY20E EPS to arrive at a fair value of INR1,228/share,
implying an upside 26%. Thus, we upgrade the stock to
Buy
from Neutral.
FY17
2Q
3Q
5,209 5,043
-3.4
-2.1
3,594 3,372
1,615 1,672
6.8
7.1
31.0
33.1
231
247
1
5
150
124
1,533 1,544
511
554
33.3
35.9
1,022
990
1,022
990
40.9
30.2
19.6
19.6
1.93
0.29
0.37
0.67
2.60
1.88
0.31
0.37
0.68
2.56
4Q
5,253
3.0
3,622
1,631
6.9
31.1
257
-1
130
1,505
510
33.9
995
995
17.9
18.9
1.92
0.32
0.37
0.70
2.62
1Q
5,309
9.8
3,276
2,033
8.7
38.3
246
2
120
1,904
661
34.7
1,243
1,243
34.1
23.4
1.89
0.32
0.36
0.68
2.57
FY18
2Q
3Q
5,338 5,814
2.5
15.3
3,335 3,805
2,003 2,009
8.1
8.0
37.5
34.6
259
268
0
0
139
141
1,883 1,883
635
643
33.7
34.1
1,248 1,240
1,248 1,240
22.1
25.2
23.4
21.3
1.99
0.33
0.38
0.71
2.70
2.01
0.34
0.39
0.73
2.74
FY17
4QE
6,601
25.7
4,603
1,998
8.0
30.3
292
5
197
1,898
643
33.9
1,255
1,255
26.1
19.0
2.01
0.38
0.39
0.77
2.79
20,340
-2.1
13,898
6,442
6.9
31.7
951
10
527
6,007
2,072
34.5
3,934
3,934
26.5
19.3
1.90
0.30
0.37
0.67
2.57
FY18E
23,046
13.3
14,995
8,052
8.2
34.9
1,064
7
597
7,577
2,582
34.1
4,995
4,995
27.0
21.7
1.98
0.34
0.38
0.72
2.70
(INR Million)
FY18
Var.
3QE vs Est.
5,952
-2%
18.0
4,055
-6%
1,897
6%
7.7
4%
31.9
285
-6%
3 -100%
165
-14%
1,775
6%
602
7%
33.9
1,173
6%
1,173
6%
18.5
19.7
1.98
0.34
0.37
0.72
2.70
1%
-1%
5%
2%
2%
12 February 2018
27

Birla Corporation
BSE SENSEX
34,006
Bloomberg
Equity Shares (m)
M.Cap.(INRb)/(USDb)
52-Week Range (INR)
1, 6, 12 Rel. Per (%)
Avg Val, INRm
Free float (%)
S&P CNX
10,455
BCORP IN
Higher costs impact margins
77
Ramp up of acquired assets resulted in strong volume growth:
Consolidated
77.2 / 1.1
volumes rose 22% YoY to 3.03mt (our estimate: 3.0mt) due to ramp up of Reliance
1290 / 668
operations from 55% to 81% utilization. Consolidated realizations declined 2% QoQ
-17/-1/18
to INR4,585/t (our estimate: INR,4642/t) due to weaker pricing in the North. Net
81.0
sales were INR13.89b (+29% YoY, +12% QoQ; our estimate: INR14.28b).
37.1
Margins impacted by cost push:
Total cost/t for consolidated operations increased
11 February 2018
3QFY18 Results Update | Sector: Cement
CMP: INR1,002
TP: INR1,234(+23%)
Buy
Financials & Valuations (INR b)
Y/E Mar
2018E 2019E
Net Sales
56.6
64.0
EBITDA
7.4
10.4
PAT
0.7
3.3
EPS (INR)
8.9
42.4
Gr. (%)
-69.0 378.7
BV/Sh (INR)
426
457
RoE (%)
2.1
9.6
RoCE (%)
5.0
7.6
P/E (x)
113.2
23.6
P/BV (x)
2.3
2.2
Estimate change
TP change
Rating change
5% YoY (3% QoQ) to INR4,127 due to higher shutdown and maintenance expenses.
Power and fuel cost/t increased 21% YoY due to increase in petcoke prices. Raw
2020E
material cost increased 19% QoQ due to increase in slag prices for eastern
69.0
operations. Consolidated EBITDA/t was INR458 (-6% YoY, -31% QoQ), and EBITDA
11.7
was INR1.38b (+15% YoY, -22% QoQ; our estimate: INR1.8b). Acquired assets
3.9
reported EBITDA/t of INR913 (-15% QoQ) due to lower realizations while standalone
50.6
operations reported EBITDA/t of INR199 (-40%YoY, -55%QoQ). Margins were at 10%
19.5
(-1.23pp YoY, -4.33pp QoQ). Interest expense fell 17% YoY (and 9% QoQ) to
496
INR958m due to refinancing of debt. Reported loss was INR218m (our estimate:
10.6
profit INR44m).
7.8
Key points from management press release:
(1) Premium brand contributes 25% of
19.8
company’s sales (both in terms of volumes and value); (2) Realizations impacted due
2.0
to lower demand in Rajasthan, Haryana and Delhi; (3) Freight cost increased due to
non-availability of railway rakes.
Valuation and view:
BCORP’s consolidated operations, with a capacity of 15.5mt,
are among the largest in the Satna cluster, with ~22% market share. Blended
EBITDA/t profile for consolidated operations improved substantially due to higher
profitability of Reliance Cement. Given its size and profitability, BCORP is trading at
a significant discount to peers (both on EV/t and EV/EBITDA) and has strong
potential for multiple re-rating. However, the key risk would be lower profitability
from its Chanderia operations. The stock trades at 10.2x/8.5x FY19/20E EV/EBITDA
and EV/t of USD94 on FY20E capacity. We value BCORP at INR1,234 (10.5x FY20E
EV/EBITDA; implied FY19E EV/t of USD111).
Buy.
(INR Million)
FY17
2Q
3Q
2.08
2.49
6.1
26.5
4,543
4,330
7.8
1.3
1.3
-4.7
9,445 10,765
18.8
36.8
8,151
9,558
1,294
1,208
13.7
11.2
569
809
527
1,149
450
209
648
-541
-6
-128
-0.9
23.6
654
-413
0
0
654
-413
181.9 -343.6
4Q
3.31
50.1
4,341
6.5
0.3
14,374
63.1
12,026
2,349
16.3
797
902
416
1,065
-15
-1.4
1,080
68
1,011
-2.1
1Q
3.28
51.3
4,449
-0.8
2.5
14,588
63.3
12,184
2,404
16.5
832
937
161
796
239
30.0
557
125
470
-50.2
FY18
2Q
3Q
2.65
3.03
27.5
21.9
4,662
4,585
2.6
5.9
4.8
-1.7
12,355 13,893
30.8
29.1
10,587 12,506
1,768
1,387
14.3
10.0
831
823
1,053
958
119
141
3
-252
-12
-34
-421.4
13.4
15
-218
0
0
15
-218
-97.8
-47.1
FY17
4QE
3.66
5,670
30.6
23.7
15,778
9.8
13,937
1,841
11.7
773
969
144
242
28
11.6
214
0
214
-78.8
10.04
24.2
4,623
8.8
43,477
33.0
37,248
6,229
14.3
2,555
2,768
1,465
2,371
108
4.6
2,263
0
2,263
13.8
FY18E
12.62
25.6
4,873
5.4
56,614
30.2
49,213
7,401
13.1
3,259
3,917
564
789
107
13.6
682
0
682
-69.9
FY18
3QE
3.00
71.5
4,642
7.2
-0.4
14,285
93.3
12,481
1,804
12.6
831
1,050
120
43
-2
-4.0
44
0
44
111.6
Var.
(%)
1
-1
Birla Corporation (Consolidated)
Y/E March
Cement Sales (m ton)
YoY Change (%)
Cement Realization
YoY Change (%)
QoQ Change (%)
Net Sales
YoY Change (%)
Total Expenditure
EBITDA
Margins (%)
Depreciation
Interest
Other Income
Profit before Tax
Tax
Rate (%)
Adj. PAT
EO Income/(Expense)
Reported PAT
YoY Change (%)
E: MOSL Estimates
1Q
2.17
10.8
4,484
21.9
10.0
8,936
16.6
7,632
1,303
14.6
379
225
501
1,200
257
21.4
943
0
943
278.1
-3
0
-23
-693
-594
-594
12 February 2018
28

11 February 2018
Q3FY18 Results Update | Sector: Healthcare
Strides Shasun
Buy
BSE SENSEX
34,006
Bloomberg
Equity Shares (m)
M.Cap.(INRb)/(USDb)
52-Week Range (INR)
1, 6, 12 Rel. Per (%)
Avg Val, INRm
Free float (%)
S&P CNX
10,455
STR IN
89
66.1 / 1.0
1,220 / 641
-9/-25/-59
392.0
68.9
CMP: INR739
TP: INR989(+34%)
Weak results; new launches to drive operating performance
Strides Shasun’s (STR) 3QFY18 sales (including commodity API business) grew 8% YoY
to INR9.5b, lower than our estimate of INR10.8b. EBITDA (including commodity API
business) declined 30% YoY and margin was 15%, lower than our estimate of 18%.
Adjusted PAT of INR466m too was much lower than our estimate of INR979m.
Financials & Valuations (INR b)
FY18E FY19E
Y/E Mar
Net Sales
29.5
34.4
EBITDA
4.1
6.8
PAT
1.3
3.6
EPS (INR)
14.1
40.8
Gr. (%)
-56.2
188.8
BV/Sh (INR)
315.4
356.2
RoE (%)
4.6
12.1
RoCE (%)
5.1
8.8
P/E (x)
52.3
18.1
P/BV (x)
2.3
2.1
FY20E
39.9
8.1
5.0
55.7
36.7
411.9
14.5
10.2
13.3
1.8
Estimate change
TP change
Rating change
Strong growth in regulated market sales offset by weakness in emerging
market business:
Regulated market sales at INR5.8b were up 30% YoY on
the back of new launches in US and Australia. The addition of portfolio
acquired from Amneal, which was absent in 3QFY17, also aided growth.
However, strong growth in regulated market was offset by sharp 38% YoY
decline in emerging market business to INR1.7b. Commodity API business
was INR2b. Including commodity APIs, which would be demerged soon,
overall sales were up 8% YoY.
Higher other expenses drag EBITDA margin:
For like-to-like comparison
(excluding commodity API business and domestic branded formulations)
gross margin was stable at 53%. However, EBITDA margin was down 300bp
YoY to 16.4%. This is on account of higher other expenses. This coupled with
higher interest and depreciation led PAT to fall by 24% YoY to INR466m. Very
low tax outgo led to lower YoY fall in adjusted PAT for the quarter.
Valuation and view:
We reduce our sales estimates by 25%/29%/28% and
PAT estimates by 61%/35%/28% for FY18/19/20 to factor (1) demerger of
commodity API business, (2) lower than expected operating margin in
3QFY18, and (3) delay in procurement with respect to institutional business.
There is a risk of increased price erosion in recently-launched molecules,
whoever pipeline remains robust for better growth, subject to approval. We
value STR on sum-of-the-parts (SOTP), valuing the pharma business at 18x
12M forward earnings (industry average P/E multiple for midcap pharma)
and Solara at an EV of 8x (from 12x earlier to factor commodity nature of API
business) FY19E EBITDA to arrive at a price target of INR989. Reiterate
Buy.
FY17
2Q
3Q
9,535 7,298
33.3 -15.9
8,101 5,882
1,434 1,416
15.0 19.4
468 309
617 441
658 222
1,008 888
0 115
1,008 773
152 235
15.1 30.4
114
1
741 537
741 617
106.9
4.7
7.8
8.4
4Q
8,884
-3.9
7,315
1,569
17.7
529
592
731
1,179
17
1,162
175
15.0
-7
994
1,009
471.5
11.4
1Q
6,579
-16.7
5,950
629
9.6
356
524
345
93
34
60
10
15.9
31
20
48
-81.6
0.7
FY18
2Q
3Q
7,695
7,490
-19.3
-19.8
6,698
6,262
997
1,228
13.0
16.4
384
391
486
498
222
157
350
497
123
63
227
433
33
-2
14.4
-0.4
53
32
142
403
246
466
130.5 9,845.6
3.2
6.2
FY17
4QE
7,700 34,834
-13.3
11.6
6,430 28,406
1,271 6,428
16.5
18.5
400 1,872
450 2,269
160 1,686
581 3,973
0 1,006
581 2,967
88
470
15.1
15.8
0
458
493 2,039
493 2,886
4.5 136.9
6.4
8.3
FY18 vs Est
3QE %
29,470 10,817 -30.8
-15.4
25,342 8,870 -29.4
4,127 1,947 -36.9
14.0
18.0
-8.9
1,536
528 -26.0
1,952
590 -15.6
884
350 -55.2
1,524 1,179 -57.9
219
1,305 1,179 -63.3
123
200 -100.8
9.4
17.0 -102.2
117
1,099
979 -58.9
1,263
979 -52.4
-56.2
4.3
FY18E
Quarterly performanceINR million
Y/E March
Net Sales
YoY Change (%)
Total Expenditure
EBITDA
Margins (%)
Depreciation
Interest
Other Income
PBT before EO expense
Extra-Ord expense
PBT
Tax
Rate (%)
1Q
7,895
28.8
6,573
1,323
16.8
424
559
208
547
60
487
88
18.1
65
334
383
260.9
4.9
Minority Interest & Profit/Loss of Asso. Cos
.
Reported PAT from Continuing Ops.
Adj. PAT from Continuing Ops.
YoY Change (%)
Margins (%)
12 February 2018
29

9 February 2018
Q3FY18 Results Update | Sector: Cement
India Cements
Neutral
BSE SENSEX
34,006
Bloomberg
Equity Shares (m)
M.Cap.(INRb)/(USDb)
52-Week Range (INR)
1, 6, 12 Rel. Per (%)
Avg Val, INRm
Free float (%)
S&P CNX
10,455
ICEM IN
Cost-efficiency initiatives partially offset realization impact
308
Realizations decline QoQ due to weak pricing:
Volumes were muted at
49.7 / 0.7
2.73mt (+3% YoY) v/s est. of 2.76mt, as demand was impacted in core
226 / 142
markets of TN and Kerala. Blended realizations declined 5% QoQ/7% YoY to
-15/-18/-21
INR4,450/t (est. of INR4,845) due to weak prices in south market. Revenue
956.0
declined 4% YoY to INR12.1b (est. of INR 13.4b) due to lower realizations.
71.8
Cost-efficiency measures arrest margin contraction:
Cost/t fell 6% YoY/5%
CMP: INR161
TP: INR148 (-9%)
Financials & Valuations (INR b)
2018E 2019E
Y/E Mar
Net Sales
52.5
58.5
EBITDA
7.6
9.3
PAT
1.2
2.3
EPS (INR)
3.7
7.6
Gr. (%)
-33.4 101.9
BV/Sh (INR)
168.4 174.8
RoE (%)
2.2
4.4
RoCE (%)
4.5
5.8
P/E (x)
43.1
21.4
P/BV (x)
1.0
0.9
2020E
66.2
10.7
3.2
10.4
37.7
184.1
5.8
6.9
15.5
0.9
Estimate change
TP change
Rating change
QoQ due to lower employee cost, led by rationalization of manpower cost.
The sequential decline in cost/t was further driven by lower freight cost/t.
EBITDA/t fell 14% YoY/9% QoQ to INR614 (est. of INR674). Margin stood at
13.8% (-1.08pp YoY, -0.52pp QoQ). Hence, EBITDA fell 11% YoY to INR1.67b
(est. of INR1.86b). Interest cost was higher by 8% YoY (+4% QoQ) at
INR924m due to inclusion of one-time cost toward foreclosure of foreign
currency borrowings. PAT stood at INR152m (-57% YoY) v/s est. of INR294m.
Key takeaways from conference call:
1) Supreme Court’s stay order on sand
mining ban in Tamil Nadu should revive demand. 2) Power cost declined due
to usage of low-cost Indonesia coal. 3) Trade to non-trade mix was 65:35. 4)
Overall capacity utilization for the company is at 70-75%.
Maintain Neutral:
ICEM, which enjoys good brand recall/market share, is a
healthy play on a southern recovery. However, despite its strategically located
plants, the cost structure is relatively high due to vintage constraints. High
investments in non-cement businesses, elevated debt levels, and subdued
return ratios keep valuation at discount. We maintain
Neutral
with a TP of
INR148 (EV of 6.5x FY20E EBITDA). A sustained recovery in southern demand and
an improvement in capital allocation would be the key re-rating triggers.
FY17
FY18
2Q
3Q
4Q
1Q
2Q
3Q
4QE
2.46
2.65
2.90
2.66
2.70
2.73
3.24
14
37
19
15
10
3
12
5,259 4,784 4,633 4,857 4,696 4,450 4,555
-5.6
-11.6
-0.9
-6.1
-10.7
-7.0
-1.7
1.7
-9.0
-3.2
4.8
-3.3
-5.2
2.4
13,075 12,679 13,436 12,901 12,683 12,131 14,746
6.7
19.8
17.1
7.3
-3.0
-4.3
9.8
2,244 1,886 1,900 1,856 1,814 1,673 2,229
17.2
14.9
14.1
14.4
14.3
13.8
15.1
521
516
639
630
632
633
622
876
858
820
874
886
924
919
69
31
17
52
66
37
41
917
542
458
404
362
152
730
293
189
115
140
125
0
229
31.9
34.8
25.1
34.6
34.6
0.0
31.4
624
353
343
264
237
152
500
624
353
343
264
237
152
500
53.9 1,018.4
-19.6
-39.9
-62.1
-56.9
46.0
4.8
2.8
2.6
2.0
1.9
1.3
3.4
FY17
11.00
27.3
4,589
-16.7
50,795
5.6
8,610
17.0
2,571
3,605
165
2,600
867
33.3
1,734
1,734
31.3
3.4
(INR Million)
FY18E
FY18
3QE
11.32
2.76
2.9
2.0
4,606
4,845
0.4
4.6
3.2
52,460
13,393
3.3
6.7
7,572
1,864
14.4
13.9
2,517
630
3,602
890
196
49
1,648
393
495
98
30.0
25.0
1,154
294
1,154
294
-33.4
2.2
Var.
(%)
-1
-8
-9
-10
Quarterly Performance (Standalone)
Y/E March
Sales Dispatches (m ton)
YoY Change (%)
Realization (INR/ton)
YoY Change (%)
QoQ Change (%)
Net Sales
YoY Change (%)
EBITDA
Margins (%)
Depreciation
Interest
Other Income
PBT
Tax
Rate (%)
Reported PAT
Adj PAT
YoY Change (%)
Margins (%)
E: MOSL Estimates
1Q
2.31
10
5,173
2.5
10.7
12,025
11.9
2,014
16.7
511
825
32
710
271
38.1
440
440
-9.4
3.7
-48
12 February 2018
30

9 February 2018
3QFY18 Results Update | Sector: Others
Kaveri Seed Co.
Buy
BSE SENSEX
34,006
Bloomberg
Equity Shares (m)
M.Cap.(INRb)/(USDb)
52-Week Range (INR)
1, 6, 12 Rel. Per (%)
Avg Val, INRm
Free float (%)
S&P CNX
10,455
KSCL IN
Results below expectations; Market share gain to continue in FY19
69.1
Revenue below estimates; a significant miss on EBITDA and PAT:
Revenue
33.1 / 0.5
increased 4.1% YoY to INR7,066m (est. of INR814m) in 3QFY18. Maize
708 / 433
volumes have been impacted by reduced exports, lower acreages in
-9/-18/-20
437.0
Karnataka and Telangana, and a drop in government business from
45.2
10,400mt last year to 9,200mt this year. Notably, maze volumes fell 12% YoY
CMP: INR479
TP: INR664(+39%)
Financials & Valuations (INR b)
Y/E Mar
2018E 2019E
Net Sales
7.8
8.9
EBITDA
2.3
2.7
PAT
2.3
2.7
EPS (INR)
34.2
40.6
Gr. (%)
79.5
18.5
BV/Sh (INR)
139.4
159.5
RoE (%)
23.4
27.1
RoCE (%)
24.7
28.7
P/E (x)
14.0
11.8
P/BV (x)
3.4
3.0
2020E
10.2
3.2
3.1
47.4
17.0
186.6
27.4
29.0
10.1
2.6
Estimate change
TP change
Rating change
in Karnataka. EBITDA grew 186% YoY to INR97m (est. of INR43m), with the
margin expanding 876bp YoY to 13.8% (est. of 21.9%) on account of a steep
decline of 1,250bp in other expenses (16.2% of net sales). Margins have
expanded primarily due to lower write-offs (INR36m v/s INR70m in 3QFY17).
Consequently adj. PAT expanded 52.5% YoY to INR54m (est. of INR174m).
Focus on expanding geographical presence bears fruit:
KSCL’s focus on
strengthening its distribution network in the north, east and west markets
has started to show results, with growth of >50% in Bihar and Orissa, >100%
in Jharkhand, >200% in West Bengal, and >50% in Maharashtra and Gujarat.
Market share expansion to continue:
Cotton has seen strong growth in
FY18; however, due to better prices for other crops, management has
guided for flat industry growth in cotton for FY19. Management expects
KSCL’s cotton business to grow at 15% in FY19, primarily due to higher
growth in Maharashtra/ Gujarat, which should help it gain market share. It
also guided for 15% growth in maize, 20% in rice, and 30-40% in vegetables
(driven by new hybrids across hot pepper, okra, tomato and gourd).
Valuation view:
While FY19 should see flat growth for cotton acreages, we
believe KSCL is on track to grow by 15%, driven by market share gains across
crops due to new product launches and distribution network expansion. We
largely maintain our estimates and value the stock at 14x FY20E EPS.
Maintain
Buy
with a target price of INR664 (39% upside).
12 February 2018
31

RESULTS
FLASH
BSE SENSEX
34,006
S&P CNX
10,455
VA-Tech Wabag
TP: INR745(+14%)
Neutral
11 February 2018
Results Flash | Sector: Engineering
CMP: INR571
Conference Call Details
Date:
12 Feb 2018
Time:
16:00 hrs
Dial-in details: 022
39600659
th
Financials & Valuations (INR b)
2018E 2019E 2020E
Y/E Mar
Sales
38.9
40.5 43.4
EBITDA
3.7
4.0
4.4
NP
1.3
1.4
1.7
Adj EPS (INR)
23.4
26.0 30.5
EPS Gr. (%)
24.1
10.9 17.4
BV/Sh (INR)
199.7 219.2 242.1
RoE (%)
12.3
12.4 13.2
RoCE (%)
16.7
16.3 16.5
Payout (%)
21.2
21.2 21.2
Valuations
P/E (x)
26.3
23.7 20.2
P/BV (x)
3.1
2.8
2.5
EV/EBITDA (x)
9.5
8.7
7.7
Div. Yield (%)
0.8
0.9
1.0
Results miss expectations due to weak sales and below-estimated margins
Sales stood at INR8.6b (+20% YoY) v/s our estimate of INR9.3b.
Gross margin shrunk 400bp YoY to 21%.
EBITDA stood at INR777m (-2% YoY), with the margin at 9.0% (-210bp YoY) v/s
our estimate of 10.1%.
Other income stood at INR8m v/s our estimate of INR28m and INR35m in
3QFY17.
Company reported PAT of INR301m (our estimate: INR476m) v/s a loss of
INR26m in the year-ago period.
Valuation view:
The stock trades at 22x FY19E EPS and 19x FY20E EPS. We have
a Buy rating with a target price of INR745.
Quarterly Performance (Consolidated)
Y/E March
Sales
Change (%)
EBITDA
Change (%)
As of % Sales
Depreciation
Interest
Other Income
PBT
Tax
Effective Tax Rate (%)
Minority Int
Adj PAT
Change (%)
Extra-ordinary Items
Reported PAT
Change (%)
1Q
5,803
27.6
275
-0.8
4.7
46
119
55
165
109
66.3
3.7
52
(155.7)
0.0
52
-155.5
FY17
2Q
3Q
4Q
7,776 7,183 11,317
31.3
17.7
33.3
585
794 1,317
25.7
80.6
16.9
7.5
11.1
11.6
47
46
52
109
137
161
19
35
3
448
646 1,108
186
45
326
41.6
6.9
29.5
16.7 626.5
24.1
245
-26
757
110.6 (112.3)
16.2
4.5
0.0
0.0
240
-26
757
109.8
-112.3
15.8
1QE
6,686
15.2
418
52.2
6.3
45
133
20
259
160
61.7
15.6
84
61.5
0.0
84
61.5
FY18
FY17 FY18E
2QE
3QE
4QE
8,865
8,647 14,742 32,079 38,940
14.0
20.4
30.3
27.9
21.4
827
777 1,672 2,966 3,694
41.4
-2.2
27.0
27.3
24.5
9.3
9.0
11.3
9.2
9.5
45
43
75
191
208
143
142
157
526
575
2
8
81
112
111
642
599 1,521 2,362 3,021
220
248
509
667 1,138
34.3
41.4
33.5
28.2
37.7
184.1
50.5 356.2 666.1 606.5
237
301
655 1,029 1,277
(3.2)
NM (13.5)
15.9
24.1
52.0
0.0
0.0
4.5
52.0
185
301
655 1,024 1,225
-3.2 -1,274.2
-13.5
11.3
19.6
(INR Million)
FY18
2Q
9,282
30.2
938
26.5
10.1
52
145
28
769
292
38.0
0.5
476
(14.5)
0.0
476
-14.5
Var.
Vs Est
-6.8%
-17.2%
-22.0%
-36.9%
-36.9%
12 February 2018
32

10 February 2018
Q3FY18 Results Update | Sector: Healthcare
Granules India
Buy
BSE SENSEX
34,006
Bloomberg
Equity Shares (m)
M.Cap.(INRb)/(USDb)
52-Week Range (INR)
1, 6, 12 Rel. Per (%)
Avg Val, INRm
Free float (%)
S&P CNX
10,455
GRAN IN
Revenue in-line; margins below expectation
229
Sales rose 14% YoY to INR4.1b (est. of INR4.06b). EBITDA margin came in at
30.9 / 0.5
18% (-320bp YoY, -160 bp QoQ) v/s our expectation of 20.6%, because of: 1)
157 / 102
high input cost, 2) forex fluctuations and 3) new capacity ramp-up. EBITDA
-13/0/-29
295.0
stood at INR740m v/s our estimate of INR837m. PAT declined 10% YoY to
55.1
CMP: INR119
TP: INR175(+47%)
Financials & Valuations (INR b)
2018E 2019E
Y/E Mar
Net Sales
16.4
21.6
EBITDA
3.0
4.2
PAT
1.5
2.0
EPS (INR)
6.3
7.9
Gr. (%)
-12.4
25.2
BV/Sh (INR)
54.6
59.9
RoE (%)
13.2
13.9
RoCE (%)
13.9
14.7
P/E (x)
18.8
15.0
P/BV (x)
2.2
2.0
2020E
27.1
5.5
2.8
11.0
38.7
67.0
17.4
18.1
10.8
1.8
Estimate change
TP change
Rating change
INR350m due to lower margins and associate income (est. of INR433m).
US business – Methergene approval will be key:
GRAN plans to file ~20
ANDAs in the US until FY19. Of these, ~50% complex ANDAs will be filed
from its US-based Virginia facility and the rest from its India facility in
Gagilapur. It has already filed two complex generic ANDAs, including
Methergene (LPC is the innovator; market size: ~USD50-60m). GRAN is the
only generic filer, and an approval is expected over the next few months.
Concall takeaways:
1) In 3QFY18, Virginia facility was inspected for the
first time by the USFDA with one 483, to which GRAN responded and also
later received EIR. 2) On target to file 10 ANDAs in FY18; 5 ANDAs in 4Q (all
complex ANDAs). 3) Maintained revenue guidance, although PAT may be
impacted by lower margin; 4) First product from Virginia facility will be
launched in 1QFY19. 5) Depreciation will increase from FY19, led by new
facility becoming operational.
Stock trading at 15x FY19E EPS; US biz ramp-up key growth driver:
GRAN trades at 15x FY19E EPS (despite assuming >10% equity dilution). We
believe the stock is poised for multiple re-rating on the back of asset
sweating in traditional business, entry in high-value US business and
commencement of API sales from Omnichem JV. We maintain our
Buy
rating
with a TP of INR175 @18x 1HFY20E (v/s INR200 @ 18x 1HFY20E). We have
cut our FY18E/19E/20E EPS by 8%/13%/17%, as we factor in the impact of
loss of sales in JV business and lower margins.
12 February 2018
33

Tata Motors
BSE SENSEX
34,006
S&P CNX
10,455
10 February 2018
Update
| Sector:
Automobiles
CMP: INR369
TP: INR515(+39%)
Buy
JLR’s Jan-2018 wholesales below estimate at 49.6k units
Stock Info
Bloomberg
Equity Shares (m)
52-Week Range (INR)
1, 6, 12 Rel. Per (%)
M.Cap. (INR b)
M.Cap. (USD b)
Avg Val, INRm
Free float (%)
Jaguar volumes increase by 4.4% YoY and land Rover volumes by 0.6% YoY
TTMT IN
3,396.6
518 / 357
-14/-10/-48
1254.0
19.5
3586.0
63.6
Financials Snapshot (INR b)
Y/E March
2018E 2019E 2020E
Net Sales
2,970 3,354 3,576
EBITDA
375.0 528.4 554.5
NP
94.9 196.6 198.7
Adj. EPS (INR)
28.0
57.9
58.5
EPS Gr. (%)
41.1 107.1
1.1
BV/Sh. (INR)
208.9 268.1 327.8
RoE (%)
14.7
24.3
19.6
RoCE (%)
8.1
12.8
10.7
P/E (x)
13.2
6.4
6.3
P/BV (x)
1.8
1.4
1.1
Shareholding pattern (%)
Dec-17 Sep-17 Dec-16
As On
Promoter
36.4
36.4
34.7
DII
17.1
15.3
14.8
FII
21.4
22.6
24.2
Others
25.1
25.8
26.2
FII Includes depository receipts
Stock Performance (1-year)
Tata Motors
Sensex - Rebased
700
600
500
400
300
JLR’s wholesale volumes grew 1.8% YoY (-9.9% MoM) to 49.6k units (including
China JV’s 8,125 units) in January 2018, as against our estimate of 55.6k units.
In Jan-18, Jaguar volumes grew 4.4% YoY to 16,108 units (est. of 14,000 units).
Land Rover (LR) volumes increased marginally by 0.6% YoY to 33.5k units (est.
of 41.6k units), led by ramp-up of all-new Discovery and RR Velar.
For YTDFY18, JLR wholesales grew 5.4% YoY to 500k units, as LR sales increased
8.7% to 361k units, while Jaguar sales declined 2.2% to 139k units.
JLR’s retail volumes rose 2.9% YoY (-11.9% MoM) to 49.1k units. LR sales grew
by 3.7% YoY to 35k units and Jaguar sales by 0.8% YoY to 14.1k units.
XF volumes grew 11.7% YoY, while XE and F-Pace volumes fell 30% and 7% YoY,
respectively. Retails of E-Pace came in at 1.46k units (454 units in Dec-17).
LR’s retail volumes increased 3.7% YoY, mainly led by a 134% rise in Discovery
volumes, while RR Sport and RR Evoque volumes declined 29% and 22%,
respectively. RR Velar clocked in volumes of 5.9k units.
Region-wise, China volumes grew 16.4% YoY to 14.9k units. The growth in
China is reflecting the introduction of the long wheelbase Jaguar XFL and XE, as
well as strong sales of F-Pace, Discovery Sport, Range Rover Sport and Evoque.
Retails in the UK and Europe markets declined 3.7% and 8.7%, respectively,
while those in the US remained flat YoY.
Mr Andy Goss, Jaguar Land Rover Group Sales Director said, “The
continued
demand in China is encouraging; however, we are still facing challenges
because of tough trading conditions in our key UK and Europe markets.”
The stock trades at 6.4x/6.3x FY19E/20E consolidated EPS. Maintain
Buy
with a
target price of INR515 (Mar-20 SOTP-based).
12 February 2018
34

December 2017 Results Preview | Sector: Financials
Bank of India
Bloomberg
Equity Shares (m)
M. Cap. (INR b)/(USD b)
52-Week Range (INR)
1,6,12 Rel Perf. (%)
Financial Snapshot (INR b)
Y/E March
2017 2018E
NII
118.3 117.7
OP
97.3 74.7
NP
-15.6 -1.3
NIM (%)
2.1
2.0
EPS (INR)
-14.8 -1.2
EPS Gr. (%)
NM
NM
ROE (%)
-6.7 -0.4
ROA (%)
-0.3
0.0
BV/Sh. (INR)
224
231
ABV/Sh. (INR)
68
112
Div. Payout (%)
0.0
0.0
Valuations
-11.4 -141.4
P/E(X)
0.75 0.72
P/BV (X)
2.77 1.49
P/ABV (X)
BOI IN
1055.4
178 / 3
217 / 107
-13 / 12 / 28
CMP: INR168
TP: INR175 (+4%)
Neutral
2019E
132.5
83.2
5.8
2.0
4.9
NM
1.8
0.1
233
147
0.0
34.0
0.72
1.14
2020E
144.8
88.5
12.2
2.0
10.3
143.4
3.6
0.2
240
191
0.0
16.3
0.70
0.88
Continued asset quality strain and capital conservation efforts have
led to multiple quarters of muted loan growth. We expect 3QFY18
loan growth to be flat YoY (decline 1% QoQ). We believe deposit
growth will stabilize and expect deposits to stay largely flat (-1%
YoY).
We expect NIM to pick up sequentially to 2.1% with moderation in
interest income reversals and a favorable cost of funds
environment. NII is expected to be flat YoY due to sluggish loan
book growth.
Non-interest income is likely to decline sharply from previous
quarters, given lower trading gains. Fee income is expected to pick
up marginally.
We expect stress additions to moderate, but remain high during the
quarter, leading to elevated provisioning.
We expect operating profit to decline sharply by 24% YoY, led by
decline in other income. BOI trades at 0.7x FY19E BV and 34.0x
FY19E EPS. Neutral.
Key issues to watch for
Stress addition trends and outlook for FY18.
Upgrade/recovery trends.
Outlook on balance sheet growth and further capital infusion.
Quarterly Performance
Net Interest Income
% Change (Y-o-Y)
Other Income
Net Income
Operating Expenses
Operating Profit
% Change (Y-o-Y)
Other Provisions
Profit before Tax
Tax Provisions
Net Profit
% Change (Y-o-Y)
Operating Parameters
NIM (Cal, %)
Deposit Growth (%)
Loan Growth (%)
CD Ratio (%)
Asset Quality
Gross NPA (INR b)
Gross NPA (%)
E: MOSL Estimates
1Q
27,752
-4.7
12,384
40,136
23,597
16,539
-3.0
27,702
-11,163
-3,750
-7,414
NM
2.0
-2.0
-5.2
77.8
518.7
13.4
FY17
2Q
27,197
-9.9
20,106
47,304
22,375
24,928
70.9
22,962
1,966
698
1,268
NM
2.0
-3.8
-4.8
76.8
522.6
13.5
3Q
28,626
5.7
17,693
46,319
21,734
24,584
74.5
23,026
1,559
542
1,017
NM
2.0
2.6
-5.4
71.3
517.8
13.4
4Q
34,686
8.8
17,540
52,226
20,951
31,275
113.6
47,362
-16,087
-5,632
-10,455
NM
2.5
5.3
2.0
72.9
520.4
13.2
1Q
25,330
-8.7
16,110
41,440
17,646
23,794
43.9
22,453
1,342
464
877
NM
1.8
9.2
0.0
71.9
510.2
13.1
FY18E
2Q
29,082
6.9
17,064
46,146
23,816
22,331
-10.4
19,533
2,798
1,007
1,791
41.2
2.0
7.6
0.3
71.9
493.1
12.6
FY17
3Q
28,675
0.2
12,969
41,643
22,879
18,765
-23.7
17,304
1,461
511
949
-6.7
2.1
-0.6
0.3
67.0
486.2
12.6
(INR M)
FY18E
4Q
32,964 1,18,261 1,17,727
-5.0
0.9
-0.5
17,066
67,723
60,951
50,030 1,85,984 1,78,678
29,118
88,658 1,03,993
20,912
97,326
74,685
-33.1
61.3
-23.3
21,427 1,21,052
76,526
-516 -23,726
-1,841
-144
-8,142
-516
-371 -15,584
-1,326
-96.4
NM
NM
2.5
9.8
8.4
67.0
500.0
11.8
2.1
5.3
2.0
72.9
520.4
13.2
2.1
6.5
7.2
68.3
500.0
11.8
12 February 2018
35

December 2017 Results Preview | Consumer
Britannia Industries
Bloomberg
Equity Shares (m)
M. Cap. (INR b)/(USD b)
52-Week Range (INR)
1,6,12 Rel Perf. (%)
Financial Snapshot (INR b)
Y/E March
Sales
EBITDA
Adj. PAT
Adj. EPS (INR)
EPS Gr. (%)
BV/Sh.(INR)
RoE (%)
RoCE (%)
Payout (%)
Valuations
P/E (x)
P/BV (x)
EV/EBITDA (x)
Div. Yield (%)
63.3
20.8
46.8
0.0
55.2
17.2
39.1
0.6
43.7
13.9
30.6
0.8
34.9
11.3
24.1
1.0
2017 2018E 2019E 2020E
89.6
11.9
8.8
73.7
7.3
36.9
31.1
0.0
99.0
14.1
10.1
84.5
14.7
34.0
29.0
35.0
118.6 142.6
17.8
12.8
26.4
35.2
30.4
35.0
22.3
16.1
25.2
35.7
31.2
35.0
BRIT IN
120.0
560 / 9
4964 / 2833
-6 / 17 / 36
CMP: INR4,665 TP: INR6,098 (+31%)
Buy
We expect Britannia’s (BRIT) sales to grow 13% YoY to INR25.6b,
with base business volumes growing 10% on a favorable base of
2% volume growth.
Wheat and sugar were down YoY. Gross margins are likely to
expand 100bp YoY to 38.3% in 3QFY18.
We expect 150bp YoY expansion in operating margin to 14.5%,
and estimate 26% EBITDA growth and 21% adj. PAT growth for
the quarter.
The stock trades at 43.7x/34.9x FY19E/FY20E EPS of
INR106.9/INR133.8; maintain Buy. Britannia is one of our top
picks in the tier-II consumer space.
106.9 133.8
224.7 271.9 335.3 414.7
Key issues to watch for
Pace of rural recovery.
Outlook for raw materials.
Update on dairy business.
Quarterly Performance
Y/E March
Base business volume growth (%)
Net Sales
YoY Change (%)
COGS
Gross Profit
Margins (%)
Other Operating Exp
% of Sales
Total Exp
EBITDA
Margins (%)
YoY Growth (%)
Depreciation
Interest
Other Income
PBT
Tax
Rate (%)
Adjusted PAT
YoY Change (%)
1Q
10.0
21,063
8.5
12,879
8,184
38.9
5,367
25.5
18,246
2,817
13.4
3.5
279
15
739
3,263
1,071
32.8
2,192
13.2
FY17
2Q
10.0
23,612
11.0
14,902
8,709
36.9
5,578
23.6
20,481
3,131
13.3
2.0
289
15
670
3,496
1,156
33.1
2,340
5.8
3Q
2.0
22,648
5.6
14,190
8,458
37.3
5,504
24.3
19,694
2,954
13.0
0.3
303
11
561
3,201
997
31.1
2,204
4.6
4Q
2.0
22,444
5.2
13,915
8,528
38.0
5,448
24.3
19,363
3,081
13.7
6.1
322
13
335
3,081
973
31.6
2,108
5.9
1Q
2.0
22,248
5.6
13,873
8,375
37.6
5,479
24.6
19,352
2,896
13.0
2.8
332
13
741
3,293
1,133
34.4
2,160
-1.5
FY18
2Q
3QE
5.0
10.0
25,365 25,592
7.4
13.0
15,840 15,779
9,525
9,813
37.6
38.3
5,836
6,091
23.0
23.8
21,676 21,871
3,689
3,721
14.5
14.5
17.8
26.0
336
363
14
13
596
701
3,934
4,046
1,326
1,376
33.7
34.0
2,609
2,670
11.5
21.2
FY17
4QE
12.0
25,790
14.9
15,815
9,975
38.7
6,217
24.1
22,032
3,758
14.6
22.0
367
15
718
4,094
1,391
34.0
2,703
28.3
6.0
89,623
7.4
55,887
33,736
37.6
21,872
24.4
77,759
11,864
13.2
-5.1
1,193
55
2,424
13,040
4,197
32.2
8,843
7.3
FY18E
7.3
98,996
10.5
61,307
37,689
38.1
23,624
23.9
84,931
14,065
14.2
18.6
1,399
55
2,756
15,367
5,225
34.0
10,142
14.7
E: MOSL Estimates
12 February 2018
36

December 2017 Results Preview | Sector: Capital Goods
CG Power and Industrial
Bloomberg
Equity Shares (m)
M. Cap. (INR b)/(USD b)
52-Week Range (INR)
1,6,12 Rel Perf. (%)
CGPOWER IN
626.8
57 / 1
97 / 60
6 / 2 / 24
CMP: INR92
TP: INR90 (-1%)
Neutral
Financial Snapshot (INR b)
Y/E March
2017 2018E 2019E 2020E
Net Sales
EBITDA
Adj. PAT
EPS(INR)
EPS Gr. (%)
BV/Sh. (INR)
RoE (%)
RoCE (%)
Payout (%)
Valuations
P/E (x)
P/BV (x)
EV/EBITDA (x)
Div Yield (%)
* Consolidated
31.2
1.4
13.1
0.7
-14.6
1.5
14.2
-0.6
25.8
1.4
11.9
0.3
20.4
1.4
10.3
0.4
61.2
4.7
-4.2
2.9
-18.6
65.6
4.2
6.8
-7.7
64.4
4.3
-3.9
-6.2
NM
59.9
5.3
7.2
7.7
69.1
5.1
2.2
3.5
NM
63.1
7.0
7.5
7.7
76.8
5.8
2.8
4.5
26.7
67.2
8.1
8.2
7.7
Sale of power business (EUR38m) in Hungary has now reached the
final stages, and management expects the deal to conclude latest
by March 2018.
Management intends to monetize ~INR10b of non-core assets,
including additional land at Kanjurmarg, to lower standalone
business debt.
We expect consolidated revenue to grow 30% YoY to INR16.1b in
3QFY18.
Operating profit is expected to improve 39% YoY to INR1.2b, led by
better product mix. EBIDTA margin should improve 50bp YoY to
7.2%.
We estimate adjusted PAT at INR582m, as against loss of INR314m
in 3QFY17.
Maintain
Neutral.
Key issues to watch
Lowering of debt in demerged business through asset sales.
Quarterly performance (Consolidated)
1Q
15,234
48.3
1,365
-1,100.1
9.0
381
304
155
0
835
150
18.0
2.4
682
682
(209.0)
FY17
2Q
3Q
13,155
12,441
-8.0
10.6
881
833
-32.0
-10.8
6.7
6.7
322
341
440
509
233
306
-331
-717
20
-427
127
-117
638.2
27.4
3.6
3.9
-111
-314
220
402
(55.8)
(25.6)
4Q
17,101
-7.6
1,181
-23.7
6.9
438
625
232
-4,816
-4,465
-31
0.7
6.3
-4,440
376
(64.4)
1QE
14,364
-5.7
451
-66.9
3.1
361
537
118
-379
-707
146
-20.6
7.0
-860
-481
(170.5)
FY18
2QE
3QE
15,576 16,107
18.4
29.5
1,319 1,156
49.8
38.8
8.5
7.2
382
331
569
390
300
238
-4,600 -1,000
-3,931
-327
216
88
-5.5
-26.8
551.2
3.4
-4,699
-418
-99
582
(144.8)
44.8
FY17
4QE
18,382
7.5
1,317
11.5
7.2
249
-50
225
-301
1,043
-126
-12.1
6.3
1,162
1,463
289.2
FY18
Sales (Net)
Change (%)
EBITDA
Change (%)
As of % Sales (Adj)
Depreciation
Interest
Other Income
EO Income/(Exp)
PBT
Tax
Effective Tax Rate (%)
Minority interest
Reported PAT
Adjusted PAT
Change (%)
E: MOSL Estimates
61,198 64,429
9.4
5.3
4,702 4,324
9.3
-8.0
1,500
1,880
687
2,009
166
8.3
15.7
1,827
1,827
(18.6)
1,322
1,446
880
2,437
323
13.3
15.7
2,098
2,098
14.8
12 February 2018
37

December 2017 Results Preview | Sector: Oil & Gas
GAIL
Bloomberg
Equity Shares (m)
M. Cap. (INR b)/(USD b)
52-Week Range (INR)
1,6,12 Rel Perf. (%)
GAIL IN
1691.3
831 / 13
518 / 326
5 / 26 / 21
CMP: INR491
TP: INR371 (-24%)
Sell
Financial snapshot (INR b)
y/e march
2017 2018E 2019E 2020E
Sales
EBITDA
Adj. PAT
Adj. EPS (INR)
EPS Gr. (%)
BV/Sh.(INR)
RoE (%)
RoCE (%)
Payout (%)
Valuations
P/E (x)
P/BV (x)
EV/EBITDA (x)
Div. Yield (%)
21.8
2.2
11.9
1.8
18.8
2.0
10.4
1.6
15.7
1.9
9.1
2.0
15.0
1.7
8.7
2.1
480.7
63.2
38.2
22.6
71.4
225.6
9.6
8.7
50.1
533.4
75.9
44.2
26.1
15.8
242.0
11.2
9.6
37.3
595.1
87.9
52.7
31.2
19.3
261.5
12.4
10.6
37.3
631.6
91.8
55.3
32.7
4.9
282.0
12.0
10.3
37.3
We expect GAIL to report PAT of INR11.4b (+15% YoY and -13%
QoQ). We model nil subsidy sharing for GAIL in 3QFY18 (v/s nil in
3QFY17 and 2QFY18).
We estimate EBITDA at INR19.3b in 3QFY18 v/s INR17b in 3QFY17
and INR20.7b in 2QFY18.
We model Brent crude price of USD55.6/bbl for FY18 and USD60/bbl
for FY19/20.
Segmental EBIT (pre-subsidy) is expected to be INR18b (+16% YoY),
led by a turnaround in petchem division profitability and likely
higher gas transmission profitability.
GAIL trades at 15.0x FY20E EPS of INR32.7. Maintain Sell.
Key issues to watch for
(a) Petchem profitability, (b) profitability in the gas trading business, (c)
progress of pipeline projects, (d) pending tariff revisions for key pipelines,
and (e) visibility on placement of US contracts.
Quarterly Performance
Y/E March
Net Sales
Change (%)
EBITDA
% of Net Sales
Depreciation
Interest
Other Income
Extraordinary item*
PBT
Tax
Rate (%)
PAT
Adj PAT
Change (%)
EPS (INR)
Key Assumptions
Gas Trans. volume (mmsmd)
Petchem sales ('000MT)
E: MOSL Estimates
1Q
106,866
-14.6
15,732
14.7
3,354
1,774
1,362
4,893
16,858
3,506
20.8
13,352
8,459
99.4
5.0
96
110
(INR Million)
FY17
FY18
FY17
2Q
3Q
4Q
1Q
2Q
3QE
4QE
118,582 121,079 134,217 114,065 124,097 131,836 161,989 480,743
-15.8
-9.5
15.4
6.7
4.7
8.9
20.7
-6.9
15,155 17,015 15,250 18,994 20,694 19,266 20,945 63,152
12.8
14.1
11.4
16.7
16.7
14.6
12.9
13.1
3,563
3,579
3,471
3,451
3,425
3,580
3,811 13,968
1,198
1,601
220
1,014
926
860
638
4,794
3,361
3,002
4,981
1,158
2,929
2,350
2,301 12,705
0
0
-7,880
0
0
0
0
-2,987
13,755 14,836
8,659 15,687 19,273 17,176 18,798 54,108
4,508
5,007
6,058
5,431
6,177
5,840
6,391 19,079
32.8
33.7
70.0
34.6
32.0
34.0
34.0
35.3
9,247
9,829
2,602 10,256 13,096 11,336 12,406 35,029
9,247
9,829 10,482 10,256 13,096 11,336 12,406 38,016
109.9
48.0
36.1
21.3
41.6
15.3
18.4
65.4
5.5
5.8
6.2
6.1
7.7
6.7
7.3
22.5
101
136
103
146
102
186
100
131
106
175
106
200
109
198
100
578
FY18E
531,986
10.7
79,899
15.0
14,267
3,437
8,738
0
70,934
23,839
33.6
47,096
47,096
23.9
27.8
105
704
12 February 2018
38

December 2017 Results Preview | Consumer
GSK Consumer
Bloomberg
Equity Shares (m)
M. Cap. (INR b)/(USD b)
52-Week Range (INR)
1,6,12 Rel Perf. (%)
SKB IN
42.1
269 / 4
6650 / 4856
2 / 11 / -1
CMP: INR6,390
TP: INR5,785 (-9%)
Neutral
We expect GSK Consumer to report net sales of INR9.7b, up 13%
YoY, led by 9% volume growth in HFD. We note that the base is
favorable for this quarter, with 17% YoY volume decline in HFD
(11.5% YoY decline in sales).
We estimate EBITDA margin to expand 100bp YoY to 20.5%.
Thus, EBITDA and adj. PAT are expected to grow 18.8% and 11.7%
YoY, respectively.
The stock trades at 35x/30.9x FY19E/20E EPS of
INR182.3/INR206.5. We have a Neutral rating on the stock.
Financial Snapshot (INR b)
Y/E December
2017 2018E 2019E 2020E
Sales
EBITDA
Adj. PAT
Adj. EPS (INR)
EPS Gr. (%)
BV/Sh.(INR)
RoE (%)
RoCE (%)
Payout (%)
Valuation
P/E (x)
P/BV (x)
EV/EBITDA (x)
Div. Yield (%)
40.9
8.6
27.6
1.1
39.7
7.9
27.6
1.1
35.0
7.2
23.6
1.3
30.9
6.5
20.6
1.5
40.1
8.6
6.6
-4.5
22.2
22.2
44.9
42.8
8.8
6.8
3.0
20.7
20.7
45.0
48.1
10.1
7.7
13.4
21.4
21.5
45.0
53.5
11.5
8.7
13.2
22.1
22.1
45.0
156.1 160.8 182.3 206.5
742.5 812.1 891.1 980.5
Key issues to watch for
HFD volume outlook.
Outlook for category growth and raw materials.
Market share trend.
Guidance on price increases.
Quarterly Performance
Y/E Mar
HFD Volume Growth (%)
Net Sales
YoY Change (%)
Total Exp
EBITDA
Margins (%)
YoY Change (%)
Depreciation
Interest
Other Income
PBT
Tax
Rate (%)
Adj PAT
YoY Change (%)
E: MOSL Estimates
1Q
-6.0
9,439
-5.2
7,404
2,035
21.6
-0.6
147
6
592
2,474
868
35.1
1,606
2.9
FY17
2Q
-3.0
10,803
-1.1
8,351
2,452
22.7
3.0
148
6
578
2,876
1,039
36.1
1,837
-0.1
3Q
-17.0
8,604
-11.5
6,927
1,677
19.5
-9.5
171
6
559
2,059
695
33.8
1,364
-8.3
4Q
-1.0
11,019
2.3
8,848
2,171
19.7
1.5
177
9
710
2,695
936
34.7
1,759
8.4
1Q
0.0
9,853
4.4
8,190
1,664
16.9
-18.3
170
5
557
2,045
723
35.3
1,322
-17.7
FY18
2Q
2.5
11,153
3.2
8,540
2,614
23.4
6.6
177
6
550
2,981
1,057
35.5
1,924
4.7
3QE
9.0
9,722
13.0
7,730
1,992
20.5
18.8
172
7
531
2,344
820
35.0
1,524
11.7
4QE
6.0
12,073
9.6
9,569
2,503
20.7
15.3
167
10
702
3,029
1,036
34.2
1,993
13.3
FY17
-6.8
39,864
-3.6
31,530
8,335
20.9
-1.0
642
28
2,439
10,104
3,537
35.0
6,566
-4.5
FY18E
4.5
42,802
7.4
34,029
8,773
20.5
5.3
686
28
2,340
10,399
3,636
35.0
6,763
3.0
12 February 2018
39

December 2017 Results Preview | Sector: Financials
Indian Bank
Bloomberg
Equity Shares (m)
M. Cap. (INR b)/(USD b)
52-Week Range (INR)
1,6,12 Rel Perf. (%)
INBK IN
480.3
179 / 3
428 / 219
-7 / 22 / 40
CMP: INR374
TP: INR438 (+17%)
Buy
Financial Snapshot (INR b)
Y/E March
2017 2018E 2019E 2020E
NII
OP
NP
EPS (INR)
EPS Gr. (%)
BV/Sh. (INR)
ABV/Sh (INR)
RoE (%)
RoA (%)
Div. Payout (%)
Valuations
P/E (x)
P/ BV (x)
P/ABV (x)
Div. Yield (%)
12.8
1.2
1.7
1.6
10.9
1.1
1.5
1.8
9.7
1.0
1.4
2.1
8.8
1.0
1.2
2.3
58.7
44.8
16.5
34.4
17.6
327
245
10.9
0.7
23.2
65.1
46.2
18.4
38.3
11.4
357
273
11.2
0.7
23.2
74.5
50.2
20.3
42.3
10.3
389
306
11.3
0.7
23.2
58.7
44.8
16.5
34.4
17.6
327
245
10.9
0.7
23.2
Loan growth is expected to pick up further to ~16% YoY (+2%
QoQ), led by balance sheet recalibration. Deposit growth is
expected be 10% YoY (2% QoQ).
Calculated NIM is expected to decline marginally to 2.9%. NII will
grow ~22% YoY on a low base.
Overall non-interest income is expected to grow 12% YoY, led by
healthy traction in fee income partially offset by moderation in
trading gains.
We expect slippage ratio to remain elevated at 2.5% and credit
costs to moderate to 1.5% (1.9% in 2QFY18).
INBK trades at 1.0x FY19E BV and 9.7x FY19E EPS. Maintain Buy.
Key issues to watch for
Outlook on business growth and asset quality remains the key factor
to monitor.
Quantum of loans rescheduled under the 5/25 scheme.
View on margins with an improvement in liquidity and lower interest
rates.
Quarterly Performance
Net Interest Income
% Change (Y-o-Y)
Other Income
Net Income
Operating Expenses
Operating Profit
% Change (Y-o-Y)
Other Provisions
Profit before Tax
Tax Provisions
Net Profit
% Change (Y-o-Y)
Operating Parameters
NIM (Cal, %)
Deposit Growth (%)
Loan Growth (%)
Asset Quality
Gross NPA (INR b)
Gross NPA (%)
E: MOSL Estimates
1Q
12,363
10.4
4,417
16,780
7,748
9,032
27.5
4,170
4,862
1,788
3,074
42.8
2.7
1.1
1.5
88.9
7.0
FY17
2Q
3Q
12,783
12,466
18.3
12.2
5,846
5,997
18,629
18,463
8,567
8,251
10,062
10,212
36.8
33.2
4,783
5,403
5,279
4,809
1,228
1,074
4,051
3,735
9.7
670.4
2.8
3.2
0.2
91.9
7.3
2.6
5.2
-0.7
96.8
7.7
4Q
13,849
22.1
5,854
19,703
9,001
10,701
29.3
8,069
2,632
-565
3,197
278.4
2.8
2.4
-1.0
98.7
7.5
1Q
14,595
18.1
6,521
21,116
8,592
12,524
38.7
7,156
5,368
1,644
3,724
21.2
2.9
7.9
4.2
96.5
7.2
FY18E
2Q
15,437
20.8
7,146
22,583
8,826
13,756
36.7
7,446
6,311
1,795
4,515
11.5
3.01
11.5
13.4
96.2
6.7
FY17
3Q
15,247
22.3
5,359
20,607
9,368
11,239
10.1
4,000
7,239
2,389
4,850
29.9
2.85
10.3
16.4
97.0
6.6
4Q
13,565
-2.1
4,917
18,482
10,899
7,583
-29.1
1,937
5,646
1,949
3,698
15.7
2.5
7.5
10.0
102.7
7.1
51,461
15.7
22,114
73,574
33,567
40,007
18.1
22,425
17,582
3,526
14,057
97.6
2.7
2.4
-1.0
98.7
7.5
(INR M)
FY18E
58,722
14.1
23,804
82,526
37,685
44,841
12.2
20,538
24,303
7,777
16,526
17.6
2.8
7.5
10.0
102.7
7.1
12 February 2018
40

December 2017 Results Preview | Utilities
NHPC
Bloomberg
Equity Shares (m)
M. Cap. (INR b)/(USD b)
52-Week Range (INR)
1,6,12 Rel Perf. (%)
NHPC IN
10259.3
335 / 5
35 / 26
14 / -6 / -7
CMP: INR33
TP: INR37 (-12%)
Buy
Financial Snapshot (INR Million)
y/e march
2017 2018E 2019E 2020E
Sales
EBITDA
NP
EPS (INR)
EPS Gr. (%)
BV/Sh. (INR )
RoE (%)
RoCE (%)
Payout (%)
VALUATION
We expect PAT to increase from INR807m in 3QFY17 to INR2b in
3QFY18.
Generation is expected to be broadly flat YoY.
Other income is expected to decline from INR1.7b YoY to INR1b on
lower surplus cash balance.
86.2
48.4
30.3
3.0
25.6
28.3
10.0
7.0
98.9
9.9
1.0
10.2
90.3
51.7
24.4
2.4
-19.3
28.4
8.4
6.2
95.7
13.7
1.2
10.6
107.3
67.8
31.8
3.1
30.3
29.2
10.8
8.0
73.5
10.5
1.1
8.2
127.2
85.0
37.6
3.7
18.2
30.2
12.4
10.0
73.6
8.9
1.1
6.4
P/E (x)
P/BV (x)
Div. Yield (%)
Key issues to watch for
Cost control at Mundra.
Performance at Delhi.
Consolidated performance
Y/E March
Net Sales
YoY Change (%)
Total Expenditure
EBITDA
Margins (%)
Depreciation
Interest
Other Income
Rate regulated activity
PBT before EO expense
Extra-Ord expense
PBT
Tax
Rate (%)
Reported PAT
Adj PAT
1Q
21,968
9.7
8,403
13,565
61.8
3,384
2,751
1,633
1,379
10,443
0
10,443
1,864
17.9
8,578
8,578
FY17
2Q
3Q
24,034 13,086
2.5
-4.3
8,438
6,841
15,595
6,244
64.9
47.7
3,422
3,551
2,794
2,688
8,779
1,750
0
0
18,158
1,755
0
0
18,158
1,755
3,696
948
20.4
54.0
14,462
807
14,462
807
4Q
13,624
-16.9
11,394
2,231
16.4
3,527
2,499
2,426
3,336
1,966
0
1,966
282
14.3
1,684
1,684
1Q
23,275
6.0
9,412
13,863
59.6
3,536
2,409
1,053
2,010
10,980
0
10,980
2,354
21.4
8,627
8,627
FY18
2Q
3QE
19,717 14,587
-18.0
11.5
8,567
7,047
11,150
7,540
56.5
51.7
3,505
3,505
2,356
2,333
5,194
1,000
1,426
0
11,908
2,703
0
0
11,908
2,703
1,722
703
14.5
26
10,186
2,000
10,186
2,000
(INR Million)
FY17
FY18E
4QE
20,253
48.6
10,830
9,422
46.5
3,323
1,918
1,799
612
6,593
0
6,593
2,946
44.7
3,647
3,647
72,712
-1.1
35,076
37,636
51.8
13,884
10,732
14,587
7,140
34,746
0
34,746
6,790
19.5
27,956
27,956
77,831
7.0
35,856
41,975
53.9
13,868
9,016
9,046
4,047
32,184
0
32,184
7,724
24.0
24,460
24,460
12 February 2018
41

December 2017 Results Preview | Sector: Infrastructure
Sadbhav Eng
Bloomberg
Equity Shares (m)
M. Cap. (INR b)/(USD b)
52-Week Range (INR)
1,6,12 Rel Perf. (%)
SADE IN
171.5
72 / 1
437 / 262
8 / 26 / 25
CMP: INR418
TP: INR445 (+6%)
Buy
Financial Snapshot (INR b)
Y/E March
2017 2018E 2019E 2020E
Net Sales
EBITDA
Adj. PAT
EPS(INR)
EPS Gr. (%)
BV/Sh. (INR)
RoE (%)
RoCE (%)
Valuations
P/E (x)
P/BV (x)
EV/EBITDA (x)
Div Yield (%)
*Consolidated
34.7
3.9
22.5
0.3
26.8
3.5
17.0
0.3
25.9
3.1
13.9
0.3
22.3
2.7
11.8
0.3
33.2
3.6
1.9
11.0
42.3
33.2
12.0
7.9
38.2
4.3
2.4
14.2
29.3
38.2
13.7
9.0
45.2
5.1
2.5
14.6
3.5
45.2
12.6
10.2
53.6
6.1
2.9
17.0
16.4
53.6
13.0
10.8
Sadbhav has been declared L1 for a project from western coal
field for overburden removal worth INR6.7b.
SIPL has been declared L1 in the Dangiywas Jajiwal section
package I for Jodhpur ring road package, Rajasthan for INR11.6b;
EPC opportunity for Sadbhav Engineering stands at INR9.8b.
We expect revenue of INR9.9b (up 14.7% YoY), led by smooth
execution of orders in hand.
EBIDTA is expected to grow 19% YoY to INR1.1b. EBIDTA margins
are expected to improve 50bp YoY to 11.3% on account of a
better revenue mix.
Adjusted PAT at INR657m is expected to register 25% growth YoY.
Key issues to watch
Improvement in working capital cycle and overall quality of
balance sheet.
Standalone - Quarterly Earning Model
Y/E March
Net Sales
YoY Change (%)
Total Expenditure
EBITDA
Margins (%)
Depreciation
Interest
Other Income
PBT before EO expense
Extra-Ord expense
PBT
Tax
Rate (%)
Reported PAT
Adj PAT
YoY Change (%)
Margins (%)
E: MOSL Estimates
1Q
8,070
-2.7
7,201
868
10.8
254
172
48
489
0
489
2
0.5
487
487
20.0
6.0
FY17
2Q
3Q
6,156
8,648
-17.5
14.8
5,503
7,710
654
938
10.6
10.8
253
250
221
243
8
60
187
505
0
0
187
505
1
-19
0.8
-3.7
185
524
185
524
-50.2
89.7
3.0
6.1
4Q
10,329
20.4
9,233
1,096
10.6
243
355
218
716
0
716
33
4.7
682
682
38.7
6.6
1Q
9,444
17.0
8,376
1,068
11.3
245
322
39
540
0
540
-15
-2.8
555
555
14.0
5.9
FY18
2Q
3QE
6,931
9,923
12.6
14.7
6,143
8,805
788
1,118
11.4
11.3
251
251
215
263
5
88
327
691
0
0
327
691
-8
35
-2.6
5.0
335
657
335
657
80.8
25.3
4.8
6.6
FY17E
4QE
11,869
14.9
10,578
1,291
10.9
257
253
218
998
0
998
117
11.7
882
882
29.3
7.4
33,203
4.2
29,647
3,556
10.7
1,000
992
333
1,897
0
1,897
18
1.0
1,878
1,878
22.1
5.7
(INR m)
FY18
38,166
14.9
33,902
4,264
11.2
1,005
1,054
350
2,556
0
2,556
128
5.0
2,428
2,428
29.3
6.4
12 February 2018
42

In conversation
1. PETRONET LNG: Dahej project utilisation at 113%, happy to be
part of it; Prabhat Singh, MD & CEO
Fortunate there is demand in the country and people are pushing for the
volumes. Last quarter had done better. This quarter was around 10 percent
lower but still, it is a good number. On an overall basis, this is a good quarter.
Dahej project utilisation is at 113 percent, for Kochi it is 12 percent. On an
average, it is around 88 percent capacity utilisation. Happy to be part of Dahej
project.
New business is expected in Sri Lanka with a Japanese partner. The project
equity for the company will be at 47.75 percent.
Initial investment will be approximately USD 300 million for this project.
2. BRIGADE ENTERPRISES: Have 25 projects in pipeline for FY19;
MR Jaishankar, CMD
Impact of goods and services tax (GST), Real Estate Regulatory Authority (RERA)
and demonetisation are behind.
Tax exemptions, affordable housing etc. have changed the mood of the market
for good.
Will launch close to Rs 1,000 crore of commercial projects in form of strata sales
in Q1 of FY19.
Have 25 projects in the pipeline for FY19.
Will be finalisation on the investor for the hospitality business in FY19.
3. DR LAL PATHLABS : Competitive pricing leads to higher
volume growth; Om Manchanda, CEO
Have launched bundled tests in response to pricing pressure.
More competitive pricing leads to higher volume growth.
Two parts to business. One is consumer facing and second is B2B business which
is high-end complex test which will continue through pick-up point expansion.
Till last year company did about 5,000 pick-up points.
Competitive intensity is going to be in the routine tests where the competition is
with lot of labs. However there is a large component of company’s business
which depends on technology which is not available with everyone else.
Goods and services tax had adverse impact on cost structure.
4. WELSPUN CORP : Aim to be debt free around 2020;
progressing well on target; Vipul Mathur, CEO & MD
On year-on-year basis have shown considerable increase in margins. But in this
particular quarter the blend of orders was more on the domestic side of it and
that is getting reflected into EBITDA margin.
Have a confirmed order book of 1.28 million tonne and the total value is around
Rs 8,200 crore.
Have been able to pay around Rs 360 crore of debt. Current net debt stands
around Rs 640 crore.
Have stated objective of becoming a debt free company around 2020 and
progressing well on the target.
43
12 February 2018

5. MANAPPURAM FIN : On track for 10-15% gold loan growth &
20% overall growth in FY18; Kapil Krishan, Chief Financial Officer
Year on year AUM number looks muted because the base was higher. Did not
see impact of monetization in Q3 and Q4 last fiscal.
AUM sequential growth is double that of the market. After three quarters of
decline post demonetisation, Q2 was flat but growth is back on track.
The company on track to achieve 10-15% growth in gold loan and 20% overall.
Going forward, the NPA provisions will decline because all NPAs are coming
from disbursement that were pre-demonetisation. All disbursements post
January have been very good and have collected over 99 percent.
The company is looking at fintech investment or strategic buyouts but there is
nothing concrete yet.
12 February 2018
44

From the think tank
1. Will LTCG+STT hollow out India’s equity markets?
The timing of the Indian government’s decision to reintroduce long-term capital
gains (LTCG) tax is intriguing. Just last month, Singapore Exchange Ltd (SGX) told
investors it had garnered a 52% share of global Nifty futures volumes, up from
47% a year ago. And combined with Dubai Gold and Commodities Exchange
(DGCX), offshore centres have nearly caught up with Indian exchanges in dollar-
rupee trading. Encouraged by the success, SGX has launched futures contracts on
50 leading Indian stocks since 5 February. A big factor that works in its favour is
Singapore’s taxation policy, which exempts capital gains tax and doesn’t impose a
securities transaction tax (STT). In contrast, India now has the rare distinction of
imposing both forms of taxation.
2. Political messaging and the Union Budget
The Union budget for 2018-19, presented in Parliament last week, was a
formidable challenge for the finance minister. He had to strike a balance
between the complex task of managing the economy and the political
compulsions of a government in the last year of its term. There is a slowdown in
economic growth. Employment creation, already too little, has slowed down
even more. Investment has slumped. Exports are stagnant. The crisis in
agriculture persists. So does rural distress. The manufacturing sector shows
signs of deindustrialization. The economy remains vulnerable to shocks such as a
rise in oil prices or a bad monsoon. There are elections to come in eight states
during 2018. And the elections for the Lok Sabha are due in April 2019.
3. Flipkart can bring in muscle to save money, live better
Flipkart’s bringing in the big guns. India’s leading e-commerce company looks set to
team up with Walmart Inc., garnering the startup a valuation of as much as $20
billion in return for a stake that could be as large as 20%, Bloomberg’s Saritha Rai
reported on Friday. There’s a lot that Flipkart Online Services Pvt could do with
around $4 billion in cash. More to the point, having a giant like Walmart in its
corner will go a long way toward fending off Amazon.com Inc., which itself has
pledged to spend $5 billion in the world’s second-most-populous country. There
was a time when Snapdeal.com would rate a mention in the competitive
landscape, but the decision of its founders to veto a merger with Flipkart —
engineered by SoftBank Group Corp. — relegates that outfit to the sidelines.
Eighteen months ago, there was talk of Walmart pumping $1 billion into Flipkart in
a move that would have merely inflamed the market. Today, a much bigger
investment in what’s almost a two-horse race makes more sense.
12 February 2018
45

4. If India INC wants to globalise, it must consider franchising as
a serious option
Franchising is a business model that has been effectively leveraged by the West in
expansion of business, while splitting the cost and responsibility with the local
franchisee. Most multinational businesses operate on this model. To put it simply,
franchising suggests the ownership of something unique and saleable, which the
franchisee uses for payment of a fee, known as royalty or licensing fee. The
franchisee then sets up a business for the manufacture, distribution and/or sale of
that product/service locally. Albeit franchising suggests the ownership of
something unique and saleable, but interestingly many successful franchise
businesses are quite the ordinary everyday use products/services.
International
5. Getting in on the private sector space race
Elon Musk knows how to sell a story. Somewhere in space, the SpaceX founder’s
car is headed for the asteroid belt with a mannequin strapped into the driver’s
seat and “Don’t Panic”—a nod to Douglas Adams’ absurdist science fiction—
flashing on the dashboard. It’s just the right amount of silly, impish and hubristic
to capture the imagination. And so it did, with good reason. There is real meat
to the story Musk’s stunt is selling. The Falcon Heavy launch by SpaceX that put
the car on its trajectory confirms what has been increasingly apparent this
decade: The private sector is leading a new space race. The Heavy took off from
the LC-39A launchpad at the National Aeronautic and Space Administration’s
(Nasa’s) Kennedy Space Center. It’s the same pad used to launch the Apollo 11
mission that put men on the moon.
12 February 2018
46

Click excel icon
for detailed
valuation guide
CMP
(INR)
798
134
3104
762
19529
1548
27743
1147
912
208
3546
750
214
8946
360
369
664
Valuation snapshot
Company
Reco
Automobiles
Amara Raja
Buy
Ashok Ley.
Buy
Bajaj Auto
Buy
Bharat Forge
Buy
Bosch
Neutral
CEAT
Buy
Eicher Mot.
Buy
Endurance Tech. Buy
Escorts
Sell
Exide Ind
Buy
Hero Moto
Neutral
M&M
Buy
Mahindra CIE
Buy
Maruti Suzuki
Buy
Motherson Sumi Buy
Tata Motors
Buy
TVS Motor
Neutral
Aggregate
Banks - Private
AU Small Finance Neutral
Axis Bank
Buy
DCB Bank
Neutral
Equitas Hold.
Buy
Federal Bank
Buy
HDFC Bank
Buy
ICICI Bank
Buy
IDFC Bank
Neutral
IndusInd
Buy
J&K Bank
Buy
Kotak Mah. Bk Buy
RBL Bank
Buy
South Indian
Buy
Yes Bank
Buy
Aggregate
Banks - PSU
BOB
Buy
BOI
Neutral
Canara
Neutral
Indian Bk
Buy
PNB
Buy
SBI
Buy
Union Bk
Neutral
Aggregate
NBFCs
Aditya Birla Cap Buy
Bajaj Fin.
Buy
Capital First
Buy
Cholaman.Inv.&F
Buy
n
Dewan Hsg.
Buy
GRUH Fin.
Neutral
HDFC
Buy
HDFC Stand. Life Buy
Indiabulls Hsg
Buy
TP % Upside
EPS (INR)
EPS Gr. YoY (%)
P/E (x)
P/B (x)
ROE (%)
(INR) Downside FY18E FY19E FY20E FY18E FY19E FY20E FY18E FY19E FY18E FY19E FY18E FY19E
984
158
4031
880
21951
1899
34764
1554
714
268
3986
881
297
10972
458
515
741
23
18
30
16
12
23
25
35
-22
29
12
17
39
23
27
39
12
28.7
4.9
150.3
20.2
459.1
63.1
829.4
27.6
36.6
8.0
185.0
37.6
9.0
275.6
10.0
28.0
13.9
34.2 41.1
2.6 18.9 20.2
6.2
7.7
7.8 26.7 24.0
174.1 201.6 6.5 15.8 15.8
26.8 35.2 54.2 32.7 31.5
595.2 731.7 -3.0 29.6 22.9
84.7 111.7 -32.3 34.1 31.9
1,053.0
1,335.0 34.5 27.0 26.8
38.5 51.8 17.5 39.6 34.5
45.6 54.9 90.4 24.3 20.6
10.2 11.6 -1.3 27.5 13.6
200.1 212.6 9.4
8.2
6.2
44.3 48.8 37.5 17.6 10.1
12.0 14.9 94.3 33.0 24.3
369.9 471.3 10.8 34.2 27.4
14.4 18.3 30.0 43.9 27.2
57.9 58.5 41.1 107.1 1.1
25.1 33.9 18.5 80.5 34.9
21.0 44.9 14.7
15.3
31.0
9.0
6.6
6.5
80.6
16.5
3.2
78.9
12.2
41.5
22.7
3.8
23.9
21.6
44.6
10.9
10.2
8.2
100.9
21.0
3.9
101.4
16.8
54.2
30.3
4.9
30.8
27.8
27.4
20.7
37.8
42.5
24.5
33.4
41.6
24.9
26.0
19.2
19.9
23.8
32.5
35.9
13.2
47.7
25.2
23.4
21.6
17.8
28.5
32.8
18.3
26.3
29.8
20.0
20.4
17.7
16.9
17.9
24.2
24.9
6.4
26.4
17.4
4.6
5.7
4.8
7.4
6.2
2.4
10.6
7.8
3.7
3.3
6.1
3.1
2.2
6.6
7.8
1.8
10.9
4.5
7.4
2.1
2.1
2.1
1.5
4.1
2.5
1.2
4.3
0.7
4.1
3.1
1.0
3.0
3.0
0.9
0.6
0.7
1.0
0.9
1.2
0.6
0.9
4.3
5.8
2.6
4.0
1.8
16.0
4.9
2.9
4.0
3.9
5.0
4.3
6.1
5.6
2.1
8.0
6.5
3.2
2.9
5.3
2.8
2.0
5.6
6.4
1.4
8.2
3.8
6.2
1.9
1.9
1.9
1.4
3.6
2.2
1.1
3.6
0.7
3.6
2.8
0.9
2.5
2.7
0.9
0.6
0.7
1.0
0.8
1.1
0.5
0.8
3.3
4.9
2.3
3.3
1.6
13.2
4.2
2.4
3.5
17.6
22.1
24.2
21.0
15.2
10.1
36.2
20.5
17.2
12.6
34.0
14.1
9.9
19.8
23.4
14.7
24.9
18.0
14.1
5.9
10.1
1.4
9.4
16.7
8.1
6.8
17.0
8.9
13.2
12.2
6.9
17.6
11.0
18.1
24.7
25.3
23.5
17.9
12.3
34.6
23.8
17.3
14.4
32.0
14.6
11.8
22.8
28.1
24.3
35.3
21.8
17.2
11.1
10.4
9.5
9.8
16.6
10.1
6.9
19.1
11.9
14.3
13.8
12.7
19.9
13.3
594
558
171
141
95
1853
327
53
1651
71
1033
481
28
326
705
710
188
205
149
2350
405
65
2076
100
1220
680
38
410
19
27
10
45
56
27
24
22
26
42
18
41
38
26
10.6
14.7
7.4
0.9
5.5
67.0
12.5
3.0
61.1
8.6
32.7
15.8
1.9
18.2
-42.8 43.9 41.1 55.9 38.9
-4.4 111.4 43.7 38.0 18.0
5.3 22.2 21.4 23.2 19.0
-81.6 616.0 53.4 152.3 21.3
13.3 19.1 26.1 17.5 14.7
18.0 20.3 25.2 27.7 23.0
-18.3 32.0 27.6 26.2 19.8
0.4
7.0 21.9 17.6 16.5
27.0 29.2 28.5 27.0 20.9
LP
41.6 37.7 8.2
5.8
22.0 26.9 30.5 31.5 24.9
33.0 43.7 33.2 30.5 21.2
-22.6 97.1 30.4 14.3 7.3
24.8 31.2 28.8 17.9 13.6
15.6 35.1 29.8 27.3 20.2
26.2
LP
196.8
11.4
49.5
70.8
LP
145.2
46.5
35.4
30.2
18.7
26.8
18.8
14.0
13.9
15.4
31.1
108.6
89.1
10.3
84.7
78.6
158.0
73.4
42.8
34.2
27.5
21.5
26.1
23.4
16.3
25.2
22.1
8.7
NM
25.5
9.9
27.6
25.9
NM
33.1
45.2
36.0
20.1
21.3
13.7
53.5
41.2
93.3
14.2
6.9
29.0
8.6
8.9
18.5
15.1
21.3
13.5
30.9
26.6
15.4
17.9
10.8
45.1
36.2
81.9
12.3
156
143
321
339
157
296
126
217
175
415
438
215
415
145
39
23
29
29
37
40
15
17.9
-1.2
12.6
34.4
5.7
11.5
-40.5
22.6
4.9
37.3
38.3
8.5
19.6
5.9
29.7 199.6
10.3 Loss
70.6 -33.0
42.3 17.6
15.7 -8.8
34.9 3,751.8
15.3
PL
170.2
7.8
82.8
56.8
89.1
NA
42.3
38.9
34.5
26.5
22.1
8.0
5.4
32.8
6.4
9.4
-0.4 1.8
2.3
6.8
10.9 11.2
2.9
4.3
5.3
8.0
-16.7 2.7
2.7
6.1
12.5
20.1
13.7
20.4
14.0
32.9
17.6
21.7
29.9
12.3
19.8
15.6
20.2
15.8
32.2
16.5
21.1
30.4
168
1640
688
1316
514
532
1773
440
1291
231
2330
960
1520
720
540
2260
485
1630
38
42
40
16
40
2
27
10
26
3.7
45.6
34.2
61.8
37.4
9.9
43.0
4.7
91.1
5.4
61.7
44.6
73.3
47.5 59.9
11.8 14.6
49.0 57.0
5.4
6.7
105.1 128.3
12 February 2018
47

Click excel icon
for detailed
valuation guide
CMP
(INR)
164
511
614
444
422
1217
590
1962
1310
TP % Upside
(INR) Downside
240
47
608
19
750
22
575
29
515
22
1750
44
800
36
2500
1750
27
34
EPS (INR)
EPS Gr. YoY (%)
FY18E FY19E FY20E FY18E FY19E FY20E
7.4
11.0 13.5 42.2 47.1 23.2
38.5 44.3 52.6
0.6 15.2 18.7
18.6 24.2 30.0 24.0 29.6 24.1
13.9 19.2 23.0 95.8 38.7 19.4
43.8 44.3 49.3 48.1 1.2 11.4
51.4 69.0 92.3 62.4 34.4 33.7
36.0 41.9 50.0 23.5 16.5 19.3
114.2 140.0 166.8
78.7
104.8 125.9
35.4
42.1
28.4
-3.4
12.6
123.6
36.0
9.8
-64.9
-12.4
64.4
19.4
35.5
15.7
10.9
18.4
-7.4
15.2
16.7
16.1
22.6
33.1
22.8
48.7
12.0
-2.6
48.2
26.1
57.4
34.6
19.4
21.6
16.6
18.8
53.8
21.5
21.4
8.0
12.2
20.0
19.2
20.2
22.6
20.4
6.3
37.5
26.9
18.4
31.9
18.6
24.5
24.1
28.5
19.2
13.8
23.7
12.5
12.6
13.8
18.9
Valuation snapshot
P/E (x)
P/B (x)
FY18E FY19E FY18E FY19E
22.0 14.9
3.2
2.7
13.3 11.5
2.0
1.8
32.9 25.4
4.6
4.1
32.0 23.1
3.0
2.8
9.6
9.5
2.1
1.8
23.7 17.6
3.3
2.9
16.4 14.1
2.7
2.3
17.2
16.6
28.6
83.6
22.0
31.6
44.7
47.4
61.3
35.6
43.3
45.1
22.3
27.1
62.4
42.4
41.6
16.6
32.9
33.3
42.1
35.0
31.1
50.9
13.5
27.6
23.1
44.3
29.2
46.1
48.5
39.3
20.4
40.1
46.7
32.1
52.4
54.8
46.0
44.9
45.4
48.6
37.7
57.8
14.0
12.5
23.3
56.3
19.7
32.4
30.2
37.6
39.0
26.4
36.2
37.1
19.1
22.9
40.6
34.9
34.2
15.3
29.3
27.7
33.6
26.7
17.7
36.0
9.5
15.3
18.2
22.5
23.3
27.6
26.7
19.5
13.3
38.9
30.5
23.2
44.1
43.4
39.0
37.7
34.8
42.3
33.3
47.9
2.3
2.4
4.3
9.2
3.9
1.1
8.9
20.8
1.3
5.7
8.8
8.7
4.8
3.4
5.7
7.8
4.8
2.7
5.2
3.7
2.6
3.5
2.2
4.6
1.5
0.9
3.5
3.3
4.0
3.0
6.3
2.5
2.1
6.6
4.3
3.2
13.9
17.0
22.3
10.6
12.4
10.2
7.5
43.9
2.0
2.0
3.7
8.2
3.5
1.1
8.2
17.0
1.3
5.3
7.7
7.7
4.0
3.1
5.2
6.6
4.4
2.4
4.6
3.4
2.4
3.3
2.0
4.1
1.3
0.9
3.0
2.9
3.5
2.7
5.2
2.2
1.8
5.7
3.9
2.8
12.3
13.8
21.0
9.5
10.8
9.0
6.8
43.7
ROE (%)
FY18E FY19E
15.9 19.7
16.4 16.5
20.2 17.0
10.9 12.5
24.3 20.8
14.7 17.4
18.1 17.9
14.1
14.9
15.0
10.9
17.9
3.4
20.4
50.6
2.1
16.7
21.8
19.4
21.6
13.0
9.1
20.0
12.1
17.5
16.9
11.0
6.2
10.1
7.3
9.4
11.5
3.5
16.4
7.7
14.4
6.6
13.7
6.5
10.8
17.6
9.7
9.8
26.9
34.0
49.9
25.4
29.0
23.6
20.7
76.5
15.2
17.5
15.8
14.5
18.0
3.3
28.3
49.8
3.3
20.8
22.6
20.8
21.0
14.1
12.9
20.6
13.4
16.4
16.8
12.2
7.4
12.6
12.0
12.0
14.5
6.0
17.8
13.8
15.9
10.3
21.3
12.0
14.6
15.7
13.5
12.3
29.6
35.2
55.5
26.7
33.2
22.6
21.4
91.4
Company
Reco
L&T Fin Holdings Buy
LIC Hsg Fin
Neutral
MAS Financial
Buy
M&M Fin.
Buy
Muthoot Fin
Neutral
PNB Housing
Buy
Repco Home
Buy
Shriram City
Buy
Union
Shriram Trans. Buy
Aggregate
Capital Goods
ABB
Sell
Bharat Elec.
Buy
BHEL
Sell
Blue Star
Neutral
CG Cons. Elec.
Buy
CG Power & Indu. Neutral
Cummins
Buy
GE T&D
Neutral
Havells
Buy
K E C Intl
Neutral
L&T
Buy
Siemens
Neutral
Solar Ind
Neutral
Thermax
Neutral
Va Tech Wab.
Buy
Voltas
Neutral
Aggregate
Cement
Ambuja Cem.
Neutral
ACC
Neutral
Birla Corp.
Buy
Dalmia Bharat
Buy
Grasim Inds.
Neutral
India Cem
Neutral
J K Cements
Buy
JK Lakshmi Ce
Buy
Ramco Cem
Buy
Orient Cem
Buy
Prism Cem
Buy
Sagar Cements Not Rated
Sanghi Inds.
Buy
Shree Cem
Buy
Ultratech
Buy
Aggregate
Consumer
Asian Paints
Neutral
Britannia
Buy
Colgate
Buy
Dabur
Buy
Emami
Buy
Godrej Cons.
Neutral
GSK Cons.
Neutral
HUL
Buy
1592
156
95
742
244
88
826
407
515
358
1329
1233
1035
1187
571
593
1230
210
80
780
305
90
1040
440
640
385
1650
1285
1100
1250
745
580
-23
34
-15
5
25
2
26
8
24
7
24
4
6
5
30
-2
19.0
7.1
3.0
16.6
5.1
1.4
23.2
9.4
11.4
16.1
49.0
19.8
24.4
28.6
34.5
18.0
28.3
7.9
2.9
24.6
6.5
2.3
31.3
11.2
13.9
18.7
58.1
30.4
29.6
34.7
37.2
20.2
34.1
8.4
4.0
31.2
7.7
3.0
37.1
14.0
17.2
24.1
69.3
34.6
36.7
39.0
41.9
23.0
259
1659
1002
2787
1109
161
1028
415
712
151
133
988
118
16971
4155
275
1781
1435
3328
1286
188
1343
470
847
179
130
-
157
22424
5131
6
7
43
19
16
17
31
13
19
18
-2
33
32
23
6.1
7.7
9.8
25.5 25.3 27.3
47.4 62.2 76.9 31.3 31.1 23.6
32.2 56.7 61.6 12.8 76.1 8.6
54.7 77.4 107.6 41.2 41.5 39.0
81.9 116.8 133.5 20.8 42.5 14.3
5.8
10.5 12.1
3.9 80.4 14.9
44.4 56.5 76.9 31.8 27.3 36.0
9.4
18.5 25.0 34.7 97.2 35.2
24.3 30.5 38.8 -10.8 25.3 27.2
3.3
5.5
10.3
LP
66.8 88.7
2.7
5.0
6.6 905.1 81.3 32.7
25.2 50.6 70.6
LP 101.0 39.7
5.8
8.9
12.0 102.0 53.5 34.6
423.0 435.8 724.2 10.0 3.0 66.2
89.0 136.2 178.4 -7.4 53.0 31.1
15.2 38.7 27.9
21.6 25.6 30.8
84.5 106.9 133.8
24.0 28.3 33.8
7.6
9.0
10.5
24.0 31.3 37.3
20.9 24.1 27.5
160.8 182.3 206.5
23.1 27.9 32.9
2.7
14.7
12.9
4.5
-9.6
10.6
3.0
17.6
18.8
26.4
17.9
19.2
30.5
15.1
13.4
20.7
20.2
25.2
19.7
16.2
19.1
14.2
13.2
18.1
1132
4635
1101
340
1089
1017
6063
1335
1270
6098
1365
415
1505
1065
5785
1585
12
32
24
22
38
5
-5
19
12 February 2018
48

Click excel icon
for detailed
valuation guide
CMP
Reco
(INR)
Neutral
271
Neutral
353
Neutral
298
Neutral
6959
Buy
21324
Neutral
298
Buy
878
Neutral
9286
Not Rated 187
Buy
1066
Neutral
3189
TP % Upside
(INR) Downside
278
2
380
8
355
19
8173
17
28270
33
314
6
1050
20
9303
0
-
1380
29
3515
10
EPS (INR)
EPS Gr. YoY (%)
FY18E FY19E FY20E FY18E FY19E FY20E
9.0
10.2 11.4
6.6 13.7 12.4
8.1
10.7 13.3 -27.7 32.0 24.2
6.2
7.7
9.3
-1.2 24.3 20.2
128.6 146.9 177.7 4.0 14.2 20.9
297.1 414.8 547.0 24.5 39.6 31.9
8.9
12.4 16.8 147.7 38.7 35.6
17.7 20.8 24.1
5.7 17.8 15.5
142.1 171.3 200.8 6.9 20.5 17.3
3.5
6.4
9.7
-2.0 83.8 52.1
14.1 17.4 22.9 62.0 23.9 31.2
32.9 57.0 78.7 22.9 73.4 38.1
8.5 18.7 17.2
23.9 25.3 30.1 10.8 5.9 19.0
68.0 89.5 109.1 -8.9 31.7 21.9
54.0 65.8 81.4 -5.8 21.9 23.6
43.4 48.7 53.6 10.4 12.2 10.1
7.6
10.9 19.8 -25.3 43.1 81.5
16.8 21.0 24.4 18.5 25.0 15.8
21.6 27.0 33.0 35.7 25.3 22.0
32.9 44.0 52.7 -17.7 33.9 19.7
68.9 113.2 145.0 -5.1 64.2 28.0
1.9
4.9
8.4 -81.8 160.8 71.9
37.9 42.8 50.5 -3.4 12.9 18.0
6.8
9.0
13.0 -5.4 31.1 45.1
49.1 54.9 61.1 42.9 11.9 11.2
21.4 29.2 37.3 33.2 36.6 27.7
47.8 62.6 72.5 29.5 30.9 15.8
19.0 29.1 35.7
7.0 52.7 22.8
31.5 40.2 54.1 -44.4 27.7 34.6
140.1 157.4 180.5 8.5 12.4 14.7
18.1 29.9 37.8 29.3 65.1 26.2
36.3 62.5 77.9 12.6 71.9 24.7
14.5 22.1 27.5 -44.5 52.0 24.6
37.3 61.3 78.5 -32.3 64.2 28.0
-15.8 33.9 23.8
5.3
25.4
13.3
14.2
9.5
24.6
14.5
14.6
19.1
21.3
16.0
17.0
LP
24.8
11.5
29.3
Valuation snapshot
P/E (x)
FY18E FY19E
30.3 26.7
43.5 33.0
48.0 38.6
54.1 47.4
71.8 51.4
33.3 24.0
49.6 42.1
65.4 54.2
53.7 29.2
75.8 61.2
97.1 56.0
45.2 38.0
22.7
32.1
26.2
13.6
79.6
24.4
28.8
30.9
31.8
78.8
14.1
17.4
49.9
29.0
19.7
27.1
26.1
33.7
28.6
20.3
40.1
38.3
29.3
21.5
24.4
21.5
12.1
55.7
19.5
23.0
23.1
19.4
30.2
12.5
13.2
44.6
21.2
15.0
17.7
20.4
30.0
17.3
11.8
26.4
23.3
21.9
25.6
9.0
21.4
27.0
15.7
14.5
25.8
11.7
22.4
P/B (x)
FY18E FY19E
6.6
6.1
6.1
6.0
14.6 13.8
20.1 18.2
28.6 22.9
3.4
3.0
11.6 9.9
36.7 30.7
2.6
2.4
10.6 9.2
16.8 12.5
12.1 10.9
4.6
5.1
6.3
2.9
7.1
5.1
3.6
5.2
2.8
1.2
2.8
2.2
11.9
2.9
3.6
3.6
2.6
5.8
3.9
2.2
3.6
5.1
3.7
2.4
1.3
4.1
3.6
2.1
2.4
3.4
2.2
3.2
3.9
4.4
5.1
2.4
6.5
4.2
3.1
4.6
2.5
1.1
2.3
1.9
13.6
2.6
2.9
3.0
2.3
5.3
3.2
1.9
3.3
4.5
3.3
2.2
1.1
3.4
3.2
1.9
2.1
3.2
2.0
3.0
ROE (%)
FY18E FY19E
22.8 23.8
13.8 18.3
32.3 36.8
39.1 40.4
39.9 44.5
10.8 13.3
25.2 25.4
61.2 61.8
4.9
8.5
14.9 16.2
17.3 22.3
26.8 28.7
21.8
17.0
26.4
24.0
8.9
22.7
12.3
16.6
9.2
1.6
19.6
14.2
23.9
10.5
19.7
14.1
10.2
17.2
14.7
11.4
9.3
13.9
12.7
5.5
15.5
19.1
13.7
13.0
14.1
11.2
9.2
11.1
19.7
19.4
25.7
21.7
11.6
23.7
13.6
21.2
13.7
3.9
18.4
15.4
30.5
13.0
21.4
18.3
12.0
17.7
20.5
17.0
13.2
20.4
15.1
8.9
13.4
17.5
12.6
12.2
15.4
12.9
18.2
13.2
Company
ITC
Jyothy Lab
Marico
Nestle
Page Inds
Parag Milk
Pidilite Ind.
P&G Hygiene
Prabhat Dairy
United Brew
United Spirits
Aggregate
Healthcare
Alembic Phar
Alkem Lab
Ajanta Pharma
Aurobindo
Biocon
Cadila
Cipla
Divis Lab
Dr Reddy’s
Fortis Health
Glenmark
Granules
GSK Pharma
IPCA Labs
Jubilant Life
Laurus Labs
Lupin
Sanofi India
Shilpa Medicare
Strides Shasun
Sun Pharma
Torrent Pharma
Aggregate
Infrastructure
Ashoka Buildcon
IRB Infra
KNR
Constructions
Sadbhav
Engineering
Aggregate
Logistics
Allcargo Logistics
Concor
Gateway
Distriparks
Aggregate
Media
Dish TV
D B Corp
Den Net.
Ent.Network
Neutral
Buy
Buy
Buy
Neutral
Buy
Neutral
Neutral
Neutral
Buy
Neutral
Buy
Neutral
Buy
Buy
Buy
Buy
Buy
Buy
Buy
Buy
Neutral
544
2182
1415
590
607
411
622
1017
2195
148
535
119
2451
620
942
515
821
4722
518
739
583
1431
555
2500
1840
820
600
500
600
1100
2575
185
650
200
2500
750
1110
631
940
5000
797
1074
610
1400
2
15
30
39
-1
22
-4
8
17
25
21
68
2
21
18
22
15
6
54
45
5
-2
Buy
Neutral
Buy
Buy
243
222
310
395
290
250
325
445
19
13
5
13
79.9 101.0 46.0
-3.0 -13.6 8.7
9.0
3.5
10.0
16.4
23.3
27.9
16.5
Buy
Neutral
Buy
192
1320
215
242
1469
282
26
11
31
10.9
41.9
8.8
13.3
51.2
18.4
15.3
58.2
21.3
10.7
10.3
22.0
22.3
15.5
13.5
17.6
31.5
24.4
28.8
29.6 109.2 15.3
11.5
28.2
14.1
Buy
Buy
Neutral
Buy
74
320
109
694
101
420
90
820
36
31
-17
18
-0.5
18.8
-2.9
8.3
1.6
23.0
0.1
16.4
3.4
27.6
4.0
28.7
PL
-7.6
Loss
-27.7
LP 109.9 NM 46.2 18.4
22.0 20.1 17.0 13.9
3.2
LP 5,545.2 NM 1,532.9 2.5
98.0 75.7 84.0 42.4
3.7
13.1 -11.9 33.2
2.7 20.1 20.9
2.5 -6.3 0.2
3.4
4.5
8.4
12 February 2018
49

Click excel icon
for detailed
valuation guide
CMP
(INR)
37
242
95
170
354
1398
104
20
973
581
TP % Upside
(INR) Downside
47
27
305
26
117
23
215
27
469
33
1760
26
148
43
27
37
1155
19
705
21
Valuation snapshot
ROE (%)
FY18E FY19E
-1.2 5.2
15.1 14.6
11.5 10.6
15.3 18.4
8.2 12.2
10.2 15.3
15.9 24.7
-15.8 2.4
26.4 30.7
18.2 20.0
14.1 17.6
14.0
30.8
-3.6
20.2
8.6
19.1
-1.0
25.2
14.1
18.0
12.2
24.0
11.2
16.1
14.6
24.5
17.5
20.8
28.0
20.2
8.0
10.9
23.9
12.9
13.2
22.5
16.9
23.4
19.2
17.4
25.1
26.9
24.3
14.3
32.1
19.9
15.3
16.1
17.8
36.0
16.8
42.7
2.3
19.5
9.2
17.2
5.4
29.7
23.1
21.0
16.7
25.4
12.4
22.0
13.6
25.1
15.4
20.8
24.4
16.2
10.5
12.8
22.9
13.1
13.8
29.8
18.4
25.9
22.2
17.8
23.9
25.8
23.1
13.8
29.0
24.0
18.7
17.6
21.0
33.8
Company
Hathway Cable
Hind. Media
HT Media
Jagran Prak.
Music Broadcast
PVR
Prime Focus
Siti Net.
Sun TV
Zee Ent.
Aggregate
Metals
Hindalco
Hind. Zinc
JSPL
JSW Steel
Nalco
NMDC
SAIL
Rain Industries
Vedanta
Tata Steel
Aggregate
Oil & Gas
BPCL
GAIL
Gujarat Gas
Gujarat St. Pet.
HPCL
IOC
IGL
Mahanagar Gas
MRPL
Oil India
ONGC
PLNG
Reliance Ind.
Aggregate
Retail
Jubilant Food
PC Jeweller
Titan Co.
Aggregate
Technology
Cyient
HCL Tech.
Hexaware
Infosys
KPIT Tech
L&T Infotech
Mindtree
Mphasis
NIIT Tech
Persistent Sys
Tata Elxsi
Reco
Buy
Buy
Neutral
Buy
Buy
Buy
Buy
Neutral
Buy
Buy
EPS (INR)
EPS Gr. YoY (%)
P/E (x)
P/B (x)
FY18E FY19E FY20E FY18E FY19E FY20E FY18E FY19E FY18E FY19E
-0.2
0.8
2.0
Loss
LP 161.9 NM 48.8
2.6
2.5
25.9 28.8 32.4
0.2 11.3 12.6 9.4
8.4
1.3
1.2
11.8 12.1 12.7 59.3 2.6
4.9
8.1
7.9
0.9
0.8
9.9
12.5 15.2 -6.9 26.4 21.5 17.1 13.6
2.7
2.3
8.2
13.5 17.8 27.8 64.9 31.4 43.1 26.1
3.4
3.0
22.1 37.3 51.5
7.8 68.7 37.9 63.2 37.4
6.2
5.3
3.2
6.1
9.2 164.0 90.5 49.1 32.1 16.9
4.7
3.7
-0.9
0.1
0.6
Loss
LP 411.6 NM 155.6 3.8
3.7
28.1 35.7 41.8 13.0 27.0 17.3 34.6 27.3
8.8
8.0
13.7 17.6 21.0
2.1 28.7 19.3 42.5 33.0
7.2
6.1
13.3 42.4 27.7 38.8 27.3 5.5
4.8
19.5
21.6
-11.5
20.7
4.6
14.3
-0.9
25.5
23.8
62.7
27.0
33.3
7.3
24.0
5.3
14.0
4.8
38.9
42.7
85.3
27.9
32.1
11.9
23.7
5.4
14.7
6.8
43.0
44.5
67.2
127.9
9.6
Loss
39.8
24.8
43.7
Loss
165.2
57.4
65.0
68.1
-15.3
15.8
28.2
40.1
-12.8
-3.9
7.4
27.0
-15.0
-11.7
16.7
24.3
19.6
7.1
186.2
44.4
38.8
48.6
18.1
3.1
21.2
2.6
0.8
18.5
31.5
12.9
17.4
14.4
30.8
38.6
54.6
LP
15.9
13.1
-2.0
LP
52.3
79.4
36.0
55.4
25.0
19.3
59.6
4.1
20.2
-1.5
17.2
-3.6
-7.7
37.7
21.8
13.4
11.8
13.7
29.6
26.6
27.0
27.2
12.1
3.8
10.9
9.7
10.5
13.7
24.6
14.8
16.9
22.8
18.4
3.0
-3.8
63.4
-1.0
2.4
4.7
40.4
10.7
4.2
-21.2
0.2
5.8
4.9
28.7
8.3
6.2
4.5
13.2
1.2
5.0
3.3
-3.1
17.9
13.7
6.3
31.3
27.6
24.1
26.0
13.2
7.5
13.4
11.2
29.1
15.2
17.2
8.3
16.2
14.3
18.2
12.5
14.1
NM
14.9
15.9
9.5
NM
15.3
13.3
10.9
14.7
11.6
17.7
41.6
16.4
11.1
9.4
30.7
17.4
9.4
12.0
9.8
17.5
14.9
12.6
66.0
24.0
63.6
51.7
17.4
15.6
20.6
17.3
17.9
21.0
21.9
20.4
18.6
18.4
27.2
9.0
9.1
37.5
12.9
14.0
9.7
19.5
10.1
7.4
8.0
9.4
9.3
14.9
26.1
15.8
9.3
9.6
26.2
18.1
10.2
8.7
8.0
15.4
13.3
11.0
50.9
18.9
50.1
40.7
15.5
15.0
18.6
15.7
16.2
18.5
17.6
17.8
15.9
15.0
22.9
1.6
4.5
0.9
2.8
1.3
1.7
1.1
3.5
1.8
1.9
1.8
2.6
1.9
6.3
2.3
2.5
1.6
5.9
4.6
1.8
0.9
1.0
3.9
1.8
1.7
14.9
3.8
13.5
9.9
3.0
3.8
5.2
4.0
2.4
6.0
4.5
3.5
3.0
3.1
8.7
1.4
3.4
0.8
2.3
1.3
1.6
1.0
2.6
1.6
1.5
1.6
2.2
1.8
5.3
2.0
2.1
1.4
5.0
4.2
1.6
0.9
1.0
3.3
1.7
1.5
15.2
3.2
12.5
9.0
2.7
3.4
4.5
3.5
2.1
4.8
4.0
3.2
2.6
3.0
7.0
Buy
Neutral
Buy
Buy
Neutral
Buy
Sell
Buy
Buy
Neutral
243
304
272
309
74
136
94
392
316
684
344
354
361
339
81
215
75
492
416
858
41
17
33
10
10
58
-20
26
32
26
Buy
Sell
Buy
Neutral
Buy
Buy
Buy
Buy
Neutral
Buy
Buy
Buy
Buy
475
463
856
203
395
379
290
974
118
356
188
247
898
632
371
1014
188
576
533
416
1228
114
420
234
318
1069
33
-20
18
-7
46
41
44
26
-4
18
25
29
19
40.9
26.1
20.6
12.3
35.5
40.2
9.4
55.9
12.6
29.8
19.2
14.1
60.4
51.2
31.2
32.9
12.8
42.7
39.6
11.1
53.9
11.6
41.0
23.4
16.0
67.5
54.1
32.7
42.3
13.9
45.3
41.4
12.5
54.6
12.2
42.3
22.6
18.9
76.8
Neutral
Buy
Buy
2002
370
797
2185
685
990
9
85
24
30.3
15.4
12.5
39.3
19.5
15.9
51.6
24.9
19.8
Buy
Neutral
Neutral
Buy
Neutral
Buy
Buy
Neutral
Neutral
Buy
Buy
628
963
341
1112
215
1381
717
896
830
793
1000
675
950
340
1250
219
1400
725
800
800
900
1236
7
-1
0
12
2
1
1
-11
-4
13
24
36.2
61.7
16.6
64.4
12.0
65.7
32.7
43.9
44.6
43.1
36.8
40.6
64.1
18.4
70.7
13.3
74.7
40.8
50.4
52.2
53.0
43.6
45.9
68.9
20.9
78.6
17.2
86.1
47.8
54.6
60.6
60.5
51.5
12 February 2018
50

Click excel icon
for detailed
valuation guide
CMP
(INR)
2972
596
285
930
TP % Upside
(INR) Downside
2700
-9
700
17
300
5
1100
18
EPS (INR)
EPS Gr. YoY (%)
FY18E FY19E FY20E FY18E FY19E FY20E
130.6 147.3 161.0 -2.1 12.8 9.3
39.2 40.9 47.7 26.8 4.5 16.6
17.9 18.5 21.2
6.0
3.2 14.7
54.2 64.1 85.2
4.0 18.3 33.1
4.2
5.1 11.1
3.5
3.9
7.2
14.0 16.2 17.8
-11.9 -12.9 -11.7
1.3
13.2 27.1
Valuation snapshot
P/E (x)
P/B (x)
FY18E FY19E FY18E FY19E
22.8 20.2
7.1
6.2
15.2 14.6
3.0
2.6
15.9 15.4
2.8
2.4
17.2 14.5
2.5
2.2
19.0 18.1 4.8
4.2
2.5
4.3
1.4
13.3
2.7
7.3
1.2
1.3
1.0
1.3
1.8
1.8
2.0
2.7
16.7
6.2
1.7
19.0
4.6
5.9
8.2
7.2
2.0
7.3
3.4
3.7
2.8
7.4
4.2
2.5
5.2
5.7
2.4
3.1
4.6
8.2
1.2
8.8
11.9
ROE (%)
FY18E FY19E
30.4 32.9
20.6 19.5
17.2 16.7
15.7 16.4
25.0 23.1
Company
TCS
Tech Mah
Wipro
Zensar Tech
Aggregate
Telecom
Bharti Airtel
Bharti Infratel
Idea Cellular
Tata Comm
Aggregate
Reco
Neutral
Buy
Neutral
Buy
Buy
Neutral
Buy
Buy
422
341
84
639
680
380
110
780
61
11
31
22
-68.7 12.2 84.4 121.2 108.0
-6.1 16.5 9.7 24.5 21.0
Loss Loss Loss NM
NM
-86.4 881.5 105.3 474.0 48.3
-
PL
Loss
LP -439.4
2,209.4
16.2
8.4
10.7
18.2
9.5
4.6
3.1
11.4
34.1
33.4
16.6
8.6
4.3
4.5
34.0
24.1
44.4
15.8
27.1
17.4
35.6
18.5
18.4
17.6
-3.5
27.3
16.4
27.1
32.1
17.7
47.9
25.8
15.4
12.1
16.3
11.3
19.3
12.0
12.7
11.5
11.5
13.6
35.1
93.6
45.0
19.7
28.0
22.1
59.1
32.7
19.7
13.0
55.4
14.0
44.8
34.7
23.9
18.6
33.5
42.3
27.6
31.8
22.6
35.6
50.6
10.2
51.0
48.6
11.2
10.6
22.8
9.2
11.0
9.5
10.3
10.8
28.4
68.2
37.2
18.1
29.8
18.3
42.0
22.9
16.5
9.8
49.2
11.6
30.4
24.6
19.8
14.5
9.5
28.6
22.9
22.7
18.2
27.0
36.8
7.9
39.9
36.6
2.4
2.1
2.3
4.3 17.0 20.4
1.8 -19.4 -24.4
10.4 2.6 24.3
2.8
6.8
1.1
1.2
1.0
1.2
1.6
1.5
1.9
2.6
14.3
5.5
1.3
17.9
4.0
5.3
6.6
6.7
1.6
6.6
3.0
3.4
2.6
6.4
3.6
2.1
4.2
4.8
2.2
2.7
4.1
6.7
1.1
7.8
9.5
-0.6
44.6
10.6
6.7
8.4
10.5
16.5
16.2
14.8
8.0
19.0
14.6
8.5
69.1
22.5
12.6
27.1
46.8
17.0
13.7
23.3
7.4
7.9
32.5
23.9
7.8
21.7
22.6
8.9
14.1
13.4
17.7
12.6
18.0
26.9
-0.1
60.8
10.4
5.5
10.8
11.3
17.5
15.9
17.3
9.4
22.6
15.7
7.4
61.8
23.4
13.2
32.0
42.1
18.5
14.0
27.4
11.8
11.0
34.5
26.9
24.2
21.0
22.9
10.2
15.9
16.0
20.1
14.5
20.7
28.8
Utiltites
Coal India
Buy
CESC
Buy
JSW Energy
Sell
NHPC
Buy
NTPC
Buy
Power Grid
Buy
Tata Power
Sell
Aggregate
Others
Arvind
Neutral
Avenue
Sell
Supermarts
Bata India
Sell
BSE
Neutral
Castrol India
Buy
Coromandel Intl Buy
Delta Corp
Buy
Eveready Inds. Buy
Interglobe
Neutral
Indo Count
Neutral
Info Edge
Buy
Kaveri Seed
Buy
Manpasand
Buy
MCX
Buy
Monsanto
Buy
Navneet
Buy
Education
Oberoi Realty
Buy
Quess Corp
Buy
PI Inds.
Buy
Piramal Enterp. Buy
SRF
Buy
S H Kelkar
Buy
Team Lease Serv. Buy
Trident
Buy
TTK Prestige
Neutral
V-Guard
Neutral
300
1006
82
29
163
193
85
356
1408
61
37
210
282
73
18
40
-26
29
29
46
-14
18.5
88.8
4.3
2.4
12.9
16.9
7.4
26.8
95.2
3.6
3.1
14.8
20.4
8.3
31.1 23.7 45.0
103.2 71.1 7.3
4.0
11.4 -15.4
3.7 -19.3 30.3
16.2
7.5 15.1
21.3 20.7 20.9
8.5
-0.5 12.2
14.4 26.5
18.8
23.0
-8.4
63.6
23.8
37.4
21.0
8.7
-5.9
20.4
40.7
42.5
19.3
32.9
12.5
20.2
47.2
41.1
20.6
28.4
399
1175
716
825
196
533
350
384
1260
105
1293
478
402
723
2506
141
457
935
810
2640
1873
281
2191
73
7034
218
402
920
578
950
242
523
382
458
1307
128
1550
738
467
1100
3293
194
608
1300
988
3500
2040
343
2700
114
5281
167
1
-22
-19
15
23
-2
9
19
4
22
20
55
16
52
31
38
33
39
22
33
9
22
23
56
-25
-23
11.3
12.6
14.1
17.2
15.9 19.3 22.4 17.8
41.8 45.5 49.4
2.0
7.0
6.6
6.9
2.9
24.1 29.0 30.3 45.1
5.9
8.3
11.2 93.7
11.7 16.7 20.8 -8.7
64.0 76.4 110.4 48.2
8.0
10.7 12.4 -38.2
23.4 26.3 33.4 49.0
34.1 41.0 48.1 78.9
9.0
13.2 17.9 41.6
20.8 29.4 34.9 -16.0
105.0 126.6 149.9 21.9
7.6
9.7
11.4
3.6
13.6 48.2 46.5 22.3 253.5
22.1 32.7 41.6 124.2 47.7
29.3 35.4 41.2 -12.2 20.6
83.1 116.4 147.9 14.5 40.0
82.9 103.0 136.0 -3.5 24.2
7.9
10.4 12.2
9.1 31.6
43.3 59.6 88.1 11.6 37.5
7.2
9.2
11.6
8.4 28.1
137.8 176.1 203.2 4.4 27.8
4.5
6.0
6.7
25.3 32.9
12 February 2018
51

MOSL Universe stock performance
Company
Automobiles
Amara Raja
Ashok Ley.
Bajaj Auto
Bharat Forge
Bosch
CEAT
Eicher Mot.
Endurance Tech.
Escorts
Exide Ind
Hero Moto
M&M
Mahindra CIE
Maruti Suzuki
Motherson Sumi
Tata Motors
TVS Motor
Banks - Private
AU Small Fin. Bank
Axis Bank
DCB Bank
Equitas Hold.
Federal Bank
HDFC Bank
ICICI Bank
IDFC Bank
IndusInd
J&K Bank
Kotak Mah. Bk
RBL Bank
South Indian
Yes Bank
Banks - PSU
BOB
BOI
Canara
Indian Bk
PNB
SBI
Union Bk
NBFCs
Aditya Birla Cap
Bajaj Fin.
Capital First
Cholaman.Inv.&Fn
Dewan Hsg.
GRUH Fin.
HDFC
HDFC Stand. Life
Indiabulls Hsg
L&T Fin.Holdings
LIC Hsg Fin
M&M Fin.
Muthoot Fin
1 Day (%)
-1.5
0.1
-1.6
0.2
-0.3
1.6
-1.3
-3.3
0.6
-0.9
-1.1
-0.5
-0.9
-0.9
-1.2
-1.5
-0.3
-1.5
-1.9
1.4
-1.1
0.7
-1.5
-2.3
-0.2
-1.1
-0.3
-1.7
-0.6
-0.5
-2.8
0.2
-0.1
-0.5
-0.3
-1.6
-1.7
0.7
-0.3
-1.1
-0.3
0.4
0.1
4.2
-2.1
-0.2
-1.8
0.2
-0.8
-1.0
-2.5
1M (%)
-7.0
2.9
-4.2
3.8
-1.6
-22.6
-3.0
-13.6
14.9
-7.5
-5.5
-1.4
-14.6
-4.7
-6.1
-15.4
-14.0
-15.0
-1.4
-16.5
-11.3
-17.1
-0.6
4.7
-15.3
-4.2
-13.6
2.6
-10.6
-16.9
-4.6
-4.8
-16.2
-11.6
-10.4
-10.3
-2.6
-12.7
-8.9
-9.8
-12.0
-1.2
-17.7
4.5
2.2
0.9
6.1
-10.7
-11.6
-8.2
-10.4
12M (%)
-9.3
41.0
11.4
49.9
-15.1
35.4
16.3
84.9
131.9
0.3
8.6
16.1
9.8
45.3
54.8
-28.0
62.7
Company
MAS Financial Serv.
PNB Housing
Repco Home
Shriram City Union
Shriram Trans.
Capital Goods
ABB
Bharat Elec.
BHEL
Blue Star
CG Cons. Elec.
CG Power & Inds Sol.
Cummins
GE T&D
Havells
K E C Intl
L&T
Siemens
Solar Ind
Thermax
Va Tech Wab.
Voltas
Cement
Ambuja Cem.
ACC
Birla Corp.
Dalmia Bharat
Grasim Inds.
India Cem
J K Cements
JK Lakshmi Ce
Ramco Cem
Orient Cem
Prism Cem
Sagar Cements
Sanghi Inds.
Shree Cem
Ultratech
Consumer
Asian Paints
Britannia
Colgate
Dabur
Emami
Godrej Cons.
GSK Cons.
HUL
ITC
Jyothy Lab
Marico
Nestle
Page Inds
Parag Milk
Pidilite Ind.
P&G Hygiene
1 Day (%)
2.0
-1.0
-0.3
-2.2
-1.9
-0.4
-0.4
-0.9
2.4
0.5
0.1
-1.7
-1.6
-1.2
0.7
-1.3
0.5
-1.4
-0.9
-0.2
-1.1
-1.2
-1.9
-0.9
-0.3
0.0
0.0
-1.0
-0.7
-2.1
-3.7
-0.5
0.7
-3.7
-0.1
-0.1
0.7
0.2
0.0
0.1
-2.4
-0.2
-2.5
0.2
-0.9
-0.1
-0.7
-0.5
3.3
2.4
-0.8
0.0
1M (%)
-1.2
-8.8
-17.2
-9.3
-13.5
11.9
-14.3
-6.5
-7.9
-11.7
-6.3
-11.8
-9.0
-6.8
-7.6
-0.3
-5.1
-12.0
-10.1
-8.7
-8.5
-6.6
-8.5
-17.8
-12.7
-10.3
-16.1
-10.6
-6.4
-11.2
-13.5
-1.3
-8.5
-14.5
-12.6
-5.9
-5.1
0.0
-1.5
-5.2
-17.6
2.9
-4.1
-2.1
0.3
-5.8
-8.0
-10.7
-11.9
0.9
-4.1
-0.4
12M (%)
15.2
-18.9
-1.2
37.6
29.9
10.0
-9.5
33.5
22.7
22.3
-8.9
33.5
17.2
115.6
33.9
0.9
43.5
38.1
16.8
73.0
8.4
11.6
38.0
43.6
36.8
-0.6
22.6
9.0
4.9
11.3
34.9
27.7
89.5
6.1
10.6
13.1
43.5
24.6
28.2
-4.4
30.0
18.0
57.1
-2.2
-0.5
11.5
12.7
49.9
4.4
32.4
38.0
15.0
23.8
-23.9
13.7
42.6
26.1
-14.7
26.6
3.5
34.1
22.5
32.0
15.7
-15.2
4.2
6.9
11.7
8.3
7.4
-17.9
57.4
1.5
29.0
69.9
47.8
26.7
57.1
52.7
-8.4
47.3
23.9
12 February 2018
52

MOSL Universe stock performance
Company
Prabhat Dairy
United Brew
United Spirits
Healthcare
Alembic Phar
Alkem Lab
Ajanta Pharma
Aurobindo
Biocon
Cadila
Cipla
Divis Lab
Dr Reddy’s
Fortis Health
Glenmark
Granules
GSK Pharma
IPCA Labs
Jubilant Life
Lupin
Laurus Labs
Sanofi India
Shilpa Medicare
Strides Shasun
Sun Pharma
Torrent Pharma
Infrastructure
Ashoka Buildcon
IRB Infra.Devl.
KNR Construct.
Sadbhav Engg.
Logistics
Allcargo Logistics
Concor
Gateway Distriparks
Media
Dish TV
D B Corp
Den Net.
Ent.Network
Hathway Cab.
Hind. Media
HT Media
Jagran Prak.
Music Broadcast
PVR
Prime Focus
Siti Net.
Sun TV
Zee Ent.
Metals
Hindalco
Hind. Zinc
JSPL
JSW Steel
1 Day (%)
-3.1
0.7
1.1
-0.8
0.2
1.1
-2.0
-1.3
1.6
1.3
-1.2
0.7
17.6
-7.4
0.2
0.0
4.1
-2.9
0.8
1.5
-0.5
-0.2
3.5
-0.1
4.3
3.9
-0.7
1.2
-2.3
-0.4
-1.7
-1.7
0.3
-2.7
-3.2
-0.3
-4.5
0.2
-1.7
0.1
-1.9
-1.1
0.8
-1.8
-3.3
-0.4
-1.0
5.4
2.3
1.5
1M (%)
-19.6
-7.2
-17.0
-2.4
-1.7
-6.1
-12.3
11.2
-7.5
1.4
-6.7
-10.7
-10.2
-11.1
-14.6
-1.2
7.1
19.9
-10.9
-7.1
-1.5
-13.9
-10.8
-0.7
1.4
-1.0
-10.0
0.8
-2.8
-14.0
-4.1
-10.2
-14.1
-14.4
0.6
-11.7
-5.6
-5.3
-11.6
-10.2
-20.1
-5.9
-11.7
-21.6
-5.8
0.1
-10.4
-4.1
9.6
9.2
12M (%)
37.9
32.5
41.3
-2.7
20.5
-21.4
-16.5
67.0
12.3
5.9
34.6
-27.3
-23.8
-44.1
-9.3
-10.3
17.8
31.4
-45.1
-7.9
14.2
-27.4
-38.7
-11.3
13.9
24.3
-6.3
68.8
42.8
14.1
25.7
-21.0
-15.5
-16.3
24.0
-14.6
1.4
-12.3
14.3
-9.4
9.0
22.6
-49.7
31.7
11.6
32.4
4.4
196.6
59.8
Company
Nalco
NMDC
Rain Industries
SAIL
Vedanta
Tata Steel
Oil & Gas
BPCL
GAIL
Gujarat Gas
Gujarat St. Pet.
HPCL
IOC
IGL
Mahanagar Gas
MRPL
Oil India
ONGC
PLNG
Reliance Ind.
Retail
Jubilant Food
PC Jeweller
Titan Co.
Technology
Cyient
HCL Tech.
Hexaware
Infosys
KPIT Tech
L&T Infotech
Mindtree
Mphasis
NIIT Tech
Persistent Sys
Tata Elxsi
TCS
Tech Mah
Wipro
Zensar Tech
Telecom
Bharti Airtel
Bharti Infratel
Idea Cellular
Tata Comm
Utiltites
Coal India
CESC
JSW Energy
NHPC Ltd
NTPC
Power Grid
Tata Power
1 Day (%)
2.5
1.6
2.2
9.1
0.8
1.8
-0.7
0.2
0.6
-2.1
-1.3
-1.7
-0.3
-0.6
0.2
-2.0
-0.4
-0.6
-0.6
-0.1
-3.2
-0.4
0.6
1.9
1.2
-2.0
-2.3
0.5
-2.1
2.7
0.2
-0.1
0.5
0.2
-2.0
-1.6
-1.0
-1.8
-2.5
-2.1
3.0
0.1
1.4
-0.4
0.0
-0.3
-0.2
0.0
1M (%)
-13.1
-12.3
-14.7
-4.0
-6.4
-6.1
-4.3
-7.4
-2.2
-7.2
-5.3
-3.3
-10.4
-11.7
-10.5
-5.6
-4.6
-2.4
-4.6
4.3
-30.5
-14.5
7.5
7.5
-5.4
6.8
6.5
23.1
14.6
25.8
20.4
6.9
-0.4
9.7
12.1
-10.3
4.0
-17.3
-7.2
-22.8
-6.2
-1.2
-10.4
-7.8
-12.4
-7.4
-3.7
-13.7
12M (%)
8.1
-8.0
402.8
42.6
26.8
57.7
0.6
25.9
39.4
22.8
3.1
-2.1
41.2
5.4
7.3
3.2
-2.7
31.0
73.9
100.0
86.6
86.7
34.9
17.5
68.8
17.3
61.4
100.9
57.4
58.6
95.4
29.1
33.4
27.9
22.9
22.7
2.8
18.6
7.0
-23.9
-17.4
-6.8
21.6
30.2
-7.0
-3.1
-4.4
4.4
12 February 2018
53

MOSL Universe stock performance
Company
Others
Arvind
Avenue Super.
Bata India
BSE
Castrol India
Coromandel Intl
Delta Corp
Eveready Inds.
Interglobe
Indo Count
Info Edge
Kaveri Seed
Manpasand
MCX
Monsanto
Navneet Educat.
Oberoi Realty
PI Inds.
Piramal Enterp.
Quess Corp
SRF
S H Kelkar
Team Lease Serv.
Trident
V-Guard
1 Day (%)
-1.0
0.7
0.6
-1.0
0.5
-2.4
4.4
0.4
0.3
-1.4
5.0
0.8
-1.0
-2.3
0.4
2.0
-4.3
-1.2
-2.5
-3.1
1.5
-0.7
-0.9
-1.2
-0.3
1M (%)
-14.4
-4.6
-4.2
-12.8
2.2
-7.5
14.2
-13.8
2.6
-16.6
-5.4
-10.3
-15.4
-23.1
-4.6
-11.3
-9.7
-19.8
-8.1
-13.8
-3.9
-2.1
-7.2
-20.3
-8.5
12M (%)
4.9
40.8
-18.3
-5.7
55.8
169.3
54.6
48.9
-42.5
56.0
0.2
15.5
-34.6
8.4
-0.8
40.0
-8.0
49.8
38.6
7.3
-11.4
143.9
2.4
41.2
12 February 2018
54

THEMATIC/STRATEGY RESEARCH GALLERY

REPORT GALLERY
RECENT INITIATING COVERAGE REPORTS
Rs

DIFFERENTIATED PRODUCT GALLERY