14 February 2018
Market snapshot
Equities - India
Close
Chg .%
Sensex
34,300
0.9
Nifty-50
10,540
0.8
Nifty-M 100
20,150
1.4
Equities-Global
Close
Chg .%
S&P 500
2,663
0.3
Nasdaq
7,014
0.5
FTSE 100
7,168
-0.1
DAX
12,197
-0.7
Hang Seng
12,005
0.9
Nikkei 225
21,245
-0.6
Commodities
Close
Chg .%
Brent (US$/Bbl)
62
-0.1
Gold ($/OZ)
1,330
0.5
Cu (US$/MT)
6,945
2.3
Almn (US$/MT)
2,132
0.5
Currency
Close
Chg .%
USD/INR
64.3
-0.1
USD/EUR
1.2
0.3
USD/JPY
108.7
-0.1
YIELD (%)
Close
1MChg
10 Yrs G-Sec
7.5
0.01
10 Yrs AAA Corp
8.1
0.01
Flows (USD b)
12-Feb
MTD
FIIs
-0.1
-0.9
DIIs
0.2
1.3
Volumes (INRb)
12-Feb
MTD*
Cash
356
421
F&O
4,417
8,614
Note: YTD is calendar year, *Avg
YTD.%
0.7
0.1
-4.7
YTD.%
-0.4
1.6
-6.8
-5.6
2.5
-6.7
YTD.%
-6.7
2.0
-3.6
-5.5
YTD.%
0.7
2.4
-3.6
YTDchg
0.2
0.2
YTD
1.3
1.1
YTD*
425
7,634
Today’s top research idea
Sun TV - Revenue growth set to take off
Digitization gains accruing, finally
Subscription revenues are likely to grow at 16% CAGR over FY18-20, led by
digitization in Tamil Nadu. There is further upside driven by higher market
share of DTH players, growth in MSO-led subscription revenue following TRAI’s
tariff order, rising HD penetration and ARPU increase.
Higher viewership led by content rejig, shift to commission model should help
capitalize on potential ad revenue growth. Given the low base of FY17, we
expect 14% CAGR over FY18-20.
Near doubling of IPL revenue to INR2.8b bodes well. Moderate movie
investments should lead RoCE to reach ~33% by FY20.
We believe SUNTV is well poised to witness standalone revenue/PAT CAGR of
16%/24% over FY18-20. Healthy RoE of 33% and steady FCF generation should
continue to offer strong upside, valuing at 30x December 2019E EPS (~15%
discount to ZEEL), arriving at a TP of INR1,225.
Research covered
Cos/Sector
Financials
Sun TV
Hexaware Tech
Ecoscope
GAIL
Motherson Sumi
Britannia Inds
Marico
NHPC
GSK Consumer
Bank of India
Indian Bank
Other Results
Results Expectation
Key Highlights
RBI revises guidelines for stressed asset resolution
Revenue growth set to take off
Fuelling the growth engines…
Macro data in line with expectations
In-line EBITDA; LPG/HCs above est.; Trading/Petchem disappoint
Below est; Weak Op. performance, higher depreciation & tax impact PAT
Sales in-line, volumes grow in double-digits; margins surprise positively
Results broadly in line, margin pressures to continue; Maintain Neutral
Strong operating performance
Sales growth surprises on a very weak base; margins below expectations
Weak operating performance; asset quality continues to deteriorate
Strong operating performance with improving asset quality; Reiterate Buy
AMRJ | BATA | SADE | CGPOWER | AGLL | SLPA | VATW
ENDU | GDPL | GRASIM | ICNT | KNRC | NEST | PRIF | REPCO | SUNP | TPWR
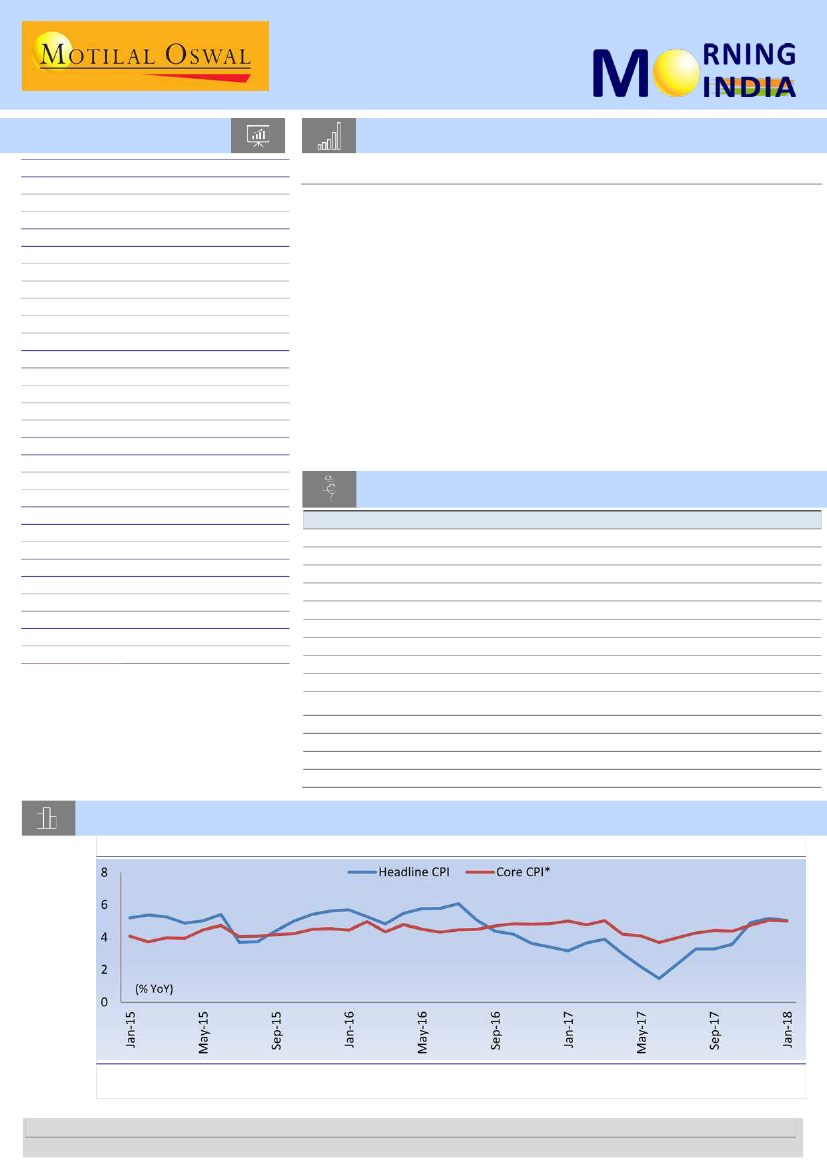
Chart of the Day: EcoScope – Macro data in line with expectations
Retail inflation eases to 5.1% in January 2018...
* Excluding F&B and F&L
Source: Central Statistics Office (CSO), MOSL
Research Team (Gautam.Duggad@MotilalOswal.com)
Investors are advised to refer through important disclosures made at the last page of the Research Report.
Motilal Oswal research is available on www.motilaloswal.com/Institutional-Equities, Bloomberg, Thomson Reuters, Factset and S&P Capital.

In the news today
Kindly click on textbox for the detailed news link
1
Govt approves Rs16,000 crore
arms purchase plan
The defence ministry on Tuesday
said it has approved the purchase
of defence equipment worth
Rs15,935 crore for the army, navy
and air force. The Defence
Acquisition Council (DAC) headed
by defence minister Nirmala
Sitharaman cleared purchases of
advanced torpedo decoy …
2
Rs 2 lakh crore loans may head to bankruptcy court
More than Rs 2 lakh crore worth of stressed loans may be headed to
bankruptcy court after the RBI dumped various restructuring schemes on
Monday and pronounced the bankruptcy courts as the final arbiter of a
defaulting company’s future. These loans are mostly from infrastructure
sectors such as power, telecom, roads and ports and are in different stages
of restructuring under plans such as strategic debt restructuring (SDR) or
the so-called sustainable structuring of stressed assets.
3
No grandfathering for
investments from Mauritius:
AAR
In what could have far-reaching
implications for foreign investors
buying Mumbai stocks and bonds,
the Authority of Advance Ruling
(AAR) has disallowed
grandfathering benefits to a
company routing its investments
in India through Mauritius. “We
do not wish to appear regressive
or against promoting healthy …
4
Six leading cement companies
forming a 'cartel' under CCI
scanner
The Competition Commission of
India (CCI) in a preliminary
investigation has found six leading
cement companies have formed a
cartel, this time in the
northeastern region. “In fresh
investigations, six large cement
manufacturing firms have been
found to be forming a cartel,” a
source close to the development…
5
Indian pharma firms renew
focus; Dr Reddy's, Cipla eye
$100-bn China market
Dr Reddy’s Laboratories (DRL) is
expanding its presence in China,
the world’s second-largest
pharmaceutical market, where
other drug manufacturers such
as Cipla and Lupin are exploring
opportunities.
The more than $100-billion
China market is dominated by
local drug manufacturers and
multinationals and India’s
pharmaceutical exports of
around $160 million are a
fraction of the companies’ sales.
6
Logistics hub to turn Assam’s
Jogighopa into India’s new
gateway to South-East Asia
Jogighopa, a small town in Assam,
is set to become India’s gateway to
South-East Asia as well as the rest
of the North-East with the road
ministry gearing up to develop a
multimodal logistics park (MMLP)
there with road, rail, waterways
and air transport facilities. The
development includes railway
sidings, container terminals, …
14 February 2018
7
SBI seeks to act tough on
Videocon Industries
State Bank of India (SBI) is
seeking direction from the
Insolvency and Bankruptcy Board
of India (IBBI) on whether it
needs to file separate insolvency
cases against affiliates of
Videocon Industries Ltd, given
that they are jointly liable for
loan repayments. Last month,
the country’s largest lender had
filed separate insolvency
proceedings against two group…
2

Sector Update | 14 February 2018
Financials
Technology
RBI revises guidelines for stressed asset resolution
Laying the foundation for stronger credit discipline
The Reserve Bank of India (RBI) has released a revised set of guidelines for
recognition and resolution of stressed assets with a clear goal of promoting better
credit discipline and making bad loan resolution a time-bound process. In a major
step, all existing categorization of standard stressed assets – SDR, S4A, CDR
restructuring, and flexible restructuring under 5:25 scheme – have been abolished,
leaving IBC – failing other means – as the only resolution mechanism. The RBI has
also mandated weekly/monthly reporting of INR50m+ accounts to the Central
Repository of Information on Large Credits (CRILC). This apart, the resolution plans
are now required to be rated by an external rating agency, with a certain
threshold rating to be eligible for implementation.
We believe this initiative by the RBI to fast-track stressed asset resolution will
promote better credit discipline and is a positive for the lenders in the long term.
Withdrawal of multiple stressed asset resolution schemes will also be seen as a
positive as introduction of such schemes has not helped banks much over the past
few years and only led to accumulation of troubled assets. However near term
banks may have to refer increasing number of cases to NCLT which will keep a
pressure on provisioning requirement. We continue to like SBIN, ICICIBC and BOB
among corporate banks, given their strong operating earnings profile and stable
asset quality in the core portfolio.
Categorization of standard stressed assets simplified:
RBI has released the
revised stressed asset resolution and classification framework. One major step is
that the existing resolution schemes (CDR, flexible structuring of long-term
project loans, SDR, S4A, etc.) will cease to exist. Instead, lenders shall identify
incipient stress in loan accounts, immediately on default, by classifying stressed
assets as special mention accounts (SMA). An account would be SMA-0 if the
principal or interest payment or any amount is wholly or partly overdue
between 1 and 30 days, SMA-1 if it is between 31 and 60 days, and SMA-2 if it is
between 61 and 90 days.
Weekly and monthly reporting of larger loan accounts to CRILC:
Starting 23
rd
February, defaulters on loans amounting to INR50m+ will be monitored by the
RBI on a weekly basis, as banks will have to report the status of those accounts
at the close of the business day on Friday to the CRILC. Also, with effect from 1
st
April 2018, the banks will need to provide credit information of INR50m+
accounts and their SMA status to CRILC on a monthly basis.
Uniformity in asset classification:
All lenders must put in place board-approved
policies for resolution of stressed assets under this framework, including
timelines for resolution. Immediately upon default in the borrower entity’s
account with any lender, all lenders —singly or jointly — shall initiate steps to
resolve the default. This step will address situations where the same account is
classified as standard by one bank and as NPA by another.
14 February 2018
3

Resolution plan (RP) to be rated externally:
The resolution plan for all large
stressed accounts (>INR1b) should have Independent Credit Evaluation (ICE)
done by Credit Rating Agencies (CRA) in order to boost transparency and
improve the quality of resolution. Accounts of INR5b+ will require ICE from at
least two CRAs, while those below INR5b+ may submit ICE from one CRA. Any
ICE submitted is required to have a rating of RP4 or above in order to be
considered for implementation.
Time-frame for implementation of the new framework:
For accounts with
exposure of >INR20b, the reference date for implementation of this framework
is 1
st
March 2018. For accounts with exposure of INR1b-20b, the RBI will
announce the resolution timeline over the next two years to ensure calibrated
time-bound resolution. Importantly, if a resolution plan is not implemented
according to the timeline, then lenders will need to file insolvency petition
within 15 days of expiry of the timeline.
Our view:
With this revised framework, the RBI has clearly taken another step
toward fast-tracked cleansing of the system. Also, referral of cases to IBC in a
time-bound manner will promote better credit discipline. This can also be seen
as a precursor to the IFRS implementation. Withdrawal of multiple stressed
asset resolution schemes will be seen as a positive in the long term, as
introduction of such schemes has not helped banks much over the past few
years and only led to accumulation of troubled assets. Corporate banks with
higher quantum of stressed/restructured assets (CBK, PNB, BOI, UNBK, SBIN,
ICICIBC) may see higher proportion of their bad loans drifting toward IBC
process (failing any satisfactory resolution plan), as the upgrade/recovery
chances of such tenured stressed loans remains low, in our view. We continue
to like SBIN, ICICIBC and BOB among corporate banks, given their strong
operating earnings profile and stable asset quality in the core portfolio.
Exhibit 1: Net stressed loans snapshot for corporate lenders (3QFY18)
ICICIBC
460.4
238.1
18.2
26.8
32.2
34.5
6.8
190.6
117.6
429.5
8.5
300.7
29
5,053.9
1,045.0
AXSB
250.0
117.7
SBIN
(Merged)
1,991.4
1,023.7
148.8
249.9
58.3
61.0
324.3
176.7
1,689.3
9.3
1,182.5
55
18,262.1
2,169.4
BOB
484.8
198.5
90.2
37.8
21.7
7.1
34.5
62.0
327.7
8.2
229.4
56
3,993.8
406.4
PNB
UNBK
409.9
204.3
37.4
28.0
26.6
10.0
19.2
24.0
301.4
10.3
211.0
102
2,936.7
207.3
CBK
403.1
253.0
70.0
68.2
51.7
30.0
148.8
121.4
500.3
13.4
350.2
121
3,731.2
288.5
INBK
95.9
48.9
40.0
9.5
11.4
22.0
1.1
29.6
0.0
162.5
11.0
113.8
62
1,482.7
183.1
BOI*
642.5
361.2
106.3
56.9
24.5
28.0
10.7
0.0
587.6
16.7
411.3
127
3,509.5
324.1
GNPA
NNPA
OSRL (Ex SEB and AI)
5:25 (incl. pipeline)
SDR
SR
S4A
Watch-list/SMA2
Overlap
Total Net Stressed loans (NSL)
Total NSL as % of loans
Total @ 70%
% of NW eroded at 70% haircut
Loans
Networth
*Overlap data for BOI is not available
174.6
292.3
6.9
204.6
31
4,209.2
650.3
436.9
9.7
305.8
68
4,521.1
452.5
Source: MOSL, Company
14 February 2018
4

Exhibit 2: Valuation Summary
Rating
66
FY20E
Private Banks
ICICIBC
HDFCB
AXSB
KMB
YES
IIB
IDFCB
FB
DCBB
JKBK
SIB
EQUITAS
RBK
PSU Banks
SBIN*
PNB
BOI
BOB
CBK
UNBK
INBK
Life Insurance
HDFCLIFE*
Buy
Buy
Buy
Buy
Buy
Buy
Neutral
Buy
Neutral
Buy
Buy
Buy
Buy
Buy
Buy
Neutral
Buy
Neutral
Neutral
Buy
Buy
Mkt. Cap CMP
(INRb)
2,096
4,747
1,335
1,901
743
988
180
164
52
37
50
48
181
2,652
434
150
414
192
87
163
747
EPS (INR)
ABV (INR)
RoA (%)
RoE (%)
P/E (x)
P/ABV (x)
FY20E
1.5
3.3
1.8
3.0
2.2
3.2
1.1
1.4
1.7
0.7
0.9
1.9
2.5
0.9
1.1
0.8
1.2
0.8
0.8
1.2
(INR) FY19E FY20E FY19E FY20E FY19E FY20E FY19E FY20E FY19E FY20E FY19E
326 16.5
1,877 81
563
31
1,043 42
335
24
1,686 79
54
3
95
7
172
9
70
12
28
4
144
7
485
23
289
162
145
169
328
128
356
372
18
8
5
17
37
6
38
5.4
21.0
101
45
54
31
101
4
8
11
17
5
10
30
30
16
10
24
71
15
42
6.7
130
491
268
290
125
437
46
62
91
81
26
69
169
167
120
147
125
299
144
273
149
571
308
343
151
522
48
69
102
95
30
77
193
206
149
191
145
401
159
306
1.17
1.9
1.1
1.7
1.7
1.9
0.8
0.8
0.9
0.7
0.8
1.6
1.3
0.5
0.3
0.1
0.3
0.4
0.1
0.7
3.4
1.31
2.0
1.3
1.8
1.8
1.9
0.9
0.9
0.9
0.8
0.9
1.8
1.4
0.7
0.5
0.2
0.5
0.7
0.3
0.7
3.5
10.1
16.6
11.1
14.3
19.9
19.1
6.9
9.8
10.4
11.9
12.7
9.5
13.8
8.4
4.3
1.8
5.5
6.8
2.7
11.2
19.1
11.9
18.1
14.1
15.8
21.5
20.7
7.9
11.3
11.3
14.7
14.8
13.1
16.2
12.7
7.6
3.6
8.8
11.8
6.4
11.3
19.1
13.5
23.3
18.1
25.1
14.0
21.4
16.7
14.7
19.2
5.8
7.5
21.8
21.3
10.4
19.0
29.5
10.1
8.8
21.5
9.3
69.3
10.6
18.6
12.6
19.2
10.9
16.6
13.7
11.6
15.8
4.2
5.7
14.2
16.0
6.3
10.3
14.1
7.1
4.6
8.3
8.4
55.3
1.7
3.8
2.1
3.6
2.7
3.9
1.2
1.5
1.9
0.9
1.1
2.1
2.9
1.1
1.3
1.0
1.4
1.1
0.9
1.3
*RoE represents ROEV and P/BV represents P/EV
Source: MOSL, Company
14 February 2018
5

SUN TV Networks
BSE SENSEX
34,300
S&P CNX
10,540
14 February 2018
Update
| Sector: Media
CMP: INR984
TP: INR1,225 (+25%)
Buy
Revenue growth set to take off
Digitization gains accruing, finally
Stock Info
Bloomberg
Equity Shares (m)
52-Week Range (INR)
1, 6, 12 Rel. Per (%)
M.Cap. (INR b)
M.Cap. (USD b)
Avg Val, INRm
Free float (%)
SUNTV IN
394.1
1097 / 652
-8/22/15
387.9
6.1
1365.0
25.0
Financials Snapshot (INR b)
Y/E MARCH
FY18E FY19E
Net Sales
28.4
33.6
EBITDA
19.4
23.4
NP
10.9
14.1
EPS (INR)
27.7
35.8
EPS Gr (%)
11.6
29.1
BV/Share (INR) 110.2 121.7
P/E (x)
35.5
27.5
P/BV (x)
8.9
8.1
EV/EBITDA (x) 19.1
15.5
RoE (%)
26.1
30.9
RoCE (%)
26.1
30.9
FY20E
38.5
26.9
16.7
42.5
18.7
135.3
23.2
7.3
13.3
33.1
33.1
Subscription revenues are likely to grow at 16% CAGR over FY18-20, led by
digitization in Tamil Nadu. We believe there is further upside, driven by
higher market share of DTH players, growth in MSO-led subscription revenue
following TRAI’s tariff order requiring price parity, as well as growing HD
penetration and ARPU increase.
Higher viewership on the back of content rejig coupled with shift to
commission model should help SUNTV capitalize on potential ad revenue
growth. Given the low base of FY17, we expect 14% CAGR over FY18-20.
Near doubling of IPL revenue to INR2.8b, driven by substantially higher
auction of media rights and fresh inventory driving the radio business bodes
well. Steady movie investments should lead RoCE to reach ~33% by FY20.
With the growth pillars in place, we believe SUNTV is well poised to witness
standalone revenue/PAT CAGR of 16%/24% over FY18-20.
With growth revival in the next 2-3 years driving healthy standalone EPS
CAGR of 24%, RoE of 33% and steady FCF generation, the stock should
continue to offer healthy upside. We value SUNTV at 30x December 2019E
EPS (~15% discount to ZEEL), arriving at a TP of INR1,225.
Subscription revenue growth at inflection point
We expect 16% CAGR in subscription revenue over FY18-20 to INR17.3b (INR11.2b
FY17) on the back of INR30/subscriber for incremental 10m analog subscribers
switching to digital cable/DTH. The slow pace of digitization in the South markets,
primarily Tamil Nadu, is getting reversed with grant of provisional license to Arasu
and the recent blackout of analog signals. This has triggered revision of content
contracts at INR15-20/subscriber. Besides, (a) higher market share of DTH players,
paying higher revenue/subscriber, (b) TRAI’s tariff order requiring price parity,
garnering higher subscription revenue from MSOs, (c) higher HD penetration, and
(d) improving ARPUs offer further upside for subscription growth.
Shareholding pattern (%)
As On
Dec-17 Sep-17 Dec-16
Promoter
75.0
75.0
75.0
DII
3.2
3.4
1.7
FII
13.8
13.4
16.8
Others
8.0
8.2
6.6
FII Includes depository receipts
Stock Performance (1-year)
Sun TV Network
Sensex - Rebased
1,200
1,050
900
750
600
Commission model to capture ad revenue potential
We expect ad and broadcast revenue to surge to INR18.1b by FY20, with 14% CAGR
over FY18-20. With the impact of demonetization and GST implementation waning,
the overall ad market should see healthy growth from 2HFY18. Strong fiction-led
content focus should drive rating-led ad growth. We believe SUNTV’s shift to
commission model from PP model should potentially offer ~20% higher EBITDA and
capture potential upside from limited undercutting and better content ratings.
14 February 2018
6

IPL, Movies and Radio to further fuel overall growth
IPL’s substantially higher TV broadcasting, digital and title sponsor rights v/s
previous value, should lead to almost doubling of SUNTV’s IPL revenue to INR2.8b
coupled with a turnaround in PBT to INR1.3b v/s a loss of about INR210m earlier.
We expect revenue/EBITDA from the radio business to grow at 15%/25% CAGR over
FY17-20, turning it into a potential value unlocking asset. Fresh inventory from the
launch of 21 new (Phase III) stations coupled with increasing penetration of the
radio industry bodes well for the radio business. Movie acquisition should be
restricted to INR3.5b in the next 1-2 years.
EBITDA to witness healthy 18% CAGR over FY18-20
Despite the structural reforms of demonetization and GST implementation, SUNTV
managed to register 5% YoY revenue and EBITDA growth in 1HFY18 on standalone
basis. EBITDA margin stood at ~65%. Waning of the impact of these reforms should
only drive revenue higher. We believe, (a) the shift to commission model, (b)
digitization-led APRU increase, and (c) near-doubling of IPL revenue should provide
impetus to standalone revenue/EBITDA – expect 16%/18% CAGR over FY18-20.
Maintain Buy with a revised target price of INR1,225
With growth revival in the next 2-3 years driving standalone EPS CAGR of 24%, RoE
of 33%, and steady FCF generation, the stock should continue to offer healthy
upside. We value SUNTV at 30x December 2019E EPS (~15% discount to ZEEL),
arriving at a TP of INR1,225. SUNTV currently trades at ~19% discount to ZEEL.
Despite being a regional player, this valuation gap should reduce, as SUNTV is likely
to grow at a steady pace.
14 February 2018
7

C
orner
O
ffice
the
Interaction with the CEO
12 February 2018
Fuelling the growth engines…
…Supporting sustenance of revenue growth outperformance
We met Mr R Srikrishna, CEO of Hexaware (HEXW), to discuss the company’s strategic focus,
given dramatic shifts in the consumption of technology services. Since the beginning of his
leadership role at HEXW, the company has focused on transformation and has recently
enhanced its strategy to define its journey over the next few years. Our key takeaways:
Hexaware
Technologies
Legacy pressures seen across the industry
Over the past three years, HEXW’s revenue growth has outperformed that of peers
on an organic basis, led by its ‘Shrink IT, Grow Digital’ strategy.
The burden of legacy has been weighing upon service vendors, to a larger extent for
the larger ones, as deals erode in value to the tune of ~30% at the time of renewal.
HEXW too has exposure to legacy business – application management, on-premise
ERP, manual testing and business intelligence.
In each service line, however, it has been aggressively tilting towards newer areas,
thereby reconstituting the portfolio. Agile development, cloud-based ERP,
automated testing and analytics have been gaining a larger share in the overall mix.
Mr R Srikrishna
CEO & Executive Director
Mr R Srikrishna (Keech) is the
CEO of Hexaware Technologies.
Prior to Hexaware, he served in
HCL for over 20 years as the
President of two units –
Healthcare and Lifesciences
and Infrastructure Services. He
was instrumental in growing
these units to multibillion
dollar businesses.
Mr Srikrishna joined Hexaware
in 2014. Since then, he is
dedicated towards delivering
world-class services to
customers, and ensuring
employee satisfaction, thereby
creating and sustaining long-
term profitable growth.
Culture change necessary for transformation
In HEXW’s ‘Shrink IT, Grow Digital’ strategy, the approach toward automation-led
savings in traditional IT has been adopted with an idea to pass on the benefits to
customers, and thus, gain share. It has aligned its strategy, offerings and culture to
aggressively take on renewal deals with its Shrink IT proposition.
The culture change within the organization is being brought about for three years
now, ensuring a bottom-up approach to adoption of large-scale automation.
Combined with customer demands, this approach leads to broader and more
meaningful changes in operations.
~40% of HEXW’s employees have been involved in automation ground-up, the
company’s focus being on scripting rather than platforms.
Automation, Cloud, Customer Experience
HEXW has extended its strategy to drive growth for the next few years. Focus areas
as part of this journey are: (i) automate everything, (ii) cloudify everything, and (iii)
customer digital transformation.
These focus areas cut across multiple verticals and service lines and call for
adoption at an overall company level. Multiple service lines for HEXW are in
different shape because of their proportion in legacy – and to that extent, growth
rates in the near term would be differential.
A good reflection of this can be witnessed in the growth rates observed in IMS and
BPS, which have little to worry about from a legacy perspective, and the decline
seen in Enterprise Services over the last three years because of the chunk of
revenue derived from on-premise systems.
14 February 2018
8

Contrasting trends in ES and IMS/BPS
Over the last three years, other than Enterprise Services (ES), all service lines for HEXW have exhibited double-
digit revenue CAGR, with IMS and BPS being the highest at 35%.
The two services have been critical in giving performance a boost, as they contributed 36% of the incremental
dollars, while they contributed only 13% of total revenue three years ago. Much of the high growth here has
been a function of right positioning – no legacy baggage combined with offerings that are synchronized with
current market trends.
ES, however, flattened out in CY17, after having declined at 15% CAGR over the prior three years. HEXW has
corrected its course by aligning services with market trends, restructuring its go-to market strategy and
strengthening leadership. The proportion of legacy (PeopleSoft, legacy SAP/Oracle) versus Cloud-ready systems
(Workday, SFDC, etc) has now reached a level where growth can be expected in the segment, going forward.
Building new engines for growth
While sustenance of high-growth areas and course-correction in problem areas are necessary for sustained mid-
teen revenue growth, HEXW is also building new engines for growth in the form of new service lines and
geographies.
In line with this strategy, it has been enhancing its offerings in the areas of automation, cloud and customer
experience. At the same time, it has also started stepping up on its presence in the geographies of Europe and
APAC.
While it historically had presence in Europe, it was limited to UK and Germany. It is now hitting the gas on
Nordics to improve positioning. In APAC, HEXW has been taking a focused approach to double-down on India
and China, in the verticals of BFSI and e-commerce.
To a large extent, this played out in CY17; growth in Americas was 12.8% YoY, and that in Europe was 12.1% and
in APAC was 56.8%. APAC, Europe and the Americas growing in the written order is a trend likely going ahead.
Valuation and view
Automating and cannibalizing:
HEXW’s strategic direction of playing a disruptor in Enterprise through
technology-led cannibalization can be a rewarding one, but will need continued investments towards building
capabilities in areas like Automation. That said, its traction within its top accounts and strategy to target the top
50-100 accounts of larger peers can help it grab wallet share in the names, if it can achieve the skill sets.
Volatility in top accounts:
Volatility in the performance of top accounts has driven inconsistent financial
performance at HEXW over the past few years. While strong traction in top-10 accounts has driven strong
revenue growth in CY15 and CY16 (>75% of the incremental growth), pressure in multiple accounts would weigh
upon performance in CY17 and CY18.
Mitigated by successful efforts on gaining new accounts:
However, it has also begun ramping up efforts to win
new clients, which gets substantiated from the fact that it won deals worth USD180m in CY17, compared to
USD151m in CY16 and USD120m in CY15 from new customers, which was at a fraction of this at the end of CY14.
The ramp-up of these accounts is evident from the fact that non-top-10 accounts contributed 72% of the
incremental growth in CY17, a trend opposite of what was seen over the last two years, thereby mitigating the
impact from top customer issues.
Improving proportions:
HEXW, thanks to its PeopleSoft prowess, has been facing legacy pressures for the last
three years. However, it has been able to mitigate much of this by aggressively marking a presence in
automation, cloud, IMS and BPS. In the last three years, the legacy-heavy Enterprise Solutions saw a 15%
compounded annual decline in revenue; however, with new service lines reaching critical mass now, broad-
based growth can be expected, going forward.
Margins to be tight:
Although costs in CY15 increased to a much greater extent than revenue, the same isn’t
expected going forward. HEXW has heavily invested over the last year, substantiated from the doubling of Sales
14 February 2018
9

& Marketing personnel. Although investment intensity maybe lesser than earlier, ramp up of new deal wins,
onsite-driven growth and continued investments in capability building will cap margin upside in the near term.
Maintain Neutral with a price target of INR340:
We expect HEXW to grow its USD revenue at a CAGR of 12.5%
and EPS at a CAGR of 12.1% over CY17-19. HEXW trades at 18.6/16.4x CY18/19E earnings. Our target price of
INR340 discounts forward earnings by 16x (v/s 14x before the 4QCY17 earnings), driven by continued
outperformance, despite top client headwinds and higher payout (40% payout ratio, 2.3% yield). However, with
multiples at 10/20% premium to larger/mid-cap peers, we don’t see potential for further re-rating. Maintain
Neutral.
Key triggers
Large deal wins
Continued momentum in revenue growth
Offshore shift lever to margins
Key risk factors
Lower margins due to investments
Setback in business from top clients
Prolonged sluggishness in foot-in-the-door access amid challenging PeopleSoft prospects
14 February 2018
10

E
CO
S
COPE
Macro data in line with expectations
No reason for the RBI to change its stance
12 February 2018
The Economy Observer
CPI inflation eased marginally to 5.1% in January 2018 from 5.2% in the previous month – in line with our/consensus
estimate of 5%/5.1%.
Food inflation eased to 4.7%, led by a fall in inflation in fruits & vegetables and sugar & confectionary. Core CPI
remained unchanged at 5%, even as inflation in ‘core services’ picked up slightly to 3.8%.
IIP rose by a healthy 7.1% in December 2017, higher than our/consensus expectation of +6%. Consumer non-durables
and capital goods grew in double-digits, aided by a favourable base, leading to a surge in IIP.
We expect inflation to rise to over 6% in 1QFY19 on account of an adverse base effect. However, a high base is likely to
pull down CPI inflation closer to ~4% in 2HFY19. Thus, we expect the RBI to look through such statistical effects and
maintain status quo through 2018.
I. Retail inflation eases slightly in January 2018
CPI inflation eases to 5.1% in January 2018…:
CPI-based inflation eased
marginally to 5.1% YoY in January 2018 from a 17-month high of 5.2% in the
preceding month
(Exhibit 1).
The number was in line with our/market consensus
estimate of 5%/5.1%. Inflation has declined for the first time in seven months; it
had risen continuously from a record low of 1.5% in June 2017 to 5.2% in
December 2017.
…as food inflation declines:
The surge in headline inflation over the last six
months was largely driven by food inflation, which rose from -2.1% YoY in June
2017 to +4.9% YoY in December 2017. However, food inflation eased slightly to
4.7% in January 2018, leading to a fall in the headline number. Among food
items, inflation in fruits & vegetables eased to 19.8% YoY in January 2018 from a
four-year-high of 21.5% in the preceding month, contributing 20bp to the MoM
fall in the headline number. Inflation in sugar & confectionary declined sharply
to 2.9% from 6.2% in December 2017.
Core inflation unchanged at 5% in January…:
Core
inflation (all items excluding
‘food & beverages’ and ‘fuel & light’) remained unchanged MoM at 5% in
January 2018 (Exhibit
3).
Core-core inflation (excluding petrol/diesel from core
inflation) also remained stable at 5.3% (highest level in 2 months). Within core
items, inflation in the recreation & amusement group surged to 4.4% in January
2018 from 3.9% in the previous month.
…while inflation in ‘core services’ picks up:
Further refinement of CPI items
shows that inflation in ‘core services’ rose to a five-month high of 3.8% in
January 2018 from 3.6% in the preceding month
(Exhibit 4),
but continued to
remain at comfortable levels. Inflation in this category has remained at sub-4%
levels since the last 99 months.
We expect inflation to rise to over 6% in 1QFY19 on account of an adverse
base. However, a high base should pull down CPI inflation closer to ~4% in
2HFY19. Thus, we believe that the RBI is likely to look through such statistical
effects and maintain status quo in 2018.
14 February 2018
11

12 February 2018
3QFY18 Results Update | Sector: Oil & Gas
GAIL India
Sell
BSE SENSEX
34,300
Bloomberg
Equity Shares (m)
M.Cap.(INRb)/(USDb)
52-Week Range (INR)
1, 6, 12 Rel. Per (%)
Avg Val, INRm
Free float (%)
S&P CNX
10,540
GAIL IN
1,691
786.5 / 12.2
518 / 347
-6/16/7
1734.0
46.4
CMP: INR465
TP: INR388 (-17%)
In-line EBITDA; LPG/HCs above est.; Trading/Petchem disappoint
3QFY18 EBITDA stood at INR19.7b (in-line; +16% YoY, -5% QoQ), led primarily by
higher contribution from LPG and HCs. Other income of INR3b was much higher
than our estimate (+1% YoY, +3% QoQ). Effective tax rate of 32.1% was lower
than our estimate of 34%, which, combined with higher other income, resulted
in PAT of INR12.6b (+28% YoY, -4% QoQ).
Segmental analysis: Transmission volume at 109mmscmd
Gas transmission volume stood at 109mmscmd (+6% YoY, +3% QoQ), led by
increased offtake from power plants due to the lack of coal supply. Implied
tariff stood at INR1,325/mscm (+9% YoY, -2% QoQ) due to increased share of
higher tariff zone during the quarter. EBIT stood at INR6.3b (+8% YoY, -21%
QoQ).
While petchem sales stood at 176kmt (+21% YoY, +1% QoQ), realization
declined to USD1,265/MT (-11% YoY, -1% QoQ). EBIT stood at INR940m (-
30% YoY, +6% QoQ).
Due to higher availability of rich gas, LPG/liq. HC sales stood at 326tmt
(+10% YoY, -2% QoQ). Realization was USD557/mt (+40% YoY, +34% QoQ).
EBIT stood at INR6.6b (+76% YoY, +44% QoQ).
Gas trading EBIT rose 14% YoY (-19% QoQ) to INR3.4b, led by trading
volumes of 88mmscmd (+6% YoY, +4% QoQ) and trading margins of
INR423/mscm (+7% YoY, -22% QoQ).
Valuation view:
US volumes are expected to land in India from March. Although
most of the volumes for CY18 have been placed through various derivate
contracts, we remain concerned on profitable placement of the contracts in light
of the long-term nature of the expensive contracts. The stock trades at 14.4x
FY19E EPS of INR32.3. We value GAIL using SOTP at INR381/share, implying
~17% downside. The core business is valued at 9x FY20E EPS adjusted for other
income. Maintain
Sell.
(INR m)
FY17
FY18
FY17
FY18E
2Q
3Q
4Q
1Q
2Q
3Q
4QE
118,582 121,079 134,217 114,065 124,097 144,143 127,205 480,743 509,509
-15.8
-9.5
15.4
6.7
4.7
19.0
-5.2
-6.9
6.0
15,155 17,015
15,250
18,994
20,694 19,699
19,603
63,152 78,989
12.8
14.1
11.4
16.7
16.7
13.7
15.4
13.1
15.5
3,563
3,579
3,471
3,451
3,425
3,668
3,724
13,968 14,267
1,198
1,601
220
1,014
926
479
1,019
4,794
3,437
3,361
3,002
4,981
1,158
2,929
3,027
1,838
12,705
8,952
0
0
-7,880
0
0
0
0
-2,987
0
13,755 14,836
8,659
15,687
19,273 18,580
16,698
54,108 70,238
4,508
5,007
6,058
5,431
6,177
5,957
5,677
19,079 23,242
32.8
33.7
70.0
34.6
32.0
32.1
34.0
35.3
33.1
9,247
9,829
2,602
10,256
13,096 12,622
11,021
35,029 46,996
9,247
9,829
10,482
10,256
13,096 12,622
11,021
38,016 46,996
109.9
48.0
36.1
21.3
41.6
28.4
5.1
65.4
23.6
5.5
5.8
6.2
6.1
7.7
7.5
6.5
22.5
27.8
101
136
103
146
102
186
100
131
106
175
109
176
106
158
100
578
105
640
Financials & Valuations (INR b)
Y/E Mar
2018E 2019E
Net Sales
509.5
575.0
EBITDA
76.6
90.3
PAT
44.8
54.7
EPS (INR)
26.5
32.3
Gr. (%)
17.4
22.0
BV/Sh (INR)
242.2
262.5
RoE (%)
11.3
12.8
RoCE (%)
9.7
11.0
P/E (x)
17.6
14.4
P/BV (x)
1.9
1.8
EV/EBITDA (x)
9.8
8.4
2020E
611.5
93.9
57.2
33.8
4.6
283.7
12.4
10.6
13.8
1.6
8.0
Estimate change
TP change
Rating change
Quarterly Performance
Y/E March
Net Sales
Change (%)
EBITDA
% of Net Sales
Depreciation
Interest
Other Income
Extraordinary item*
PBT
Tax
Rate (%)
PAT
Adj PAT
Change (%)
EPS (INR)
Key Assumptions
Gas Trans. volume (mmsmd)
Petchem sales ('000MT)
E: MOSL Estimates
1Q
106,866
-14.6
15,732
14.7
3,354
1,774
1,362
4,893
16,858
3,506
20.8
13,352
8,459
99.4
5.0
96
110
14 February 2018
12

RESULTS
FLASH
Motherson Sumi
BSE SENSEX
34,300
S&P CNX
10,540
13 February 2018
Results Flash | Sector: Automobiles
CMP: INR365
TP: INR458
BUY
Below est; Weak Op. performance, higher depreciation & tax impact PAT
Conference Call Details
Date:
14 Feb 2018
Time:
3.00 PM IST
Dial-in details:
3065 0000/ 6629 0000
th
Financials & Valuations (INR b)
2018E 2019E
Y/E Mar
Net Sales
564.0 670.2
EBITDA
54.8
75.8
NP
21.1
30.3
EPS (INR)
10.0
14.4
EPS Gr. (%)
30.0
43.9
BV/Sh. (INR)
46.2
56.5
RoE (%)
23.4
28.1
RoCE (%)
13.8
18.7
P/E (x)
36.4
25.3
P/BV (x)
7.9
6.5
2020E
763.9
95.0
38.6
18.3
27.2
69.0
29.2
21.2
19.9
5.3
Consol. revenue grew 36% YoY (+7.2% QoQ) to INR143.9b (est. of INR137.8b),
led by a healthy performance at SMP and PKC, while SMR results were weak.
EBITDA grew 13.5% YoY to ~INR12.6b (v/s est INR13.1b). Higher depreciation
and tax led to ~4% decline in adj. PAT of INR3.66b (v/s est. INR4.1b).
SMP revenue grew 18.2% YoY (+11% QoQ) to EUR897m, led by ramp-up of new
plants. SMR revenue declined 3.7% YoY to EUR392m due to a forex impact of
EUR15.7m. SMR witnessed steady growth in all markets, except Asia.
PKC revenue increased 27% YoY to EUR271m, aided by higher commodity price
and contribution from second JV in China. However, its European performance
was negatively impacted by RM availability at suppliers’ end.
S/A revenue grew 15% YoY (-3.3% QoQ) to INR17.9b (est. of INR18.3b). S/A
EBITDA declined 3.5% YoY (-14% QoQ) to INR3.1b (est. of INR3.4b), translating
into EBITDA margin of 17.4% (v/s est 18.6%), led by higher-than-expected RM
cost. S/A PAT came in line with estimate at INR1.7b (-18% YoY, -35.7% QoQ).
Consol. net debt declined to INR5.5b in 3QFY18 from INR8b in 3QFY17.
Key questions for management
Update on ramp-up of new plants at SMP.
Reason for decline in revenues for SMR
PKC update on JV, new client addition and new orders secured.
Update on new business wins in India.
Valuation view:
The stock trades at 25.3x/19.9x FY19/20E EPS. We have a
Buy
with
a TP of INR458.
Quarterly performance (Cons.)
(INR m)
Y/E March
FY17
FY18E
FY17 FY18E
Est
Var.
1Q
2Q
3Q
4Q
1Q
2Q
3Q
4QE
3QE
(%)
Net Sales
1,04,504 1,01,369 1,06,041 1,12,839 1,31,286 1,34,313 1,43,979 1,54,448 4,24,934 5,64,025 1,37,853
4.4
YoY Change (%)
15.5
10.2
12.3
14.5
25.6
32.5
35.8
36.9
14.2
32.7
30.0
RM Cost (% of sales)
61.0
60.5
61.7
59.4
60.8
60.6
61.5
59.8
60.6
60.7
60.6
90bp
Staff Cost (% of sales)
19.2
18.8
18.8
19.3
19.7
19.8
19.5
19.1
19.0
59.8
19.8
-30bp
Other Expenses (% of sales)
10.9
10.8
9.3
10.2
10.5
10.3
10.3
9.5
10.3
10.1
10.1
20bp
EBITDA
9,282 10,068 11,093 12,405 11,864 12,504 12,595 17,848 42,847 54,811 13,096
-3.8
Margins (%)
8.9
9.9
10.5
11.0
9.0
9.3
8.7
11.6
10.1
9.7
9.6
-90bp
Depreciation
2,508 2,643 2,733 2,707 3,768 3,978 3,937 3,352 10,591 15,035 3,873
2
Interest
847
980 1,084
838 1,176
771 1,032 1,159 3,749 4,137
950
9
Other Income
37
45
433
948
39
156
151
55 1,463
400
150
1
PBT before EO expense
5,964 6,489 7,710 9,808 6,959 7,910 7,777 13,392 29,970 36,039 8,423
-7.7
Extra-Ord expense
0
0
0
974 1,502
48
21
-21
974 1,550
0
PBT after EO Expense
5,964 6,489 7,710 8,834 5,458 7,862 7,756 13,413 28,996 34,489 8,423
-7.9
Tax
1,955 2,105 2,845 2,198 2,343 2,333 2,516 2,638 9,103 9,829 2,443
3.0
Tax Rate (%)
32.8
32.4
36.9
22.4
33.7
29.5
32.4
19.7
30.4
27.3
29.0
340bp
Minority Int & Share of profit
983
774
706 1,887
335 1,168 1,595 1,587 4,350 4,685 1,850
Reported PAT
3,026 3,610 4,159 4,748 2,780 4,361 3,645 9,188 15,543 19,974 4,130
-11.7
Adj PAT
3,026 3,513 3,813 5,383 3,546 4,386 3,656 9,177 16,039 20,765 4,130
-11.5
YoY Change (%)
15.2
-3.8
13.5
42.0
17.2
24.9
-4.1
70.5
27.5
25.6
40.0
E: MOSL Estimates
14 February 2018
13

RESULTS
FLASH
Britannia Inds
BSE SENSEX
34,300
S&P CNX
10,540
12 February 2018
Results Flash | Sector: Consumer
CMP: INR4,767
TP: INR6,098(+28%)
Buy
Sales in-line, volumes grow in double-digits; margins surprise positively
Conference Call Details
Date:
14 Feb 2018
Time:
03:00pm IST
Dial-in details:
+91-22-3960 0715
th
Financials & Valuations (INR b)
2018E 2019E
2020E
Y/E Mar
Net Sales
99.0
118.6
142.6
EBITDA
14.1
17.8
22.3
NP
10.1
12.8
16.1
84.5
106.9
133.8
EPS (INR)
14.7
26.4
25.2
EPS Gr. (%)
271.9
335.3
414.7
BV/Sh. (INR)
RoE (%)
34.0
35.2
35.7
RoCE (%)
29.0
30.4
31.2
P/E
56.4
44.6
35.6
39.9
31.3
24.7
EV/EBITDA
Consolidated performance
BRIT reported 13.0% consolidated sales growth to INR25.6b in 3QFY18, exactly
in line with our estimates. We estimate base business volume growth at ~10%
(press release states double-digit volume growth), in line with our
expectations. Consolidated EBITDA, thus, grew by a healthy 31% YoY (est. of
+26%) to INR3.9b (est. of INR3.7b). Cons. PAT growth, while healthy at 19.6%
YoY to INR2.64b (est. of INR2.67b), did not grow at the same pace as EBITDA.
Consol. gross margin expanded 110bp YoY (est. of +100bp) to 38.5%. EBITDA
margin expanded 210bp YoY to 15.2% (est. of 14.5%). Apart from gross margin
improvement, there was a decrease in other expenses (-80bp YoY to 19.6%)
and staff costs (-20bp YoY to 3.7%).
9MFY18 performance:
Sales, EBITDA and PAT grew 8.7%, 17.5% and 10%,
respectively. 9MFY18 cons. EBITDA margin improved 110bp YoY to 14.3%.
Standalone performance for 3QFY18
Standalone
sales, EBITDA and adj. PAT posted 14.6%, 32.8% and 17.8% YoY
growth, respectively. Gross margin (37.7%) expanded by 50bp YoY and
operating margin (15.1%) by 210bp YoY.
Subsidiary performance for 3QFY18
Sales declined 6.8% YoY, while EBITDA and PAT grew 11.5% and 61.8%,
respectively. Subs. EBITDA margins improved from 14.3% in 3QFY17 to 17.0%
in 3QFY18, possibly because of the dairy business.
We have
Buy
rating on the stock.
(INR Million)
FY17
2Q
3Q
10.0
2.0
23,612 22,648
11.0
5.6
14,902 14,190
8,709
8,458
36.9
37.3
5,578
5,487
23.6
24.2
20,481 19,678
3,131
2,970
13.3
13.1
2.0
0.9
289
303
15
11
670
544
3,496
3,201
1,156
997
33.1
31.1
2,340
2,204
5.8
4.6
FY18
2Q
3Q
5.0
10.0
25,365 25,583
7.4
13.0
15,840 15,745
9,525
9,838
37.6
38.5
5,836
5,946
23.0
23.2
21,676 21,691
3,689
3,892
14.5
15.2
17.8
31.0
336
329
14
26
596
451
3,934
3,989
1,326
1,354
33.7
33.9
2,609
2,635
11.5
19.6
FY17
4QE
12.0
25,799
14.9
15,849
9,950
38.6
6,363
24.7
22,212
3,587
13.9
16.4
402
2
968
4,151
1,413
34.0
2,739
29.9
6.0
89,623
7.4
55,887
33,736
37.6
21,872
24.4
77,759
11,864
13.2
-5.1
1,193
55
2,424
13,040
4,197
32.2
8,843
7.3
FY18E
7.3
98,996
10.5
61,307
37,689
38.1
23,624
23.9
84,931
14,065
14.2
18.6
1,399
55
2,756
15,367
5,225
34.0
10,142
14.7
FY18 Variance
3QE (%)
10.0
25,592
(0.0)
13.0
15,779
9,813
0.3
38.3
6,091
23.8
21,871
3,721
4.6
14.5
26.0
363
13
701
4,046
(1.4)
1,376
34.0
2,670
(1.3)
21.2
Quarterly Performance
Y/E March
Base business volume growth (%)
Net Sales
YoY Cha nge (%)
COGS
Gross Profit
Ma rgi ns (%)
Other Opera ti ng Exp
% of Sa l es
Tota l Exp
EBITDA
Ma rgi ns (%)
YoY Growth (%)
Depreci a ti on
Interes t
Other Income
PBT
Ta x
Ra te (%)
Adjusted PAT
YoY Cha nge (%)
1Q
10.0
21,063
8.5
12,879
8,184
38.9
5,367
25.5
18,246
2,817
13.4
3.5
279
15
739
3,263
1,071
32.8
2,192
13.2
4Q
2.0
22,444
5.2
13,915
8,528
38.0
5,448
24.3
19,363
3,081
13.7
6.1
322
13
335
3,081
973
31.6
2,108
5.9
1Q
2.0
22,248
5.6
13,873
8,375
37.6
5,479
24.6
19,352
2,896
13.0
2.8
332
13
741
3,293
1,133
34.4
2,160
-1.5
E: MOSL Estimates
14 February 2018
14

12 February 2018
3QFY18 Results Update | Sector: Consumer
Marico
Neutral
BSE SENSEX
34,300
Bloomberg
Equity Shares (m)
M.Cap.(INRb)/(USDb)
52-Week Range (INR)
1, 6, 12 Rel. Per (%)
Avg Val, INRm/ Vol m
Free float (%)
S&P CNX
10,540
MRCO IN
1,289.6
400.2 / 6.0
348 / 263
0/-12/-6
375.0
40.3
CMP: INR310
TP: INR345(+11%)
Results broadly in line, margin pressures to continue; Maintain Neutral
Marico’s 3QFY18 sales grew 15.1% YoY to INR16.2b (est. of INR16.1b).
Domestic volume growth stood at 9.4% YoY (est. of +12%), while overall
volume growth was 7% YoY. Domestic revenue grew 19% YoY, while reported
international revenue increased 1% YoY (+9% on a constant currency basis).
Consol. gross margin contracted 540bp YoY to 46.5%,
mainly as copra costs
were up 91% YoY. EBITDA increased 10.7% YoY to INR3b (est. of INR2.9b), with
the margin shrinking 70bp YoY (est. of -100bp) to 18.6%. Adj. PAT rose 16.5%
YoY to INR2.2b (est. of INR2.1b).
Segmental growth:
Parachute sales grew 41% YoY, with 15% volume growth
(est. of +20%); Saffola sales declined 4% YoY, with flat volume growth (est.
+10%); and Value Added Hair Oils (VAHO) sales grew 7% YoY, with 8% volume
growth (est. of +12%). There was 26% realization increase YoY in Parachute;
realization in VAHO was down 1% and in Saffola was down 4% YoY.
9MFY18
consolidated sales, EBITDA and adj. PAT stood at +5.2%, -1.6% and
+0.6% YoY, respectively.
Concall highlights:
Management believes it is unlikely that there will be further
inflationary trend in copra. It expects softening only in 2HFY19, and thus,
margins are likely to be under pressure in 1HFY19 as well.
Valuation view:
Steep copra price increase YoY and a rise in adspend over a
low base could keep pace of earnings growth under check over the next few
quarters. EPS CAGR of~19% over FY18-FY20 over a weak base of FY17 and
FY18E could be at risk if material costs do not come off as expected in 2HFY19
and if volume performance remains lackluster adjusted for a weak base.
Valuations are fair at 36x Dec’19 EPS. While MRCO remains among best of
breed among peers in terms balance sheet and management quality, rising
bond yields mean that the market is likely to be unforgiving for companies with
an uncertain earnings outlook. Maintain
Neutral.
4Q
10.0
13,152
2.2
6,365
6,787
51.6
4,262
32.4
2,525
19.2
20.1
273
47
293
2,497
784
31.4
4
1,709
25.5
1Q
-9.0
16,815
-4.0
8,782
8,033
47.8
4,790
28.5
3,243
19.3
-13.3
211
35
229
3,226
866
26.8
1
2,359
-11.9
FY18
2Q
3Q
8.0
9.4
15,363 16,243
6.7
15.1
8,144
8,688
7,219
7,556
47.0
46.5
4,628
4,535
30.1
27.9
2,591
3,021
16.9
18.6
2.4
10.7
235
213
35
39
214
174
2,535
2,943
679
709
26.8
24.1
6
1
1,850
2,233
2.5
16.5
FY17
4QE
4.0
14,620
11.2
7,540
7,080
48.4
4,370
29.9
2,711
18.5
7.4
277
83
198
2,549
785
30.8
2
1,762
3.1
3.6
59,180
-3.3
28,491
30,690
51.9
19,276
32.6
11,414
19.3
8.1
903
166
1,152
11,497
3,377
29.4
10
8,110
14.4
FY18E
5.0
63,041
6.5
33,154
29,887
47.4
18,322
29.1
11,565
18.3
1.3
937
192
816
11,253
3,038
27.0
10
8,205
1.2
(INR Million)
FY18
Var.
3QE
(%)
12.0
16,119
0.8%
14.0
8,302
7,817
-3.3%
48.5
4,904
30.4
2,913
3.7%
18.1
8.0
255
66
273
2,864
2.7%
773
27.0
2
2,089
6.9%
9.0
Financials & Valuations (INR b)
Y/E Mar
2018E 2019E 2020E
Net Sales
63.0
74.1
85.4
EBITDA
11.6
13.8
16.2
PAT
8.2
9.8
11.6
EPS (INR)
6.4
7.6
9.0
Gr. (%)
1.2
19.2
18.4
BV/Sh (INR)
20.5
21.6
24.0
RoE (%)
33.0
36.0
39.4
RoCE (%)
28.2
30.8
33.6
P/E (x)
48.8
40.9
34.6
P/BV (x)
15.1
14.4
12.9
EV/EBITDA (x)
33.9
28.6
24.2
Div. Yield (%)
1.0
1.8
1.8
Estimate change
TP change
Rating change
Quarterly Performance
Y/E March
Domes ti c vol ume growth (%)
Net Sales
YoY Cha nge (%)
COGS
Gross Profit
Gros s ma rgi n (%)
Other Expendi ture
% to Sa l es
EBITDA
Ma rgi ns (%)
YoY Cha nge (%)
Depreci a ti on
Interes t
Other Income
PBT
Ta x
Ra te (%)
Mi nori ty Interes t
Adjusted PAT
YoY Cha nge (%)
E MOSL E ti t
1Q
8.0
17,523
0.2
8,400
9,123
52.1
5,384
30.7
3,740
21.3
18.2
208
54
275
3,753
1,072
28.6
2
2,679
17.2
FY17
2Q
3Q
3.4
-4.0
14,395 14,114
-0.8
-7.7
6,815
6,785
7,581
7,328
52.7
51.9
5,050
4,600
35.1
32.6
2,530
2,729
17.6
19.3
11.4
-5.3
209
218
21
44
247
233
2,548
2,700
740
781
29.1
28.9
2
2
1,806
1,916
18.0
-6.8
14 February 2018
15

9 February 2018
3QFY18 Results Update | Sector: Utilities
NHPC
Buy
BSE SENSEX
34,300
Bloomberg
Equity Shares (m)
M.Cap.(INRb)/(USDb)
52-Week Range (INR)
1, 6, 12 Rel. Per (%)
Avg Val, INRm/ Vol m
Free float (%)
S&P CNX
10,540
NHPC IN
10,259
302.6 / 4.7
35 / 26
-6/-15/-24
222.0
26.0
CMP: INR30
TP: INR37 (+24%)
Strong operating performance
Cut estimates on delay at Parbati-II; Maintain Buy
NHPC’s 3QFY18 underlying PAT grew 40% YoY to INR2.7b (ahead of our estimate of
INR2b), led by higher incentive income, lower other expenses, and saving in
interest cost. Underlying PAT is adjusted for (a) dividend income of INR2.4b from
NHDC and (b) late payment surcharge of INR2.3b (gross tax).
Generation was up 1% YoY to 3.4BU. PAF increased ~270bp YoY to 76.8%.
Incentive income increased 59% YoY to INR1.1b.
Interest cost saving of INR1.1b was achieved on repayment and refinancing of
debt. Refinancing will generate annualized saving of INR340m, of which
INR170m will be retained by NHPC.
Kishanganga on track, Parbati-II delayed; cut estimates on delay; Maintain Buy
Kishanganga 330MW is likely to be commercialized before the end of FY18.
Additional subordinate debt of ~INR5b at interest cost of ~1% was granted by
the government during the year. Further support of ~INR4b is committed.
Parbati-II 800MW is likely to be delayed by about a year due to geological
challenges. It has hired international experts and better machinery, and the
project is gradually progressing. 3.2km of tunneling work is pending. Progress
on Subhasiri 2,000MW is pending the report of the committee set-up under
the NGT order, which is expected before March 2018.
Of the five projects pending capex approval, PIB has cleared three projects and
the remaining two are likely to get cleared over the next few months. The next
step is approval by Cabinet Committee before final tariff orders are issued by
CERC. INR6.8b of revenue was pending recognition due to capex approval at
the end of FY17.
We expect Parbati-II to be commercialized in FY21 against FY20 earlier.
Resultantly, consolidated PAT is cut by ~13% and DPS is cut from INR2.25/sh. to
INR2/sh for FY20E. Our DCF-based TP on FY20E basis is INR37. Maintain
Buy.
1Q
21,968
9.7
8,403
13,565
61.8
3,384
2,751
1,633
1,379
10,443
0
10,443
1,864
17.9
8,578
FY17
FY18
2Q
3Q
4Q
1Q
2Q
3Q
4QE
24,034 13,086 13,624 23,275 19,717 14,979 20,096
2.5
-4.3
-16.9
6.0
-18.0
14.5
47.5
8,438 6,841 11,394 9,412 8,567 7,137 10,741
15,595 6,244 2,231 13,863 11,150 7,843 9,355
64.9
47.7
16.4
59.6
56.5
52.4
46.6
3,422 3,551 3,527 3,536 3,505 3,469 3,358
2,794 2,688 2,499 2,409 2,356 2,279 2,164
8,779 1,750 2,426 1,053 5,194 5,688 1,271
1,085 1,340 3,336 2,010 1,426 1,710 -1,098
19,243 3,095 1,966 10,980 11,908 9,492 4,007
0
0
0
0
0
0
0
19,243 3,095 1,966 10,980 11,908 9,492 4,007
3,696
948
282 2,354 1,722 2,613 2,045
19.2
30.6
14.3
21.4
14.5
28
51.0
15,547 2,147 1,684 8,627 10,186 6,879 1,962
FY17
72,712
-1.1
35,076
37,636
51.8
13,884
10,732
14,587
7,140
34,746
0
34,746
6,790
19.5
27,956
FY18E
78,067
7.4
35,856
42,211
54.1
13,868
9,208
13,205
4,047
36,387
0
36,387
8,733
24.0
27,654
FY18
3QE
14,587
11.5
7,047
7,540
51.7
3,505
2,333
1,000
0
2,703
0
2,703
703
26.0
2,000
Financials & Valuations (INR b)
Y/E Mar
2018E 2019E 2020E
Net Sales
90.6 107.5 117.1
EBITDA
52.0
68.0
74.9
PAT
24.8
31.9
32.9
EPS (INR)
2.4
3.1
3.2
Gr. (%)
-18.1
28.5
3.1
BV/Sh (INR)
28.4
29.2
30.0
RoE (%)
8.5
10.8
10.8
RoCE (%)
6.4
8.1
9.2
P/E (x)
12.2
9.5
9.2
P/BV (x)
1.0
1.0
1.0
Estimate change
TP change
Rating change
Quarterly Performance (Standalone) – INR million
Y/E March
Net Sales
YoY Change (%)
Total Expenditure
EBITDA
Margins (%)
Depreciation
Interest
Other Income
Rate regulated activity
PBT before EO expense
Extra-Ord expense
PBT
Tax
Rate (%)
Reported PAT
14 February 2018
16

RESULTS
FLASH
GSK Consumer
BSE SENSEX
34,300
S&P CNX
10,540
12 February 2018
Results Flash | Sector: Consumer
CMP: INR 5,980
TP: INR5,785(-3%)
Neutral
Sales growth surprises on a very weak base; margins below expectations
Conference Call Details
Date:
2018
Time:
3:00pm IST
Dial-in details:
+91 22 3960 0611
13
th
February
Financials & Valuations (INR b)
Y/E Mar
2018E 2019E 2020E
Net Sales
42.8
48.1
53.5
EBITDA
8.8
10.1
11.5
NP
6.8
7.7
8.7
EPS (INR)
160.8 182.3 206.5
EPS Gr. (%)
3.0
13.4
13.2
BV/Sh. (INR)
812.1 891.1 980.5
RoE (%)
20.7
21.4
22.1
RoCE (%)
20.7
21.5
22.1
P/E
39.7
35.0
30.9
P/BV (x)
7.9
7.2
6.5
GSK Consumer (SKB) posted 20.3% YoY sales growth
(including operating
income) to INR10.3b (est. of INR9.7b). Likely volume growth was 15% YoY (est.
of 9%). These numbers have to be seen in conjunction with base quarter sales
and volume decline of 11.5% and 17%, respectively. EBITDA stood at INR2.04b
(+21.7% YoY), marginally above estimate of INR1.99b. PAT grew 20% YoY to
INR1.64b (est. of INR1.52b).
Gross margin expanded 110bp YoY to 68.8%.
However, staff costs were up
50bp YoY to 12.9%, A&P to sales was by 20bp YoY to 10.9%, and other
expenses were up 20bp YoY to 25.3%, restricting EBITDA margin expansion to
20bp YoY to 19.7% (est. of 20.5%).
Other income increased 15% YoY
and was ahead of our expectation.
9MFY18 results:
Net sales were up 8.7% YoY to INR31.4b. EBITDA rose 2.5%
YoY to INR6.3b. EBITDA margin contracted 120bp YoY to 20.1%. PAT was up
1.6% YoY to INR4.9b.
Market share expanded 20bp QoQ to 44.1% in Horlicks,
but declined by 20bp
QoQ to 16.2% in Horlicks Extensions and 10bp QoQ to 11.3% in Boost.
Valuation view:
Based on our current estimates, the stock trades at 37x
Dec’FY19E core EPS. We have a
Neutral
rating with a TP of INR5,785.
Quarterly Performance
Y/E Mar
HFD Volume Growth (%)
Net Sales
YoY Cha nge (%)
Tota l Exp
EBITDA
Ma rgi ns (%)
YoY Cha nge (%)
Depreci a ti on
Interes t
Other Income
PBT
Ta x
Ra te (%)
Adj PAT
YoY Cha nge (%)
E: MOSL Estimates
1Q
-6.0
9,439
-5.2
7,404
2,035
21.6
-0.6
147
6
592
2,474
868
35.1
1,606
2.9
FY17
2Q
-3.0
10,803
-1.1
8,351
2,452
22.7
3.0
148
6
578
2,876
1,039
36.1
1,837
-0.1
3Q
-17.0
8,604
-11.5
6,927
1,677
19.5
-9.5
171
6
559
2,059
695
33.8
1,364
-8.3
4Q
-1.0
11,019
2.3
8,848
2,171
19.7
1.5
177
9
710
2,695
936
34.7
1,759
8.4
1Q
0.0
9,853
4.4
8,190
1,664
16.9
-18.3
170
5
557
2,045
723
35.3
1,322
-17.7
FY18
2Q
2.5
11,153
3.2
8,540
2,614
23.4
6.6
177
6
550
2,981
1,057
35.5
1,924
4.7
3Q
15.0
10,347
20.3
8,307
2,040
19.7
21.7
151
2
642
2,529
892
35.3
1,637
20.0
FY17
FY18E
4QE
6.0
-6.8
4.5
11,448 39,864 42,802
3.9
-3.6
7.4
9,569 31,530 34,029
2,503 8,335 8,773
20.7
20.9
20.5
15.3
-1.0
5.3
188
642
686
15
28
28
591 2,439 2,340
3,029 10,104 10,399
1,036 3,537 3,636
34.2
35.0
35.0
1,993 6,566 6,763
13.3
-4.5
3.0
(INR Million)
FY18
3QE
9.0
9,722
13.0
7,730
1,992
20.5
18.8
172
7
531
2,344
820
35.0
1,524
11.7
Var.
(%)
6.4%
2.4%
7.9%
7.4%
14 February 2018
17

12 February 2018
3QFY18 Results Update | Sector: Financials
Bank of India
Neutral
BSE SENSEX
34,300
Bloomberg
Equity Shares (m)
M.Cap.(INRb)/(USDb)
52-Week Range (INR)
1, 6, 12 Rel. Per (%)
Avg Val, INRm
Free float (%)
S&P CNX
10,540
BOI IN
Weak operating performance; asset quality continues to deteriorate
1,055
BOI reported a loss of INR23.4b, as provisions soared to INR4.9b (highest in
286.5 / 4.4
seven quarters), led by elevated NPA provisions of INR4.4b (largely related
217 / 123
to NCLT and divergence accounts) and elevated MTM provisions on
-10/-9/-13
investments. NII fell 14% QoQ (13% miss due to ~INR4b of interest reversals)
859.0
and other income fell 39% QoQ on weak treasury gains (-92% YoY).
24.9
CMP: INR145
TP: INR150 (+5%)
Financials & Valuations (INR b)
Y/E March
2018E 2019E
NII
105.9
122.6
OP
76.0
87.7
NP
-23.9
2.3
EPS (INR)
-15.6
1.1
EPS Gr. (%)
5.5 -107.3
ROE (%)
-6.5
0.6
ROA (%)
-0.4
0.0
BV/Sh. (INR)
177
175
P/E(X)
-9.3
127.4
P/BV (X)
0.82
0.83
2020E
139.8
98.3
7.4
3.7
222.3
1.8
0.1
175
39.5
0.83
Slippages increased sharply to INR183.3b (5.1% annualized slippage ratio).
The bank reported FY17 GNPA/NNPA divergence of INR140.6b/INR97.1b,
leading to a PAT divergence of INR62.5b. Out of the divergence of
INR140.6b, INR94.1b was on account of SBLCs issued by other banks, for
which the bank is not required to make any additional provision, and which
the bank expects to recover in 4Q. Out of INR94.1b, the bank has so far
realized INR47.5b by invoking SBLCs of other banks.
NIM shrunk 27bp QoQ to 1.88% due to a 28bp impact from ~INR4b of
interest reversals. Loan growth declined to 3.7%/2.6% QoQ/YoY; however,
retail loans grew 15.8% YoY.
Recoveries and upgradations increased to INR13.4b (v/s INR10.7b in the
previous quarter). However, lower write-offs of INR20.4b, along with higher
slippages, contributed to sequentially higher absolute GNPLs/NNPLs. OSRL
book declined to INR106.3b (3% of loans) v/s INR118.2b in Q2.
Other highlights:
a) In 3QFY18, the bank raised INR22.6b from GoI via
preferential allotment. b) CASA deposits grew 2% QoQ, led by robust growth
in CA deposits (+14% QoQ); reported CASA ratio rose 135bp QoQ to 40.4%.
Valuation view:
Continued elevated net stress addition has kept asset
quality under pressure. We expect high credit cost due to NCLT-related
cases. We build in capital infusion of further INR9.2b from GoI, and cut
FY18/19/20E PAT sharply to factor in high loan loss provisions. Return ratios
are expected to be sub-optimal over FY18/FY19. Maintain
Neutral with a TP
of INR150, based on 0.8x FY20 BV.
(INR Million)
FY17
2Q
3Q
4Q
27,197 28,626 34,686
20,106 17,693 17,540
47,304 46,319 52,226
22,375 21,734 20,951
24,928 24,584 31,275
14,208 14,574 22,815
22,962 23,026 47,362
1,966
1,559 -16,087
698
542 -5,632
1,268
1,017 -10,455
5,053
3,633
522.6
13.5
274.7
7.6
47.4
5,426
3,602
517.8
13.4
255.3
7.1
50.7
5,400
3,665
520.4
13.2
253.1
6.9
51.4
FY18E
2Q
3Q
29,082 25,012
17,064 10,412
46,146 35,424
23,816 21,881
22,331 13,543
14,901 12,733
19,533 48,997
2,798 -35,454
1,007 -12,042
1,791 -23,412
5,437
3,645
493.1
12.6
235.7
6.5
52.2
5,260
3,509
642.5
16.9
361.2
10.3
43.8
FY17
4Q
26,487
13,980
40,467
24,172
16,295
16,295
20,058
-3,764
-654
-3,109
5,454
3,741
587.2
15.7
295.2
7.9
49.7
118,261
67,723
185,984
88,658
97,326
61,786
121,052
-23,726
-8,142
-15,584
5,400
3,665
520.4
13.2
253.1
6.9
51.4
FY18E
105,912
57,565
163,477
87,514
75,963
67,963
111,041
-35,078
-11,225
-23,853
5,454
3,741
587.2
15.7
295.2
7.9
49.7
Quarterly Performance
1Q
27,752
12,384
40,136
23,597
16,539
12,748
27,702
-11,163
-3,750
-7,414
4,980
3,639
518.7
13.4
282.6
7.8
45.5
1Q
25,330
16,110
41,440
17,646
23,794
17,314
22,453
1,342
464
877
5,437
3,640
510.2
13.1
243.7
6.7
52.2
Net Interest Income
Other Income
Total Income
Opera ti ng Expens es
Operating Profit
Core Operating Profit
Provi s i ons
Profit before Tax
Ta x
Net Profit
Operating Parameters
Depos i t (INR b)
Loa n (INR b)
Asset Quality
Gros s NPA (INR b)
Gros s NPA (%)
Net NPA (INR b)
Net NPA (%)
PCR (%)
14 February 2018
18

12 February 2018
3QFY18 Results Update | Sector: Financials
Indian Bank
Buy
BSE SENSEX
34,300
Bloomberg
Equity Shares (m)
M.Cap.(INRb)/(USDb)
52-Week Range (INR)
1, 6, 12 Rel. Per (%)
Avg Val, INRm
Free float (%)
S&P CNX
10,540
INBK IN
Strong operating performance with improving asset quality; Reiterate Buy
480
INBK reported core operating profit (excl. treasury gains) growth of 55%
172.3/2.7
YoY to INR 11.3b. However, PAT of INR3b was 38% below estimates, as
428 / 252
provisions of INR9.2b were above estimates (included INR4.7b of
-4/12/-4
provisions for MTM losses).
452.0
NII grew 30% YoY to INR16.2bn (6% above estimate) led by 22% YoY loan
18.1
growth and 3bp QoQ improvement in global margins. NII growth was
CMP: INR356
TP: INR430 (+21%)
Financials & Valuations (INR b)
Y/E March
2018E 2019E
NII
63.0
70.6
OP
50.2
52.5
NP
16.4
19.5
EPS (INR)
34.1
40.6
EPS Gr. (%)
16.4
19.3
BV/Sh. (INR)
327
358
ABV/Sh (INR)
259
292
RoE (%)
10.8
11.9
RoA (%)
0.7
0.7
Div. Payout (%)
23.2
23.2
Valuations
P/E (x)
10.5
8.8
P/ BV (x)
1.1
1.0
P/ABV (x)
1.4
1.2
Div. Yield (%)
1.9
2.3
2020E
82.2
57.3
22.3
46.5
14.5
394
328
12.4
0.7
23.2
7.7
0.9
1.1
2.6
partially offset by other income (8% YoY decline led by 74% decline in
treasury gains of INR0.8b).
C/I ratio rose sharply by 520bp QoQ to 44.3% mainly led by decline in
other income. PPoP growth thus stood at 18% YoY; however, high
provisions led to decline in PAT by 19% YoY to INR3b.
Fresh slippages increased 168% QoQ to INR9.5b led by 4 lumpy accounts
(~INR4.5b) slipping from SDR. However, elevated write-offs of INR4.1b and
sale to ARCs worth INR3.6b led to QoQ flat GNPA at INR96b. Calculated
PCR deteriorated by 172bp QoQ to 48.9% on the back of lower provisions
The Bank has a total exposure of INR26.4b (8 accounts) towards first list
and INR7.4b towards second list (10 accounts). The bank has made total
provisions of INR18.2b towards the two lists against a requirement of
INR19.8b (by FY18), the balance to be made in 4QFY18.
Total net stressed book including standard restructured/SDR/5:25/S4A as
of 3QFY18 stands at INR111.1b (7.5% of the loans)
After several quarters, loan book growth picked up with 4%/22% QoQ/YoY
growth to INR1.48tn while deposits grew 4%/13% QoQ/YoY to INR2.06tn.
CD ratio thus increased by 170bp QoQ to 71.8%. CASA deposits grew 6%
YoY led by 28%YoY growth in CA deposits.
Valuation view:
Focus on balance sheet consolidation and core operating
parameters has led to improving earnings, despite challenging macros.
INBK has a strong capital position with Tier-1 of 10.9% and is thus well-
poised to grow its loan book and benefit from further improvement in
operating leverage. We upgrade FY19/FY20 PAT estimates by 6%/10% to
account for pick up in loan growth and opex control. Maintain Buy with a
TP of INR430 (1.1x Mar 20E BV).
(INR Million)
1Q
14,595
18.1
6,521
21,116
8,592
12,524
9,491
38.7
7,156
5,368
1,644
3,724
21.2
1,915
1,294
96.5
7.2
52.4
4.1
45.7
FY18E
2Q
3Q
15,437
16,227
20.8
30.2
7,146
5,489
22,583
21,715
8,826
9,623
13,756
12,092
11,134
11,336
36.7
18.4
7,446
9,181
6,311
2,911
1,795
-120
4,515
3,031
11.5
-18.9
1,987
1,392
96.2
6.7
47.5
3.4
50.7
2,065
1,483
96.0
6.3
49.0
3.3
48.9
FY17
4Q
16,922
22.2
5,121
22,043
10,070
11,973
10,665
11.9
4,290
7,683
2,427
5,256
64.4
2,135
1,532
99.3
6.3
48.4
3.2
51.2
51,461
15.7
22,114
73,574
33,567
40,007
27,344
18.1
22,425
17,582
3,526
14,057
97.6
1,825
1,277
98.7
7.5
56.1
4.4
43.2
FY18E
63,009
22.4
24,277
87,286
37,112
50,174
36,766
18.6
28,072
22,102
5,747
16,356
16.4
2135
1532
99.3
6.3
48.4
3.2
51.2
3QFY18E
V/S our
Est
15,247
6
22.3
5,359
2
20,607
5
9,368
3
11,239
8
9,639
18
10.1
4,000
130
7,239
-60
2,389
-105
4,850
-38
29.9
2026
1420
97.0
6.6
46.7
3.3
51.8
2
4
-1.0
-4.9
4.8
0.3
-5.5
Quarterly Performance
FY17
3Q
4Q
12,466
13,849
12.2
22.1
5,997
5,854
18,463
19,703
8,251
9,001
10,212
10,701
7,317
9,350
33.2
29.3
5,403
8,069
4,809
2,632
1,074
-565
3,735
3,197
670.4
278.4
1,837
1,220
96.8
7.7
58.0
4.8
40.1
1,825
1,277
98.7
7.5
56.1
4.4
43.2
Net Interest Income
% Cha nge (Y-o-Y)
Other Income
Net Income
Opera ti ng Expens es
Operating Profit
Core Operating Profit
% Cha nge (Y-o-Y)
Other Provi s i ons
Profit before Tax
Ta x Provi s i ons
Net Profit
% Cha nge (Y-o-Y)
Operating Parameters
Depos i ts (INRb)
Loa n (INRb)
Asset Quality
Gros s NPA (INR b)
Gros s NPA (%)
Net NPA (INR b)
Net NPA (%)
PCR (%)
14 February 2018
19

Amara Raja Batteries
BSE SENSEX
34,300
Bloomberg
Equity Shares (m)
M.Cap.(INRb)/(USDb)
52-Week Range (INR)
1, 6, 12 Rel. Per (%)
Avg Val, INRm
Free float (%)
S&P CNX
10,540
AMRJ IN
171
144.3 / 2.2
955 / 665
-1/-5/-24
459.0
47.9
12 February 2018
3QFY18 Results Update | Sector: Automobiles
CMP: INR845
TP: INR1,035(+23%)
Buy
In-line operating performance; PAT above est. led by higher other income
Revenue in-line, helped by growth in auto, UPS and telecom segments:
Net
sales grew 17.1% YoY (+8.8% QoQ) to INR15.5b (in-line), led by growth in auto
across the OE and aftermarket segments. This was led by continued channel
expansion of Amaron and Powerzone brands. Further, higher exports to South-
East Asia and Middle-East countries aided growth in the auto segment.
Industrial battery segment too recorded growth, backed by higher sales in UPS
segment and a sequential increase in volumes in the telecom segment.
EBITDA margin in line at 15.6%; lead inflation partially offset by price hike:
Gross margin shrunk 90bp YoY (-190bp YoY) to 33% (in-line). Management
indicated that continued lead price inflation was partially offset by appropriate
pricing actions. EBITDA margin expanded 20bp YoY (-110bp YoY) to 15.6%, led
by a favorable product mix (higher share of autos), optimal utilization, and
price hikes. High other income and low depreciation boosted PAT by 20% YoY
(+5.7% QoQ) to INR1.34b (est. of INR1.24b).
Takeaways from management interaction:
a) Auto (including home UPS) grew
30-31% YoY in value terms and 18-20% YoY in volume terms. b) Industrial
segment declined 6% YoY; except telecom, all other segments posted growth.
c) ~3% price increase in Nov-17; over the past one year, AMRJ has taken
cumulative price increase of ~12%. d) ~85% of lead inflation in telecom
segment has been passed on. e) Growth in exports (~5-6% of revenue) was led
by UPS and 4W batteries. f) Can extend tubular batteries catering to new
applications like solar, E-rickshaw and rural UPS. g) Guided for capex of INR4b
each in FY18/19. h) Expect 2W capacity to touch 15m units (by May-18).
Current 4W capacity is 10.5m units (expect 12m units by end FY19).
Valuation view:
We keep FY19/FY20E earnings unchanged. The stock trades at
24.4x/20.4x FY18E/19E EPS. Maintain
Buy
with a TP of INR1,035 (23x Mar-20
EPS).
FY18
3QE VAR (%)
15,073
3.1
13.5
67.0
-10bp
5.3
-40bp
12.0
0bp
2,365
2.1
15.7
-10bp
625
-6.0
12
-5.8
150
11.7
1,878
5.7
33.5
1,249
7.6
11.2
Financials & Valuations (INR b)
2018E 2019E 2020E
Y/E Mar
Net Sales
59.9
70.1
81.1
EBITDA
9.1
11.0
12.9
PAT
4.8
5.9
7.1
EPS (INR)
28.3
34.7
41.4
Gr. (%)
0.9
22.7
19.4
BV/Sh (INR)
175
203
237
RoE (%)
17.3
18.3
18.8
RoCE (%)
16.5
17.4
17.8
P/E (x)
29.9
24.4
20.4
P/BV (x)
4.8
4.2
3.6
Estimate change
TP change
Rating change
Quarterly Performance
Y/E March (INR m)
Net Sales
YoY Change (%)
RM Cost (% of sales)
Staff Cost (% of sales)
Other Exp (% of sales)
EBITDA
Margins (%)
Depreciation
Interest
Other Income
PBT
Rate (%)
Adj PAT
YoY Change (%)
E: MOSL Estimates
1Q
13,081
15.0
65.7
5.0
11.9
2,273
17.4
441
14
90
1,908
31.5
1,307
8.0
FY17
FY18
FY17 FY18E
2Q
3Q
4Q
1Q
2Q
3Q
4QE
13,331 13,269 13,445 14,975 14,275 15,535 15,109 53,172 59,893
15.8
9.5
17.4
14.5
7.1
17.1
12.4
15.1
12.6
63.9
65.0
68.0
70.0
66.0
66.9
66.7
65.6
67.4
5.2
5.5
5.2
5.4
5.2
4.9
5.1
4.7
4.2
13.7
14.1
13.0
11.7
12.1
12.0
12.8
13.9
11.6
2,297 2,040 1,844 1,929 2,381 2,416 2,327 8,499 9,052
17.2
15.4
13.7
12.9
16.7
15.6
15.4
16.0
15.1
457
469
499
544
584
587
656 1,912 2,371
15
14
15
14
13
11
14
58
51
120
133
151
137
122
168
148
492
575
1,945 1,689 1,480 1,508 1,907 1,985 1,806 7,022 7,205
29.9
33.5
33.0
33.7
33.3
32.3
32.9
31.9
33.0
1,363 1,123
992
999 1,272 1,345 1,212 4,785 4,828
10.4
-17.9
-9.1
-23.6
-6.7
19.7
22.2
-2.7
0.9
14 February 2018
20

RESULTS
FLASH
12 February 2018
Results Flash | Sector: Other
Bata India
Sell
BSE SENSEX
34,300
S&P CNX
10,540
CMP: INR715
TP: INR578
Strong results;
Operating leverage drive EBITDA margins
Financials & Valuations (INR b)
2018E 2019E
Y/E Mar
Net Sales
26.4
29.3
EBITDA
3.2
3.8
NP
2.0
2.5
EPS (INR)
15.9
19.3
EPS Gr. (%)
17.8
21.0
BV/Sh. (INR)
115.3 130.4
RoE (%)
14.6
15.7
RoCE (%)
14.7
15.8
P/E (x)
48.6
40.2
P/BV (x)
6.7
5.9
2020E
32.6
4.4
2.9
22.4
16.6
148.0
16.1
16.1
34.4
5.2
BATA reported overall revenue of INR6,740m (est. INR6,793m) marking a YoY
growth of 6.2%.
EBITDA margins expanded by 420bp to 16.5% in 3QFY18 (est. 12.9%) on
account of decrease of 155bp in raw material cost which stood at 44.9% of net
sales , lower rental cost which stood at 13.3% of revenues an improvement of
90bps and 170bps improvement in other expenses to 14.95 of revenues.
EBITDA increased 42% YoY to INR1,115m (est INR876m).
Adjusted PAT stood at INR682m (est. INR574m), a growth of 14.8% YoY.
Valuation and view:
At CMP of INR 715, the stock trades at 45x , 37.1x and 32x on
FY18E , FY19E and FY20E respectively. We have a sell rating with a target price of
INR 578 on the stock.
Quarterly Performance
Y/E March
Consolidated
Net Sales
YoY Change (%)
Total Expenditure
EBITDA
Margins (%)
Depreciation
Interest
Other Income
PBT before EO expense
Extra-Ord expense
PBT
Tax
Rate (%)
Reported PAT
Adj PAT
YoY Change (%)
Margins (%)
E: MOSL Estimates
1Q
6,747
-1.5
5,895
851
12.6
162
7
80
762
0
762
257
33.8
505
505
6.8
7.5
FY17
2Q
3Q
5,837
6,347
1.6
1.5
5,265
5,561
573
785
9.8
12.4
160
162
13
5
103
162
504
780
0
217
504
563
158
186
31.3
23.8
346
377
346
594
53.2
32.5
5.9
9.4
4Q
5,980
6.1
5,413
567
9.5
166
16
122
507
0
507
147
29.1
359
359
27.3
6.0
1Q
7,431
10.1
6,476
955
12.9
137
9
116
925
0
925
321
34.7
604
604
19.7
8.1
FY18
2Q
5,869
0.5
5,224
645
11.0
144
8
148
641
0
641
212
33.1
429
429
24.0
7.3
FY17
3Q
6,740
6.2
5,625
1,115
16.5
154
5
107
1,063
0
1,063
381
35.9
682
682
14.8
10.1
4QE
6,339
6.0
5,667
672
10.6
170
5
151
648
0
648
208
32.1
440
440
22.4
6.9
24,743
1.0
21,957
2,786
11.3
650
40
460
2,555
217
2,339
749
32.0
1,590
1,737
7
7.0
FY18E
26,410
6.7
23,240
3,169
12.0
616
22
568
3,099
0
3,099
1,054
34.0
2,045
2,045
18
7.7
(INR m)
FY18E
Var
3QE
(%)
6,793
-1
6.0
5,916
876
27
12.9
155
4
144
861
23
0
861
23
288
33.4
574
19
574
19
-3.4
8.4
14 February 2018
21

RESULTS
FLASH
9 February 2018
Results Flash | Sector: Engineering
Sadbhav Eng
BUY
BSE SENSEX
34,300
S&P CNX
10,540
CMP: INR401
TP: INR445(+11%)
Below-estimated execution leads to a miss on operating performance
Conference Call Details
Date:
14 Feb 2018
Time:
16:30 hrs
Dial-in
details:
022
30257116
th
Financials & Valuations (INR b)
2018E 2019E 2020E
Y/E Mar
Sales
38,166 45,210 53,619
Valuation view
EBITDA
11.2
11.4
11.4
NP
2,428 2,513 2,924
The stock trades at 27/23.5x its FY19/20E EPS of 14.6/17. We have a
Buy
rating on
Adj EPS (INR)
14.2
14.6
17.0
the stock with a target price of INR445.
EPS Gr. (%)
29.3
3.5
16.4
BV/Sh (INR)
109.6 122.8 138.5
RoE (%)
13.7
12.6
13.0
RoCE (%)
9.0
10.2
10.8
Payout (%)
9.9
9.6
8.2
Valuations
P/E (x)
26.8
25.9
22.3
P/BV (x)
3.5
3.1
2.7
EV/EBITDA (x)
17.0
13.9
11.8
Div. Yield (%)
0.3
0.3
0.3
3QFY18 sales rose 8.1% YoY to INR9.4b, 6% below our estimate of INR9.9b.
EBIDTA grew 12.6% YoY to INR1.1b, 6% below our estimate of INR1.2b. Margin
expanded 50bp YoY to 11.3%, in line with our estimate.
PAT grew 1.3% YoY to INR531m, 19% below our estimate of INR657m. Miss on
PAT levels was on account of higher finance charges (INR285m v/s est. on
INR263m) and a higher tax rate (tax rate for the quarter stood at 11.3% v/s est.
of 5.0%)
The company has scheduled a concall on 14
th
February 2018 at 4:30pm.
Standalone - Quarterly Earning Model
Y/E March
Net Sales
YoY Change (%)
Total Expenditure
EBITDA
Margins (%)
Depreciation
Interest
Other Income
PBT before EO expense
Extra-Ord expense
PBT
Tax
Rate (%)
Reported PAT
Adj PAT
YoY Change (%)
Margins (%)
E: MOSL Estimates
1Q
8,070
-2.7
7,201
868
10.8
254
172
48
489
0
489
2
0.5
487
487
20.0
6.0
FY17
2Q
6,156
-17.5
5,503
654
10.6
253
221
8
187
0
187
1
0.8
185
185
-50.2
3.0
3Q
4Q
8,648 10,329
14.8
20.4
7,710 9,233
938 1,096
10.8
10.6
250
243
243
355
60
218
505
716
0
0
505
716
-19
33
-3.7
4.7
524
682
524
682
89.7
38.7
6.1
6.6
1Q
9,444
17.0
8,376
1,068
11.3
245
322
39
540
0
540
-15
-2.8
555
555
14.0
5.9
FY18
2Q
6,931
12.6
6,143
788
11.4
251
215
5
327
0
327
-8
-2.6
335
335
80.8
4.8
FY17E
FY18
(INR m)
MOSL Variance
3QE
4QE
3QFY18
(%)
9,351 12,441 33,203 38,166 9,923
-6
8.1
20.5
4.2
14.9
14.7
8,295 11,088 29,647 33,902 8,805
1,056 1,353 3,556 4,264 1,118
-6
11.3
10.9
10.7
11.2
11.3
247
262 1,000 1,005
251
285
231
992 1,054
263
74
232
333
350
88
598 1,092 1,897 2,556
691
-13
0
0
0
0
0
598 1,092 1,897 2,556
691
67
84
18
128
35
11.2
7.7
1.0
5.0
5.0
531 1,007 1,878 2,428
657
531 1,007 1,878 2,428
657
-19
1.3
47.6
22.1
29.3
25.3
5.7
8.1
5.7
6.4
6.6
14 February 2018
22

CG Power and Industrial
BSE SENSEX
34,300
Bloomberg
Equity Shares (m)
M.Cap.(INRb)/(USDb)
52-Week Range (INR)
1, 6, 12 Rel. Per (%)
Avg Val, INRm
Free float (%)
S&P CNX
10,540
CGPOWER IN
Performance beat led by better-than-expected margins
626.8
Standalone performance above expectations:
Sales rose 11% YoY to INR11.8b
56.4/0.8
(below estimate of INR12.7b), driven by Industrial segment growth of 11% YoY
99 / 64
(like-to-like growth of 20% YoY). Power systems segment sales declined 6% YoY
-7/2/6
on a reported basis (muted like-to-like growth of 3% YoY). EBIDTA grew 4% YoY
271.0
to INR871m (ahead of our estimate of INR683m), with the margin of 7.4% (-
65.6
13 February 2018
3QFY18 Results Update | Sector: Capital Goods
CMP: INR90
TP: INR90 (0%)
Neutral
Financials & Valuations (INR b)
Y/E Mar
2018 2019E 2020E
Net Sales
63.4
67.9
75.4
EBITDA
4.3
4.5
5.5
Adj PAT
-5.9
1.7
2.8
EPS(INR)
-9.5
2.7
4.4
EPS Gr. (%)
NM
NM
64.6
BV/Sh. (INR)
57.0
59.4
63.4
RoE (%)
2.8
6.0
8.5
RoCE (%)
6.0
6.7
8.3
P/E (x)
NM
33.6
20.4
P/BV (x)
1.6
1.5
1.4
Estimate change
TP change
Rating change
50bp YoY) ahead of our estimate of 5.4%. Adj. PAT of INR0.5b exceeded our
estimate of INR0.3b due to lower tax (INR10m v/s our estimate of INR73m) and
higher other income (INR454m v/s our estimate of INR250m).
Consol. operational performance better than expectations; provisioning for
Hungary business impacts PAT:
Consol. revenue (incl. Indonesian subsidiary)
grew strongly by 15% YoY to INR15.2b in 3QFY18 (below estimate of INR16.1b).
Power Systems sales grew by a muted 3% YoY, while Industrial sales rose 13%
YoY. EBIDTA stood flat YoY at INR1.3b (ahead of our estimate of INR1.2b), with
the margin down 120bp YoY to 8.4%. In 3QFY18, CG booked provisioning of
INR1.2b (INR0.9b operational loss from Hungary sub). Loss from Hungary sub is
expected to continue in 4QFY18 as well, as the sale deed is expected to close by
Mar’18. Adj. profit was INR0.9b v/s INR0.6b in 3QFY17.
Sale of power business in Hungary to be concluded by March 2018:
Sale of the
power business (EUR38m) in Hungary has now reached the final stages, and CG
Power has received in-principle approval from bankers; management expects
the deal to conclude latest by March 2018.
Valuation view: Neutral; revising TP to INR90:
On a consolidated basis, we
increase our loss estimate for FY18 to factor in higher-than-estimated losses for
the Hungary business and also cut our FY19 estimates by 25% to factor in
lower-than-estimated margins. Domestic industrial systems segment offers
strong business opportunity for CG Power (arising from Railway’s strong capex
plans); however, we would wait for the sale/closure of overseas T&D
businesses before revisiting our estimates. We maintain
Neutral
with a TP of
INR90 (20x FY20E EPS, in line with five-year average multiple).
(INR Million)
FY18
3Q
12,680
9.3
683
-10.9
5.4
252
350
250
0
331
73
22.0
258
258
-65.9
Quarterly performance (Standalone)
1Q
11,286
46.6
623
-608.1
5.5
238
252
359
-14
493
108
21.9
371
385
236.7
FY17
FY18
FY17
FY18
2Q
3Q
4Q
1QE
2Q
3QE
4QE
10,848 10,649 12,845 12,607 12,085 11,794 14,095 47,614 50,579
-5.7
1.1
6.6
11.7
11.4
10.8
9.7
12.7
6.2
846
838
814
653
771
871 1,058 3,120 2,304
-9.1
52.2
3.8
4.8
-8.8
3.9
30.0
-67
-68
7.8
7.9
6.3
5.2
6.4
7.4
7.5
6.6
4.6
227
235
217
229
265
262
252
917 1,009
357
471
558
525
541
536
574 1,638 2,177
710
585
350
428
615
454
325 2,004 1,875
-46
-359
-579
125
-189
-426
0
-998
-490
971
717
388
327
579
527
557 2,568
993
89
-103
-101
142
-2
10
128
-7
278
9.2 -14.4 -26.0
43.4
-0.3
1.8
23.1
-0.3
28.0
836
461
-90
310
392
92
428 1,245
225
881
820
489
185
581
518
428 2,575
715
27.9
8.8 -52.6
-51.9
-34.1
-36.8
-12.5
-3.8
-72.2
Sales
Change (%)
EBITDA
Change (%)
As of % Sales (Adj)
Depreciation
Interest
Other Income
Exceptional items (reported)
PBT
Tax
Effec. Tax Rate (%)
Reported PAT
Adj PAT
Change (%)
E: MOSL Estimates
vs Est
-7%
28%
60%
101%
14 February 2018
23

RESULTS
FLASH
Allcargo Logistic
BSE SENSEX
34,300
S&P CNX
10,540
13 February 2018
Results Flash | Sector: Logistics
CMP: INR197
TP: INR227 (+15%)
Buy
EBITDA miss driven by higher losses in P&E segment
Conference Call Details
Date:
14 February 2018
Time:
02:00pm IST
Dial-in details:
+91-22-39600619
th
Financials & Valuations (INR b)
Y/E March
2018E 2019E
Sales
65.0
73.9
EBITDA
4.5
5.2
Adj. PAT
2.7
3.3
Adj. EPS (INR)
10.9
13.3
EPS Gr. (%)
10.7
22.0
BV/Sh.(INR)
81.1
90.7
RoE (%)
14.1
15.4
RoCE (%)
12.3
13.4
Valuation
P/E (x)
18.1
14.8
P/BV (x)
2.4
2.2
EV/EBITDA (x)
11.0
8.7
2020E
83.7
5.9
3.8
15.3
15.5
101.6
15.9
13.9
12.8
1.9
7.0
Consolidated - Quarterly Earning Model
Y/E March
Net Sales
YoY Change (%)
EBITDA
Margins (%)
Depreciation
Interest
Other Income
PBT before EO expense
Extra-Ord expense
PBT
Tax
Rate (%)
Reported PAT
Min. Interest & P& L of Asso. Cos.
Adj PAT
YoY Change (%)
Margins (%)
E: MOSL Estimates
Allcargo’s 3QFY18 reported revenues at INR14.8b (est. INR 16.8b; +5%YoY,-
4% QoQ) led by 10% YoY growth in MTO revenues partially offset by decline
in P&E revenues.
Reported EBITDA at INR 933mn (est INR1.15b; -6% YoY,-11% QoQ). Lower
than estimated EBITDA is on account of EBIT loss from P&E segment due to
weak demand resulting in lower asset utilization. CFS margins were
impacted due to lease rentals of managing the CWC CFS in Mundra and
impact of direct port deliveries. However MTO segment reported healthy
EBIT growth of 29% YoY led by volume growth and margin expansion.
Reported EBITDA margin at 6.3% (vs. 7.0% in 3QFY17) vs est. of 6.8% due to
EBIT loss in P&E segment.
Other income declined 73% YoY to INR49mn.
PAT at INR348m (est. INR684m; -29% YoY, -46%QoQ) due to higher tax rate
at 38.7% for 3QFY18 vs 31% in 3QFY17.
Segmental performance:
MTO segment volumes increased 7% YoY to 1,44,646 TEU’s for
3QFY18.Revenue increased 10% YoY to INR13.3b due to volume growth
from across key markets . EBIT margins at 4.1% (flat QoQ/+0.6ppYoY).
CFS segment volumes declined 5% YoY to 71,764 TEU’s .Revenues declined
15%YoY to INR 945mn due to lower volumes and realizations. EBIT margin
increased ~1pp on YoY basis and declined 1pp on QoQ basis . The QoQ
decline in margins was due to impact of Direct Port Delivery and lease
rentals of Mundra CFS.
Project and Engineering segment revenues declined 36% YoY to INR713mn
due to decline in asset utilization on account of poor demand from wind
and power segment. Hence P&E reported EBIT loss of INR109mn.
Valuation and view:
The stock at CMP of INR197 trades at 14.8x/12.8x on
FY19/FY20E P/E. We maintain Buy with a target price of INR 227.
1Q
13,989
-5.2
1,332
9.5
436
75
59
880
0
880
256
29.1
624
-14
610
-24.6
4.4
FY17
2Q
3Q
14,084 14,114
-3.1
6.4
1,261
993
9.0
7.0
434
407
75
78
80
183
832
691
10
0
822
691
178
211
21.7
30.6
643
480
1
12
652
492
5.4
-15.2
4.6
3.5
4Q
13,628
-1.6
1,056
7.7
386
96
149
724
0
724
131
18.1
593
-20
572
-10.6
4.2
1Q
14,834
6.0
1,030
6.9
399
83
159
707
0
707
76
10.8
630
-19
611
0.2
4.1
FY18
2Q
15,472
9.9
1,047
6.8
398
71
51
629
0
629
6
1.0
623
15
638
-2.1
4.1
3Q
14,799
4.9
933
6.3
397
71
49
515
0
515
199
38.7
315
32
348
-29.3
2.3
(INR Million)
FY18
3QE Var (%)
16,844
-12.1
19.9
1,149
-18.8
6.8
400
-0.7
90
-21.7
100
-50.8
759
-32.2
0
759
-32.2
76
162.3
10.0
287.1
684
-53.9
-5
684
-49.1
27.7
4.1
14 February 2018
24

13 February 2018
3QFY18 Results Update | Sector: Healthcare
Shilpa Medicare
BSE SENSEX
34,300
Bloomberg
Equity Shares (m)
M.Cap.(INRb)/(USDb)
52-Week Range (INR)
1, 6, 12 Rel. Per (%)
Avg Val, INRm
Free float (%)
S&P CNX
10,540
CMP: INR509
TP: INR749 (+47% )
Buy
SLPA IN
80
40.8 / 0.6
749 / 474
-16/-21/-51
30.0
46.2
FY20E
12.2
3.0
2.7
33.4
26.1
183.7
15.2
2.8
19.9
16.6
One-offs led weak results; Outlook remains promising
Plant specific issue dragged overall sales growth:
Shilpa Medicare (SLPA)
delivered sales of INR1.9b (our est: INR2.4b), up 1.1% YoY. Lower US sales on
account of equipment specific issues dragged overall sales growth for the
quarter. In addition, it received lower development income for the quarter
as it has started its own filing. Onco-API growth momentum was maintained
for the quarter.
Higher raw material (RM) cost in CRAMS business impacted operating
margins for the quarter:
Hike in RM prices in CRAMS led gross margin to fall
by 205bp YoY to 50.8% in Q3FY18. Addition of employees in formulation led
higher employee cost (20% of sales against 17% of sales YoY). This resulted
in lower EBITDA margin of 14.7% (our est: 22.5%). Subdued operational
performance led 6% YoY reduction in PAT to INR164m (our Est: 428m).
US sales stable; yet to see pick-up in growth:
SLPA had US formulation sales
of ~INR250m in Q3FY18. SLPA continued to gain market share in g-Vidaza.
SLPA has filed 33 ANDAs on cumulative basis with only 2 approved till date.
Changes in estimates and Valuation view:
We have reduced our EPS
estimates by 26%/11%/11% for FY18E/19E/20E to factor 1) increased RM
prices in CRAMS and 2) deferment of US business due to inspection related
hurdle and equipment related issue. Accordingly, we have revised our price
target to INR749 (from INR797 earlier) by valuing at 25x 12m forward
earnings. Though Q3FY18 results were weak, we remain positive as SLPA has
robust ANDA pipeline for US market, which is the key growth driver, subject
to approval. Maintain Buy on potential upside of 47% from current levels.
(INR m)
FY17
2Q
3Q
2,113 1,836
21.1
-8.2
1,624 1,487
489
348
23.2
19.0
75
78
6
7
37
40
446
304
54
-37
0
0
391
340
124
97
24.7
36.1
-6
-4
382
175
382
175
52.4 -37.1
18.1
9.5
4Q
2,237
13.1
1,650
587
26.2
78
7
79
581
-7
45
633
147
27.8
-8
390
423
7.7
18.9
1Q
1,685
0.8
1,344
341
20.2
84
5
52
303
28
0
275
90
27.2
0
241
241
64.0
14.3
FY18E
2Q
3Q
2,040 1,855
-3.4
1.1
1,473 1,584
567
272
27.8
14.6
83
92
5
5
53
51
531
226
-76
-8
0
0
607
234
119
54
26.2
24.7
0
0
336
164
336
164
-12.2
-6.1
16.5
8.8
FY17
4QE
2,255
0.8
1,781
474
21.0
95
6
50
423
-6
0
429
87
21.0
0
329
329
-22.2
14.6
7,858
8.8
6,100
1,758
22.4
300
27
180
1,610
0
45
1,655
447
28.5
-27
1,091
1,123
6.2
14.3
FY18E
7,835
-0.3
6,182
1,653
21.1
354
21
205
1,483
(62)
0
1,420
351
24.7
0
1,067
1,067
-5.0
13.6
FY18
3QE
2,423
vs Est
(%)
-23.4
Financials & Valuations (INR b)
FY18E FY19E
Y/E Mar
Net Sales
7.8
10.0
EBITDA
1.7
2.4
PAT
1.1
2.1
EPS (INR)
13.3
26.5
Gr. (%)
-5.0
99.2
BV/Sh (INR)
127.0
152.1
P/E(x)
38.2
19.2
P/B (x)
4.0
3.3
ROE (%)
11.0
19.0
RoCE (%)
8.4
14.8
Estimate change
TP change
Rating change
Quarterly Performance (Consolidated)
1Q
1,672
11.7
1,339
333
19.9
70
7
24
280
-62
0
342
80
36.5
-9
147
147
-5.3
8.8
Net Sales
YoY Change (%)
Total Expenditure
EBITDA
Margins (%)
Depreciation
Interest
Other Income
PBT before EO expense
Share of profit/ (Loss) in Asso./ JV
Extra-Ord expense
PBT
Tax
Rate (%)
Minority Interest & P/L of Asso. Cos.
Reported PAT
Adj PAT
YoY Change (%)
Margins (%)
544
-50.1
480
-53.0
425
-45.0
428
428
-61.8
-61.8
14 February 2018
25

12 February 2018
3QFY18 Results Update | Sector: Capital Goods
Va Tech Wabag
Buy
BSE SENSEX
34,300
Bloomberg
Equity Shares (m)
M.Cap.(INRb)/(USDb)
52-Week Range (INR)
1, 6, 12 Rel. Per (%)
Avg Val, INRm
Free float (%)
S&P CNX
10,540
VATW IN
54.6
30.7 / 0.5
749 / 483
-9/-19/-6
111.0
75.3
CMP:INR562
TP:INR700 (+24%)
Operating performance below expectations; orders disappoint
A miss on estimates:
Consol. sales grew 20% YoY to INR8.7b, below our
estimate of INR9.3b. Revenue growth was supported by a pick-up in execution
of key orders like Petronas (Malaysia), Polghawela (Sri Lanka), Koyambedu
(Chennai), AP Genco and AMAS (Bahrain). Standalone sales rose 21% YoY to
INR4.6b, while subsidiary sales grew 20% YoY to INR4b. Consol. EBITDA fell 2%
YoY to INR0.8b, with the margin of 9% (-210bp YoY) below our estimate of
10.1%. Consol. recurring profit of INR300m too was below our estimate of
INR476m.
Order backlog down for first time in six quarters; L1 in INR19b of orders:
In
3QFY18, consol. order intake declined 74% YoY to INR3.2b, while order backlog
fell 14% YoY at INR65.2b. VATW is L1 in INR19b of orders, of which it targets to
convert 50% into orders in 4QFY18. Only one large order of INR1.3b – Toruk 4
desalination plant at Libya – was finalized during the quarter. Domestic
tendering/orders are picking up for projects like Namami Ganga, Mumbai STP
and the Chennai desalination plant.
Maintains FY18 sales, order guidance:
Management maintained its FY18
guidance of revenue of INR38b-40b (+25%) and order inflow of INR43b-45b
(+25%). Order guidance for FY18 implies ~INR25b in 4QFY18 – of this, INR10b
is from India, INR10b from GCC countries and INR3-4b from Europe.
Valuation view:
We cut FY18/19 estimates by 4/6% to factor in lower order
inflows and resultant execution over the next few years. We maintain
Buy
with
a TP of INR700 (18x FY20E EPS, in line with five-year average). We believe that
from the medium- to long-term perspective, VATW is in a sweet spot to take
advantage of a pick-up in domestic order inflows, led by state-driven municipal
orders, and central government schemes like Namami Gange, AMRUT, Swachh
Bharat and Smart Cities.
(INR Million)
4Q
11,317
33.3
1,317
16.9
11.6
52
161
3
1,108
326
29.5
24.1
757
16.2
0.0
757
15.8
1Q
6,686
15.2
418
52.2
6.3
45
133
20
259
160
61.7
15.6
84
61.5
0.0
84
61.5
FY18
2Q
3Q
8,865
8,647
14.0
20.4
827
777
41.4
-2.2
9.3
9.0
45
43
143
142
2
8
642
599
220
248
34.3
41.4
38.4
50.5
383
301
56.4 (1,274.2)
52.0
0.0
331
301
56.4 -1,274.2
FY17
FY18E
4QE
14,296 32,079 38,494
26.3
27.9
20.0
1,595 2,966 3,616
21.1
27.3
21.9
11.2
9.2
9.4
75
191
208
157
526
575
81
112
111
1,443 2,362 2,944
481
667 1,109
33.3
28.2
37.7
(81.1) 666.1
23.4
1,044 1,029 1,811
37.9
15.9
76.0
0.0
4.5
52.0
1,044 1,024 1,759
37.9
11.3
71.7
FY18
3Q
9,282
30.2
938
26.5
10.1
52
145
28
769
292
38.0
0.5
476
(14.5)
0.0
476
-14.5
Var.
Vs Est
-6.8%
-17.2%
Financials & Valuations (INR b)
Y/E Mar
2018E 2019E 2020E
Net Sales
38.5
37.0
38.9
EBITDA
3.6
3.8
4.1
PAT
1.8
1.9
2.1
EPS (INR)
33.2
34.8
38.4
Gr. (%)
76.0
4.9
10.3
BV/Sh (INR)
207.0 233.2 262.1
RoE (%)
17.1
15.8
15.5
RoCE (%)
16.1
15.1
14.8
P/E (x)
17.1
16.3
14.8
P/BV (x)
2.7
2.4
2.2
Estimate change
TP change
Rating change
Quarterly Performance (Consolidated)
Y/E March
Sales
Change (%)
EBITDA
Change (%)
As of % Sales
Depreciation
Interest
Other Income
PBT
Tax
Effective Tax Rate (%)
Minority Int
Adj PAT
Change (%)
Extra-ordinary Items
Reported PAT
Change (%)
1Q
5,803
27.6
275
-0.8
4.7
46
119
55
165
109
66.3
3.7
52
(155.7)
0.0
52
-155.5
FY17
2Q
3Q
7,776
7,183
31.3
17.7
585
794
25.7
80.6
7.5
11.1
47
46
109
137
19
35
448
646
186
45
41.6
6.9
16.7
626.5
245
-26
110.6 (112.3)
4.5
0.0
240
-26
109.8 -112.3
-22.0%
-36.9%
-36.9%
14 February 2018
26

December 2017 Results Preview | Sector: Automobiles
Endurance Technologies
Bloomberg
Equity Shares (m)
M. Cap. (INR b)/(USD b)
52-Week Range (INR)
1,6,12 Rel. Perf. (%)
ENDU IN
140.7
192 / 3
1397 / 555
2 / 48 / 111
CMP: INR1,365 TP: INR1,554(+14%)
Buy
Financial Snapshot (INR Billion)
Y/E March
2017 2018E 2019E 2020E
Sales
EBITDA
NP
Adj EPS (INR)
EPS Gr. (%)
BV/Sh. (INR)
RoE (%)
RoCE (%)
Valuations
P/E (x)
P/BV (x)
EV/EBITDA (x)
EV/Sales (x)
58.1
11.1
25.8
3.5
49.5
9.3
21.9
3.1
35.5
7.7
17.5
2.7
26.4
6.4
13.8
2.2
55.9
7.6
3.3
23.5
9.9
20.8
15.6
63.7
8.9
3.9
27.6
17.5
20.5
17.2
72.7
11.0
5.4
38.5
39.6
23.8
21.1
85.3
13.7
7.3
51.8
34.5
26.6
24.7
122.9 146.5 176.7 212.9
We expect 21.1% YoY growth (-1.3% QoQ) in consolidated
revenue to INR16b, led by strong performance in domestic as well
as exports segments.
Consolidated EBITDA is expected to grow 28.6% YoY (-1% QoQ),
led by healthy growth in the operating performance of both
Indian and European operations.
EBITDA margin is likely to improve ~80bp YoY (+10bp QoQ) to
14.2%.
We expect PAT to grow 33.8% YoY (flat QoQ) to INR995m.
The stock trades at 35.5x FY19E EPS and 26.4x FY20 EPS. Maintain
Buy.
Key issues to watch for
Update on supplies to HMSI and Hero MotoCorp.
Whether recovery in aftermarket is visible post GST.
EU business: Level of ramp-up at new plant in Germany.
Consolidated - Quarterly
Y/E March
INR m
Net Sales
YoY Change (%)
RM Cost (% of sales)
Staff Cost (% of sales)
Other Expenses (% of sales)
Total Expenditure
EBITDA
Margins (%)
Depreciation
Interest
Other Income
PBT
Tax
Eff. Tax Rate (%)
Minority Interest & P/L of Asso. Cos.
Adj. PAT
YoY Change (%)
1Q
14,402
13.3
58.4
9.8
18.9
12,537
1,865
13.0
684
104
89
1,166
286
24.5
0
880
15.2
FY17
2Q
3Q
14,482 13,203
7.5
2.4
57.8
57.8
8.9
10.5
19.4
18.3
12,474 11,434
2,008
1,769
13.9
13.4
699
741
81
88
54
73
1,281
1,014
388
271
30.3
26.7
0
0
893
743
14.8
13.6
4Q
13,803
4.8
57.4
9.9
18.9
11,905
1,898
13.8
781
49
119
1,186
351
29.6
0
835
3.3
1Q
15,503
7.6
59.0
9.5
17.6
13,367
2,136
13.8
742
57
60
1,397
432
30.9
0
965
9.7
FY18
2Q
3QE
16,204 15,991
11.9
21.1
59.3
58.8
8.6
9.2
18.0
17.8
13,912 13,715
2,292
2,276
14.1
14.2
768
790
69
65
62
90
1,517
1,511
520
516
34.3
34.2
0
0
997
995
11.6
33.8
4QE
15,981
15.8
59.1
9.4
17.8
13,783
2,198
13.8
836
67
108
1,404
481
34.3
0
923
10.5
(INR Million)
FY17
FY18E
55,880
6.8
57.7
9.8
19.0
48,325
7,555
13.5
2,905
322
319
4,646
1,343
28.9
0
3,303
9.9
63,679
14.0
59.1
9.2
17.8
54,776
8,902
14.0
3,137
257
321
5,829
1,949
33.4
0
3,880
17.5
14 February 2018
27

December 2017 Results Preview | Sector: Logistics
Gateway Distriparks
Bloomberg
Equity Shares (m)
M. Cap. (INR b)/(USD b)
52-Week Range (INR)
1,6,12 Rel Perf. (%)
GDPL IN
108.6
25 / 0
292 / 211
-8 / -18 / -33
CMP: INR234
TP: INR282 (+21%)
Buy
Financial snapshot (INR b)
Y/E March
2017 2018E 2019E 2020E
Sales
EBITDA
NP
EPS (INR)
EPS Gr. (%)
BV/Sh (INR)
RoE (%)
RoCE (%)
Payout (%)
Valuations
P/E (x)
P/BV (x)
EV/EBITDA (x)
Div. Yield (%)
34.4
2.5
11.8
3.0
26.5
2.4
11.3
1.9
12.7
2.2
7.4
3.7
11.0
2.0
6.1
4.5
11.6
2.2
0.7
6.8
-32.3
93.6
7.3
10.0
120.7
12.0
2.3
1.0
8.8
13.6
3.5
2.0
18.4
15.5
4.1
2.3
21.3
11.3
19.4
21.8
58.3
21.8 129.4
9.2
10.8
60.6
18.2
19.4
55.3
We expect GDPL to report net sales of INR3b (+7% YoY, +2% QoQ),
led by higher volumes in the rail business.
We estimate EBITDA at INR621m (+6% YoY, +6% QoQ) and EBITDA
margin at 20.1%. We estimate adjusted PAT at INR253m (+24%
YoY, +38% QoQ).
The stock trades at 12.7x FY19E P/E of INR12.2 and 7.4x FY19E
EV/EBITDA.
GDPL remains a direct play on the upcoming dedicated freight
corridor project, which will multiply its asset turnover and
significantly improve profitability. Maintain Buy.
97.1 105.3 114.2
Key issues to watch for
Volume growth, realization and per TEU profitability.
Quarterly Performance
Y/E March
FY17
FY18
(Consolidated)
1Q*
2Q*
3Q*
4Q*
1Q*
2Q*
3QE
Net Sales
2,782
2,857
2,876
3,077
2,661
3,023
3,089
YoY Change (%)
5.9
10.1
7.7
19.5
-4.4
5.8
7.4
Total Expenditure
2,227
2,276
2,289
2,554
2,211
2,436
2,468
EBITDA
555
581
587
523
450
587
621
Margins (%)
19.9
20.3
20.4
17.0
16.9
19.4
20.1
PBT
349
379
403
332
229
364
398
Tax
124
127
146
109
49
74
77
Rate (%)
35.6
33.6
36.2
32.8
21.5
20.4
19.4
PAT before minority / profit of assoc.
225
252
257
223
180
290
320
YoY Change (%)
13.0
-15.0
-11.9
-5.6
-20.1
15.2
24.7
Margins (%)
8.1
8.8
8.9
7.3
6.8
9.6
10.4
Less: Minority/Add: Profit of Asso.
39
79
54
31
47
107
67
Reported PAT
186
173
203
192
133
183
253
Adj PAT
186
173
203
192
133
183
253
YoY Change (%)
-47.8
-43.5
-34.3
-27.5
-28.7
5.8
24.5
Margins (%)
6.7
6.0
7.1
6.2
5.0
6.0
8.2
E: MOSL Estimates, *Indicates addition of Rail and CFS details as provided and not actual consolidated number
4QE
3,194
3.8
2,538
656
20.5
486
94
19.4
392
75.5
12.3
48
344
344
79.1
10.8
(INR Million)
FY17
FY18E
11,592
10.7
9,346
2,246
19.4
1,463
506
34.6
957
-6.5
8.3
203
754
754
-31.2
6.5
11,967
3.2
9,653
2,314
19.3
1,516
295
19.4
1,182
23.5
9.9
270
952
952
26.2
8.0
14 February 2018
28

December 2017 Results Preview | Sector: Cement
Grasim Industries
Bloomberg
Equity Shares (m)
M. Cap. (INR b)/(USD b)
52-Week Range (INR)
1,6,12 Rel Perf. (%)
GRASIM IN
466.8
527 / 8
1300 / 699
-5 / -3 / 29
CMP: INR1,129 TP: INR1,286 (+14%)
Neutral
Financial Snapshot (INR Billion)
Y/E March
2017 2018E 2019E 2020E
Sales
EBITDA
Adj. PAT
Adj. EPS (INR)
EPS Gr. (%)
BV/Sh. (INR)
RoE (%)
RoCE (%)
Payout (%)
360.7 449.4 551.3 616.0
73.9
31.7
67.8
28.3
10.8
12.2
7.8
97.5 127.9 148.4
38.3
20.8
11.5
11.9
6.1
54.5
42.5
14.5
13.3
4.3
62.3
14.3
14.4
14.0
3.8
81.9 116.8 133.5
We expect VSF volumes to increase 10% YoY to 134,200 tons in
3QFY18, while realizations are expected to rise 9% YoY to
INR149,808/ton. Standalone revenues are likely to increase 20%
YoY to INR30.2b.
Standalone EBITDA margin is estimated at 25.9% (+4.43pp YoY,
+6.48pp QoQ).
EBITDA is estimated to increase 45% YoY to INR7.84b, translating
into PAT of INR4.3b (+30% YoY). Neutral.
672.3 749.3 861.0 989.5
Key issues to watch for
Pick-up in cement demand and pricing thereon.
Outlook on VSF business, and strategy to utilize upcoming
capacities globally.
Impact of demonetization on caustic soda demand.
Quarterly Performance (Standalone)
Y/E March
(Standalone)
VSF Volume (ton)
YoY Change (%)
VSF Realization (INR/ton)
YoY Change (%)
QoQ Change (%)
Net Sales
YoY Change (%)
EBITDA
Margins (%)
Depreciation
Interest
Other Income
PBT before EO Items
Extraordinary Inc/(Exp)
PBT after EO Items
Tax
Rate (%)
Reported PAT
Adj. PAT
Margins (%)
YoY Change (%)
E: MOSL Estimates
1Q
121,000
17.8
128,039
13.0
1.5
23,959
23.8
5,078
21.2
1,104
231
781
4,525
0
4,525
1,317
29.1
3,209
3,209
13.4
251.6
FY17
2Q
3Q
123,994 122,000
9.00
1.08
130,713 137,438
12.0
9.0
2.1
5.1
24,887
25,260
17.4
9.7
5,301
5,428
21.3
21.5
1,119
1,106
156
107
3,587
553
7,612
4,769
0
0
7,612
4,769
1,690
1,455
22.2
30.5
5,923
3,314
5,923
3,314
23.8
13.1
55.2
21.9
4Q
133,000
2.31
139,960
11.0
1.8
28,761
13.1
5,254
18.3
1,133
83
304
4,343
0
4,343
1,188
27.4
3,155
3,155
11.0
72.7
1Q
121,000
0.00
142,124
11.0
1.5
27,403
14.4
5,553
20.3
1,103
73
658
5,036
0
5,036
1,564
31.1
3,472
3,472
12.7
8.2
FY18
2Q
3QE
134,000 134,200
8.07
10.00
137,249 149,808
5.0
9.0
-3.4
9.2
40,373
30,270
62.2
19.8
7,852
7,847
19.4
25.9
1,664
1,700
427
440
2,688
450
8,449
6,157
-540
0
7,909
6,157
2,164
1,847
27.4
30.0
5,745
4,310
6,137
4,310
15.2
14.2
3.6
30.1
4QE
115,794
-12.94
145,558
4.0
-2.8
10,753
-62.6
8,335
77.5
1,695
393
1,204
7,451
0
7,451
2,553
34.3
4,898
4,898
45.6
55.3
(INR Million)
FY17
499,994
6.8
135,837
11.6
103,457
15.3
21,548
20.8
4,461
576
4,739
21,249
0
21,249
5,649
26.6
15,600
15,600
15.1
57.0
FY18E
504,994
1.0
143,685
5.8
108,798
5.2
29,587
27.2
6,161
1,333
5,000
27,093
0
27,093
8,128
30.0
18,965
18,965
17.4
21.6
14 February 2018
29

December 2017 Results Preview | Sector: Textiles
Indo Count Industries
Bloomberg
Equity Shares (m)
M. Cap. (INR b)/(USD b)
52-Week Range (INR)
1,6,12 Rel Perf. (%)
Financial Snapshot (INR Billion)
Y/E March
Sales
EBITDA
NP
EPS (INR)
EPS Gr. (%)
BV/Sh. (INR)
RoE (%)
RoCE (%)
Valuations
P/E (x)
P/BV (x)
EV/EBITDA (x)
EV/Sales (x)
9.2
2.8
5.8
1.1
14.8
2.3
7.6
1.1
11.1
1.9
5.9
1.0
9.6
1.6
5.1
0.9
2017 2018E 2019E 2020E
22.6
4.3
2.6
13.0
-10.7
42.9
34.8
26.5
21.0
3.2
1.6
8.0
-38.2
51.9
17.0
15.2
23.0
3.9
2.1
10.7
32.9
63.9
18.5
17.3
25.0
4.4
2.4
12.4
15.8
75.0
17.8
26.4
ICNT IN
197.4
39 / 1
216 / 135
18 / 29 / -20
CMP: INR119
TP: INR128 (+8%)
Neutral
We expect revenue to grow 6% YoY (+8% QoQ) to INR5,331m in
3QFY18, as the industry is expected to witness the
commencement of restocking post GST.
EBITDA margin is likely to contract 340bp YoY to 16.9%, and
EBITDA is likely to de-grow 12% YoY to INR901m.
PAT is expected to de-grow 17.2% YoY to INR465m in 3QFY18.
Neutral.
Key things to watch for
Movement in raw material prices, as cotton prices are expected to
soften.
Benefit on account of marginal increase in ROSL and other incentives.
Standalone - Quarterly Earning Model
Y/E March
Net Sales
YoY Change (%)
Total Expenditure
EBITDA
Margins (%)
Depreciation
Interest
Other Income
PBT
Tax
Rate (%)
Reported PAT
Adj PAT
YoY Change (%)
Margins (%)
E: MOSL Estimates
1Q
4,926
7.6
3,824
1,103
22.4
80
98
0
924
321
34.8
603
603
15.6
12.2
FY17
2Q
5,763
0.0
4,599
1,164
20.2
73
116
0
975
348
35.7
627
627
21.5
10.9
3Q
5,029
0.4
4,009
1,020
20.3
79
91
0
849
287
33.8
562
562
-27.3
11.2
4Q
5,129
-0.1
4,228
901
17.6
79
89
0
733
245
33.4
488
488
-28.1
9.5
1Q
4,318
-12.4
3,665
653
15.1
75
82
0
496
177
35.6
320
320
-47.0
7.4
FY18
2Q
4,928
-14.5
4,216
711
14.4
76
88
0
548
189
34.5
359
359
-42.8
7.3
FY17
3QE
5,331
6.0
4,430
901
16.9
110
90
0
701
235
33.6
465
465
-17.2
8.7
4QE
5,642
10.0
4,756
886
15.7
105
90
0
691
229
33.1
462
462
-5.3
8.2
22,578
7.0
18,294
4,285
19.0
331
421
0
3,532
965
27.3
2,567
2,567
-10.7
11.4
FY18E
21,020
-6.9
17,867
3,153
15.0
395
342
0
2,416
829
34.3
1,587
1,587
-38.2
7.6
14 February 2018
30

December 2017 Results Preview | Sector: Infrastructure
KNR
Constructions
Bloomberg
Equity Shares (m)
M. Cap. (INR b)/(USD b)
52-Week Range (INR)
1,6,12 Rel Perf. (%)
KNRC IN
140.6
44 / 1
349 / 166
13 / 43 / 58
CMP: INR313
TP: INR325 (+4%)
Buy
Financial Snapshot (INR b)
2017 2018E 2019E 2020E
Y/E March
Net Sales
EBITDA
NP
EPS (INR)
EPS Gr. (%)
BV/Sh (INR)
RoE (%)
RoCE (%)
Valuations
P/E (x)
P/BV (x)
EV/EBITDA (x)
26.2
4.9
19.6
23.5
4.1
15.0
21.5
3.5
13.2
19.6
3.0
11.0
15.4
2.3
1.7
12.0
4.3
63.7
20.7
16.8
18.0
3.0
1.9
13.3
11.5
75.7
19.1
16.9
20.7
3.3
2.0
14.5
9.0
90.0
17.5
16.5
25.0
3.9
2.2
16.0
10.0
105.8
16.3
16.3
We expect revenue growth of 12.5% YoY to INR4.3b, driven by
execution of key projects like Hubli Hospet, Madurai and
Thiruvanthpuram.
Operating profit is expected to grow 18%, led by margin
improvement of 70bp YoY to 15.8%.
Operating margin improvement is expected to be led by the
Madurai and Thirvanthpuram projects, which are in advanced
stages of completion.
Net profit is expected to decline 11% YoY on account of higher tax
rate assumption for the quarter at 20%, as against 9% in 3QFY17.
Maintain
Buy.
Key issues to watch
Management commentary on order inflow for the year and ahead.
Standalone - Quarterly Earning Model
Y/E March
Net Sales
YoY Change (%)
Total Expenditure
EBITDA
Margins (%)
Depreciation
Interest
Other Income
PBT before EO expense
PBT
Tax
Rate (%)
Reported PAT
Adj PAT
YoY Change (%)
Margins (%)
1Q
3,032
77.1
2,595
437
14.4
132
43
59
321
265
19
7.1
246
302
101.6
10.0
FY17
2Q
3Q
3,735
3,823
72.2
74.9
3,175
3,246
560
577
15.0
15.1
146
166
56
66
132
102
490
447
490
338
51
32
10.3
9.4
439
306
439
415
-20.6
26.5
11.8
10.9
4Q
4,821
63.0
4,099
722
15.0
195
54
10
483
483
-41
-8.6
524
524
-9.5
10.9
1Q
4,807
58.6
3,962
845
17.6
244
52
123
672
672
-4
-0.6
676
676
123.7
14.1
FY18
2Q
3QE
3,933
4,300
5.3
12.5
3,109
3,620
825
680
21.0
15.8
235
235
43
60
27
76
574
461
574
461
-17
92
-2.9
20.0
591
369
591
369
34.5
-11.2
15.0
8.6
FY17E
4QE
4,965
3.0
4,362
603
12.1
214
90
78
376
376
137
36.3
240
240
-54.3
4.8
15,411
70.7
13,115
2,296
14.9
639
219
303
1,741
1,576
60
3.8
1,516
1,674
-17.2
10.9
FY18E
18,006
16.8
15,053
2,953
16.4
928
244
303
2,083
2,083
208
10.0
1,875
1,875
12.0
10.4
14 February 2018
31

December 2017 Results Preview | Consumer
Nestle India
Bloomberg
Equity Shares (m)
M. Cap. (INR b)/(USD b)
52-Week Range (INR)
1,6,12 Rel Perf. (%)
NEST IN
96.4
757 / 12
8001 / 5800
-1 / 8 / 3
CMP: INR7,855 TP: INR8,173 (+4%)
Neutral
Financial Snapshot (INR b)
Y/E December
2016 2017E 2018E 2019E
Sales
EBITDA
Adj. PAT
Adj. EPS (INR)
EPS Gr. (%)
BV/Sh.(INR)
RoE (%)
RoCE (%)
Payout (%)
Valuations
P/E (x)
P/BV (x)
EV/EBITDA (x)
Div. Yield (%)
63.5
25.1
37.2
0.8
61.1
22.7
35.2
0.9
53.5
20.6
31.1
1.0
44.2
18.2
26.2
1.2
90.8
19.7
11.9
3.2
40.9
42.7
53.4
97.8 109.5 125.0
20.7
12.4
4.0
39.1
40.6
56.2
23.0
14.2
14.2
40.4
41.6
56.9
27.0
17.1
20.9
43.7
44.5
55.7
We expect Nestle India’s net sales to grow 7.5% YoY to INR25b in
4QCY17.
Gross margins are likely to contract 100bp YoY to 56.6%.
We expect EBITDA margin to expand by 220bp YoY to 19.2%.
EBITDA and adj. PAT are projected to grow by 19.2% YoY (to
INR5.8b) and 17.8% YoY (to INR3.5b), respectively.
The stock trades at 44.2x CY19E EPS of INR177.7; maintain
Neutral.
123.7 128.6 146.9 177.7
312.6 345.5 382.2 431.4
Key issues to watch for
Volume trends and management commentary on demand
environment.
Further recovery in sales and market share of Maggi.
Response to new product/variant launches.
Raw material price outlook.
Quarterly performance
Y/E December
1Q
22,770
Net Sales
YoY Change (%)
COGS
9,872
9,495
9,860
9,601
Gross Profit
12,898
12,837
13,392
12,808
Margin (%)
56.6
57.5
57.6
57.2
Operating Exp
7,375
8,119
8,548
8,242
EBITDA
5,523
4,718
4,844
4,566
Margins (%)
24.3
21.1
20.8
20.4
YoY Growth (%)
69.5
30.8
Depreciation
891
889
883
873
Interest
259
220
220
210
Other income
421
524
547
668
PBT
4,793
4,132
4,289
4,150
Tax
1,722
1,288
1,321
1,332
Rate (%)
35.9
31.2
30.8
32.1
Adjusted PAT
3,071
2,844
2,968
2,818
YoY Change (%)
22.5
80.0
35.1
Note: Quarterly numbers are adjusted for Ind-AS changes E: MOSL Estimates
CY16
2Q
3Q
22,332
23,252
4Q
22,410
1Q
24,757
8.7
10,939
13,818
55.8
8,708
5,110
20.6
-7.5
867
228
578
4,593
1,468
32.0
3,126
1.8
CY17
2Q
23,865
6.9
10,791
13,075
54.8
8,645
4,430
18.6
-6.1
854
229
569
3,915
1,408
36.0
2,507
-11.8
CY16
3Q
25,007
7.5
10,847
14,160
56.6
8,388
5,773
23.1
19.2
864
229
564
5,244
1,746
33.3
3,498
17.8
4QE
24,206
8.0
10,552
13,655
56.4
8,311
5,343
22.1
17.0
829
245
486
4,755
1,485
31.2
3,270
16.0
90,764
11.7
38,828
51,936
57.2
32,284
19,652
21.7
23.2
3,537
909
2,159
17,365
5,440
31.3
11,924
22.2
CY17E
97,835
7.8
43,128
54,707
55.9
34,052
20,655
21.1
5.1
3,414
930
2,197
18,508
6,108
33.0
12,400
4.0
14 February 2018
32

December 2017 Results Preview | Sector: Media
Prime Focus
Bloomberg
Equity Shares (m)
M. Cap. (INR b)/(USD b)
52-Week Range (INR)
1,6,12 Rel Perf. (%)
PRIF IN
298.9
38 / 1
134 / 64
27 / 10 / 59
CMP: INR128
TP: INR148 (+15%)
Buy
Financial Snapshot (INR Billion)
Y/E MARCH
2017 2018E 2019E 2020E
Net Sales
21.5 24.7 28.4 32.8
EBITDA
4.8
5.5
6.5
7.8
Adj. Net Profit
0.4
1.0
1.8
2.7
Adj. EPS (INR)
1.2
3.2
6.1
9.2
Adj. EPS Gr. (%) -255.8 164.0 90.5 49.1
BV/Sh (INR)
18.6 21.8 28.0 37.2
RoE (%)
7.6 15.9 24.7 28.1
RoCE (%)
8.3 10.0 14.5 18.3
Valuations
P/E (x)
P/BV (x)
EV/EBITDA (x)
104.8
6.9
10.9
39.7
5.9
9.1
20.8
4.6
7.1
14.0
3.4
5.5
We expect consolidated revenue to grow 20% YoY to INR6.1b.
We expect EBITDA to reach INR1.4b (+13% YoY) and margin to
reach 22.7%.
We estimate net profit at INR258m, up 14% YoY.
The stock trades at 9.1x FY18E and 7.1x FY19E EBITDA. Maintain
Buy.
Key things to watch for
Consolidated revenue (we expect 20% YoY growth).
EBITDA margin (we expect 22.1%).
Consolidated - Quarterly Earning Model
Y/E March
Net Sales
YoY Change (%)
Total Expenditure
EBITDA
Margins (%)
Depreciation
Interest
Other Income
ESOP expense
Foreign exchange gain/(loss)
PBT before EO expense
Extra-Ord expense
PBT
Tax
Rate (%)
MI & P/L of Asso. Cos.
Reported PAT
Adj PAT
YoY Change (%)
Margins (%)
E: MOSL Estimates
1Q
5,262
1.5
4,246
1,016
19.3
690
303
13
6
10
40
-1,019
1,059
6
0.6
31
1,022
9
NM
0.2
FY17
2Q
3Q
4,665
5,072
4.0
8.3
3,925
3,849
740
1,223
15.9
24.1
701
653
325
229
172
8
53
113
-96
8
-264
244
41
0
-305
244
90
-38
-29.3
-15.4
-34
55
-361
227
-308
227
NM
NM
-6.6
4.5
4Q
1Q
6,537
5,135
40.4
-2.4
4,748
4,102
1,790
1,033
27.4
20.1
502
645
421
376
52
85
84
115
-336
22
498
2
9
0
489
2
32
-28
6.5 -1,212.4
71
21
387
10
395
10
NM
4.8
6.0
0.2
FY18
2Q
3QE
5,473
6,102
17.3
20.3
4,265
4,717
1,207
1,385
22.1
22.7
708
724
362
235
65
14
139
123
149
50
211
367
0
0
211
367
-8
94
-3.9
25.6
41
15
178
258
178
258
LP
13.6
3.2
4.2
FY17
4QE
7,953
21.7
6,084
1,869
23.5
833
235
14
123
50
742
0
742
207
27.9
15
520
520
31.5
6.5
21,536
13.3
16,767
4,769
22.1
2,546
1,279
245
256
-414
519
-968
1,487
90
6.0
123
1,274
365
NM
1.7
(INR m)
FY18E
24,662
14.5
19,169
5,493
22.3
2,911
1,208
178
500
270
1,322
0
1,322
264
20.0
93
964
964
164.6
3.9
14 February 2018
33

December 2017 Results Preview | Sector: Financials
Repco Home Finance
Bloomberg
Equity Shares (m)
M. Cap. (INR b)/(USD b)
52-Week Range (INR)
1,6,12 Rel Perf. (%)
REPCO IN
62.6
43 / 1
923 / 551
10 / -23 / -5
CMP: INR693
TP: INR800 (+15%)
Buy
Financial Snapshot (INR b)
Y/E March
NII
PPP
PAT
EPS (INR)
BV/Sh. (INR)
RoAA (%)
RoE (%)
Payout (%)
Valuation
P/E (x)
P/BV (x)
Div. Yield (%)
23.4
3.7
0.3
18.9
3.2
0.3
16.2
2.7
0.4
13.6
2.3
0.4
2017 2018E 2019E 2020E
3.7
3.3
1.8
29.1
2.2
17.4
0.0
4.5
4.1
2.3
36.0
2.3
18.1
7.1
5.1
4.7
2.6
41.9
2.3
17.9
7.0
6.1
5.6
3.1
50.0
181.8 215.2 254.2 300.7
2.3
18.0
7.0
Our interaction at the ground level suggests that the issues
related to property registration in Tamil Nadu have been
addressed. Hence, we expect loan growth to pick up from 10% in
the prior quarter to 13% in 3QFY18.
Calculated margins are likely to expand 60bp YoY to 5.1% on
account of a decline in cost of funds. As a result, NII growth will
be 26% YoY.
C/I ratio is expected to decline almost 200bp YoY to 14.9%.
GNPL is expected to improve seasonally. Hence, provisions are
expected to be INR168m (flat sequentially).
The stock trades at 3.2x FY18E and 2.7x FY19E BV. Maintain Buy.
Key issues to watch for
Sand price trends in TN.
Competitive environment and prepayments by borrowers.
Business outlook, loan growth, and share of home loans and
LAP.
Movement in borrowing costs and margins.
Asset quality trends in the LAP segment.
Quarterly performance
Y/E March
Interest Income
Interest Expenses
Net Interest Income
YoY Growth (%)
Other income
Total Income
YoY Growth (%)
Operating Expenses
YoY Growth (%)
Operating Profits
YoY Growth (%)
Provisions
Profit before Tax
Tax Provisions
Profit after tax
YoY Growth (%)
Borrowings growth (%)
Cost to Income Ratio (%)
Tax Rate (%)
E: MOSL Estimates
1Q
2,390
1,550
840
26.5
80
920
26.0
149
-3.5
771
33.9
179
592
196
395
30.8
25.3
16.2
33.2
FY17
2Q
3Q
2,499
2,589
1,597
1,682
902
907
22.0
16.2
98
67
1,000
974
22.0
15.5
163
163
-6.8
1.9
837
811
29.9
18.7
127
96
710
714
253
250
457
464
17.0
20.4
22.6
21.1
16.3
16.8
35.7
35.0
4Q
2,663
1,635
1,028
20.7
73
1,102
16.8
200
30.7
902
14.1
116
786
280
506
19.8
15.6
18.2
35.6
1Q
2,587
1,628
959
14.2
71
1,030
12.0
171
14.9
859
11.4
167
692
241
452
14.2
11.7
16.6
34.8
FY18
2Q
2,715
1,622
1,093
21.2
95
1,188
18.8
179
9.4
1,009
20.6
166
843
285
559
22.3
8.9
15.0
33.7
FY17
3Q
2,796
1,641
1,155
27.4
70
1,225
25.8
183
12.0
1,042
28.5
168
874
302
572
23.3
11.0
14.9
34.5
4Q
2,986
1,702
1,284
24.8
82
1,366
24.0
194
-3.0
1,172
30.0
156
1,016
348
668
32.1
15.3
14.2
34.3
10,140
6,463
3,677
21.1
319
3,996
19.8
676
5.1
3,320
23.3
519
2,802
979
1,823
21.4
15.6
16.9
35.0
(INR m)
FY18E
11,084
6,593
4,491
22.1
318
4,809
20.4
727
7.5
4,082
23.0
656
3,426
1,175
2,251
23.5
0.0
15.1
34.3
14 February 2018
34

December 2017 Results Preview | Healthcare
Sun Pharma
Bloomberg
Equity Shares (m)
M. Cap. (INR b)/(USD b)
52-Week Range (INR)
1,6,12 Rel Perf. (%)
SUNP IN
2399.3
1233 / 19
728 / 433
5 / -5 / -37
CMP: INR569
TP:INR610 (+7%)
Buy
Financial Snapshot (INR Billion)
Y/E MARCH
2017 2018E 2019E 2020E
Sales
EBITDA
NP
EPS (INR)
EPS Gro. (%)
BV/Sh. (INR)
RoE (%)
RoCE (%)
Valuations
P/E (x)
P/BV (x)
EV/EBITDA
(x)
D.Yield (%)
21.8
3.7
14.7
0.6
39.2
3.6
22.9
1.1
25.8
3.3
15.7
1.1
20.7
2.9
12.1
1.1
302.6
87.8
69.6
28.9
48.0
152.3
18.1
19.0
267.5
54.9
34.9
14.5
-49.9
159.8
9.3
9.5
309.7
77.4
53.1
22.1
52.0
174.9
13.2
13.6
357.5
96.9
66.1
27.5
24.6
195.4
14.9
16.0
Sun Pharmaceuticals (SUNP) is likely to register decline in
revenues by 12.5% YoY to INR67.3b, primarily on the back of a
decrease in US business by ~34% to INR22.4b.
India business is expected to grow 14% YoY, while the Row and
API business are expected to grow 5% YoY and 2% YoY,
respectively.
SUNP’s EBITDA is expected to decline ~37% YoY to INR114.1b,
with margin contraction of ~790p to 21% due to pricing pressure
and increased competition in the US market.
PAT is expected to decline 38% YoY to INR9.1b due to the decline
in EBITDA margin.
We expect the stock to remain under pressure in the near term due
to challenges related to growth and margins. We maintain Buy with
a TP of INR610, based on 24x 1HFY20E. we expect recovery from
FY19 as earnings bounce back, Halol resolution happens and
visibility of specialty business monetization improves.
Key issues to watch out
Update on resolution of USFDA warning letter and 483 observations on
Halol.
Turnaround of Ranbaxy’s business.
Outlook on competitive landscape for Taro’s products.
Quarterly Performance
Y/E March
FY17
FY18E
3QE
67,266
-12.5
53,140
14,126
21.0
3,550
1,350
11,926
0
11,926
1,789
15.0
10,137
1,000
9,137
-37.9
1Q
2Q
3Q
4Q
1Q
2Q
Net Revenues
80,067 77,640 76,832 68,252 61,667 65,901
YoY Change (%)
18.4
13.0
8.5
-10.6
-23.0
-15.1
Total Expenditure
53,220 50,974 54,595 55,895 51,131 52,747
EBITDA
26,847 26,666 22,237 12,357 10,535 13,153
Margins (%)
33.5
34.3
28.9
18.1
17.1
20.0
Depreciation
3,160
3,038
3,068
3,382
3,466
3,587
Net Other Income
2,588
5,668
1,851
4,913
847
1,577
PBT before EO Exp
26,275 29,295 21,020 13,888
7,916 11,144
EO Exp/(Inc)
0
0
0
0
9,505
0
PBT
26,275 29,295 21,020 13,888
-1,589 11,144
Tax
3,527
4,417
3,729
443
1,618
1,114
Rate (%)
13.4
15.1
17.7
3.2
20.4
10.0
PAT (pre Minority Interest)
22,748 24,879 17,291 13,445
-3,207 10,030
Minority Interest
2,411
2,528
2,573
1,208
1,042
908
Reported PAT
20,337 22,351 14,718 12,237
-4,249
9,121
YoY Change (%)
265.8
117.3
3.9
-28.6
-120.9
-59.2
E: MOSL Estimates; * Quarterly no. don’t match with annual no. because of reinstatement of financials
(INR Million)
FY17
FY18E
4QE
72,678 302,642 267,511
6.5
7.1
-11.6
55,603 214,892 212,622
17,075 87,751 54,889
23.5
29.0
20.5
3,497 12,648 14,100
1,226 15,376
5,000
14,804 90,479 45,789
0
0
0
14,804 90,479 45,789
2,348 12,116
6,868
15.9
13.4
15.0
12,456 78,363 38,921
1,049
8,719
4,000
11,407 69,644 34,921
-6.8
28.9
-49.9
14 February 2018
35

December 2017 Results Preview | Utilities
Tata Power
Bloomberg
Equity Shares (m)
M. Cap. (INR b)/(USD b)
52-Week Range (INR)
1,6,12 Rel Perf. (%)
TPWR IN
2705.0
273 / 4
102 / 75
9 / 17 / 6
CMP: INR100
TP: INR73 (-12%)
Sell
Financial Snapshot (INR Million)
y/e march
2017 2018E 2019E 2020E
Sales
EBITDA
NP
EPS (INR)
EPS Gr. (%)
BV/Sh. (INR )
RoE (%)
RoCE (%)
Payout (%)
VALUATION
279.0
58.5
14.0
5.2
83.8
43.5
11.9
6.8
0.0
19.5
2.3
0.0
312.5
66.6
20.0
7.4
43.0
47.7
16.2
6.0
17.6
13.7
2.1
1.3
325.1
72.7
22.4
8.3
12.2
56.2
15.9
6.6
15.7
12.2
1.8
1.3
340.4
73.4
23.1
8.5
3.1
61.7
14.5
6.5
15.2
11.8
1.6
1.3
We expect Tata Power’s PAT to decline ~9% YoY (up 45% YoY) to
INR5.6b, driven by an increase in coal prices, offset by higher
losses at Mundra, higher tax rate and a stronger base due to one-
off income of INR2.5b in previous year .
We expect fuel cost under-recovery at Mundra of INR0.9/kWh,
driven by higher coal prices.
We estimate PAT of coal companies to increase by ~49% YoY to
INR3.6b, driven by higher realization. Sell.
P/E (x)
P/BV (x)
Div. Yield (%)
Key issues to watch for
Cost control at Mundra.
Performance at Delhi.
Consolidated performance
Y/E March
Net Sales
YoY Change (%)
Total Expenditure
EBITDA
Margins (%)
Depreciation
Interest
Other Income
Rate regulated activity
PBT before EO expense
Extra-Ord expense
PBT
Tax
Rate (%)
Minority Interest & P/L of Asso. Cos.
Reported PAT
Adj PAT
1Q
68,383
-24.9
52,028
16,355
23.9
4,393
7,915
-477
-2,721
849
0
849
1,449
170.6
1,324
725
725
FY17
2Q
3Q
72,089 66,837
-23.8
-27.6
57,473 52,809
14,616 14,029
20.3
21.0
4,476
5,318
7,243
7,010
1,029
-792
-3,064
1,523
862
2,432
0
0
862
2,432
-1,117
706
-129.6
29.0
1,383
4,356
3,362
6,082
3,362
6,082
4Q
71,668
-23.2
58,201
13,467
18.8
5,698
8,973
2,262
-1,832
-775
-6,515
-7,289
-1,496
20.5
3,169
-2,625
3,890
1Q
69,686
1.9
51,375
18,311
26.3
5,857
9,286
313
-2,438
1,044
0
1,044
2,630
252.0
3,224
1,638
1,638
FY18
2Q
3QE
76,573 78,104
6.2
16.9
58,075 60,933
18,498 17,172
24.2
22.0
5,900
5,930
9,814
9,716
1,331
1,000
-2,641
0
1,474
2,527
-1,488
0
-15
2,527
1,553
1,105
-
44
3,909
4,136
2,342
5,557
3,830
5,557
(INR Million)
FY17
FY18E
4QE
88,109
22.9
75,447
12,662
14.4
5,891
6,665
-1,232
5,079
3,953
0
3,953
-868
-21.9
4,124
8,945
8,945
278,977
-5.4
220,510
58,467
21.0
19,886
31,140
2,022
-6,095
3,369
-6,515
-3,145
-458
14.6
10,142
7,455
13,969
312,473
12.0
245,830
66,643
21.3
23,577
35,481
1,412
8,997
-1,488
7,509
4,420
58.9
15,392
18,482
19,970
14 February 2018
36

In conversation
1. MARICO : Want to maximise volume growth & market share;
Saugata Gupta, MD & CEO
In value added hair oils, grew 8 percent in volume. Ex-CSD component, it is
double-digit growth. Certain issues with respect to CSD in terms of stocking and
changing of policies but anniversarisation of that will happen sometime in either
next quarter or Q1 of next year. Post anniversarisation, will move back to a
decent growth in CSD. Will be clearly offtake layered as opposed to the past
where there was volatility because of stock corrections and other policy
changes.
Copra prices have peaked out and have also taken next price increase. Not
commensurate with the kind of an input cost increase, which company has
experienced.
Copra is cyclical, so sometime during the next financial year, it will start
softening. So objective is to ensure that company doesn’t take a pricing call
which compromises consumer’s value proposition.
Should be able to continue to deliver margins in that threshold level of 17-18
percent.
Have taken a 20 percent total hike this fiscal.
8-10 percent volume growth very much possible.
On a like-to-like basis, ad spends is more than 10 percent. Significant drop in the
ad-spends has been in more in international business, not in India. India – like-
to-like - there has been a 14 percent increase in ad-spends in the quarter.
With the revised definition, post GST the ad-spends should be around 10-11
percent.
2. BOB : Expect 13-15% loan growth YoY; expect retail business
to grow; PS Jayakumar, Managing Director & CEO
Stay with the guidance of about 15 percent on a year-on-year (YoY) growth.
Slippages this quarter were elevated because of one telecom and one power
account. Hope these accounts get resolved over a period of time.
Telecom account may get written back by March 2018.
Now having a lower level of stressed assets and the net non-performing assets
(NPAs) plus stressed assets ratio has also declined by about 80 basis points
(bps).
Continuing to make good progress in terms of building the distribution channels.
Distribution channels other than the bank has been quite minimal. Should see
increase in the growth of the retail and the other businesses as well.
Looking to exit non-core businesses.
14 February 2018
37

3. SBI : Demand for credit continues to pick up, expect 10%
credit growth next year; Rajnish Kumar, Chairman
FY18 is a unique year where Bank has merged six entities.
Recognition of non-performing assets (NPAs) cannot be uniformly spread across
all quarters.
Will not see as big a slippage number as Rs 25,000 crore again. March quarter
will see some more slippage recognition.
Retail loan growth is strong and have been able to maintain market share.
If the demand for credit continues to pick up, expect 10 percent credit growth
next year.
Mutual funds, general insurance and SBI cards businesses are on the radar,
would like to list them within next two years but timing yet to be decided.
On the home loan side, January has been very good and have done better than
January 2017.
4. COAL INDIA : Q4FY18 will be better owing to recent price
increase; Gopal Singh, CMD
Q4FY18 and subsequent quarters will be much better because company has
revised prices.
Thrust is on the improvement of efficiency, on reduction in costs and not
increasing the prices.
Have to take care of stakeholders but at the same time, nation is also very
important for company. So by increasing efficiency and by reducing the cost,
there is enough scope to reduce the cost of production of coal.
5. SOBHA : Expect double-digit volume & value growth going
ahead; JC Sharma, Vice Chairman and MD
Bengaluru contributed to 70 percent of total volumes and the trend should
continue.
Kerala market and the NCR market have also performed and turned around
where the headwinds continued to operate almost in all the markets. Believe
that going forward all these markets should continue to do well, which means
company can expect double-digit growth in volumes and value for the next few
quarters.
Going to launch many more projects in all the markets so the volumes should be
picking up as company moves forward.
Believe that next few quarters, there will be good launches and that should have
a positive impact as far as sales volumes are concerned.
14 February 2018
38

From the think tank
1. India’s protectionist folly
The recently tabled Union budget, the last full-year budget by the Narendra Modi
government before the election due next year, did, for the most part, a credible
job in achieving the tricky balancing act between pre-election political exigencies
(read: the incentive to turn on the tap and roll out the goodies) and the need to
prevent excessive fiscal slippage. For this, Prime Minister Modi and finance
minister Arun Jaitley deserve credit. Unfortunately, in the area of trade policy,
there has been a regrettable backslide. Thus, reversing a 20-year trend, Union
Budget 2018-19 substantially raises tariffs across a range of sectors: Thus, on
imported mobile phones, the applicable rate jumps from 15% to 20%, in addition
to a 15% tariff on certain components of mobile phones and television sets.
2. A pressing need for a national urban policy
India is in the midst of a major urbanization boom. As per Census 2011, 377
million Indians comprising 31.1% of the total population lived in urban areas.
This is estimated to have risen to 420 million in 2015 (UN-Habitat “World Cities
Report 2016”). India’s level of urbanization is lower than its peer group of
developing countries: China (45%), Indonesia (54%), Mexico (78%) and Brazil
(87%). Going ahead, by 2030, India’s urban population is projected to increase
to 600 million. However, this positive trend is also accompanied by its own
unique set of issues. Indian cities face challenges in terms of deficits in
infrastructure, governance and sustainability. With rapid urbanization, these
problems are going to aggravate, and can cumulatively pose a challenge to
India’s growth trajectory. Keeping in mind the above challenges, the
government launched the Atal Mission for Rejuvenation and Urban
Transformation (Amrut)) as a step towards harnessing the agglomeration
economies of the urban centres and making cities engines of growth.
3. In the end, the system does seem to work in India
Sometimes it feels like, wherever I go in the world, local businessmen have a story
to tell me about one of their peers who has lost big money in India. This week, I
have a story to tell them in return—one that may make everyone feel a bit better.
These hard-luck stories are particularly common in the sort of countries that are
sitting on big, investible pools of capital—places like the United Arab Emirates,
Scandinavia or Japan. In Dubai, they remember that the real estate company
Emaar Properties PJSC ran into trouble in a joint venture with an Indian partner,
and that their telecom company Etisalat had its license to operate in India taken
away by the courts. In Norway, they mutter about the hundreds of millions that
Telenor ASA sank into its ill-fated attempt to enter the Indian market and the
problems it, too, faced in the courts and with its Indian partner.
14 February 2018
39

4. Small candidates and ‘vote-cutting’ in Indian elections
An increasing number of “small candidates”—defined here somewhat arbitrarily as
those whose vote shares remain below 2% of the total vote—compete in assembly
elections across India. The numbers of such candidates on the ballot has steadily
increased for the past two decades. Data assembled by the Trivedi Centre For
Political Data at Ashoka University suggests that an average of almost eight
candidates in every assembly seat eventually received less than 2% of the vote in
state elections that took place in recent years (2012-2017); by contrast, there were
fewer than three such candidates in the 1997-2001 period. Though similar
statistical evidence is more difficult to assemble for local elections, anecdotal
evidence suggests a similar trend. Whether or not this increase in contestation is to
be celebrated is in principle unclear. On the one hand, this may be reason to
rejoice. For one, increased contestation may suggest that an increasing number of
citizens are willing to have their voice heard or that they do not defer to
established elites and political parties to solve their problems.
International
5. The EU doesn’t want to be more democratic
The European Union (EU) has had a democratic legitimacy problem for years: Its
governing bodies—with the exception of those that consist of national leaders
and ministers—are neither particularly responsive nor accountable to ordinary
European voters. And, as the latest failed attempt to reform them has shown,
they like it this way, for all the rhetoric about the need to overcome the
democratic deficit. Voters have influence on the EU via two channels. One is
electing national leaders, who, through the EU Council, set general policy
guidelines for the bloc. The leaders also pick ministers who collectively serve as
co-legislators with the European Parliament. Directly electing the 751 members
of this parliament is the other channel of influence. But few ordinary voters
understand what the parliament is about—something that has helped drive
election turnout down to 43% in the last two elections from a respectable 62%
in 1979, when the EU’s predecessor organization was much smaller.
14 February 2018
40

Click excel icon
for detailed
valuation guide
CMP
(INR)
Valuation snapshot
Company
Automobiles
Amara Raja
Ashok Ley.
Bajaj Auto
Bharat Forge
Bosch
CEAT
Eicher Mot.
Reco
Buy
Buy
Buy
Buy
Neutral
Buy
Buy
TP % Upside
EPS (INR)
EPS Gr. YoY (%)
P/E (x)
P/B (x)
ROE (%)
(INR) Downside FY18E FY19E FY20E FY18E FY19E FY20E FY18E FY19E FY18E FY19E FY18E FY19E
16
18
28
13
12
18
25
33
-21
26
10
19
38
20
26
38
12
28.7 34.2 41.1
2.6 18.9 20.2
4.9
6.2
7.7
7.8 26.7 24.0
150.3 174.1 201.6 6.5 15.8 15.8
20.2 26.8 35.2 54.2 32.7 31.5
459.1 595.2 731.7 -3.0 29.6 22.9
63.1 84.7 111.7 -32.3 34.1 31.9
1,053.
829.4
1,335.0 34.5 27.0 26.8
0
27.6 38.5 51.8 17.5 39.6 34.5
36.6 45.6 54.9 90.4 24.3 20.6
8.0
10.2 11.6 -1.3 27.5 13.6
185.0 200.1 212.6 9.4
8.2
6.2
37.7 43.9 48.4 37.8 16.4 10.1
9.0
12.0 14.9 94.3 33.0 24.3
275.6 369.9 471.3 10.8 34.2 27.4
10.0 14.4 18.3 30.0 43.9 27.2
28.0 57.9 58.5 41.1 107.1 1.1
13.9 25.1 33.9 18.5 80.5 34.9
21.0 44.7 14.7
10.6
14.7
7.4
0.9
5.5
67.0
12.5
3.0
61.1
8.6
32.7
15.8
1.9
18.2
15.3
31.0
9.0
6.6
6.5
80.6
16.5
3.2
78.9
12.2
41.5
22.7
3.8
23.9
21.6
44.6
10.9
10.2
8.2
100.9
21.0
3.9
101.4
16.8
54.2
30.3
4.9
30.8
29.4
27.2
20.9
38.5
42.6
25.5
33.6
42.2
24.7
26.5
19.6
19.8
24.0
33.0
36.4
13.3
47.5
25.0
24.7
21.4
18.1
29.0
32.8
19.1
26.5
30.3
19.8
20.8
18.1
17.0
18.0
24.6
25.3
6.4
26.3
17.2
4.8
5.7
4.8
7.5
6.2
2.5
10.7
7.9
3.7
3.3
6.2
3.1
2.3
6.7
7.9
1.8
10.8
4.5
7.4
2.1
2.1
2.2
1.5
4.1
2.4
1.2
4.4
0.7
4.2
3.1
1.0
3.0
2.9
1.0
0.6
0.7
1.1
0.9
1.3
0.6
0.9
4.5
5.8
2.6
4.1
1.9
16.1
5.0
2.9
4.2
5.0
4.3
6.3
5.6
2.2
8.0
6.6
3.2
3.0
5.4
2.8
2.0
5.7
6.5
1.4
8.1
3.8
6.2
1.9
1.9
2.0
1.4
3.6
2.2
1.1
3.7
0.7
3.6
2.8
0.9
2.6
2.6
1.0
0.6
0.7
1.0
0.9
1.2
0.5
0.9
3.4
4.9
2.3
3.4
1.6
13.2
4.3
2.4
17.6
22.1
24.2
21.0
15.2
10.1
36.2
20.5
17.2
12.6
34.0
14.4
9.9
19.8
23.4
14.7
24.9
18.0
14.1
5.9
10.1
1.4
9.4
16.7
8.1
6.8
17.0
8.9
13.2
12.2
6.9
17.6
11.0
18.1
24.7
25.3
23.5
17.9
12.3
34.6
23.8
17.3
14.4
32.0
14.4
11.8
22.8
28.1
24.3
35.3
21.8
17.2
11.1
10.4
9.5
9.8
16.6
10.1
6.9
19.1
11.9
14.3
13.8
12.7
19.9
13.3
845
984
133
158
3143 4031
776
880
19544 21951
1613 1899
27874 34764
1165 1554
903
714
213
268
3619 3986
747
889
216
297
9106 10972
365
458
372
515
662
741
Endurance Tech. Buy
Escorts
Sell
Exide Ind
Buy
Hero Moto
Neutral
M&M
Buy
Mahindra CIE
Buy
Maruti Suzuki
Buy
Motherson Sumi Buy
Tata Motors
Buy
TVS Motor
Neutral
Aggregate
Banks - Private
AU Small Finance Neutral
Axis Bank
Buy
DCB Bank
Neutral
Equitas Hold.
Buy
Federal Bank
Buy
HDFC Bank
Buy
ICICI Bank
Buy
IDFC Bank
Neutral
IndusInd
Buy
J&K Bank
Buy
Kotak Mah. Bk Buy
RBL Bank
Buy
South Indian
Buy
Yes Bank
Buy
Aggregate
Banks - PSU
BOB
Buy
BOI
Neutral
Canara
Neutral
Indian Bk
Buy
PNB
Buy
SBI
Buy
Union Bk
Neutral
Aggregate
NBFCs
Aditya Birla Cap Buy
Bajaj Fin.
Buy
Capital First
Buy
Cholaman.Inv.&F
Buy
n
Dewan Hsg.
Buy
GRUH Fin.
Neutral
HDFC
Buy
HDFC Stand. Life Buy
597
563
172
144
95
1877
326
54
1686
70
1043
485
28
335
705
710
188
205
149
2350
405
65
2076
100
1220
680
38
410
18
26
9
42
56
25
24
21
23
42
17
40
34
22
-42.8 43.9 41.1 56.2 39.1
-4.4 111.4 43.7 38.3 18.1
5.3 22.2 21.4 23.4 19.2
-81.6 616.0 53.4 155.8 21.8
13.3 19.1 26.1 17.5 14.7
18.0 20.3 25.2 28.0 23.3
-18.3 32.0 27.6 26.1 19.8
0.4
7.0 21.9 17.8 16.7
27.0 29.2 28.5 27.6 21.4
LP
41.6 37.7 8.2
5.8
22.0 26.9 30.5 31.9 25.1
33.0 43.7 33.2 30.7 21.3
-22.6 97.1 30.4 14.7
7.5
24.8 31.2 28.8 18.4 14.0
15.6 35.1 29.8 26.8 19.8
182.1
Loss
-33.0
17.6
-8.8
978.7
PL
-22.1
NA
42.3
38.9
34.5
26.5
22.1
8.0
5.4
70.7
LP
196.8
11.4
49.5
459.4
LP
675.3
45.2
35.4
30.2
18.7
26.8
18.8
14.0
13.9
42.0
108.6
89.1
10.3
84.7
65.3
158.0
70.7
42.4
34.2
27.5
21.5
26.1
23.4
16.3
25.2
17.3
NM
26.1
10.4
28.5
89.9
NM
117.3
46.1
36.1
20.4
21.9
14.0
53.7
42.0
93.7
10.1
29.5
8.8
9.3
19.0
16.1
21.5
15.1
31.7
26.6
15.7
18.5
11.0
45.2
36.8
82.3
169
145
328
356
162
289
128
185
175
415
438
215
375
145
10
21
27
23
33
30
14
9.8
-1.2
12.6
34.4
5.7
3.2
-40.5
16.7
4.9
37.3
38.3
8.5
18.0
5.9
23.7
10.3
70.6
42.3
15.7
29.7
15.3
2.0
5.5
-0.4 1.8
2.3
6.8
10.9 11.2
2.9
4.3
1.6
8.4
-16.7 2.7
0.8
5.8
12.6
20.1
13.7
20.4
14.0
32.9
17.6
21.7
12.4
19.8
15.6
20.2
15.8
32.2
16.5
21.1
170
1643
698
1355
525
533
1805
442
225
2330
960
1520
720
540
2260
485
33
42
37
12
37
1
25
10
3.7
45.6
34.2
61.8
37.4
9.9
43.0
4.7
5.3
61.7
44.6
73.3
47.5
11.8
49.0
5.4
7.6
82.8
56.8
89.1
59.9
14.6
57.0
6.7
14 February 2018
41

Click excel icon
for detailed
valuation guide
CMP
(INR)
1315
167
521
611
444
418
1246
592
2025
1327
TP % Upside
(INR) Downside
1630
24
240
44
608
17
750
23
575
30
475
14
1750
40
800
35
2500
1750
23
32
EPS (INR)
EPS Gr. YoY (%)
FY18E FY19E FY20E FY18E FY19E FY20E
91.1 105.1 128.3 32.8 15.4 22.1
7.4
11.0 13.5 42.2 47.1 23.2
38.5 44.3 52.6
0.6 15.2 18.7
18.6 24.2 30.0 24.0 29.6 24.1
13.9 19.2 23.0 95.8 38.7 19.4
43.8 44.8 49.3 48.1 2.3 10.2
51.4 69.0 92.3 62.4 34.4 33.7
36.0 41.9 50.0 23.5 16.5 19.3
114.2 140.0 166.8
78.7
104.8 125.9
35.4
42.1
28.3
12.1
12.6
123.6
36.0
9.8
-64.9
-12.4
84.1
19.4
35.5
15.7
10.9
18.4
-7.4
76.0
16.4
17.3
25.5
31.3
-69.0
41.2
20.8
-33.4
31.8
34.7
-10.8
LP
905.1
LP
102.0
10.0
-7.4
12.9
2.7
14.7
12.9
4.5
-9.6
10.6
3.0
22.6
33.1
22.8
52.0
12.0
-2.6
48.2
26.1
57.4
34.6
9.6
21.6
16.6
18.8
53.8
21.5
21.4
-2.6
12.4
19.9
25.3
31.1
378.7
41.5
42.5
101.9
27.3
97.2
25.3
66.8
81.3
101.0
53.5
3.0
53.0
39.9
18.8
26.4
17.9
19.2
30.5
15.1
13.4
19.2
20.2
22.7
16.2
6.3
37.5
26.9
18.4
31.9
18.6
13.9
24.1
28.5
19.2
13.8
23.7
12.5
13.4
13.8
18.6
Valuation snapshot
P/E (x)
P/B (x)
FY18E FY19E FY18E FY19E
14.4 12.5
4.1
3.6
22.4 15.2
3.3
2.8
13.6 11.8
2.1
1.8
32.8 25.3
4.6
4.0
32.0 23.1
3.0
2.8
9.5
9.3
2.1
1.8
24.3 18.0
3.4
2.9
16.5 14.1
2.8
2.3
17.7
16.9
28.3
81.4
22.2
32.6
44.6
46.2
62.5
36.4
38.6
45.3
22.5
27.6
63.5
42.4
41.4
16.9
32.9
32.9
14.5
12.7
23.0
53.5
19.9
33.5
30.1
36.6
39.7
27.0
35.2
37.2
19.3
23.2
41.3
34.9
34.1
17.4
29.3
27.5
2.4
2.4
4.2
9.5
4.0
1.1
8.8
20.3
1.3
5.9
8.6
8.8
4.9
3.4
5.8
7.8
4.8
2.7
5.2
3.6
2.5
3.4
2.4
4.7
1.5
1.0
3.5
3.4
4.1
3.0
6.4
2.5
2.2
6.6
4.4
3.2
14.1
17.5
22.2
10.8
12.3
10.4
7.4
2.1
2.1
3.6
8.3
3.6
1.1
8.2
16.6
1.3
5.4
7.5
7.7
4.0
3.1
5.3
6.6
4.3
2.4
4.6
3.3
2.4
3.3
2.2
4.2
1.3
0.9
3.0
3.0
3.6
2.7
5.3
2.2
1.9
5.7
4.0
2.8
12.5
14.2
20.8
9.6
10.8
9.1
6.7
ROE (%)
FY18E FY19E
29.9 30.4
15.9 19.7
16.4 16.5
20.2 17.0
10.9 12.5
24.3 21.0
14.7 17.4
18.1 17.9
14.1
14.9
15.0
11.6
17.9
3.4
20.4
50.6
2.1
16.7
24.1
19.4
21.6
13.0
9.1
20.0
12.1
17.1
16.9
11.0
6.2
10.1
2.1
9.4
11.5
2.2
16.4
7.7
14.4
6.6
13.7
6.5
10.8
17.6
9.7
9.7
26.9
34.0
49.9
25.4
29.0
23.6
20.7
15.2
17.5
15.8
15.4
18.0
3.3
28.3
49.8
3.3
20.8
22.7
20.8
21.0
14.1
12.9
20.6
13.4
14.8
16.8
12.2
7.4
12.6
9.6
12.0
14.5
4.4
17.8
13.8
15.9
10.3
21.3
12.0
14.6
15.7
13.5
12.2
29.6
35.2
55.5
26.7
33.2
22.6
21.4
Company
Reco
Indiabulls Hsg
Buy
L&T Fin Holdings Buy
LIC Hsg Fin
Neutral
MAS Financial
Buy
M&M Fin.
Buy
Muthoot Fin
Neutral
PNB Housing
Buy
Repco Home
Buy
Shriram
City
Buy
Union
Shriram Trans. Buy
Aggregate
Capital Goods
ABB
Sell
Bharat Elec.
Buy
BHEL
Sell
Blue Star
Neutral
CG Cons. Elec.
Buy
CG Power & Indu. Neutral
Cummins
Buy
GE T&D
Neutral
Havells
Buy
K E C Intl
Neutral
L&T
Buy
Siemens
Neutral
Solar Ind
Neutral
Thermax
Neutral
Va Tech Wab.
Buy
Voltas
Neutral
Aggregate
Cement
Ambuja Cem.
Neutral
ACC
Neutral
Birla Corp.
Buy
Dalmia Bharat
Buy
Grasim Inds.
Neutral
India Cem
Neutral
J K Cements
Buy
JK Lakshmi Ce
Buy
Ramco Cem
Buy
Orient Cem
Buy
Prism Cem
Buy
Sagar Cements Not Rated
Sanghi Inds.
Buy
Shree Cem
Buy
Ultratech
Buy
Aggregate
Consumer
Asian Paints
Neutral
Britannia
Buy
Colgate
Buy
Dabur
Buy
Emami
Buy
Godrej Cons.
Neutral
GSK Cons.
Neutral
1613
158
98
739
237
90
844
407
517
362
1351
1254
1034
1181
562
593
1240
210
80
780
305
90
1040
435
640
385
1650
1285
1100
1250
745
630
-23
33
-18
6
29
0
23
7
24
6
22
2
6
6
32
6
19.8
7.1
3.0
16.6
5.1
1.4
23.2
10.6
11.4
16.1
49.0
19.8
24.4
28.6
33.2
18.0
30.1
7.9
2.9
24.6
6.5
2.3
31.3
11.6
13.9
18.7
58.1
30.4
29.6
34.7
32.4
20.2
35.0
8.4
4.0
31.2
7.7
3.0
37.1
13.2
17.2
24.1
69.3
34.6
36.7
39.0
36.7
23.0
257
1651
1005
2883
1132
162
1026
422
738
150
136
989
122
16937
4201
275
1781
1234
3328
1286
148
1343
470
847
179
130
-
157
22424
5131
7
8
23
15
14
-9
31
11
15
19
-5
29
32
22
6.1
7.7
9.8
47.4 62.2 76.9
8.9
42.4 50.6
54.7 77.4 107.6
81.9 116.8 133.5
3.7
7.6
10.4
44.4 56.5 76.9
9.4
18.5 25.0
24.3 30.5 38.8
3.3
5.5
10.3
2.7
5.0
6.6
25.2 50.6 70.6
5.8
8.9
12.0
423.0 435.8 724.2
89.0 136.2 178.4
27.3 41.9 33.4
23.6 34.8 26.6
19.5 113.5 23.7
39.0 52.7 37.2
14.3 13.8
9.7
37.7 43.3 21.4
36.0 23.1 18.1
35.2 45.0 22.8
27.2 30.3 24.2
88.7 45.8 27.5
32.7 49.7 27.4
39.7 39.3 19.6
34.6 21.1 13.7
66.2 40.0 38.9
31.1 47.2 30.9
28.6 32.6 23.3
20.2
25.2
19.7
16.2
19.1
14.2
13.2
53.1
56.4
45.6
45.5
45.1
49.3
37.2
44.7
44.6
38.6
38.2
34.6
42.8
32.8
1145
4767
1092
345
1082
1030
5980
1270
6098
1365
415
1505
1065
5785
11
28
25
20
39
3
-3
21.6 25.6 30.8
84.5 106.9 133.8
24.0 28.3 33.8
7.6
9.0
10.5
24.0 31.3 37.3
20.9 24.1 27.5
160.8 182.3 206.5
14 February 2018
42

Click excel icon
for detailed
valuation guide
CMP
Reco
(INR)
Buy
1346
Neutral
270
Neutral
353
Neutral
310
Neutral
7137
Buy
22031
Neutral
293
Buy
892
Neutral
9350
Not Rated 189
Buy
1075
Neutral
3260
TP % Upside
(INR) Downside
1585
18
278
3
380
8
355
14
8173
15
28270
28
314
7
1050
18
9303
0
-
1380
28
3515
8
EPS (INR)
EPS Gr. YoY (%)
FY18E FY19E FY20E FY18E FY19E FY20E
23.1 27.9 32.9 17.6 20.7 18.1
9.0
10.2 11.4
6.6 13.7 12.4
8.1
10.7 13.3 -27.7 32.0 24.2
6.2
7.7
9.3
-1.2 24.3 20.2
128.6 146.9 177.7 4.0 14.2 20.9
297.1 414.8 547.0 24.5 39.6 31.9
8.9
12.4 16.8 147.7 38.7 35.6
17.7 20.8 24.1
5.7 17.8 15.5
142.1 171.3 200.8 6.9 20.5 17.3
3.5
6.4
9.7
-2.0 83.8 52.1
14.1 17.4 22.9 62.0 23.9 31.2
32.9 57.0 78.7 22.9 73.4 38.1
8.5 18.7 17.2
23.9 25.3 30.1 10.8 5.9 19.0
63.0 88.9 109.9 -15.5 41.1 23.6
54.0 65.8 81.4 -5.8 21.9 23.6
43.4 48.7 53.6 10.4 12.2 10.1
7.6
10.9 19.8 -25.3 43.1 81.5
16.8 21.0 24.4 18.5 25.0 15.8
21.6 27.0 33.0 35.7 25.3 22.0
32.9 44.0 52.7 -17.7 33.9 19.7
68.9 113.2 145.0 -5.1 64.2 28.0
1.9
4.9
8.4 -81.8 160.8 71.9
30.6 32.9 41.1 -22.2 7.7 24.7
6.3
7.9
11.0 -12.4 25.2 38.7
49.1 54.9 61.1 42.9 11.9 11.2
21.4 29.2 37.3 33.2 36.6 27.7
47.8 62.6 72.5 29.5 30.9 15.8
19.0 29.1 35.7
7.0 52.7 22.8
31.5 40.2 54.1 -44.4 27.7 34.6
140.1 157.4 180.5 8.5 12.4 14.7
18.1 29.9 37.8 29.3 65.1 26.2
14.1 40.8 55.7 -56.2 188.8 36.7
14.5 22.1 27.5 -44.5 52.0 24.6
37.3 61.3 78.5 -32.3 64.2 28.0
-17.9 34.6 24.3
5.3
25.4
13.3
14.2
9.5
24.6
14.5
14.6
19.1
21.3
16.0
17.0
LP
24.8
11.5
29.3
Valuation snapshot
P/E (x)
FY18E FY19E
58.3 48.3
30.1 26.5
43.5 32.9
50.0 40.2
55.5 48.6
74.2 53.1
32.8 23.7
50.5 42.8
65.8 54.6
54.3 29.5
76.4 61.7
99.2 57.2
45.1 38.0
23.2
34.6
26.4
14.0
80.3
25.1
28.8
31.5
31.9
74.0
17.5
19.3
49.8
29.9
19.6
27.2
26.7
34.4
28.1
52.4
40.6
38.1
30.1
21.9
24.5
21.6
12.5
56.1
20.1
23.0
23.5
19.4
28.4
16.2
15.4
44.5
21.9
15.0
17.8
20.9
30.6
17.0
18.1
26.7
23.2
22.4
25.3
9.2
22.5
27.4
15.7
14.8
25.9
11.6
22.1
P/B (x)
FY18E FY19E
44.3 44.0
6.6
6.1
6.1
6.0
15.2 14.4
20.7 18.7
29.6 23.6
3.4
2.9
11.8 10.1
37.0 31.0
2.6
2.4
10.7 9.3
17.2 12.8
12.1 10.9
4.7
5.2
6.4
3.0
7.1
5.3
3.6
5.3
2.8
1.1
2.9
2.2
11.9
3.0
3.5
3.6
2.6
5.9
3.9
2.3
3.7
5.1
3.8
2.4
1.3
4.3
3.7
2.1
2.4
3.4
2.2
3.2
4.0
4.4
5.1
2.5
6.5
4.4
3.1
4.7
2.5
1.1
2.5
2.0
13.6
2.7
2.9
3.0
2.4
5.4
3.2
2.1
3.4
4.4
3.3
2.2
1.2
3.6
3.3
1.9
2.2
3.2
2.0
2.9
ROE (%)
FY18E FY19E
76.5 91.4
22.8 23.8
13.8 18.3
32.3 36.8
39.1 40.4
39.9 44.5
10.8 13.3
25.2 25.4
61.2 61.8
4.9
8.5
14.9 16.2
17.3 22.3
26.8 28.7
21.8
15.8
26.4
24.0
8.9
22.7
12.3
16.6
9.2
1.6
16.4
13.2
23.9
10.5
19.7
14.1
10.2
17.2
14.7
4.6
9.3
13.9
12.5
5.5
15.5
19.1
13.7
13.0
14.1
11.2
9.2
11.1
19.7
19.5
25.7
21.7
11.6
23.7
13.6
21.2
13.7
3.9
15.3
13.9
30.5
13.0
21.4
18.3
12.0
17.7
20.5
12.1
13.2
20.4
14.9
8.9
13.4
17.5
12.6
12.2
15.4
12.9
18.2
13.2
Company
HUL
ITC
Jyothy Lab
Marico
Nestle
Page Inds
Parag Milk
Pidilite Ind.
P&G Hygiene
Prabhat Dairy
United Brew
United Spirits
Aggregate
Healthcare
Alembic Phar
Alkem Lab
Ajanta Pharma
Aurobindo
Biocon
Cadila
Cipla
Divis Lab
Dr Reddy’s
Fortis Health
Glenmark
Granules
GSK Pharma
IPCA Labs
Jubilant Life
Laurus Labs
Lupin
Sanofi India
Shilpa Medicare
Strides Shasun
Sun Pharma
Torrent Pharma
Aggregate
Infrastructure
Ashoka Buildcon
IRB Infra
KNR
Constructions
Sadbhav
Engineering
Aggregate
Logistics
Allcargo Logistics
Concor
Gateway
Distriparks
Aggregate
Media
Dish TV
D B Corp
Den Net.
Neutral
Buy
Buy
Buy
Neutral
Buy
Neutral
Neutral
Neutral
Buy
Neutral
Buy
Neutral
Buy
Buy
Buy
Buy
Buy
Buy
Buy
Buy
Neutral
555
2181
1425
608
612
423
621
1036
2200
139
535
122
2448
640
939
518
839
4825
510
740
589
1424
555
2500
1840
820
600
500
600
1100
2575
185
550
175
2500
750
1110
631
940
5000
797
989
610
1400
0
15
29
35
-2
18
-3
6
17
33
3
43
2
17
18
22
12
4
56
34
4
-2
Buy
Neutral
Buy
Buy
241
227
327
401
290
250
325
445
21
10
-1
11
79.9 101.0 45.6
-3.0 -13.6 9.0
9.0
3.5
10.0
16.4
24.5
28.3
16.5
Buy
Neutral
Buy
197
1325
214
242
1469
282
23
11
32
10.9
41.9
8.8
13.3
51.2
18.4
15.3
58.2
21.3
10.7
10.3
22.0
22.3
15.5
13.5
18.1
31.6
24.3
28.3
29.6 109.2 15.3
11.5
28.2
14.1
Buy
Buy
Neutral
75
326
111
101
420
90
35
29
-19
-0.5
18.8
-2.9
1.6
23.0
0.1
3.4
27.6
4.0
PL
-7.6
Loss
LP 109.9 NM 46.6 18.5
22.0 20.1 17.3 14.2
3.2
LP ##### NM 1,561.8 2.5
13.3 -11.9 33.2
2.7 20.1 20.9
2.5 -6.3 0.2
14 February 2018
43

Click excel icon
for detailed
valuation guide
CMP
(INR)
706
39
244
96
171
353
1411
108
20
984
585
TP % Upside
(INR) Downside
820
16
47
20
305
25
117
22
215
26
469
33
1760
25
148
37
27
37
1225
24
705
21
Valuation snapshot
ROE (%)
FY18E FY19E
4.5
8.4
-1.2 5.2
15.1 14.6
11.5 10.6
15.3 18.4
8.2 12.2
10.2 15.3
15.9 24.7
-15.8 2.4
26.1 30.9
18.2 20.0
14.1 17.7
14.0
35.3
-3.6
20.2
-0.9
19.1
-1.0
25.2
15.1
15.9
12.3
22.7
11.2
16.1
14.6
24.9
17.5
20.8
28.0
20.2
7.1
10.0
23.9
12.9
12.9
22.5
16.9
23.4
19.2
17.4
25.1
26.9
24.3
14.3
32.1
19.9
15.3
16.1
17.8
16.8
55.7
2.3
19.5
9.8
17.2
4.8
29.7
25.4
16.3
16.8
21.8
12.4
22.0
13.6
20.2
15.4
20.8
24.4
16.2
10.5
12.8
22.9
13.1
13.5
29.8
18.4
25.9
22.2
17.8
23.9
25.8
23.1
13.8
29.0
24.0
18.7
17.6
21.0
Company
Ent.Network
Hathway Cable
Hind. Media
HT Media
Jagran Prak.
Music Broadcast
PVR
Prime Focus
Siti Net.
Sun TV
Zee Ent.
Aggregate
Metals
Hindalco
Hind. Zinc
JSPL
JSW Steel
Nalco
NMDC
SAIL
Rain Industries
Vedanta
Tata Steel
Aggregate
Oil & Gas
BPCL
GAIL
Gujarat Gas
Gujarat St. Pet.
HPCL
IOC
IGL
Mahanagar Gas
MRPL
Oil India
ONGC
PLNG
Reliance Ind.
Aggregate
Retail
Jubilant Food
PC Jeweller
Titan Co.
Aggregate
Technology
Cyient
HCL Tech.
Hexaware
Infosys
KPIT Tech
L&T Infotech
Mindtree
Mphasis
NIIT Tech
Persistent Sys
Reco
Buy
Buy
Buy
Neutral
Buy
Buy
Buy
Buy
Neutral
Buy
Buy
EPS (INR)
EPS Gr. YoY (%)
P/E (x)
P/B (x)
FY18E FY19E FY20E FY18E FY19E FY20E FY18E FY19E FY18E FY19E
8.3
16.4 28.7 -27.7 98.0 75.7 85.4 43.1
3.8
3.5
-0.2
0.8
2.0
Loss
LP 161.9 NM 51.6
2.8
2.6
25.9 28.8 32.4
0.2 11.3 12.6 9.4
8.5
1.3
1.2
11.8 12.1 12.7 59.3 2.6
4.9
8.1
7.9
0.9
0.8
9.9
12.5 15.2 -6.9 26.4 21.5 17.2 13.6
2.7
2.4
8.2
13.5 17.8 27.8 64.9 31.4 43.0 26.1
3.4
3.0
22.1 37.3 51.5
7.8 68.7 37.9 63.8 37.8
6.2
5.4
3.2
6.1
9.2 164.0 90.5 49.1 33.5 17.6
4.9
3.9
-0.9
0.1
0.6
Loss
LP 411.6 NM 156.4 3.8
3.7
27.7 35.8 42.5 11.6 29.1 18.7 35.5 27.5
8.9
8.1
13.7 17.6 21.0
2.1 28.7 19.3 42.8 33.3
7.2
6.2
12.9 43.2 28.1 38.4 26.8 5.4
4.7
19.5
21.6
-11.5
20.7
-0.5
14.3
-0.9
25.5
23.8
57.7
27.0
33.3
7.3
24.0
5.1
14.0
4.3
38.9
41.7
69.4
27.9
32.1
11.9
23.7
5.3
14.7
6.5
43.0
43.4
61.5
127.9
9.6
Loss
39.8
PL
43.7
Loss
165.2
57.4
51.9
67.5
-22.0
15.8
28.2
40.1
-14.7
-3.9
7.4
27.0
-15.0
-22.6
7.1
24.3
19.6
4.0
186.2
44.4
38.8
48.6
18.1
3.1
21.2
2.6
0.8
18.5
31.5
12.9
17.4
14.4
38.6
54.6
LP
15.9
LP
-2.0
LP
52.3
74.8
20.4
54.5
9.2
19.3
59.6
4.1
-9.4
-1.5
17.2
-3.6
-7.7
56.7
32.5
13.4
11.8
13.5
29.6
26.6
27.0
27.2
12.1
3.8
10.9
9.7
10.5
13.7
24.6
14.8
16.9
22.8
3.0
-3.8
63.4
-1.0
2.6
4.7
50.2
10.7
4.2
-11.5
1.7
11.3
4.9
28.7
8.3
15.8
4.5
13.2
1.2
5.0
3.3
4.1
17.9
13.7
8.9
31.3
27.6
24.1
26.0
13.2
7.5
13.4
11.2
29.1
15.2
17.2
8.3
16.2
14.3
12.5
14.2
NM
15.0
NM
9.6
NM
15.4
13.2
12.4
15.1
12.4
17.8
41.3
16.2
11.3
9.4
32.0
18.4
9.5
13.9
10.8
17.6
15.1
12.8
66.8
24.9
64.4
51.3
17.3
15.2
19.9
17.1
17.9
22.0
22.1
19.9
18.5
18.1
9.0
9.2
37.8
12.9
14.7
9.8
22.1
10.1
7.5
10.3
9.8
11.3
14.9
25.9
15.6
12.4
9.6
27.3
19.1
10.3
8.8
8.2
15.5
13.5
11.3
51.6
19.7
50.7
40.3
15.4
14.6
17.9
15.6
16.2
19.3
17.7
17.3
15.9
14.8
1.6
6.2
0.9
2.8
1.5
1.8
1.1
3.5
2.1
1.8
1.9
2.7
1.9
6.2
2.2
2.7
1.6
6.2
4.9
1.8
1.0
1.1
3.9
1.9
1.7
15.0
3.9
13.7
9.9
3.0
3.7
5.0
4.0
2.4
6.3
4.6
3.4
2.9
3.1
1.4
4.4
0.9
2.3
1.4
1.6
1.0
2.6
1.8
1.6
1.6
2.3
1.8
5.2
2.0
2.4
1.4
5.2
4.4
1.6
0.9
1.0
3.3
1.7
1.5
15.4
3.4
12.7
8.9
2.7
3.4
4.3
3.4
2.1
5.0
4.0
3.1
2.6
3.0
Buy
Neutral
Buy
Buy
Neutral
Buy
Sell
Buy
Buy
Neutral
243
307
274
311
75
137
95
393
314
713
344
342
361
339
81
215
71
492
416
778
41
11
32
9
8
56
-26
25
32
9
Buy
Sell
Buy
Neutral
Buy
Buy
Buy
Buy
Neutral
Buy
Buy
Buy
Buy
466
464
851
200
391
379
302
1030
119
361
191
249
915
549
371
1014
188
530
533
416
1228
114
425
230
318
1069
18
-20
19
-6
35
40
38
19
-4
18
21
28
17
37.7
26.1
20.6
12.3
34.7
40.2
9.4
55.9
12.6
26.1
17.6
14.1
60.4
41.2
31.2
32.9
12.8
31.5
39.6
11.1
53.9
11.6
40.9
23.3
16.0
67.5
45.8
32.7
42.3
13.9
36.4
41.4
12.5
54.6
12.2
42.2
24.3
18.9
76.8
Neutral
Buy
Buy
2028
385
808
2185
685
990
8
78
23
30.3
15.4
12.5
39.3
19.5
15.9
51.6
24.9
19.8
Buy
Neutral
Neutral
Buy
Neutral
Buy
Buy
Neutral
Neutral
Buy
626
938
330
1104
215
1444
722
874
827
782
675
950
340
1250
219
1400
725
800
800
900
8
1
3
13
2
-3
0
-8
-3
15
36.2
61.7
16.6
64.4
12.0
65.7
32.7
43.9
44.6
43.1
40.6
64.1
18.4
70.7
13.3
74.7
40.8
50.4
52.2
53.0
45.9
68.9
20.9
78.6
17.2
86.1
47.8
54.6
60.6
60.5
14 February 2018
44

Click excel icon
for detailed
valuation guide
CMP
(INR)
1006
2968
589
288
934
TP % Upside
(INR) Downside
1236
23
2700
-9
700
19
300
4
1100
18
EPS (INR)
EPS Gr. YoY (%)
FY18E FY19E FY20E FY18E FY19E FY20E
36.8 43.6 51.5 30.8 18.4 18.2
130.6 147.3 161.0 -2.1 12.8 9.3
39.2 40.9 47.7 26.8 4.5 16.6
17.9 18.5 21.2
6.0
3.2 14.7
54.2 64.1 85.2
4.0 18.3 33.1
4.2
5.1 11.1
3.5
3.9
7.2
14.0 16.2 17.8
-11.9 -12.9 -11.7
2.4
11.6 23.6
Valuation snapshot
P/E (x)
P/B (x)
FY18E FY19E FY18E FY19E
27.3 23.1
8.8
7.0
22.7 20.1
7.1
6.2
15.0 14.4
3.0
2.6
16.1 15.6
2.8
2.4
17.2 14.6
2.6
2.2
19.0 18.0 4.7
4.2
ROE (%)
FY18E FY19E
36.0 33.8
30.4 32.9
20.6 19.5
17.2 16.7
15.7 16.4
25.0 23.1
Company
Tata Elxsi
TCS
Tech Mah
Wipro
Zensar Tech
Aggregate
Telecom
Bharti Airtel
Bharti Infratel
Idea Cellular
Tata Comm
Aggregate
Reco
Buy
Neutral
Buy
Neutral
Buy
Buy
Neutral
Buy
Buy
424
338
85
650
680
380
110
750
60
12
30
15
-68.7 12.2 84.4 121.8 108.6 2.5
-6.1 16.5 9.7 24.2 20.8
4.2
Loss Loss Loss NM
NM
1.4
-75.8 383.2 102.9 270.1 55.9 13.3
-
PL
Loss
LP -452.8
2.6
1,605.5
16.2
8.4
10.7
18.2
9.5
4.6
3.1
11.4
34.1
33.4
16.6
8.6
4.3
4.5
34.0
24.1
44.4
15.8
27.1
17.0
35.6
18.5
18.4
17.6
-3.5
27.3
16.4
27.1
32.1
17.7
47.9
25.8
15.4
12.1
16.2
11.7
19.3
12.4
12.8
11.7
11.8
13.6
35.8
94.5
44.9
19.9
28.3
22.0
61.3
32.3
19.5
13.2
53.4
14.0
46.7
35.6
23.9
19.7
34.0
42.9
28.8
32.3
22.8
36.0
50.6
10.6
51.1
50.0
11.2
10.9
22.8
9.5
11.1
9.7
10.5
10.7
28.9
68.8
37.1
18.3
30.1
18.3
43.6
22.6
16.4
9.9
47.4
11.8
31.7
25.2
19.8
15.3
9.6
29.1
23.8
23.1
18.4
27.3
36.8
8.3
40.0
37.6
7.3
1.2
1.3
1.0
1.3
1.8
1.8
2.0
2.8
16.9
6.2
1.7
19.2
4.6
6.1
8.1
7.2
2.0
7.0
3.4
3.9
2.9
7.4
4.4
2.6
5.3
6.0
2.5
3.1
4.6
8.2
1.3
8.8
12.2
2.5
2.1
2.3
4.3 17.0 20.4
1.8 -19.4 -24.4
10.7 4.6 21.2
2.7
6.8
1.1
1.2
1.0
1.2
1.6
1.5
1.9
2.6
14.4
5.5
1.3
18.0
4.0
5.5
6.6
6.7
1.7
6.3
3.0
3.6
2.7
6.4
3.8
2.1
4.3
5.0
2.2
2.8
4.1
6.7
1.1
7.8
9.7
-0.6
44.7
10.6
6.7
8.4
10.5
16.5
16.2
14.8
8.0
19.0
14.6
8.5
69.1
22.5
12.6
27.1
46.8
17.0
13.7
23.4
7.4
7.9
32.5
23.9
7.8
21.7
22.6
8.9
14.1
13.4
17.7
12.6
18.0
26.9
-0.2
60.8
10.4
5.5
10.8
11.3
17.5
15.9
17.3
9.4
22.6
15.7
7.4
61.8
23.4
13.2
32.0
42.1
18.5
14.0
27.1
11.8
11.0
34.5
26.9
24.2
21.0
22.9
10.2
15.9
16.0
20.1
14.5
20.7
28.8
Utiltites
Coal India
Buy
CESC
Buy
JSW Energy
Sell
NHPC
Buy
NTPC
Buy
Power Grid
Buy
Tata Power
Sell
Aggregate
Others
Arvind
Neutral
Avenue
Sell
Supermarts
Bata India
Sell
BSE
Neutral
Castrol India
Buy
Coromandel Intl Buy
Delta Corp
Buy
Eveready Inds. Buy
Interglobe
Neutral
Indo Count
Neutral
Info Edge
Buy
Kaveri Seed
Buy
Manpasand
Buy
MCX
Buy
Monsanto
Buy
Navneet
Buy
Education
Oberoi Realty
Buy
Quess Corp
Buy
PI Inds.
Buy
Piramal Enterp. Buy
SRF
Buy
S H Kelkar
Buy
Team Lease Serv. Buy
Trident
Buy
TTK Prestige
Neutral
V-Guard
Neutral
300
1036
82
30
165
198
87
401
1408
61
37
210
282
73
34
36
-26
25
27
42
-16
18.5
88.8
4.3
2.4
12.9
16.9
7.4
26.8
95.2
3.6
3.1
14.8
20.4
8.3
31.1 23.8 44.9
103.2 71.1 7.3
4.0
11.4 -15.4
3.7 -19.3 30.3
16.2
7.5 15.1
21.3 20.7 20.9
8.5
-0.5 12.2
14.4 26.4
18.8
23.0
-8.4
63.6
23.8
37.4
21.0
8.7
-5.9
20.4
40.7
42.5
19.3
32.9
12.5
18.5
47.2
41.1
20.6
28.4
406
1186
715
832
198
530
363
379
1252
106
1246
480
420
741
2513
149
463
950
843
2683
1893
285
2192
76
7046
224
402
920
578
950
242
523
382
458
1307
128
1550
664
467
1100
3293
194
608
1300
988
3500
2040
343
2700
114
5281
167
-1
-22
-19
14
22
-1
5
21
4
21
24
38
11
48
31
30
31
37
17
30
8
21
23
50
-25
-25
11.3
12.6
14.1
17.2
15.9 19.3 22.4 17.8
41.8 45.5 49.4
2.0
7.0
6.6
6.9
2.9
24.1 29.0 30.3 45.1
5.9
8.3
11.2 93.7
11.7 16.7 20.8 -8.7
64.0 76.4 110.4 48.2
8.0
10.7 12.4 -38.2
23.4 26.3 33.4 49.0
34.2 40.6 47.4 79.5
9.0
13.2 17.9 41.6
20.8 29.4 34.9 -16.0
105.0 126.6 149.9 21.9
7.6
9.7
11.4
3.6
13.6 48.2 46.5 22.3 253.5
22.1 32.7 41.6 124.2 47.7
29.3 35.4 41.2 -12.2 20.6
83.1 116.4 147.9 14.5 40.0
82.9 103.0 136.0 -3.5 24.2
7.9
10.4 12.2
9.1 31.6
43.3 59.6 88.1 11.6 37.5
7.2
9.2
11.6
8.4 28.1
137.8 176.1 203.2 4.4 27.8
4.5
6.0
6.7
25.3 32.9
14 February 2018
45

MOSL Universe stock performance
Company
Automobiles
Amara Raja
Ashok Ley.
Bajaj Auto
Bharat Forge
Bosch
CEAT
Eicher Mot.
Endurance Tech.
Escorts
Exide Ind
Hero Moto
M&M
Mahindra CIE
Maruti Suzuki
Motherson Sumi
Tata Motors
TVS Motor
Banks - Private
AU Small Fin. Bank
Axis Bank
DCB Bank
Equitas Hold.
Federal Bank
HDFC Bank
ICICI Bank
IDFC Bank
IndusInd
J&K Bank
Kotak Mah. Bk
RBL Bank
South Indian
Yes Bank
Banks - PSU
BOB
BOI
Canara
Indian Bk
PNB
SBI
Union Bk
NBFCs
Aditya Birla Cap
Bajaj Fin.
Capital First
Cholaman.Inv.&Fn
Dewan Hsg.
GRUH Fin.
HDFC
HDFC Stand. Life
Indiabulls Hsg
L&T Fin.Holdings
LIC Hsg Fin
M&M Fin.
Muthoot Fin
1 Day (%)
5.8
-0.7
1.3
1.9
0.1
4.1
0.5
1.5
-1.0
2.1
2.1
-0.4
0.7
1.8
1.4
0.9
-0.3
0.5
1.0
1.1
2.3
0.0
1.3
-0.2
1.1
2.1
-0.5
1.0
0.7
2.7
2.9
7.8
1.6
2.1
5.0
3.1
-2.7
1.1
1.1
0.2
1.6
3.0
2.0
0.3
1.8
0.4
1.9
1.8
1.9
-0.1
-1.0
1M (%)
-1.5
3.7
-1.0
6.3
-1.0
-18.4
-2.2
-14.9
11.4
-4.9
-1.8
-2.5
-15.1
-3.7
-5.3
-14.6
-11.9
-15.1
1.3
-14.2
-11.5
-17.2
0.6
2.6
-20.5
-1.1
-13.6
2.3
-8.8
-13.5
-1.7
3.8
-11.2
-7.4
-5.0
-7.0
-4.4
-7.6
-7.8
-7.2
-16.5
3.2
-14.5
5.5
2.5
-3.0
7.2
-7.9
-8.1
-7.6
-7.6
12M (%)
-3.2
43.5
12.4
53.5
-13.8
40.0
16.2
81.7
131.9
2.3
10.8
16.8
8.4
49.0
53.9
-26.9
60.9
Company
MAS Financial Serv.
PNB Housing
Repco Home
Shriram City Union
Shriram Trans.
Capital Goods
ABB
Bharat Elec.
BHEL
Blue Star
CG Cons. Elec.
CG Power & Inds Sol.
Cummins
GE T&D
Havells
K E C Intl
L&T
Siemens
Solar Ind
Thermax
Va Tech Wab.
Voltas
Cement
Ambuja Cem.
ACC
Birla Corp.
Dalmia Bharat
Grasim Inds.
India Cem
J K Cements
JK Lakshmi Ce
Ramco Cem
Orient Cem
Prism Cem
Sagar Cements
Sanghi Inds.
Shree Cem
Ultratech
Consumer
Asian Paints
Britannia
Colgate
Dabur
Emami
Godrej Cons.
GSK Cons.
HUL
ITC
Jyothy Lab
Marico
Nestle
Page Inds
Parag Milk
Pidilite Ind.
P&G Hygiene
1 Day (%)
-0.4
2.4
0.3
4.4
1.3
1.3
0.9
3.2
-0.4
-2.6
1.9
2.2
-0.1
0.4
1.0
1.6
1.7
0.0
-0.5
-1.5
-0.1
-0.5
-0.5
0.3
3.4
2.1
0.4
-0.2
1.7
3.7
-0.6
2.5
0.0
3.3
-0.2
1.1
1.2
2.8
-0.8
1.4
-0.6
1.3
-1.4
0.8
-0.5
-0.1
4.1
2.5
3.3
-1.5
1.7
0.7
1M (%)
-5.1
-5.4
-12.5
-5.0
-12.4
9.6
-11.4
-5.0
-6.3
-12.8
-7.9
-10.1
-5.6
-5.7
-3.8
1.6
-5.1
-11.0
-8.8
-9.8
-6.4
-4.7
-8.5
-16.5
-9.6
-7.3
-15.1
-9.3
-4.7
-6.4
-12.4
-1.6
-8.2
-8.9
-10.2
-4.3
-3.7
1.3
-3.9
-3.7
-15.9
4.2
-7.7
-1.9
0.9
-4.2
-0.7
-8.4
-2.5
1.8
-1.7
0.7
12M (%)
10.9
-18.4
4.5
37.7
27.8
12.4
-7.1
33.9
21.2
26.6
-5.7
34.3
17.8
121.0
35.0
3.8
42.2
36.1
14.7
71.6
8.3
11.2
37.0
48.2
34.3
-0.8
23.0
8.8
7.1
9.5
36.6
29.2
89.2
6.1
11.7
15.4
47.3
22.7
30.4
-5.2
32.5
16.7
58.3
-1.2
-1.2
15.1
15.8
51.9
2.8
33.2
33.0
15.2
26.7
-22.6
13.0
43.9
27.4
-14.2
27.5
2.3
34.0
24.5
35.9
18.7
-10.3
8.2
8.5
17.5
11.3
4.4
-14.9
55.9
4.1
33.1
73.1
45.6
30.0
61.6
51.7
-5.8
49.3
22.6
14 February 2018
46

MOSL Universe stock performance
Company
Prabhat Dairy
United Brew
United Spirits
Healthcare
Alembic Phar
Alkem Lab
Ajanta Pharma
Aurobindo
Biocon
Cadila
Cipla
Divis Lab
Dr Reddy’s
Fortis Health
Glenmark
Granules
GSK Pharma
IPCA Labs
Jubilant Life
Lupin
Laurus Labs
Sanofi India
Shilpa Medicare
Strides Shasun
Sun Pharma
Torrent Pharma
Infrastructure
Ashoka Buildcon
IRB Infra.Devl.
KNR Construct.
Sadbhav Engg.
Logistics
Allcargo Logistics
Concor
Gateway Distriparks
Media
Dish TV
D B Corp
Den Net.
Ent.Network
Hathway Cab.
Hind. Media
HT Media
Jagran Prak.
Music Broadcast
PVR
Prime Focus
Siti Net.
Sun TV
Zee Ent.
Metals
Hindalco
Hind. Zinc
JSPL
JSW Steel
1 Day (%)
1.1
0.9
2.2
2.1
-0.1
0.7
3.0
0.8
2.9
-0.1
1.8
0.2
-6.1
0.0
2.9
-0.1
3.2
-0.6
2.2
0.5
2.2
-1.6
0.1
1.1
-0.5
-0.9
2.4
5.3
1.3
2.4
0.4
-0.5
0.9
1.9
1.9
1.0
5.8
0.7
0.8
0.6
0.6
1.0
4.2
0.5
1.2
0.7
0.1
1.2
0.7
0.5
1M (%)
-17.3
-7.1
-14.4
0.1
-3.0
-5.1
-8.9
13.3
-5.7
1.8
-5.0
-10.1
-3.6
-14.3
-15.2
-1.1
14.2
17.3
-8.7
-5.4
2.9
-17.1
-10.1
0.9
3.2
-0.3
-9.0
3.2
-3.7
-10.2
-7.5
-12.1
-4.8
-13.2
-16.8
-10.7
-3.0
-6.4
-16.8
-7.9
-16.8
-3.5
-5.4
-25.0
-8.6
-1.2
-9.4
-5.0
3.5
8.6
12M (%)
32.0
35.4
38.5
-0.4
19.3
-20.3
-10.4
68.5
16.2
7.2
38.2
-26.1
-28.5
-43.9
-6.5
-10.7
23.4
31.9
-42.7
-3.2
15.7
-29.6
-37.7
-10.0
13.7
25.1
-2.3
79.5
43.9
16.4
24.9
-22.0
-14.8
-15.4
27.5
-13.2
8.1
-11.8
15.4
-8.5
8.5
20.9
-49.2
36.0
12.8
33.8
-2.5
201.2
61.3
Company
Nalco
NMDC
Rain Industries
SAIL
Vedanta
Tata Steel
Oil & Gas
BPCL
GAIL
Gujarat Gas
Gujarat St. Pet.
HPCL
IOC
IGL
Mahanagar Gas
MRPL
Oil India
ONGC
PLNG
Reliance Ind.
Retail
Jubilant Food
PC Jeweller
Titan Co.
Technology
Cyient
HCL Tech.
Hexaware
Infosys
KPIT Tech
L&T Infotech
Mindtree
Mphasis
NIIT Tech
Persistent Sys
Tata Elxsi
TCS
Tech Mah
Wipro
Zensar Tech
Telecom
Bharti Airtel
Bharti Infratel
Idea Cellular
Tata Comm
Utiltites
Coal India
CESC
JSW Energy
NHPC Ltd
NTPC
Power Grid
Tata Power
1 Day (%)
1.9
1.3
0.2
1.5
-0.5
4.2
-1.9
0.3
-0.6
-1.4
-0.9
0.1
4.3
5.9
0.3
1.4
1.7
0.6
1.9
1.3
4.1
1.3
-0.3
-2.5
-3.5
-0.7
0.0
4.5
0.7
-2.5
-0.4
-1.5
0.6
-0.1
-1.1
1.0
0.4
0.5
-1.0
1.0
1.7
-0.1
3.0
0.1
2.8
0.9
2.5
2.0
1M (%)
-10.7
-11.2
-12.3
-3.1
-7.1
-1.9
-5.0
-7.1
-7.0
-9.3
-8.0
-2.2
-7.5
-6.4
-11.0
-5.8
-4.7
-1.5
-3.4
6.1
-29.9
-10.7
8.1
1.4
-8.0
2.4
5.9
28.3
14.3
20.0
18.1
-0.2
-2.7
7.0
7.1
-9.7
3.1
-16.8
-9.5
-22.0
-3.9
-2.5
-10.6
-13.0
-6.9
-4.2
0.8
-12.4
12M (%)
15.6
-5.8
405.5
53.9
26.8
61.6
-2.2
28.2
37.7
22.5
2.7
-0.1
47.9
11.8
9.3
4.5
-1.3
30.4
77.6
104.5
92.6
87.5
34.4
13.3
61.1
14.0
60.0
109.0
54.7
56.1
94.3
27.4
35.1
23.8
17.8
23.0
1.8
18.5
6.9
-23.2
-13.6
-7.6
23.1
30.7
-2.5
-3.3
-0.9
6.4
14 February 2018
47

MOSL Universe stock performance
Company
Others
Arvind
Avenue Super.
Bata India
BSE
Castrol India
Coromandel Intl
Delta Corp
Eveready Inds.
Interglobe
Indo Count
Info Edge
Kaveri Seed
Manpasand
MCX
Monsanto
Navneet Educat.
Oberoi Realty
PI Inds.
Piramal Enterp.
Quess Corp
SRF
S H Kelkar
Team Lease Serv.
Trident
V-Guard
1 Day (%)
2.0
1.0
-0.1
0.8
0.9
-0.4
3.7
-1.2
-0.6
1.3
-3.6
0.4
4.3
2.5
0.3
6.0
1.4
4.1
1.6
1.6
1.1
1.2
0.0
4.3
2.8
1M (%)
-12.8
-3.8
-4.2
-13.5
3.8
-7.4
13.5
-16.8
1.4
-20.0
-10.5
-8.8
-12.6
-21.3
-3.2
-6.5
-13.6
-14.8
-5.7
-11.4
-5.7
-1.5
-3.6
-14.7
-4.0
12M (%)
5.7
43.0
-17.2
-5.2
51.7
184.4
50.3
49.3
-41.8
44.9
-0.7
19.4
-31.9
8.7
0.9
36.2
-4.9
52.3
45.0
8.1
-11.1
142.2
6.1
46.2
14 February 2018
48

THEMATIC/STRATEGY RESEARCH GALLERY

REPORT GALLERY
RECENT INITIATING COVERAGE REPORTS
Rs

DIFFERENTIATED PRODUCT GALLERY

Explanation of Investment Rating
Investment Rating
BUY
SELL
NEUTRAL
UNDER REVIEW
NOT RATED
Expected return (over 12-month)
>=15%
< - 10%
> - 10 % to 15%
Rating may undergo a change
We have forward looking estimates for the stock but we refrain from assigning recommendation
*In case the recommendation given by the Research Analyst becomes inconsistent with the investment rating legend, the Research Analyst shall within 28 days of the inconsistency, take appropriate measures to make the recommendation consistent with the investment rating legend.
Disclosures:
The following Disclosures are being made in compliance with the SEBI Research Analyst Regulations 2014 (herein after referred to as the Regulations).
Motilal Oswal Securities Ltd. (MOSL) is a SEBI Registered Research Analyst having registration no. INH000000412. MOSL, the Research Entity (RE) as defined in the Regulations, is engaged in the business of providing Stock broking services,
Investment Advisory Services, Depository participant services & distribution of various financial products. MOSL is a subsidiary company of Motilal Oswal Financial Service Ltd. (MOFSL). MOFSL is a listed public company, the details in respect of
which are available on
www.motilaloswal.com.
MOSL is registered with the Securities & Exchange Board of India (SEBI) and is a registered Trading Member with National Stock Exchange of India Ltd. (NSE) and Bombay Stock Exchange Limited
(BSE), Metropolitan Stock Exchange Of India Ltd. (MSE) for its stock broking activities & is Depository participant with Central Depository Services Limited (CDSL) & National Securities Depository Limited (NSDL) and is member of Association of
Mutual Funds of India (AMFI) for distribution of financial products. Details of associate entities of Motilal Oswal Securities Limited are available on the website at
http://onlinereports.motilaloswal.com/Dormant/documents/Associate%20Details.pdf
Regulatory Enquiries against Motilal Oswal Securities Limited by SEBI:
SEBI pursuant to a complaint from client Shri C.R. Mohanraj alleging unauthorized trading, issued a letter dated 29th April 2014 to MOSL notifying appointment of an Adjudicating Officer as per SEBI regulations to hold inquiry and
adjudge violation of SEBI Regulations; MOSL requested SEBI to provide all documents, records, investigation report relied upon by SEBI which were referred in Show Cause Notice. The matter is closed and MOSL had to pay Rs. 2
lakhs towards penalty for misplacement of original POA of client.
MOSL, it’s associates, Research Analyst or their relative may have any financial interest in the subject company. MOSL and/or its associates and/or Research Analyst may have beneficial ownership of 1% or more securities in the subject company at
the end of the month immediately preceding the date of publication of the Research Report.
MOSL and its associate company(ies), their directors and Research Analyst and their relatives may; (a) from time to time, have a long or short position in, act
as principal in, and buy or sell the securities or derivatives thereof of companies mentioned herein. (b) be engaged in any other transaction involving such securities and earn brokerage or other compensation or act as a market maker in the financial
instruments of the company(ies) discussed herein or act as an advisor or lender/borrower to such company(ies) or may have any other potential conflict of interests with respect to any recommendation and other related information and opinions.;
however the same shall have no bearing whatsoever on the specific recommendations made by the analyst(s), as the recommendations made by the analyst(s) are completely independent of the views of the associates of MOSL even though there
might exist an inherent conflict of interest in some of the stocks mentioned in the research report.
Research Analyst may have served as director/officer, etc. in the subject company in the last 12 month period. MOSL and/or its associates may have
received any compensation from the subject company in the past 12 months.
In the last 12 months period ending on the last day of the month immediately preceding the date of publication of this research report, MOSL or any of its associates may have:
a)
managed or co-managed public offering of securities from subject company of this research report,
b)
received compensation for investment banking or merchant banking or brokerage services from subject company of this research report,
c)
received compensation for products or services other than investment banking or merchant banking or brokerage services from the subject company of this research report.
d)
Subject Company may have been a client of MOSL or its associates during twelve months preceding the date of distribution of the research report.
MOSL and it’s associates have not received any compensation or other benefits from the subject company or third party in connection with the research report. To enhance transparency, MOSL has incorporated a Disclosure of Interest Statement in
this document. This should, however, not be treated as endorsement of the views expressed in the report. MOSL and / or its affiliates do and seek to do business including investment banking with companies covered in its research reports. As a result,
the recipients of this report should be aware that MOSL may have a potential conflict of interest that may affect the objectivity of this report. Compensation of Research Analysts is not based on any specific merchant banking, investment banking or
brokerage service transactions.
Terms & Conditions:
This report has been prepared by MOSL and is meant for sole use by the recipient and not for circulation. The report and information contained herein is strictly confidential and may not be altered in any way, transmitted to, copied or distributed, in part
or in whole, to any other person or to the media or reproduced in any form, without prior written consent of MOSL. The report is based on the facts, figures and information that are considered true, correct, reliable and accurate. The intent of this report
is not recommendatory in nature. The information is obtained from publicly available media or other sources believed to be reliable. Such information has not been independently verified and no guaranty, representation of warranty, express or implied,
is made as to its accuracy, completeness or correctness. All such information and opinions are subject to change without notice. The report is prepared solely for informational purpose and does not constitute an offer document or solicitation of offer to
buy or sell or subscribe for securities or other financial instruments for the clients. Though disseminated to all the customers simultaneously, not all customers may receive this report at the same time. MOSL will not treat recipients as customers by
virtue of their receiving this report.
Analyst Certification
The views expressed in this research report accurately reflect the personal views of the analyst(s) about the subject securities or issues, and no part of the compensation of the research analyst(s) was, is, or will be directly or indirectly related to the
specific recommendations and views expressed by research analyst(s) in this report.
Disclosure of Interest Statement
Analyst ownership of the stock
Companies where there is interest
No
A graph of daily closing prices of securities is available at
www.nseindia.com, www.bseindia.com.
Research Analyst views on Subject Company may vary based on Fundamental research and Technical Research. Proprietary trading desk of MOSL or
its associates maintains arm’s length distance with Research Team as all the activities are segregated from MOSL research activity and therefore it can have an independent view with regards to subject company for which Research Team have
expressed their views.
Regional Disclosures (outside India)
This report is not directed or intended for distribution to or use by any person or entity resident in a state, country or any jurisdiction, where such distribution, publication, availability or use would be contrary to law, regulation or which would subject
MOSL & its group companies to registration or licensing requirements within such jurisdictions.
For Hong Kong:
This report is distributed in Hong Kong by Motilal Oswal capital Markets (Hong Kong) Private Limited, a licensed corporation (CE AYY-301) licensed and regulated by the Hong Kong Securities and Futures Commission (SFC) pursuant to the Securities
and Futures Ordinance (Chapter 571 of the Laws of Hong Kong) “SFO”. As per SEBI (Research Analyst Regulations) 2014 Motilal Oswal Securities (SEBI Reg No. INH000000412) has an agreement with Motilal Oswal capital Markets (Hong Kong)
Private Limited for distribution of research report in Hong Kong. This report is intended for distribution only to “Professional Investors” as defined in Part I of Schedule 1 to SFO. Any investment or investment activity to which this document relates is only
available to professional investor and will be engaged only with professional investors.” Nothing here is an offer or solicitation of these securities, products and services in any jurisdiction where their offer or sale is not qualified or exempt from
registration. The Indian Analyst(s) who compile this report is/are not located in Hong Kong & are not conducting Research Analysis in Hong Kong.
For U.S.
Motilal Oswal Securities Limited (MOSL) is not a registered broker - dealer under the U.S. Securities Exchange Act of 1934, as amended (the"1934 act") and under applicable state laws in the United States. In addition MOSL is not a registered
investment adviser under the U.S. Investment Advisers Act of 1940, as amended (the "Advisers Act" and together with the 1934 Act, the "Acts), and under applicable state laws in the United States. Accordingly, in the absence of specific exemption
under the Acts, any brokerage and investment services provided by MOSL, including the products and services described herein are not available to or intended for U.S. persons. This report is intended for distribution only to "Major Institutional
Investors" as defined by Rule 15a-6(b)(4) of the Exchange Act and interpretations thereof by SEC (henceforth referred to as "major institutional investors"). This document must not be acted on or relied on by persons who are not major institutional
investors. Any investment or investment activity to which this document relates is only available to major institutional investors and will be engaged in only with major institutional investors. In reliance on the exemption from registration provided by Rule
15a-6 of the U.S. Securities Exchange Act of 1934, as amended (the "Exchange Act") and interpretations thereof by the U.S. Securities and Exchange Commission ("SEC") in order to conduct business with Institutional Investors based in the U.S.,
MOSL has entered into a chaperoning agreement with a U.S. registered broker-dealer, Motilal Oswal Securities International Private Limited. ("MOSIPL"). Any business interaction pursuant to this report will have to be executed within the provisions of
this chaperoning agreement.
The Research Analysts contributing to the report may not be registered /qualified as research analyst with FINRA. Such research analyst may not be associated persons of the U.S. registered broker-dealer, MOSIPL, and therefore, may not be subject
to NASD rule 2711 and NYSE Rule 472 restrictions on communication with a subject company, public appearances and trading securities held by a research analyst account.
For Singapore
Motilal Oswal Capital Markets Singapore Pte Limited is acting as an exempt financial advisor under section 23(1)(f) of the Financial Advisers Act(FAA) read with regulation 17(1)(d) of the Financial Advisors Regulations and is a subsidiary of Motilal
Oswal Securities Limited in India. This research is distributed in Singapore by Motilal Oswal Capital Markets Singapore Pte Limited and it is only directed in Singapore to accredited investors, as defined in the Financial Advisers Regulations and the
Securities and Futures Act (Chapter 289), as amended from time to time. In respect of any matter arising from or in connection with the research you could contact the following representatives of Motilal Oswal Capital Markets Singapore Pte Limited:
Disclaimer:
The report and information contained herein is strictly confidential and meant solely for the selected recipient and may not be altered in any way, transmitted to, copied or distributed, in part or in whole, to any other person or to the media or reproduced
in any form, without prior written consent. This report and information herein is solely for informational purpose and may not be used or considered as an offer document or solicitation of offer to buy or sell or subscribe for securities or other financial
instruments. Nothing in this report constitutes investment, legal, accounting and tax advice or a representation that any investment or strategy is suitable or appropriate to your specific circumstances. The securities discussed and opinions expressed in
this report may not be suitable for all investors, who must make their own investment decisions, based on their own investment objectives, financial positions and needs of specific recipient. This may not be taken in substitution for the exercise of
independent judgment by any recipient. Each recipient of this document should make such investigations as it deems necessary to arrive at an independent evaluation of an investment in the securities of companies referred to in this document
(including the merits and risks involved), and should consult its own advisors to determine the merits and risks of such an investment. The investment discussed or views expressed may not be suitable for all investors. Certain transactions -including
those involving futures, options, another derivative products as well as non-investment grade securities - involve substantial risk and are not suitable for all investors. No representation or warranty, express or implied, is made as to the accuracy,
completeness or fairness of the information and opinions contained in this document. The Disclosures of Interest Statement incorporated in this document is provided solely to enhance the transparency and should not be treated as endorsement of the
views expressed in the report. This information is subject to change without any prior notice. The Company reserves the right to make modifications and alternations to this statement as may be required from time to time without any prior approval.
MOSL, its associates, their directors and the employees may from time to time, effect or have effected an own account transaction in, or deal as principal or agent in or for the securities mentioned in this document. They may perform or seek to perform
investment banking or other services for, or solicit investment banking or other business from, any company referred to in this report. Each of these entities functions as a separate, distinct and independent of each other. The recipient should take this
into account before interpreting the document. This report has been prepared on the basis of information that is already available in publicly accessible media or developed through analysis of MOSL. The views expressed are those of the analyst, and
the Company may or may not subscribe to all the views expressed therein. This document is being supplied to you solely for your information and may not be reproduced, redistributed or passed on, directly or indirectly, to any other person or
published, copied, in whole or in part, for any purpose. This report is not directed or intended for distribution to, or use by, any person or entity who is a citizen or resident of or located in any locality, state, country or other jurisdiction, where such
distribution, publication, availability or use would be contrary to law, regulation or which would subject MOSL to any registration or licensing requirement within such jurisdiction. The securities described herein may or may not be eligible for sale in all
jurisdictions or to certain category of investors. Persons in whose possession this document may come are required to inform themselves of and to observe such restriction. Neither the Firm, not its directors, employees, agents or representatives shall
be liable for any damages whether direct or indirect, incidental, special or consequential including lost revenue or lost profits that may arise from or in connection with the use of the information.
The person accessing this information specifically agrees
to exempt MOSL or any of its affiliates or employees from, any and all responsibility/liability arising from such misuse and agrees not to hold MOSL or any of its affiliates or employees responsible for any such misuse and further agrees to hold MOSL
or any of its affiliates or employees free and harmless from all losses, costs, damages, expenses that may be suffered by the person accessing this information due to any errors and delays.
Registered Office Address: Motilal Oswal Tower, Rahimtullah Sayani Road, Opposite Parel ST Depot, Prabhadevi, Mumbai-400025; Tel No.: 022-3980 4263; www.motilaloswal.com. Correspondence Address: Palm Spring Centre, 2nd Floor, Palm
Court Complex, New Link Road, Malad (West), Mumbai- 400 064. Tel No: 022 3080 1000. Compliance Officer: Neeraj Agarwal, Email Id:
na@motilaloswal.com,
Contact No.:022-30801085.
Registration details of group entities.: MOSL: SEBI Registration: INZ000158836 (BSE/NSE/MSE); CDSL: IN-DP-16-2015; NSDL: IN-DP-NSDL-152-2000; Research Analyst: INH000000412. AMFI: ARN 17397. Investment Adviser: INA000007100.
Motilal Oswal Asset Management Company Ltd. (MOAMC): PMS (Registration No.: INP000000670) offers PMS and Mutual Funds products. Motilal Oswal Wealth Management Ltd. (MOWML): PMS (Registration No.: INP000004409) offers wealth
management solutions. *Motilal Oswal Securities Ltd. is a distributor of Mutual Funds, PMS, Fixed Deposit, Bond, NCDs, Insurance and IPO products. * Motilal Oswal Commodities Broker Pvt. Ltd. offers Commodities Products. * Motilal Oswal Real
Estate Investment Advisors II Pvt. Ltd. offers Real Estate products. * Motilal Oswal Private Equity Investment Advisors Pvt. Ltd. offers Private Equity products
13 December 2016
50