Page Industries
BSE SENSEX
34,142
S&P CNX
10,491
23 February 2018
Update
| Sector:
Consumer
CMP: INR22,759
TP: INR27,490 (+21%)
Buy
Massive growth opportunity available to sustain premium valuations
We met Page Industries’ (PAG) management, post which we have turned even more
optimistic about the company’s growth prospects.
Expansion of Exclusive Brand Outlets (EBOs) is happening at a massive pace. The
company is adding ~80 outlets in February/March 2018 and likely another 500 in
FY19, taking the total EBO count to ~1,000 by end-FY19.
Stock Info
Bloomberg
Equity Shares (m)
52-Week Range (INR)
1, 6, 12 Rel. Per (%)
M.Cap. (INR b)
M.Cap. (USD b)
Avg Val, INRm
Free float (%)
PAG IN
112.0
25779 / 13650
9/24/44
249.0
3.8
309.0
51.0
After forming ~15% of sales in FY17, EBOs are expected to contribute ~40% of sales
by FY20 – the year when all the new EBOs will complete at least a year of operations.
With average cash breakeven in 3-4 months and payback of around 2 years, EBOs are
an attractive business proposition to third-party franchisees. Compared to MBOs, the
potential for cross-selling is huge in EBOs.
Financials Snapshot (INR b)
Y/E Mar
2018E 2019E 2020E
Net Sales
25.4 32.3
41.1
EBITDA
5.2
7.1
9.3
PAT
3.3
4.6
6.1
EPS (INR)
297.1 415.7 549.8
Gr. (%)
24.5 39.9
32.2
BV/Sh (INR)
745.5 932.5 1152.5
RoE (%)
39.9 44.6
47.7
RoCE (%)
41.4 47.5
51.7
P/E (x)
76.6 54.7
41.4
EV/EBITDA (x)
48.6 35.5
27.1
Shareholding pattern (%)
As On
Dec-17 Sep-17 Dec-16
Promoter
49.0
49.0
49.0
DII
5.2
5.7
4.8
FII
36.8
36.2
37.2
Others
9.0
9.1
9.0
FII Includes depository receipts
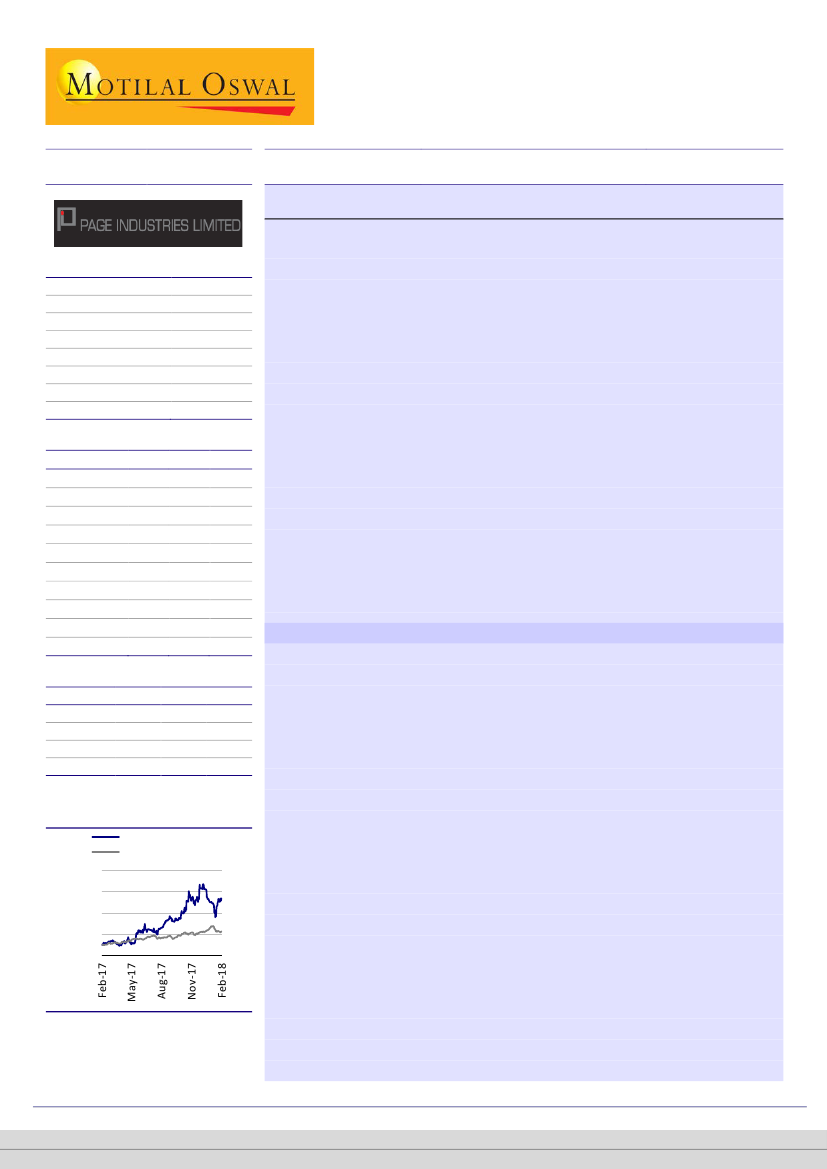
Stock Performance (1-year)
Page Industries
Sensex - Rebased
28,000
24,000
20,000
16,000
12,000
Apart from INR2b capex over FY17-20, the company plans to increase the proportion
of outsourced manufacturing to 35% by end-FY19 from 16-17% in FY17, as the growth
prospects are attractive.
PAG has demonstrated ample discipline on margins, which the company intends to
keep in a range to maximize the growth opportunity. Within its target market of
aspirers and above, the share of men’s innerwear is only ~17%, and of women’s
innerwear and sportswear is even lower at ~6%.
We maintain Buy with a target price of INR27,490, based on 50x March FY20E EPS –
at a 10% discount to the three-year average P/E.
Rapid EBO expansion reflects management’s confidence about the model
PAG operated 360 EBOs at end-March 2017. The contribution of EBOs to total
sales has increased significantly in recent years – from single-digits to ~15% in
FY17. These EBOs are a win-win proposition to both the company and the
franchisees. For PAG, EBOs generate several times higher sales than MBOs,
enable display of its full-range of products, and facilitate cross-selling. For the
EBO owner, the business metrics are favourable because, on average, cash
breakeven is attained in three months and payback in two years.
From ~420 stores at the beginning of February 2018, PAG is adding as many as
80 stores in February and March, taking the total number of stores to ~500 by
end-FY18. More impressively, the company is planning to add as many as 500
stores by end-FY19, doubling its store count to 1,000. From 15% of sales in
FY17, EBOs are expected to contribute ~40% of sales by FY20.
Such massive expansion is indicative of the strong confidence (of both
management and franchisees) about growth prospects of EBOs. We believe
that, with PAG’s entry into kids innerwear (boys wear products launched last
year saw excellent response and are now available at most EBOs; girls wear will
be launched in March 2018), the potential of cross-selling increases further.
Within its target market of aspirers and above, the share is only ~17% in case
of men’s innerwear, and 6% in women’s innerwear and sportswear.
EBOs are given 7% higher margins than MBOs. Of this, 3.5% comes from the
company and 3.5% from distributors.
Krishnan Sambamoorthy – Research Analyst
(Krishnan.Sambamoorthy@MotilalOswal.com); +91 22 6129 1545
Vishal Punmiya – Research Analyst
(Vishal.Punmiya@MotilalOswal.com); +91 22 6129 1547
Motilal Oswal research is available on www.motilaloswal.com/Institutional-Equities, Bloomberg, Thomson Reuters, Factset and S&P Capital.
Investors are advised to refer through important disclosures made at the last page of the Research Report.

Page Industries
There will be some shift from MBOs to EBOs, but the overall market for branded
players like PAG is growing rapidly. Our channel checks over the past few years
indicate that the EBO model is doing very well.
EBOs are typically 600-800 sq. ft. in size and have around 30 days inventory on
average. New EBOs will be set up in both existing and new cities.
Increased outsourcing and significant investment in capex
Since the manufacturing process involves hand-stitching, it is fairly labor-
intensive. PAG had ~20,000 employees in FY17 and expanding the workforce
sharply may pose challenges. Thus, the company is looking to increase the
proportion of outsourcing from 17% of sales in FY17 to ~35% by FY19.
The company would not have equity stakes in entities taking up the outsourced
work. Such entities will primarily be the erstwhile fabric suppliers whose
employees will be trained to make Jockey products.
Starting with Athleisure, the company gradually plans to increase outsourcing to
men’s innerwear and subsequently to women’s innerwear.
The outsourcers will set up captive capacity for Jockey. Some of these suppliers
are outside Karnataka and some within the state.
In addition, PAG intends to incur capex of INR600-700m each year over FY17-20.
This will be a combination of greenfield and brownfield. Greenfield expansion
will be in Anantapur, Andhra Pradesh (to be commissioned in September 2018)
and Orissa (to be commissioned by April- May 2019).
Other key highlights
PAG is also increasing the number of distributors by ~10% every year. It is the
distributors who also supply to the EBOs.
Franchisee agreement with Jockey is until 2030. Royalty has been at 5% since
inception. In fact, royalty has been at 5% even for the promoter family in the
Philippines business since 1959.
Our channel checks in the past have suggested that competitive intensity
remains low, with Van Heusen too unable to make a dent in most key markets
(just like Hanes in the past).
Ecommerce agreements are of three types:
Direct sales to the likes of Flipkart and Amazon
Sales to aggregators
Sales through its own site jockeyindia.com
Ecommerce is 2.6% of sales and offers another attractive growth opportunity.
Valuation view
Remarkable track record (neither revenue growth nor EPS growth has slipped below
15% in any year in the past) with healthy growth even during slowdown witnessed
by other consumer peers, highly capital-efficient business model with RoCEs
consistently over 40%, and among the best-of-breed earnings growth prospects
mean that valuation multiples are likely to sustain. Sharply increased pace of EBO
expansion and increased outsourcing reflect management’s confidence on future
prospects and also have positive implications for incremental RoCE improvement.
We maintain
Buy
with a TP of INR27,350 based on 50x Mar’20E EPS, at a 10%
discount to three-year average P/E.
23 February 2018
2

Page Industries
Exhibit 1: Page P/E (x)
P/E (x)
Min (x)
80.0
55.0
30.0
5.0
33.6
9.2
16.1
51.2
Avg (x)
+1SD
Max (x)
-1SD
76.2
56.1
Exhibit 2: Consumer P/E (x)
47.0
39.0
31.0
23.0
15.0
P/E (x)
Min (x)
Avg (x)
+1SD
37.5
Max (x)
-1SD
41.2
30.6
23.6
17.1
38.7
Source: Company, MOSL
Exhibit 3: Valuation matrix
Company
Consumer
Asian Paints
Britannia Inds.
Colgate-Palm.
Dabur India
Emami
Godrej Cons.
GSK C H L
Hind. Unilever
ITC
Jyothy Lab.
Marico
Nestle India
P & G Hygiene
Page Industries
Parag Milk
Pidilite Inds.
United Brew.
United Spirits
Retail
Jubilant Food.
PC Jeweller
Titan Company
Reco
CMP
(INR)
Neutral
Buy
Buy
Buy
Buy
Neutral
Neutral
Buy
Neutral
Neutral
Neutral
Neutral
Neutral
Buy
Neutral
Buy
Buy
Neutral
Neutral
Buy
Buy
1,102
4,964
1,050
329
1,070
1,048
6,762
1,323
Target Price
(INR)
1,270
5,995
1,365
415
1,505
1,065
6,350
1,585
Mkt Cap
EPS Growth YoY (%)
FY19E
18.8
24.8
17.9
19.2
30.5
15.1
14.1
20.7
13.7
32.0
19.2
13.6
20.5
39.9
38.7
17.8
23.9
73.4
29.6
26.6
27.0
FY20E FY18E
20.2
25.1
19.7
16.2
19.1
14.2
17.4
18.1
12.4
24.2
18.4
20.8
17.3
32.2
35.6
15.5
31.2
38.1
31.3
27.6
24.1
51.1
58.9
43.8
43.5
44.6
50.1
42.0
57.3
30.1
42.9
48.2
54.2
65.8
76.6
32.4
50.7
76.6
98.5
66.0
21.6
65.0
P/E (x)
FY19E
43.0
47.2
37.2
36.5
34.2
43.5
36.8
47.5
26.4
32.5
40.4
47.7
54.6
54.7
23.4
43.1
61.9
56.8
50.9
17.0
51.1
FY20E
35.8
37.7
31.0
31.4
28.7
38.1
31.3
40.2
23.5
26.2
34.1
39.4
46.5
41.4
17.3
37.3
47.1
41.2
38.8
13.4
41.2
Upside
(INR B) (USD B) FY18E
(%)
15
21
30
26
41
2
-6
20
3
9
13
4
0
21
8
17
28
9
9
106
22
1,071
583
284
576
241
708
284
2,867
3,245
64
391
727
305
249
24
454
279
459
130
130
725
16.5
9.0
4.4
8.9
3.7
10.9
4.4
44.3
50.1
1.0
6.0
11.2
4.7
3.8
0.4
7.0
4.3
7.1
2.0
2.0
11.2
2.7
14.3
12.9
4.5
-9.6
10.6
3.1
17.6
6.6
-27.7
1.2
13.2
6.9
24.5
147.7
5.7
62.0
22.9
186.2
44.4
38.8
RoE
(%)
FY18E
26.9
33.9
49.9
25.4
29.0
23.6
20.7
76.5
22.8
13.8
33.0
43.4
61.2
39.9
10.8
25.2
14.9
17.3
22.5
16.9
23.4
Div.
(%)
FY17
0.9
0.5
1.0
0.8
0.8
0.6
1.0
1.2
2.1
1.7
1.0
0.8
3.5
0.4
0.0
0.5
0.1
0.0
0.1
0.3
0.4
269
278
349
380
306
345
7,583 7,882
9,344 9,303
22,759 27,490
290
314
897
1,050
1,078 1,380
3,238 3,515
2,003
333
814
2,185
685
990
Source: Company, MOSL
23 February 2018
3

Page Industries
Story in charts
Exhibit 4: Sales to grow at a CAGR of 27% over FY18-20
Revenue (INR b)
Revenue growth (%)
Exhibit 5: EBITDA margins to expand 210bp over the same
period
Gross margin (%)
21.0
EBITDA margin (%)
61.8
60.5 61.2
59.5
20.2
21.5
56.5
20.7 20.9
19.4
20.4
44.6
40.0
25.7
35.6 29.9
16.4
18.6 19.3
21
25
27.1 27.4
54.8
22.0 22.5
55.0 53.5
5
7
9
12
15
18
32
41
19.3
52.7 52.0
Source: Company, MOSL
Exhibit 6: EBITDA to grow at a CAGR of 34% over FY18-20
EBITDA (INR b)
52.2
40.0
20.8
1
1
2
3
44.5
25.1
17.6
3
4
10.1
4
5
7
9
25.6
EBITDA growth (%)
Exhibit 7: PAT to grow at CAGR of 36% over FY18-20
PAT (INR b)
47.8
53.7
36.7
25.1
1
1
1
2
27.5
18.1
2
2
15.0
3
3
5
6
39.9
24.5
32.2
PAT growth (%)
37.2
30.2
Source: Company, MOSL
Exhibit 8: Return ratios to improve
RoE (%)
47
54
53
53
51
44
RoCE (%)
45
48
Exhibit 9: Turnover to improve led by outsourcing
Gross FA t/o ratio (x)
Net FA t/o ratio (x)
7
5
6.5
5.3
5
5
5
5
6
5
6
9.9
8.5
11.8
40
40
4
39.3 42.4 42.6 41.6 41.7 40.4 41.4
47.5
51.7
31.4
6.6
6.9
7.1
8.3
9.0
Source: Company, MOSL
23 February 2018
4

Page Industries
Financials and valuations
Income Statement
Y/E March
Net Sales
Change (%)
Total Expenditure
EBITDA
Change (%)
Margin (%)
Depreciation
Int. and Fin. Ch.
Other Inc.- Rec.
PBT
Change (%)
Tax
Tax Rate (%)
Adjusted PAT
Change (%)
Reported PAT
Balance Sheet
Y/E March
Share Capital
Reserves
Net Worth
Loans
Capital Employed
Gross Block
Less: Accum. Depn.
Net Fixed Assets
Capital WIP
Investments
Curr. Assets, L&A
Inventory
Account Receivables
Cash and Bank Balance
Others
Curr. Liab. and Prov.
Account Payables
Other Liabilities
Provisions
Net Curr. Assets
Def. Tax Liability
Appl. of Funds
E: MOSL Estimates
0.01523
2015
15,430
29.9
12,240
3,190
25.1
20.7
176
167
86
2,933
25.6
973
33.2
1,960
27.5
1,960
2016
17,956
16.4
14,204
3,752
17.6
20.9
241
178
98
3,431
17.0
1,116
32.5
2,315
18.1
2,315
2017
21,301
18.6
17,169
4,132
10.1
19.4
247
180
243
3,948
15.1
1,285
32.6
2,663
15.0
2,663
2018E
25,403
19.3
20,215
5,188
25.6
20.4
280
165
203
4,946
25.3
1,632
33.0
3,314
24.5
3,314
2019E
32,280
27.1
25,164
7,117
37.2
22.0
331
123
258
6,921
39.9
2,284
33.0
4,637
39.9
4,637
(INR Million)
2020E
41,113
27.4
31,848
9,266
30.2
22.5
371
71
329
9,153
32.2
3,021
33.0
6,133
32.2
6,133
(INR Million)
2020E
112
12,743
12,855
187
13,041
5,834
2,348
3,486
376
500
15,791
9,574
1,802
2,572
1,842
6,999
2,140
1,126
3,733
8,791
112
13,041
2015
112
3,756
3,868
1,573
5,440
3,059
886
2,173
1
0
6,061
4,435
884
44
698
2,680
821
504
1,355
3,381
114
5,440
2016
112
5,187
5,299
949
6,248
3,286
1,120
2,167
4
0
7,445
5,408
1,024
86
926
3,289
941
640
1,708
4,156
79
6,248
2017
112
6,546
6,658
887
7,544
3,728
1,367
2,361
241
521
8,571
6,229
1,099
206
1,037
4,038
1,112
705
2,220
4,533
112
7,544
2018E
112
8,203
8,315
687
9,001
4,634
1,647
2,987
376
2,000
8,271
5,916
1,253
222
881
4,521
1,322
766
2,433
3,750
112
9,001
2019E
112
10,290
10,401
487
10,888
5,234
1,977
3,257
376
500
12,524
8,225
1,503
1,320
1,476
5,657
1,680
884
3,092
6,867
112
10,888
23 February 2018
5

Page Industries
Financials and valuations
Ratios
Y/E March
Basic (INR)
EPS
Cash EPS
BV/Share
DPS
Payout (%)
Valuation (x)
P/E
Cash P/E
EV/EBITDA
Dividend Yield (%)
Return Ratios (%)
RoE
RoCE
RoIC
Working Capital Ratios
Asset Turnover (x)
Debtor Days
Creditor Days
Inventory Days
Leverage Ratio
Debt/Equity (x)
Cash Flow Statement
Y/E March
Profit before Tax
Depreciation
Other Non Cash & Non operating activities
Incr in WC
Direct Taxes Paid
CF from Operations
Incr in FA
Free Cash Flow
Pur of Investments
CF from Invest.
Incr in Debt
Dividend Paid
Others
CF from Fin. Activity
Incr/Decr of Cash
Add: Opening Balance
Closing Balance
E: MOSL Estimates
2015
175.7
191.5
346.8
72.0
48.9
2016
207.6
229.2
475.1
85.0
49.3
2017
238.7
260.9
596.9
87.0
43.7
95.3
87.2
61.5
0.4
50.7
41.6
40.9
3.1
19
17
95
0.4
43.7
41.7
41.0
3.1
19
18
100
0.2
40.0
40.4
41.2
3.1
18
18
100
0.1
2018E
297.1
322.2
745.5
127.0
50.0
76.6
70.6
48.6
0.6
39.9
41.4
50.7
3.1
17
17
87
0.1
2019E
415.7
445.4
932.5
195.4
55.0
54.7
51.1
35.5
0.9
44.6
47.5
60.2
3.2
16
17
80
0.0
2020E
549.8
583.1
1,152.5
282.0
60.0
41.4
39.0
27.1
1.2
47.7
51.7
65.2
3.4
15
17
79
0.0
(INR Million)
2015
2,933
176
96
-569
-966
1,670
-534
1,136
2
-531
-59
-899
-170
-1,128
10
34
44
2016
3,431
241
80
-733
-1,116
1,903
-228
1,675
98
-130
-624
-1,142
35
-1,731
43
43
86
2017
3,948
247
-63
-257
-1,285
2,590
-618
1,972
-278
-896
-62
-1,164
-135
-1,361
333
-127
206
2018E
4,946
280
-38
799
-1,632
4,355
-907
3,448
-1,276
-2,182
-200
-1,657
-254
-2,111
62
161
222
2019E
6,921
331
-135
-2,019
-2,284
2,813
-600
2,213
1,758
1,158
-200
-2,550
-212
-2,962
1,009
311
1,320
2020E
9,153
371
-258
-671
-3,021
5,574
-600
4,974
329
-271
-300
-3,680
-160
-4,140
1,163
1,409
2,572
23 February 2018
6

Page Industries
NOTES
23 February 2018
7

Explanation of Investment Rating
Investment Rating
BUY
SELL
NEUTRAL
UNDER REVIEW
NOT RATED
Expected return (over 12-month)
>=15%
< - 10%
> - 10 % to 15%
Rating may undergo a change
We have forward looking estimates for the stock but we refrain from assigning recommendation
Page Industries
*In case the recommendation given by the Research Analyst becomes inconsistent with the investment rating legend, the Research Analyst shall within 28 days of the inconsistency, take appropriate measures to make the recommendation consistent with the investment rating legend.
Disclosures:
The following Disclosures are being made in compliance with the SEBI Research Analyst Regulations 2014 (herein after referred to as the Regulations).
Motilal Oswal Securities Ltd. (MOSL) is a SEBI Registered Research Analyst having registration no. INH000000412. MOSL, the Research Entity (RE) as defined in the Regulations, is engaged in the business of providing Stock broking services,
Investment Advisory Services, Depository participant services & distribution of various financial products. MOSL is a subsidiary company of Motilal Oswal Financial Service Ltd. (MOFSL). MOFSL is a listed public company, the details in respect of
which are available on
www.motilaloswal.com.
MOSL is registered with the Securities & Exchange Board of India (SEBI) and is a registered Trading Member with National Stock Exchange of India Ltd. (NSE) and Bombay Stock Exchange Limited
(BSE), Metropolitan Stock Exchange Of India Ltd. (MSE) for its stock broking activities & is Depository participant with Central Depository Services Limited (CDSL) & National Securities Depository Limited (NSDL) and is member of Association of
Mutual Funds of India (AMFI) for distribution of financial products. Details of associate entities of Motilal Oswal Securities Limited are available on the website at
http://onlinereports.motilaloswal.com/Dormant/documents/Associate%20Details.pdf
Regulatory Enquiries against Motilal Oswal Securities Limited by SEBI:
SEBI pursuant to a complaint from client Shri C.R. Mohanraj alleging unauthorized trading, issued a letter dated 29th April 2014 to MOSL notifying appointment of an Adjudicating Officer as per SEBI regulations to hold inquiry and
adjudge violation of SEBI Regulations; MOSL requested SEBI to provide all documents, records, investigation report relied upon by SEBI which were referred in Show Cause Notice. The matter is closed and MOSL had to pay Rs. 2
lakhs towards penalty for misplacement of original POA of client.
MOSL, it’s associates, Research Analyst or their relative may have any financial interest in the subject company. MOSL and/or its associates and/or Research Analyst may have beneficial ownership of 1% or more securities in the subject company at
the end of the month immediately preceding the date of publication of the Research Report.
MOSL and its associate company(ies), their directors and Research Analyst and their relatives may; (a) from time to time, have a long or short position in, act
as principal in, and buy or sell the securities or derivatives thereof of companies mentioned herein. (b) be engaged in any other transaction involving such securities and earn brokerage or other compensation or act as a market maker in the financial
instruments of the company(ies) discussed herein or act as an advisor or lender/borrower to such company(ies) or may have any other potential conflict of interests with respect to any recommendation and other related information and opinions.;
however the same shall have no bearing whatsoever on the specific recommendations made by the analyst(s), as the recommendations made by the analyst(s) are completely independent of the views of the associates of MOSL even though there
might exist an inherent conflict of interest in some of the stocks mentioned in the research report.
Research Analyst may have served as director/officer, etc. in the subject company in the last 12 month period. MOSL and/or its associates may have
received any compensation from the subject company in the past 12 months.
In the last 12 months period ending on the last day of the month immediately preceding the date of publication of this research report, MOSL or any of its associates may have:
a)
managed or co-managed public offering of securities from subject company of this research report,
b)
received compensation for investment banking or merchant banking or brokerage services from subject company of this research report,
c)
received compensation for products or services other than investment banking or merchant banking or brokerage services from the subject company of this research report.
d)
Subject Company may have been a client of MOSL or its associates during twelve months preceding the date of distribution of the research report.
MOSL and it’s associates have not received any compensation or other benefits from the subject company or third party in connection with the research report. To enhance transparency, MOSL has incorporated a Disclosure of Interest Statement in
this document. This should, however, not be treated as endorsement of the views expressed in the report. MOSL and / or its affiliates do and seek to do business including investment banking with companies covered in its research reports. As a result,
the recipients of this report should be aware that MOSL may have a potential conflict of interest that may affect the objectivity of this report. Compensation of Research Analysts is not based on any specific merchant banking, investment banking or
brokerage service transactions.
Terms & Conditions:
This report has been prepared by MOSL and is meant for sole use by the recipient and not for circulation. The report and information contained herein is strictly confidential and may not be altered in any way, transmitted to, copied or distributed, in part
or in whole, to any other person or to the media or reproduced in any form, without prior written consent of MOSL. The report is based on the facts, figures and information that are considered true, correct, reliable and accurate. The intent of this report
is not recommendatory in nature. The information is obtained from publicly available media or other sources believed to be reliable. Such information has not been independently verified and no guaranty, representation of warranty, express or implied,
is made as to its accuracy, completeness or correctness. All such information and opinions are subject to change without notice. The report is prepared solely for informational purpose and does not constitute an offer document or solicitation of offer to
buy or sell or subscribe for securities or other financial instruments for the clients. Though disseminated to all the customers simultaneously, not all customers may receive this report at the same time. MOSL will not treat recipients as customers by
virtue of their receiving this report.
Analyst Certification
The views expressed in this research report accurately reflect the personal views of the analyst(s) about the subject securities or issues, and no part of the compensation of the research analyst(s) was, is, or will be directly or indirectly related to the
specific recommendations and views expressed by research analyst(s) in this report.
Disclosure of Interest Statement
Analyst ownership of the stock
Page Industries
No
A graph of daily closing prices of securities is available at
www.nseindia.com, www.bseindia.com.
Research Analyst views on Subject Company may vary based on Fundamental research and Technical Research. Proprietary trading desk of MOSL or
its associates maintains arm’s length distance with Research Team as all the activities are segregated from MOSL research activity and therefore it can have an independent view with regards to subject company for which Research Team have
expressed their views.
Regional Disclosures (outside India)
This report is not directed or intended for distribution to or use by any person or entity resident in a state, country or any jurisdiction, where such distribution, publication, availability or use would be contrary to law, regulation or which would subject
MOSL & its group companies to registration or licensing requirements within such jurisdictions.
For Hong Kong:
This report is distributed in Hong Kong by Motilal Oswal capital Markets (Hong Kong) Private Limited, a licensed corporation (CE AYY-301) licensed and regulated by the Hong Kong Securities and Futures Commission (SFC) pursuant to the Securities
and Futures Ordinance (Chapter 571 of the Laws of Hong Kong) “SFO”. As per SEBI (Research Analyst Regulations) 2014 Motilal Oswal Securities (SEBI Reg No. INH000000412) has an agreement with Motilal Oswal capital Markets (Hong Kong)
Private Limited for distribution of research report in Hong Kong. This report is intended for distribution only to “Professional Investors” as defined in Part I of Schedule 1 to SFO. Any investment or investment activity to which this document relates is only
available to professional investor and will be engaged only with professional investors.” Nothing here is an offer or solicitation of these securities, products and services in any jurisdiction where their offer or sale is not qualified or exempt from
registration. The Indian Analyst(s) who compile this report is/are not located in Hong Kong & are not conducting Research Analysis in Hong Kong.
For U.S.
Motilal Oswal Securities Limited (MOSL) is not a registered broker - dealer under the U.S. Securities Exchange Act of 1934, as amended (the"1934 act") and under applicable state laws in the United States. In addition MOSL is not a registered
investment adviser under the U.S. Investment Advisers Act of 1940, as amended (the "Advisers Act" and together with the 1934 Act, the "Acts), and under applicable state laws in the United States. Accordingly, in the absence of specific exemption
under the Acts, any brokerage and investment services provided by MOSL, including the products and services described herein are not available to or intended for U.S. persons. This report is intended for distribution only to "Major Institutional
Investors" as defined by Rule 15a-6(b)(4) of the Exchange Act and interpretations thereof by SEC (henceforth referred to as "major institutional investors"). This document must not be acted on or relied on by persons who are not major institutional
investors. Any investment or investment activity to which this document relates is only available to major institutional investors and will be engaged in only with major institutional investors. In reliance on the exemption from registration provided by Rule
15a-6 of the U.S. Securities Exchange Act of 1934, as amended (the "Exchange Act") and interpretations thereof by the U.S. Securities and Exchange Commission ("SEC") in order to conduct business with Institutional Investors based in the U.S.,
MOSL has entered into a chaperoning agreement with a U.S. registered broker-dealer, Motilal Oswal Securities International Private Limited. ("MOSIPL"). Any business interaction pursuant to this report will have to be executed within the provisions of
this chaperoning agreement.
The Research Analysts contributing to the report may not be registered /qualified as research analyst with FINRA. Such research analyst may not be associated persons of the U.S. registered broker-dealer, MOSIPL, and therefore, may not be subject
to NASD rule 2711 and NYSE Rule 472 restrictions on communication with a subject company, public appearances and trading securities held by a research analyst account.
For Singapore
Motilal Oswal Capital Markets Singapore Pte Limited is acting as an exempt financial advisor under section 23(1)(f) of the Financial Advisers Act(FAA) read with regulation 17(1)(d) of the Financial Advisors Regulations and is a subsidiary of Motilal
Oswal Securities Limited in India. This research is distributed in Singapore by Motilal Oswal Capital Markets Singapore Pte Limited and it is only directed in Singapore to accredited investors, as defined in the Financial Advisers Regulations and the
Securities and Futures Act (Chapter 289), as amended from time to time. In respect of any matter arising from or in connection with the research you could contact the following representatives of Motilal Oswal Capital Markets Singapore Pte Limited:
Disclaimer:
The report and information contained herein is strictly confidential and meant solely for the selected recipient and may not be altered in any way, transmitted to, copied or distributed, in part or in whole, to any other person or to the media or reproduced
in any form, without prior written consent. This report and information herein is solely for informational purpose and may not be used or considered as an offer document or solicitation of offer to buy or sell or subscribe for securities or other financial
instruments. Nothing in this report constitutes investment, legal, accounting and tax advice or a representation that any investment or strategy is suitable or appropriate to your specific circumstances. The securities discussed and opinions expressed in
this report may not be suitable for all investors, who must make their own investment decisions, based on their own investment objectives, financial positions and needs of specific recipient. This may not be taken in substitution for the exercise of
independent judgment by any recipient. Each recipient of this document should make such investigations as it deems necessary to arrive at an independent evaluation of an investment in the securities of companies referred to in this document
(including the merits and risks involved), and should consult its own advisors to determine the merits and risks of such an investment. The investment discussed or views expressed may not be suitable for all investors. Certain transactions -including
those involving futures, options, another derivative products as well as non-investment grade securities - involve substantial risk and are not suitable for all investors. No representation or warranty, express or implied, is made as to the accuracy,
completeness or fairness of the information and opinions contained in this document. The Disclosures of Interest Statement incorporated in this document is provided solely to enhance the transparency and should not be treated as endorsement of the
views expressed in the report. This information is subject to change without any prior notice. The Company reserves the right to make modifications and alternations to this statement as may be required from time to time without any prior approval.
MOSL, its associates, their directors and the employees may from time to time, effect or have effected an own account transaction in, or deal as principal or agent in or for the securities mentioned in this document. They may perform or seek to perform
investment banking or other services for, or solicit investment banking or other business from, any company referred to in this report. Each of these entities functions as a separate, distinct and independent of each other. The recipient should take this
into account before interpreting the document. This report has been prepared on the basis of information that is already available in publicly accessible media or developed through analysis of MOSL. The views expressed are those of the analyst, and
the Company may or may not subscribe to all the views expressed therein. This document is being supplied to you solely for your information and may not be reproduced, redistributed or passed on, directly or indirectly, to any other person or
published, copied, in whole or in part, for any purpose. This report is not directed or intended for distribution to, or use by, any person or entity who is a citizen or resident of or located in any locality, state, country or other jurisdiction, where such
distribution, publication, availability or use would be contrary to law, regulation or which would subject MOSL to any registration or licensing requirement within such jurisdiction. The securities described herein may or may not be eligible for sale in all
jurisdictions or to certain category of investors. Persons in whose possession this document may come are required to inform themselves of and to observe such restriction. Neither the Firm, not its directors, employees, agents or representatives shall
be liable for any damages whether direct or indirect, incidental, special or consequential including lost revenue or lost profits that may arise from or in connection with the use of the information.
The person accessing this information specifically agrees
to exempt MOSL or any of its affiliates or employees from, any and all responsibility/liability arising from such misuse and agrees not to hold MOSL or any of its affiliates or employees responsible for any such misuse and further agrees to hold MOSL
or any of its affiliates or employees free and harmless from all losses, costs, damages, expenses that may be suffered by the person accessing this information due to any errors and delays.
Registered Office Address: Motilal Oswal Tower, Rahimtullah Sayani Road, Opposite Parel ST Depot, Prabhadevi, Mumbai-400025; Tel No.: 022-3980 4263; www.motilaloswal.com. Correspondence Address: Palm Spring Centre, 2nd Floor, Palm
Court Complex, New Link Road, Malad (West), Mumbai- 400 064. Tel No: 022 3080 1000. Compliance Officer: Neeraj Agarwal, Email Id:
na@motilaloswal.com,
Contact No.:022-30801085.
Registration details of group entities.: MOSL: SEBI Registration: INZ000158836 (BSE/NSE/MSE); CDSL: IN-DP-16-2015; NSDL: IN-DP-NSDL-152-2000; Research Analyst: INH000000412. AMFI: ARN 17397. Investment Adviser: INA000007100.
Motilal Oswal Asset Management Company Ltd. (MOAMC): PMS (Registration No.: INP000000670) offers PMS and Mutual Funds products. Motilal Oswal Wealth Management Ltd. (MOWML): PMS (Registration No.: INP000004409) offers wealth
management solutions. *Motilal Oswal Securities Ltd. is a distributor of Mutual Funds, PMS, Fixed Deposit, Bond, NCDs, Insurance and IPO products. * Motilal Oswal Commodities Broker Pvt. Ltd. offers Commodities Products. * Motilal Oswal Real
Estate Investment Advisors II Pvt. Ltd. offers Real Estate products. * Motilal Oswal Private Equity Investment Advisors Pvt. Ltd. offers Private Equity products
23 February 2018
8