13 March 2018
Market snapshot
Equities - India
Close
Chg .%
Sensex
33,918
1.8
Nifty-50
10,421
1.9
Nifty-M 100
18,961
1.0
Equities-Global
Close
Chg .%
S&P 500
2,783
-0.1
Nasdaq
7,588
0.4
FTSE 100
7,215
-0.1
DAX
12,418
0.6
Hang Seng
12,697
2.1
Nikkei 225
21,824
1.7
Commodities
Close
Chg .%
Brent (US$/Bbl)
65
-0.8
Gold ($/OZ)
1,317
-0.2
Cu (US$/MT)
6,876
-0.9
Almn (US$/MT)
2,069
-1.5
Currency
Close
Chg .%
USD/INR
65.0
-0.2
USD/EUR
1.2
0.1
USD/JPY
106.6
-0.2
YIELD (%)
Close
1MChg
10 Yrs G-Sec
7.6
-0.04
10 Yrs AAA Corp
8.3
-0.04
Flows (USD b)
12-Mar
MTD
FIIs
0.1
0.4
DIIs
-0.1
-0.1
Volumes (INRb)
12-Mar
MTD*
Cash
312
324
F&O
5,507
8,704
Note: YTD is calendar year, *Avg
YTD.%
-0.4
-1.0
-10.3
YTD.%
4.1
9.9
-6.2
-3.9
8.4
-4.1
YTD.%
-3.1
1.5
-4.6
-8.3
YTD.%
1.9
2.8
-5.4
YTDchg
0.3
0.4
YTD
0.4
2.8
YTD*
393
7,944
Today’s top research idea
Future Consumer (Initiating Coverage) - Company of the “Future”
Future Consumer (FCL) is the best play on the huge window of opportunity for
brands using modern retail methods of distribution.
Improving mix and operating leverage through rapid sales growth are expected
to drive significant margin expansion over the next five years.
We initiate coverage on FCL with a Buy rating. The company is expected to be
PAT positive on consolidated level only in FY19 rendering near term P/E
valuations meaningless. We, thus, value FCL on EV/sales basis, assigning a
multiple of 2.2x (60% discount to EV/sales of coverage consumer universe). This
results in a target price of INR76, implying ~50% upside. As soon as FCL
demonstrates profitability at the net level, we will move our valuation on P/E
basis.
Research covered
Cos/Sector
Future Consumer
(Initiating Coverage)
Ecoscope
Metals Weekly
Key Highlights
Company of the “Future”; Long runway of growth justifies
expensive near-term valuations; Buy with TP of INR76, 50% Upside
Retail inflation eases to a four-month low in February 2018
Iron ore (china cfr) prices down 10% WoW; Base metals weak
Piping hot news
Tata Sons to sell TCS stake worth $1.25 billion to pay debt
Tata Sons Ltd, India’s biggest business group, plans to sell $1.25 billion of its
stake in Tata Consultancy Services (TCS), according to terms of the transaction.
Tata Sons will sell 28.27 million shares of Asia’s largest software developer, or
about 1.48% stake, according to the terms…
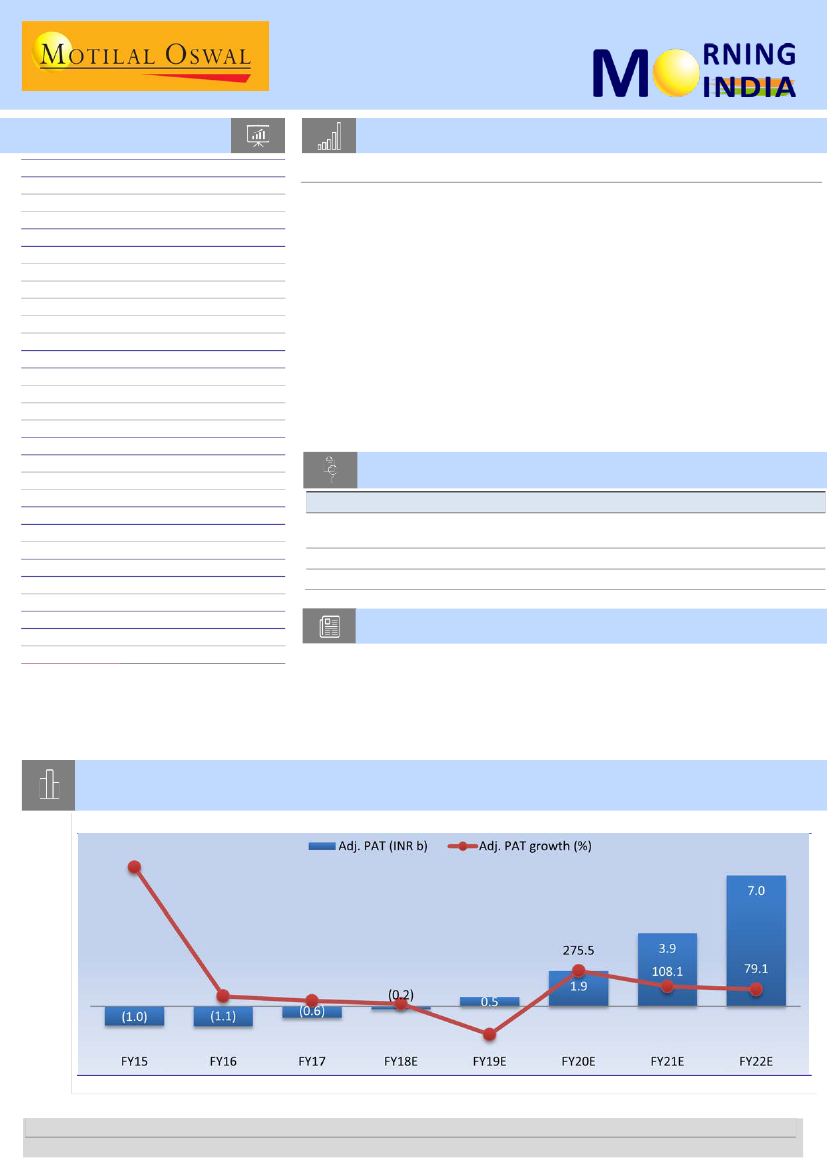
Chart of the Day: Future Consumer (Initiating Coverage) - Company of the “Future”; Long
runway of growth justifies expensive near-term valuations
Adj. PAT to turn positive by FY19 and touch INR7b by FY22
Source: Company, MOSL
Research Team (Gautam.Duggad@MotilalOswal.com)
Motilal Oswal research is available on www.motilaloswal.com/Institutional-Equities, Bloomberg, Thomson Reuters, Factset and S&P Capital.
Investors are advised to refer through important disclosures made at the last page of the Research Report.

In the news today
Kindly click on textbox for the detailed news link
1
India grounds all Airbus
A320Neos with faulty Pratt &
Whitney engines
Aviation regulator Directorate
General of Civil Aviation (DGCA)
on Monday grounded 11 Airbus
A320neo (new engine option)
aircraft powered by Pratt &
Whitney engines following
instances of glitches, the
government-agency said…
2
ITC Ltd, the maker of Aashirvaad atta, Sunfeast biscuits and BNatural
juices, plans to launch branded packaged rice this year, entering a segment
vacated by Hindustan Unilever Ltd two years ago. The Kolkata-based
company will sell both basmati and non-basmati rice and, in future,
introduce ready-to-make versions of rice-based dishes. “(Branded) rice will
be launched by end of this year,” S. Sivakumar, group head (agriculture
and information technology business), ITC, said in an interview.
ITC to enter branded rice segment by end this year: S. Sivakumar
3
ACC and Ambuja Cements to
enter into master supply
agreement
Having put their merger on hold,
ACC Ltd and Ambuja Cements—
the two Indian units of
LafargeHolcim—on Monday said
they plan to enter into a ‘master
supply agreement’ with each
other...
4
SEBI orders footwear maker
Bata to probe suspected
results leak
The Securities and Exchange Board
of India (SEBI) ordered Bata India
Ltd on Monday to carry out an
internal probe into the suspected
leak of unpublished financial data
and asked the footwear maker to
strengthen its handling of such
data…
5
Infosys to voluntarily delist
from Euronext’s Paris,
London bourses
Five years after it listed on NYSE
Euronext’s (NYX) London and
Paris markets, Infosys has
decided to voluntarily delist. In a
statement to the exchanges, the
country’s second largest
software exporter said: “Infosys
announces its intent to
voluntarily delist from Euronext
Paris and Euronext London
Exchanges.” The announcement
came after market hours. Infosys
shares closed at ₹1,185,
up by
almost 2 per cent when
compared to Friday’s close…
6
Retail inflation fell to a 4-month
low of 4.44% in February on
cheaper food articles and lower
cost for fuel. Retail inflation, based
on Consumer Price Index (CPI), was
at 5.07% in January. In February
2017, however, it was 3.65%. It
was 4.88% in November last year…
7
BoI recovers ₹7,000-crore
worth NPAs
Bank of India (BoI) has recovered
non performing assets (NPA)
worth ₹7,000 crore which the
institution had lent against
standby letter of credit,
according to a top official. The
bank was following certain
procedures and would recover
another ₹2,000 crore mostly by
March end, N. Damodharan,
executive director, BoI, told the
media on Monday…
Retail inflation at 4-month low
of 4.44% on cheaper food, fuel
13 March 2018
2

Future Consumer
BSE Sensex
33,918
S&P CNX
10,421
Initiating Coverage | Sector: Consumer
CMP: INR51
TP: INR76 (+50%)
Buy
Company of the “Future”
Long runway of growth justifies expensive near-term valuations
Stock Info
Bloomberg
Equity Shares (m)
52-Week Range (INR)
1, 6, 12 Rel. Per (%)
M.Cap. (INR b)
M.Cap. (USD b)
12M Avg Val (INR M)
Free float (%)
FCON IN
1,834.7
79/27
-21/-29/52
92.7
1.4
389.0
56.9
Financial Snapshot (INR b)
2018E 2019E 2020E
Y/E Mar
29.7
42.6
59.9
Sales
0.6
1.4
3.1
EBITDA
-0.2
0.5
1.9
NP
-0.1
0.3
1.1
EPS (Rs)
Loss
LP 276.5
EPS Growth (%)
6.0
6.3
7.4
BV/Share (Rs)
Loss 167.7
44.5
P/E (x)
8.4
8.0
6.8
P/BV (x)
157.2
64.1
29.0
EV/EBITDA (x)
3.0
2.1
1.5
EV/Sales (x)
-1.8
4.9
16.6
RoE (%)
3.3
7.3
13.9
RoCE (%)
Shareholding pattern %
Dec-17 Sep-17
Promoter
43.1
48.8
DII
1.1
1.0
FII
20.5
19.0
Others
35.3
31.3
Future Consumer (FCL) is an integrated consumer company having a portfolio of
brands in categories such as staples, fruits & vegetables, processed foods, home
care and personal care. It has a distribution network largely dependent on
organized retailers and an overall footprint of ~80,000 stores.
We believe that FCL is the best play on the huge window of opportunity
(presented by a combination of macro factors and company-led initiatives) for
brands using modern retail methods of distribution.
In addition, FCL appears best placed among Future Group companies from a
revenue, profit and RoCE perspective, given the group’s focus on retail
expansion to drive growth in its burgeoning brands portfolio.
Improving mix and operating leverage are expected to drive significant margin
expansion over the next five years.
We initiate coverage on FCL with a Buy rating. As the company is likely to be
profitable at the consolidated net level only in FY19, we believe near-term P/E
multiples are always likely to appear extremely expensive on a one-year forward
basis. We, thus, value FCL on EV/sales basis, assigning a multiple of 2.2x (60%
discount to EV/sales of coverage consumer universe). This results in a target
price of INR76, implying ~50% upside. As soon as FCL demonstrates profitability
at the net level, we will move our valuation on P/E basis.
We believe FCL offers a rapidly compounding and potentially high RoCE play on
the massive growth opportunity in the Indian FMCG sector and particularly for
brands focused on modern retail segment. Our detailed analysis (see page 21) on
potential investment returns from a three-year perspective suggests a healthy
three-year CAGR return of 24%.
Dec-16
43.4
0.9
19.6
36.1
Humungous growth opportunity in branded FMCG
We see huge opportunity in the Indian branded FMCG space. From USD65b in
2015, the category is expected to grow in size to reach USD220-240b by 2025,
implying 13-14% CAGR, according to a joint study by BCG and CII. With the
category itself likely to grow by ~3.5x over this 10-year period, we expect
significant pockets of higher and even spectacular growth among its
constituents.
Company of the “Future”
Future Consumer
Seismic shift toward modern trade – an added advantage
Modern trade, which constitutes ~12% of FMCG sector sales in India, has been
witnessing tremendous growth over the past year, led by a multitude of factors
like customer convenience, a wider variety of products on offer, rapidly evolving
business models, and an increasing trend toward cashless transactions. Reforms
like demonetization and Goods & Services Tax (GST), too, have also taken away
the edge that wholesale-led general trade had earlier, due to the need to
adhere to stricter compliance norms. We believe all this augurs well for
businesses operating under the modern retail and modern wholesale (cash and
carry businesses) models.
Vishal.Punmiya@MotilalOswal.com
+
91 22 3980 4261
13 March 2018
3

A promising play with better eventual RoCE prospects
FCL – a separately listed brands business of the Future Group – is a promising play
on (a) rapidly expanding store footprint of the Future Group (the largest pan-India
retailer in India), which has set a target at the end of FY17 to open 10,000 EasyDay
stores by 2022 (611 stores as on 31
st
December 2017) and 350 Big Bazaar stores
over the next 3-5 years (257 stores as on 31
st
December 2017) and (b) increasing
proportion of FCL’s brands in Future Retail stores to ~60% from ~20% now.
Moreover, we believe that the group’s focus on retail expansion is part of its
strategy to boost sales of its growing brands portfolio. Importantly, placing the
interests of FCL at par with Future Retail will not only enable quick ramp-up of group
revenues, but also ensure higher profitability and RoCEs, aiding cash flows.
Brands business already growing at a rapid pace
Around 95% of FCL’s sales are derived from the brands portfolio. Over the past three
years (FY14-17), while the overall FMCG sector has seen muted CAGR of 5%, FCL has
reported sales CAGR of 37%. Notably, sales growth has been even higher at 39% YoY
in YTDFY18. While it can be argued that base was low a few years ago, we note that
FCL’s absolute sales of INR21b (~USD327m) in FY17 were in line with mid-tier FMCG
companies. In our view, sales could increase further to ~INR29.5b (USD458m) in
FY18, higher than mid-size FMCG companies like Emami (our estimate: INR25.7b or
USD396m). The expected outperformance, going forward, will be driven by its
burgeoning brands portfolio, increasing scale of key brands, massive captive growth
opportunity within the existing store network in terms of salience, and the rapidly
expanding store network. Brands like
Golden Harvest, Nilgiris, Fresh & Pure, Tasty
Treat
and
Clean Mate
are already fairly large, and others like
Karmiq, Sangi’s Kitchen
and
Desi Atta Company
are growing at a rapid pace.
Improving mix and higher scale to drive profitability and return ratios
Branded staples and fruits & vegetables – which form the bulk of its overall portfolio
and are relatively low-margin categories – should see healthy growth, but overall
margin expansion will be driven by the high-margin processed food and HPC
products. We expect overall sales CAGR of 39% over FY18-22, particularly led by 60%
CAGR in the high-margin categories. In the traditional FMCG channels, distribution
costs account for ~20% of sales and advertising costs too contribute around 10-15%.
However, as a proportion of sales, these costs are much lower for brands of FCL (as
it has a largely captive customer base within Future Retail stores). This lowers the
impact of higher net working capital for FCL (likely to be positive 35 days even after
an improvement by FY22; in comparison it is negative or in low-single-digit for most
FMCG peers). This apart, superior operating cash flows emanating from rapid
growth and mix improvements will help repay debt (net debt of INR3.76b with a net
debt-equity ratio of 0.4x as on FY17) and drive huge improvement in RoCE for FCL.
13 March 2018
4

Valuation and view
Favorable macro factors and initiatives by the company and the parent Future
Group make FCL a highly attractive investment candidate. Opportunities are
immense, and FCL is at the forefront to maintain or even accelerate its already
impressive growth rate. Sales – which are already higher than those of mid-tier
FMCG companies – should continue growing at a rapid pace for the years to come,
driven by the tremendous opportunity for brands using modern retail methods of
distribution.
We believe that FCL’s value – with its strong revenue, earnings and RoCE prospects –
is becoming far more attractive at the group level. Sales growth has been rapid (37%
CAGR over FY14-17), and in fact, on an uptrend, despite continual high base, while
the EBITDA margin has improved from -10.4% in FY14 to enter the positive territory
in FY17; it is improving on a sequential basis in YTDFY18 as well. By FY19, we expect
FCL to turn profitable at the net consolidated level. We forecast sales of INR82b in
FY21 and INR111b in FY22, still far lower than the company’s ‘Vision 2021’ target of
INR200b. This poses an upside risk to our forecast.
We expect the momentum in revenue growth to continue, at least over the coming
few years, because of the tremendous growth opportunity. We forecast revenue
CAGR of 41.5% over FY17-20 and 39% over FY17-FY22. As the company is likely to be
profitable at the consolidated net level only in FY19, we believe near-term P/E
multiples are always likely to appear extremely expensive on a one-year forward
basis. We, thus, value the company on an EV/sales basis, assigning a multiple of 2.2x
(60% discount to EV/sales of our coverage consumer universe). This results in a
target price of INR76, implying ~50% upside from current levels. We, thus, initiate
coverage on FCL with a Buy rating. As soon as the company demonstrates
profitability at the net level, we will move our valuation on P/E basis.
Businesses like these with humungous growth opportunity at the EPS level over the
longer term have to be seen from a three-year investment perspective, in our view.
Assuming 23x FY22E EPS on a P/E basis (which we believe is fair for a business with
far higher revenue and earnings growth potential compared to peers) and RoCEs of
~32% by FY22, we get a target price of INR97, implying a share price CAGR of ~24%.
13 March 2018
5

E
CO
S
COPE
Retail inflation eases to a four-month low in February 2018
Favourable base continues to aid growth in IIP in January
12 March 2018
The Economy Observer
CPI inflation fell to a four-month low of 4.4% in February 2018 from 5.1% in the previous month. The number exceeded
our and consensus estimate of +4.7%.
Inflation in vegetables dropped sharply to 17% YoY in February, contributing as much as 50bp to the MoM decline in the
headline number. While food inflation fell sharply to 3.2%, core CPI eased slightly to 4.9%.
IIP surged by 7.5% in January 2018, higher than our/consensus expectation of +5%/6.4%, as output of consumer goods
and capital goods rose sharply aided by a favourable base.
Lower-than-expected inflation over the past few months makes us believe that inflation may not exceed 6% in June
2018, but come closer to ~5.8%. Thereafter, a high base is likely to pull down inflation to ~4% in 2HFY19. We expect the
Reserve Bank of India (RBI) to look through such statistical effects and maintain status quo through 2018.
I. Retail inflation eases in February 2018
CPI inflation eases to 4.4% in February…:
CPI-based retail inflation eased to a
four-month low of 4.4% YoY in February 2018 from 5.1% in January 2018
(Exhibit 1).
The number was better than our and consensus estimate of 4.7%.
Inflation rose continuously from a record low of 1.5% in June 2017 to a 17-
month high of 5.2% in December 2017, before easing in January/February 2018.
…on account of a drop in vegetable inflation:
The decline in headline inflation
was largely on account of a sharp drop in vegetables inflation (weight in CPI:
6.04%), which fell to 17.6% YoY in February 2018 from 27% in the preceding
month. This alone contributed as much as 52bp to the MoM fall in the headline
number
(Exhibit 2).
Inflation in cereals, oils & fats, fruits, sugar & confectionary,
milk, eggs and meat & fish also eased slightly in February. As a result, food
inflation fell to a four-month low of 3.2% from 4.7% in January 2018.
Core inflation eases marginally…:
Core
inflation (all items excluding ‘food &
beverages’ and ‘fuel & light’) eased slightly to 4.9% in February 2018 from 5% in
the preceding month (Exhibit
3).
Core-core inflation (excluding petrol/diesel
from core inflation) also inched down to 5.2% from a 23-month high of 5.3% in
January. Inflation in the fuel & light group also edged lower, touching 6.8% in
February 2018 from 7.7% in the previous month.
…while inflation in ‘core services’ picks up:
Further refinement of CPI items
shows that inflation in ‘core services’ rose to a 10-month high of 4% in February
2018 from 3.8% in the preceding month
(Exhibit 4),
but was much lower than
FY17/FY18 average of 4.7%/5.5%. Inflation in housing remained elevated at
8.3%, while that in goods eased sharply to 3.9% in February 2018 from 4.8% in
the preceding month.
Lower-than-expected inflation over the past few months makes us believe
that, although inflation is set to rise over the next four months, it may not
exceed 6% in June 2018, but come closer to ~5.8%. Thereafter, a high base
should pull down CPI inflation closer to ~4% in 2HFY19. We believe that the
RBI is likely to look through such statistical effects and maintain status quo in
2018.
13 March 2018
6

Metals Weekly
Iron ore (china cfr) prices down 10% WoW; Base metals weak
12 March 2018
Update
Indian steel: Long product (TMT Mumbai) prices were down ~2% WoW. Sponge iron prices were unchanged,
while domestic scrap prices were down ~3% WoW. Pellet prices were down ~2% WoW. Domestic iron ore
prices were unchanged, but the defaulting Odisha miners have been allowed to resume production, which can
exert pressure on prices. Domestic HRC prices were unchanged, and so were import and export offers.
Raw materials: Iron ore prices (China cfr) were down ~10% WoW owing to weakness in Chinese steel prices.
Thermal coal prices were unchanged. Coking coal prices were down ~4% WoW. China’s pellet import prices
were down ~1% WoW.
Europe: HRC prices were unchanged. CIS HRC export prices were up ~2% WoW. Rotterdam scrap prices were
up ~1% WoW.
China: Chinese local rebar prices were down ~3% WoW, while HRC prices declined ~2% WoW. Export rebar
prices were down ~2% WoW, while HRC prices were marginally lower.
Base metals: Aluminum (cash LME) was down ~3% WoW. Alumina was up ~5% WoW. Copper (cash LME) was
down ~1% WoW. Zinc was down ~5% WoW, while lead declined ~4% WoW. Brent crude prices were up ~2%
WoW.
13 March 2018
7

In conversation
1. HDFC STANDARD LIFE : Expect industry to grow at 15-17% for
next 4-5 years; Amitabh Chaudhry, MD & CEO
Growth for the last 4 years for life insurance sector has been strong.
Have seen growth of over 25 percent for last 2 years.
Mutual funds reacting to changes in budget, bringing ULIPs into focus.
Gross domestic product (GDP) growth, financial savings etc. are spurring growth
in life insurance sector.
Expect industry to grow at 15-17 percent for next 4-5 years.
Expect bancassurance to continue to do well.
2. SPICEJET : Signed biggest deal with Safran group worth USD
12.5 billion; Ajay Singh, CMD
Deal with Safran group is for engines to power 155 Boeing 737 Max-planes.
Safrna deal will help in optimizing cost for company.
Have signed a deal for 150 narrow-body aircrafts. Deliveries will be starting this
year.
Indo-French companies have signed contracts worth USD 13 billion.
Deal between Safran and company alone is worth USD 12.5 billion.
3. UCO BANK : Have exposure of Rs 2000cr which comes under
RBI’S new directive; Ravi Krishan Takkar, MD & CEO
As per the new guidelines of Reserve Bank of India’s circular dated February
12th, have to take call on all accounts beginning with exposure of about Rs
2,000 crore from the banking system.
Have exposure of around Rs 2,000 crore of such accounts which would be
coming under this purview.
Regarding fraudulent element in NPAs over Rs 50 crore, process has started. As
bankers have taken a call, have to see the accounts where bank is the lead
bankers or sole bankers.
In accounts where bank is the sole bank or the lead bank, have started already
giving mandate to various audit firm.
4. ANDHRA BANK : ED files charge sheet against former director;
AK Rath, Executive Director
The person against whom ED has moved is a nominee director.
Have exposure in Sterling Biotech, Sterling Port and also Sterling Global. So total
exposure in the company is close to Rs 900 crore.
Exposure to Sterling companies is already classified as non-performing assets
(NPAs).
Forensic audits of many companies are underway and these audits normally
takes 10 days to complete.
13 March 2018
8

From the think tank
1. India must lead the transition to green energy
India has always been torn between an urge to sit at the high table of global
negotiations and being seen by the rest of the world as a deal breaker on issues
such as global trade and climate change.
The International Solar Alliance (ISA), which began its meeting in New Delhi on
Sunday, is thus a breakthrough in our global positioning. Prime Minister Narendra
Modi has been a driving force ever since he first announced the idea at the India-
Africa Summit in New Delhi in October 2015 and followed this up with more
concrete moves during the United Nations climate change talks in Paris in
November 2015, with France being an important partner at a time when the US
decided to renege on its climate change mitigation commitments. India has
suddenly became a catalyst in the global attempts at capping climate change. This
is important in a geopolitical sense when China is clearly expanding its global
footprint.
2. New Delhi is walking into the china trap
Just when we thought India was getting its China policy on track, we have
returned to the good old days of doing business with China. Discouraging
government officials from attending a public event, “Thank You India”, being
organized in New Delhi by Tibetans on 1 April 2018, foreign secretary Vijay
Gokhale reportedly wrote to the cabinet secretary that “the proposed period
will be a very sensitive time in the context of India’s relations with China.
Participation by senior leaders or government functionaries, either from the
Central government or state governments, is not desirable, and should be
discouraged.” In the Maldives, New Delhi decided that asserting its interests
would be tantamount to provoking the Chinese, so we have taken a step back,
letting China roll all over us. And a think tank in Delhi has been asked to
postpone an annual conference just because its deliberations may annoy the
Chinese. China’s response too has been predictable. Its foreign minister, Wang
Yi, has resorted to the usual clichés by suggesting that “the Chinese dragon and
the Indian elephant must not fight each other but dance with each other. If
China and India are united, one plus one will not equal two but 11.
3. Take a private road out of banking morass
India’s unreformed banking system needs a massive privatization drive. The sooner
this dawns on authorities, the better for taxpayers, investors and borrowers.
Exhibit A is an index of share prices of state-run banks. It took one $2 billion fraud
at government-owned Punjab National Bank (PNB) to snuff out all the excitement
over a $32 billion recapitalization of these moth-eaten institutions. Now the recap
plan has gone back to the drawing board, according to BloombergQuint. How
much more must taxpayers chip in to make the bailout great again? Take a look at
the index of state-run banks, but this time focus on individual lenders’ price-to-
book ratios. With two out of three banks trading at less than half book value,
nobody will them give capital to grow—not when investors have already suffered
losses on the $4 billion or so in fresh equity they did provide over the past year.
13 March 2018
9

4. A wider debt market will grow credit funds
Fixed income markets in India have evolved steadily over the past decade. At end
of 2017, income funds (including semi-, mid- and long-duration) comprised 82% of
the assets under management (AUM) of open-ended AUM of debt mutual funds
(excluding liquid funds), while credit or accrual funds comprised 18%. Share of
credit funds in this pie was in mid-single digits 5 years ago. While the overall AUM
under fixed-income products of mutual funds may still appear small in comparison
to bank deposits (which are five times larger), it has grown at a CAGR of nearly 21%
in the last 5 years, according to Association of Mutual Funds of India. Historically,
the Indian bond market has been concentrated in the high-grade segment
comprising AAA corporates and a few high-quality AA+ issuers. Even as deepening
in the bond markets has been gradual, market breadth has been steadily widening
in recent years. This has been reflected in the growing issuance volumes in mid- to
lower-end rating categories, that is, AA and AA– to A–. Their growing acceptability
is triggering higher issuance volumes in these categories.
International
5. The 21st century cold war is heating up
The Cold War of the 21st century, delayed by the brief bonhomie that
accompanied the demise of the previous version, and distracted by the “uni-
polar moment” and the so-called “global war on terror”, is now well upon us.
Several recent pronouncements, including the releases by the Donald Trump
administration of its National Defence Strategy, the Nuclear Posture Review
(NPR), and the Worldwide Threat Assessment (WTA) report, coupled with the
State of the Union address by Vladimir Putin and China’s reaction to the US
documents, are evidence that the new Cold War is heating up. This despite the
tantalizing mirage of rapprochement on the Korean peninsula, where the
sincerity of Seoul’s overtures is mismatched by the insincerity of Pyongyang’s
intent and Trump’s showmanship.
13 March 2018
10

Click excel icon
for detailed
valuation guide
CMP
Company
Automobiles
Amara Raja
Ashok Ley.
Bajaj Auto
Bharat Forge
Bosch
CEAT
Eicher Mot.
Endurance Tech.
Escorts
Exide Ind
Hero Moto
M&M
Mahindra CIE
Maruti Suzuki
Motherson Sumi
Tata Motors
TVS Motor
Aggregate
Banks - Private
AU Small Finance
Axis Bank
DCB Bank
Equitas Hold.
Federal Bank
HDFC Bank
ICICI Bank
IDFC Bank
IndusInd
J&K Bank
Kotak Mah. Bk
RBL Bank
South Indian
Yes Bank
Aggregate
Banks - PSU
BOB
BOI
Canara
Indian Bk
PNB
SBI
Union Bk
Aggregate
NBFCs
Aditya Birla Cap
Bajaj Fin.
Capital First
Cholaman.Inv.&Fn
Dewan Hsg.
GRUH Fin.
HDFC
HDFC Stand. Life
Indiabulls Hsg
Reco
Buy
Buy
Buy
Buy
Neutral
Buy
Buy
Buy
Sell
Buy
Neutral
Buy
Buy
Buy
Buy
Buy
Neutral
(INR)
TP
Valuation snapshot
% Upside
EPS (INR)
EPS Gr. YoY (%)
P/E (x)
P/B (x)
ROE (%)
Down-
(INR)
FY18E FY19E FY20E FY18E FY19E FY20E FY18E FY19E FY18E FY19E FY18E FY19E
side
27
9
36
20
20
23
23
22
-17
26
8
20
34
25
37
46
14
28.3
4.9
150.3
20.2
459.1
63.1
829.4
28.2
36.6
8.0
185.0
37.7
9.6
275.6
8.1
28.0
13.9
34.7 41.4
6.2
7.7
174.1 201.6
26.8 35.2
595.2 731.7
84.7 111.7
1,053.0 1,335.0
38.5 51.3
45.6 54.9
10.2 11.6
200.1 212.6
43.9 48.4
12.2 15.1
369.9 471.3
12.5 17.5
57.9 58.5
25.1 33.9
0.9
7.8
6.5
54.2
-3.0
-32.3
34.5
20.1
90.4
-1.3
9.4
37.8
107.8
10.8
5.0
41.1
18.5
19.9
-42.8
-4.4
5.3
-81.6
13.3
18.0
-18.3
0.4
27.0
LP
22.0
33.0
-22.6
24.8
15.6
22.7
26.7
15.8
32.7
29.6
34.1
27.0
36.7
24.3
27.5
8.2
16.4
27.2
34.2
54.7
107.1
80.5
45.2
43.9
111.4
22.2
616.0
19.1
20.3
32.0
7.0
29.2
41.6
26.9
43.7
97.1
31.2
35.1
19.4
24.0
15.8
31.5
22.9
31.9
26.8
33.2
20.6
13.6
6.2
10.1
23.9
27.4
39.6
1.1
34.9
15.1
41.1
43.7
21.4
53.4
26.1
25.2
27.6
21.9
28.5
37.7
30.5
33.2
30.4
28.8
29.8
28.8
29.6
19.7
36.5
39.7
24.5
34.1
44.9
23.4
26.6
19.9
19.5
23.5
32.0
39.5
12.6
46.7
24.4
54.7
35.4
21.9
153.0
17.3
27.9
24.1
16.5
28.4
7.0
33.6
29.5
12.8
17.1
26.6
23.4
23.4
17.0
27.5
30.6
18.3
26.9
32.9
18.8
20.8
18.4
16.8
18.5
23.8
25.5
6.1
25.9
16.8
38.0
16.7
17.9
21.4
14.5
23.2
18.2
15.4
22.0
5.0
26.5
20.5
6.5
13.0
19.7
7.9
83.5
6.4
7.0
11.1
14.1
15.4
12.7
28.6
27.0
14.4
19.7
10.8
46.7
37.8
80.2
11.5
4.6
6.2
4.5
7.1
5.8
2.4
10.8
8.7
3.5
3.4
6.3
3.1
2.3
6.5
7.1
1.7
10.7
4.3
7.2
2.0
2.0
2.1
1.5
3.9
2.3
1.1
4.5
0.6
4.4
3.0
0.9
2.8
2.9
0.8
0.5
0.5
0.9
0.5
1.1
0.5
0.8
4.0
5.4
4.1
5.9
5.2
2.1
8.2
7.2
3.0
3.0
5.5
2.7
2.0
5.5
5.9
1.3
8.0
3.6
6.0
1.8
1.8
1.9
1.4
3.5
2.1
1.0
3.8
0.6
3.8
2.7
0.8
2.4
2.6
0.8
0.5
0.5
0.8
0.5
1.1
0.4
0.7
17.3
22.1
24.2
21.0
15.2
10.1
36.2
21.0
17.2
12.6
34.0
14.4
10.4
19.8
19.2
14.7
24.9
17.9
14.1
5.9
10.1
1.4
9.4
16.2
8.1
6.8
17.0
8.9
13.2
12.2
6.9
17.6
10.8
18.3
24.7
25.3
23.5
17.9
12.3
34.6
23.9
17.3
14.4
32.0
14.4
11.7
22.8
25.4
24.3
35.3
21.7
17.2
11.1
10.4
9.5
9.8
15.9
10.1
6.9
19.1
11.9
14.3
13.8
12.7
19.9
13.1
813
1035
145
158
2960 4031
735
880
18239 21951
1550 1899
28323 34764
1267 1540
856
714
213
268
3686 3986
737
884
226
303
8811 10972
319
437
352
515
650
741
Buy
Buy
Neutral
Buy
Buy
Buy
Buy
Neutral
Buy
Buy
Buy
Buy
Buy
Buy
581
519
161
142
94
1867
301
50
1734
60
1101
466
25
311
705
710
188
205
149
2400
405
65
2076
100
1220
680
38
410
21
37
17
45
58
29
35
31
20
65
11
46
54
32
10.6
14.7
7.4
0.9
5.5
67.0
12.5
3.0
61.1
8.6
32.7
15.8
1.9
18.2
15.3
31.0
9.0
6.6
6.5
80.6
16.5
3.2
78.9
12.2
41.5
22.7
3.8
23.9
21.6
44.6
10.9
10.2
8.2
100.9
21.0
3.9
101.4
16.8
54.2
30.3
4.9
30.8
Buy
Neutral
Neutral
Buy
Buy
Buy
Neutral
132
95
239
283
95
253
91
185
150
415
430
215
375
145
40
58
74
52
127
48
59
9.8
-15.6
12.6
34.1
5.7
3.2
-40.5
16.7
1.1
37.3
40.6
8.5
18.0
5.9
23.7 182.1 70.7 42.0 13.5
3.7 Loss LP 222.3 NM
70.6 -33.0 196.8 89.1 19.0
46.5 16.4 19.3 14.5 8.3
15.7 -8.8 49.5 84.7 16.7
29.7 978.7 459.4 65.3 78.8
15.3
PL
LP 158.0 NM
-72.8 2,102 71.3 280.3
NA
42.3
38.9
34.5
26.5
22.1
8.0
5.4
32.8
45.2
35.4
30.2
18.7
26.8
18.8
14.0
13.9
15.4
42.4
34.2
27.5
21.5
26.1
23.4
16.3
25.2
22.1
41.5
36.6
18.8
23.4
13.7
55.5
43.1
91.4
13.3
2.0 5.5
-6.5 0.6
2.3 6.8
10.8 11.9
2.9 4.3
1.6 8.4
-16.7 2.7
0.3 5.7
Buy
Buy
Buy
Buy
Buy
Neutral
Buy
Buy
Buy
153
1667
643
1445
513
552
1855
431
1213
225
2330
960
1520
720
540
2260
485
1630
47
40
49
5
40
-2
22
13
34
3.7
5.3
7.6
45.6 61.7 82.8
34.2 44.6 56.8
61.8 73.3 89.1
37.4 47.5 59.9
9.9 11.8 14.6
43.0 49.0 57.0
4.7
5.4
6.7
91.1 105.1 128.3
4.0 3.1 12.6 12.4
5.9 4.9 20.1 19.8
2.4 2.1 13.7 15.6
4.4 3.7 20.4 20.2
1.8 1.6 14.0 15.8
16.6 13.7 32.9 32.2
5.1 4.4 17.6 16.5
2.9 2.4 21.7 21.1
3.7 3.3 29.9 30.4
13 March 2018
11

Click excel icon
for detailed
valuation guide
CMP
Company
L&T Fin Holdings
LIC Hsg Fin
MAS Financial
M&M Fin.
Muthoot Fin
PNB Housing
Repco Home
Shriram City Union
Shriram Trans.
Aggregate
Capital Goods
ABB
Bharat Elec.
BHEL
Blue Star
CG Cons. Elec.
CG Power & Indu.
Cummins
GE T&D
Havells
K E C Intl
L&T
Siemens
Solar Ind
Thermax
Va Tech Wab.
Voltas
Aggregate
Cement
Ambuja Cem.
ACC
Birla Corp.
Dalmia Bharat
Grasim Inds.
India Cem
J K Cements
JK Lakshmi Ce
Ramco Cem
Orient Cem
Prism Cem
Sagar Cements
Sanghi Inds.
Shree Cem
Ultratech
Aggregate
Consumer
Asian Paints
Britannia
Colgate
Dabur
Emami
Godrej Cons.
GSK Cons.
HUL
Reco
Buy
Neutral
Buy
Buy
Neutral
Buy
Buy
Buy
Buy
(INR)
162
493
580
415
377
1119
560
2016
1348
TP
(INR)
240
608
750
575
475
1750
740
2500
1750
% Upside
EPS (INR)
Down-
FY18E FY19E FY20E
side
48
7.4 11.0 13.5
23
38.5 44.3 52.6
29
18.6 24.2 30.0
39
13.9 19.2 23.0
26
43.8 44.8 49.3
56
51.4 69.0 92.3
32
33.4 39.0 46.0
24
114.2 140.0 166.8
30
78.7 104.8 125.9
EPS Gr. YoY (%)
Valuation snapshot
P/E (x)
P/B (x)
ROE (%)
FY18E FY19E FY20E FY18E FY19E FY18E FY19E FY18E FY19E
42.2
0.6
24.0
95.8
48.1
62.4
14.6
35.4
42.1
28.2
47.1
15.2
29.6
38.7
2.3
34.4
16.8
22.6
33.1
22.8
23.2
18.7
24.1
19.4
10.2
33.7
18.1
19.2
20.2
22.6
21.8
12.8
31.1
29.9
8.6
21.8
16.8
17.7
17.1
28.0
14.8
11.1
24.0
21.6
8.4
16.2
14.3
14.4
12.9
22.8
47.5
18.9
29.8
32.2
36.1
43.3
24.9
33.7
36.4
20.8
22.5
36.4
33.3
33.5
14.4
31.6
26.3
28.8
25.1
18.9
36.6
9.3
19.8
17.8
22.8
24.2
26.6
24.6
18.5
13.3
37.1
30.7
23.3
44.1
46.4
36.9
36.2
34.1
44.9
36.5
47.5
3.2
2.0
4.4
2.8
1.9
3.0
2.6
2.3
2.4
4.2
2.7
1.7
3.8
2.6
1.6
2.6
2.2
2.1
2.1
3.6
15.9
16.4
20.2
10.9
24.3
14.7
16.9
14.1
14.9
15.0
19.7
16.5
17.0
12.5
21.0
17.4
16.9
15.2
17.5
15.8
Sell
Buy
Sell
Neutral
Buy
Neutral
Buy
Neutral
Buy
Neutral
Buy
Neutral
Neutral
Neutral
Buy
Neutral
1431
150
87
791
234
81
777
389
505
389
1310
1105
988
1162
501
639
1240
210
80
780
305
90
1040
435
640
385
1650
1285
1100
1250
700
630
-13
40
-8
-1
30
12
34
12
27
-1
26
16
11
8
40
-1
19.8
7.1
3.0
16.6
5.1
1.1
23.2
10.6
11.4
16.1
49.0
19.8
24.4
28.6
33.2
18.0
30.1
7.9
2.9
24.6
6.5
1.9
31.3
11.6
13.9
18.7
58.1
30.4
29.6
34.7
34.8
20.2
35.0 12.1 52.0 16.2 72.2
8.4 12.6 12.0 6.3 21.2
4.0 123.6 -2.6 37.5 29.0
31.2 36.0 48.2 26.9 47.7
7.7
9.8 26.1 18.4 45.5
3.0 -72.2 63.3 58.8 70.7
37.1 -12.4 34.6 18.6 33.5
13.2 84.1 9.6 13.9 36.9
17.2 19.4 21.6 24.1 44.2
24.1 35.5 16.6 28.5 24.2
69.3 15.7 18.8 19.2 26.8
34.6 10.9 53.8 13.8 56.0
36.7 18.4 21.5 23.7 40.5
39.0 -7.4 21.4 12.5 40.7
38.4 76.0 4.9 10.3 15.1
23.0 16.4 12.4 13.8 35.5
17.2 19.9 18.8 31.6
10.9
76.9
50.6
107.6
145.0
10.4
76.9
25.0
38.8
10.3
6.3
70.6
12.0
724.2
178.4
29.5
31.3
-69.0
41.2
-47.5
-33.4
31.8
34.7
-10.8
LP
713.3
LP
102.0
10.0
-7.4
-7.7
38.4
31.1
378.7
41.5
235.5
101.9
27.3
97.2
25.3
66.8
113.1
101.0
53.5
3.0
53.0
74.3
30.4
23.6
19.5
39.0
21.4
37.7
36.0
35.2
27.2
88.7
33.4
39.7
34.6
66.2
31.1
31.2
39.9
33.0
90.7
51.8
31.1
39.9
22.6
45.0
30.4
44.3
52.4
37.1
20.4
38.3
46.9
40.6
8.4 7.3 11.6 15.4
3.8 3.4 17.9 18.0
1.0 1.0 3.4 3.3
9.5 8.8 20.4 28.3
20.0 16.4 50.6 49.8
1.2 1.2 1.7 2.7
5.4 5.0 16.7 20.8
8.2 7.1 24.1 22.7
8.6 7.5 19.4 20.8
5.2 4.3 21.6 21.0
3.3 3.0 13.0 14.1
5.1 4.7 9.1 12.9
7.5 6.4 20.0 20.6
4.7 4.3 12.1 13.4
2.4 2.1 17.1 15.8
5.6 5.0 16.9 16.8
3.5 3.2 11.0 12.2
2.4
3.3
1.9
4.6
1.6
0.9
3.4
3.4
4.1
2.9
5.6
2.4
2.1
6.3
4.4
3.2
13.9
17.9
21.1
10.2
12.1
10.9
8.3
43.5
2.2
3.1
1.8
4.1
1.4
0.9
2.9
2.9
3.6
2.6
4.7
2.1
1.8
5.4
3.9
2.9
12.3
15.4
19.8
9.2
10.6
9.5
7.5
43.3
6.1
10.1
2.1
9.4
5.2
2.2
16.4
7.7
14.4
6.6
11.2
6.5
10.8
17.6
9.7
8.0
26.9
33.9
49.9
25.4
29.0
23.6
20.7
76.5
8.0
12.6
9.6
12.0
15.7
4.4
17.8
13.8
15.9
10.3
20.9
12.0
14.6
15.7
13.5
12.5
29.6
35.8
55.5
26.7
33.2
22.6
21.6
91.4
Neutral
Neutral
Buy
Buy
Neutral
Neutral
Buy
Buy
Buy
Buy
Buy
Not Rated
Buy
Buy
Buy
241
290
1563 1781
803
1234
2837 3328
1106 1242
149
148
1004 1343
421
470
739
847
146
179
116
159
935
-
118
157
16188 22424
4177 5131
21
14
54
17
12
-1
34
12
15
23
37
33
39
23
6.0
47.4
8.9
54.7
35.6
3.7
44.4
9.4
24.3
3.3
2.2
25.2
5.8
423.0
89.0
8.3
62.2
42.4
77.4
119.4
7.6
56.5
18.5
30.5
5.5
4.7
50.6
8.9
435.8
136.2
Neutral
Buy
Buy
Buy
Buy
Neutral
Neutral
Buy
1131
4872
1043
327
1067
1079
6703
1325
1270
5995
1365
415
1505
1065
6350
1585
12
23
31
27
41
-1
-5
20
21.6
84.2
24.0
7.6
24.0
20.9
161.0
23.1
25.6 30.8 2.7 18.8 20.2 52.4
105.1 131.5 14.3 24.8 25.1 57.9
28.3 33.8 12.9 17.9 19.7 43.5
9.0
10.5 4.5 19.2 16.2 43.2
31.3 37.3 -9.6 30.5 19.1 44.5
24.1 27.5 10.6 15.1 14.2 51.6
183.8 215.7 3.1 14.1 17.4 41.6
27.9 32.9 17.6 20.7 18.1 57.3
13 March 2018
12

Click excel icon
for detailed
valuation guide
CMP
Company
ITC
Jyothy Lab
Marico
Nestle
Page Inds
Parag Milk
Pidilite Ind.
P&G Hygiene
Prabhat Dairy
United Brew
United Spirits
Aggregate
Healthcare
Alembic Phar
Alkem Lab
Ajanta Pharma
Aurobindo
Biocon
Cadila
Cipla
Divis Lab
Dr Reddy’s
Fortis Health
Glenmark
Granules
GSK Pharma
IPCA Labs
Jubilant Life
Laurus Labs
Lupin
Sanofi India
Shilpa Medicare
Strides Shasun
Sun Pharma
Torrent Pharma
Aggregate
Infrastructure
Ashoka Buildcon
IRB Infra
KNR Constructions
Sadbhav Engineering
Aggregate
Logistics
Allcargo Logistics
Concor
Gateway Distriparks
Aggregate
Media
Dish TV
D B Corp
Den Net.
Ent.Network
Hathway Cable
Hind. Media
Reco
Neutral
Neutral
Neutral
Neutral
Buy
Neutral
Buy
Neutral
Not Rated
Buy
Neutral
(INR)
TP
(INR)
% Upside
EPS (INR)
Down-
FY18E FY19E FY20E
side
3
9.0 10.2 11.4
8
8.1 10.7 13.3
12
6.4
7.6
9.0
3
140.0 159.1 192.3
27
297.1 415.7 549.8
16
8.9 12.4 16.8
18
17.7 20.8 24.1
-1
142.1 171.3 200.8
3.5
6.4
9.7
34
14.1 17.4 22.9
12
32.9 57.0 78.7
EPS Gr. YoY (%)
Valuation snapshot
P/E (x)
P/B (x)
ROE (%)
FY18E FY19E FY20E FY18E FY19E FY18E FY19E FY18E FY19E
6.6
-27.7
1.2
13.2
24.5
147.7
5.7
6.9
-2.0
62.0
22.9
9.0
13.7
32.0
19.2
13.6
39.9
38.7
17.8
20.5
83.8
23.9
73.4
18.5
12.4
24.2
18.4
20.8
32.2
35.6
15.5
17.3
52.1
31.2
38.1
17.3
30.2
43.4
48.6
54.4
72.7
30.4
50.4
66.3
47.5
73.3
95.5
44.4
26.5
32.9
40.8
47.9
51.9
21.9
42.7
55.0
25.9
59.2
55.1
37.4
21.4
24.7
20.5
12.0
54.6
18.5
21.4
23.0
19.0
54.2
16.3
13.7
41.0
23.4
12.8
17.9
19.2
31.4
16.9
16.4
23.4
21.4
21.1
23.9
8.8
21.1
24.2
14.9
12.1
24.2
19.5
21.8
6.6
6.1
15.0
22.9
29.0
3.1
11.8
37.2
2.3
10.3
16.5
12.0
6.1
5.9
14.3
21.4
23.1
2.7
10.1
31.2
2.1
8.9
12.3
10.8
22.8
13.8
33.0
43.4
39.9
10.8
25.2
61.2
4.9
14.9
17.3
26.9
23.8
18.3
36.0
46.2
44.6
13.3
25.4
61.8
8.5
16.2
22.3
28.9
270
278
352
380
309
345
7620 7882
21585 27490
271
314
890
1050
9415 9303
165
-
1032 1380
3137 3515
Neutral
Buy
Buy
Buy
Neutral
Buy
Neutral
Neutral
Neutral
Buy
Neutral
Buy
Neutral
Buy
Buy
Buy
Buy
Buy
Buy
Buy
Buy
Neutral
541
2198
1353
582
595
389
579
1011
2147
149
536
109
2250
684
804
522
770
5080
448
667
512
1311
555
2500
1840
820
600
500
600
1100
2575
185
550
175
2500
750
1110
613
940
5600
749
989
675
1400
3
14
36
41
1
28
4
9
20
24
3
61
11
10
38
18
22
10
67
48
32
7
23.9
66.8
54.0
44.5
7.6
16.8
22.4
32.9
74.4
-0.8
30.6
6.3
49.1
21.4
47.8
19.0
32.3
141.7
13.3
14.1
13.6
48.0
25.3 30.1 10.8 5.9 19.0 22.6
88.9 109.9 -10.5 33.2 23.5 32.9
65.8 81.4 -5.8 21.9 23.6 25.1
48.7 53.6 13.2 9.4 10.1 13.1
10.9 19.8 -25.3 43.1 81.5 78.1
21.0 24.4 18.5 25.0 15.8 23.1
27.0 33.0 40.9 20.6 22.0 25.9
44.0 52.7 -17.7 33.9 19.7 30.8
113.2 145.0 2.4 52.2 28.0 28.9
2.8
7.3
PL
LP 164.5 NM
32.9 41.1 -22.2 7.7 24.7 17.6
7.9
11.0 -12.4 25.2 38.7 17.1
54.9 61.1 42.9 11.9 11.2 45.8
29.2 37.3 33.2 36.6 27.7 31.9
62.6 72.5 29.5 30.9 15.8 16.8
29.1 35.7 7.0 52.7 22.8 27.4
40.2 54.1 -43.0 24.6 34.6 23.9
161.8 186.9 9.8 14.2 15.5 35.8
26.5 33.4 -5.0 99.2 26.1 33.6
40.8 55.7 -56.2 188.8 36.7 47.2
21.9 27.9 -48.1 61.4 27.7 37.8
61.3 78.5 -12.9 27.6 28.0 27.3
-17.4 33.1 25.1 28.0
9.5
24.6
14.0
16.0
19.1
21.3
18.2
17.4
LP 79.9 101.0 43.1
24.8 -3.0 -13.6 8.5
41.2 -17.3 30.2 17.4
27.1 14.9 8.6 27.8
15.3
-9.3
10.3
-9.0
5.3
44.2
22.3
71.3
28.5
15.8
13.5
23.4
14.6
17.5
29.5
33.4
28.0
4.6 3.9 21.8 19.7
5.2 4.4 16.7 19.3
6.1 4.8 27.0 26.2
2.9 2.3 24.6 21.6
6.9 6.3 8.9 11.6
4.8 4.0 22.7 23.7
3.3 2.9 12.8 13.6
5.2 4.6 16.6 21.2
2.8 2.5 10.0 13.7
1.2 1.2 -0.7 2.2
2.9 2.5 16.4 15.3
2.0 1.8 13.2 13.9
10.9 12.5 23.9 30.5
3.2 2.9 10.5 13.0
3.0 2.5 19.7 21.4
3.6 3.0 14.1 18.3
2.4 2.2 10.4 12.0
5.8 5.3 16.1 16.8
3.5 2.9 11.0 19.0
2.1 1.9 4.6 12.1
3.3 3.0 8.8 13.3
4.6 4.0 17.6 19.9
3.5 3.1 12.6 14.8
2.2
1.2
3.7
3.5
2.0
2.0
3.2
2.2
3.0
2.0
1.1
3.2
3.1
1.8
1.8
3.0
2.0
2.7
5.5
15.5
23.6
13.5
13.3
11.7
11.2
6.5
10.6
8.9
13.4
16.2
13.7
12.3
15.3
12.9
10.7
12.6
Buy
Neutral
Buy
Buy
227
217
294
387
290
250
375
460
28
15
27
19
5.3
25.4
16.9
13.9
Buy
Neutral
Buy
156
1238
207
223
1469
237
43
19
15
8.9
41.9
6.2
12.9
51.2
10.6
14.9
58.2
13.1
Buy
Buy
Neutral
Buy
Buy
Buy
66
323
94
698
34
229
101
420
90
820
47
305
54
30
-4
17
40
33
-0.5
18.8
-2.9
8.3
-0.2
25.9
1.6
23.0
0.1
16.4
0.8
28.8
3.4
27.6
4.0
28.7
2.0
32.4
PL
LP 109.9 NM 41.0 16.3 11.7 -11.9 33.2
-7.6 22.0 20.1 17.1 14.0 3.2 2.7 20.1 20.9
Loss LP 5,545 NM 1,319.6 2.1 2.1 -6.3 0.2
-27.7 98.0 75.7 84.5 42.7 3.7 3.5 4.5 8.4
Loss LP 161.9 NM 44.2 2.4 2.2 -1.2 5.2
0.2 11.3 12.6 8.9
8.0
1.2 1.1 15.1 14.6
13 March 2018
13

Click excel icon
for detailed
valuation guide
CMP
Company
HT Media
Jagran Prak.
Music Broadcast
PVR
Prime Focus
Siti Net.
Sun TV
Zee Ent.
Aggregate
Metals
Hindalco
Hind. Zinc
JSPL
JSW Steel
Nalco
NMDC
SAIL
Rain Industries
Vedanta
Tata Steel
Aggregate
Oil & Gas
Aegis Logistics
BPCL
GAIL
Gujarat Gas
Gujarat St. Pet.
HPCL
IOC
IGL
Mahanagar Gas
MRPL
Oil India
ONGC
PLNG
Reliance Ind.
Aggregate
Retail
Jubilant Food
PC Jeweller
Titan Co.
Aggregate
Technology
Cyient
HCL Tech.
Hexaware
Infosys
KPIT Tech
L&T Infotech
Mindtree
Mphasis
NIIT Tech
Persistent Sys
Tata Elxsi
Reco
Neutral
Buy
Buy
Buy
Buy
Neutral
Buy
Buy
(INR)
86
163
370
1321
95
14
892
576
TP
(INR)
117
215
469
1760
130
27
1225
705
% Upside
EPS (INR)
Down-
FY18E FY19E FY20E
side
36
11.8 12.1 12.7
32
10.4 13.1 16.0
27
8.2 13.5 17.8
33
22.1 37.3 51.5
36
2.5
5.8
7.9
87
-0.9
0.1
0.6
37
27.7 35.8 42.5
22
13.7 17.6 21.0
EPS Gr. YoY (%)
Valuation snapshot
P/E (x)
P/B (x)
ROE (%)
FY18E FY19E FY20E FY18E FY19E FY18E FY19E FY18E FY19E
59.3
-2.3
27.8
7.8
100.6
Loss
11.6
2.1
12.1
2.6
26.4
64.9
68.7
137.5
LP
29.1
28.7
43.8
4.9
21.5
31.4
37.9
36.4
411.6
18.7
19.3
28.1
7.3
7.1
15.7 12.4
45.1 27.3
59.7 35.4
38.9 16.4
NM 114.4
32.2 24.9
42.1 32.7
36.7 25.5
8.4
9.6
31.7
12.4
12.5
8.8
16.7
9.7
7.6
9.0
9.1
24.9
10.9
13.8
25.9
15.2
11.7
11.4
27.4
19.0
10.0
8.0
7.9
14.4
13.9
11.4
53.0
17.3
52.1
40.7
15.4
15.1
20.4
16.8
16.4
18.5
20.0
17.0
17.4
15.5
23.3
0.8
2.6
3.6
5.8
4.0
2.8
8.1
7.1
5.1
1.5
6.5
0.7
2.7
1.3
1.6
0.8
3.3
2.1
1.6
1.7
10.5
2.6
1.8
6.2
2.2
2.5
1.7
6.2
4.9
1.7
0.9
1.0
3.6
1.9
1.6
0.7
2.3
3.1
5.0
2.5
2.7
7.3
6.1
4.4
1.3
4.5
0.7
2.2
1.2
1.5
0.8
2.5
1.8
1.4
1.5
7.9
2.2
1.7
5.2
2.0
2.2
1.6
5.3
4.4
1.5
0.8
1.0
3.1
1.7
1.5
11.5
15.3
8.2
10.2
11.6
-15.8
26.1
18.2
14.0
14.0
35.3
-3.6
20.2
-0.9
18.4
-1.0
24.7
15.1
15.9
12.3
31.6
22.7
11.3
16.1
14.6
24.9
17.3
20.8
28.0
20.2
7.1
10.0
23.9
12.8
12.9
10.6
18.4
12.2
15.3
18.9
2.4
30.9
20.0
17.4
16.8
55.7
2.3
19.5
9.8
17.3
4.8
29.8
25.4
16.3
16.8
36.3
21.8
12.8
22.0
13.6
20.2
14.4
20.8
24.4
16.2
10.5
12.8
22.9
12.7
13.2
Buy
Neutral
Buy
Buy
Neutral
Buy
Sell
Buy
Buy
Neutral
227
319
230
298
64
124
72
392
317
623
344
342
361
339
79
215
71
480
416
778
51
7
57
14
24
74
-2
22
31
25
19.5
21.6
-11.5
20.7
-0.5
13.7
-0.9
25.6
23.8
57.7
27.0
33.3
7.3
24.0
5.1
14.0
4.3
40.6
41.7
69.4
27.9 127.9 38.6 3.0 11.6
32.1 9.6 54.6 -3.8 14.8
11.9 Loss LP 63.4 NM
23.7 39.8 15.9 -1.0 14.4
5.3
PL
LP
2.6 NM
14.7 37.6 2.2 4.7 9.0
6.5 Loss LP 50.2 NM
44.6 165.9 58.6 9.8 15.3
43.4 57.4 74.8 4.2 13.3
61.5 51.9 20.4 -11.5 10.8
66.7 55.4 1.7 14.1
12.5
45.8
33.8
42.3
13.9
36.4
42.4
12.5
54.6
12.2
42.2
24.3
18.9
74.3
80.4
-22.0
17.4
28.2
40.1
-14.7
-7.7
7.4
27.0
-15.0
-22.6
7.1
24.3
19.6
3.4
50.1
9.2
22.0
59.6
4.1
-9.4
-9.4
17.2
-3.6
-7.7
56.7
32.5
13.4
10.3
11.9
28.0
11.3
4.6
28.7
8.3
15.8
21.1
13.2
1.2
5.0
3.3
4.1
17.9
11.6
10.7
37.3
11.9
16.9
41.3
15.8
10.6
10.4
32.1
18.3
9.2
12.5
10.4
16.3
15.4
12.8
68.7
21.9
66.1
51.8
17.3
15.7
22.6
18.4
18.1
21.0
24.9
19.5
20.4
19.1
27.6
Buy
Buy
Sell
Buy
Neutral
Buy
Buy
Buy
Buy
Neutral
Buy
Buy
Buy
Buy
242
447
446
850
196
366
401
303
1021
116
327
184
231
929
303
549
388
1014
188
530
513
416
1228
114
425
230
318
1111
25
23
-13
19
-4
45
28
37
20
-2
30
25
38
20
6.5
37.7
26.5
20.6
12.3
34.7
38.7
9.4
55.9
12.6
26.1
17.6
14.1
60.4
9.7
41.2
32.3
32.9
12.8
31.5
35.0
11.1
53.9
11.6
40.9
23.3
16.0
66.6
Neutral
Buy
Buy
2084
338
829
2185
685
990
5
102
19
30.3
15.4
12.5
39.3
19.5
15.9
51.6 186.2 29.6 31.3
24.9 44.4 26.6 27.6
19.8 38.8 27.0 24.1
48.6 27.2 26.0
45.9
68.9
20.9
78.6
17.2
86.1
47.8
54.6
60.6
60.5
51.5
18.1
3.1
21.2
2.6
0.8
18.5
31.5
12.9
17.4
14.4
30.8
12.1
3.8
10.9
9.7
10.5
13.7
24.6
14.8
16.9
22.8
18.4
13.2
7.5
13.4
11.2
29.1
15.2
17.2
8.3
16.2
14.3
18.2
15.5 15.8 22.5 29.8
3.5 3.0 16.9 18.4
14.0 13.0 23.4 25.9
9.9 9.0 19.2 22.2
3.0
3.8
5.7
4.3
2.4
6.0
5.1
3.3
3.2
3.2
8.9
2.7
3.5
4.9
3.7
2.1
4.8
4.5
3.0
2.9
3.1
7.1
17.4
25.1
26.9
24.3
14.3
32.1
19.9
15.3
16.1
17.8
36.0
17.8
23.9
25.8
23.1
13.8
29.0
24.0
18.7
17.6
21.0
33.8
Buy
Neutral
Neutral
Buy
Neutral
Buy
Buy
Neutral
Neutral
Buy
Buy
625
970
374
1186
217
1383
815
856
909
823
1015
675
950
340
1250
219
1400
725
800
800
900
1236
8
-2
-9
5
1
1
-11
-7
-12
9
22
36.2
61.7
16.6
64.4
12.0
65.7
32.7
43.9
44.6
43.1
36.8
40.6
64.1
18.4
70.7
13.3
74.7
40.8
50.4
52.2
53.0
43.6
13 March 2018
14

Click excel icon
for detailed
valuation guide
CMP
Company
TCS
Tech Mah
Wipro
Zensar Tech
Aggregate
Telecom
Bharti Airtel
Bharti Infratel
Idea Cellular
Tata Comm
Aggregate
Utiltites
Coal India
CESC
JSW Energy
NHPC
NTPC
Power Grid
Tata Power
Aggregate
Others
Arvind
Avenue Supermarts
Bata India
BSE
Castrol India
Coromandel Intl
Delta Corp
Eveready Inds.
Interglobe
Indo Count
Info Edge
Kaveri Seed
Manpasand
MCX
Monsanto
Navneet Education
Oberoi Realty
Quess Corp
PI Inds.
Piramal Enterp.
SRF
S H Kelkar
Team Lease Serv.
Trident
TTK Prestige
UPL
V-Guard
Reco
Neutral
Buy
Neutral
Buy
(INR)
3052
620
291
889
TP
(INR)
2700
700
300
1100
Valuation snapshot
% Upside
EPS (INR)
EPS Gr. YoY (%)
P/E (x)
P/B (x)
ROE (%)
Down-
FY18E FY19E FY20E FY18E FY19E FY20E FY18E FY19E FY18E FY19E FY18E FY19E
side
-12
130.6 147.3 161.0 -2.1 12.8 9.3 23.4 20.7 7.3 6.3 30.4 32.9
13
39.2 40.9 47.7 26.8 4.5 16.6 15.8 15.1 3.1 2.7 20.6 19.5
3
17.9 18.5 21.2 6.0 3.2 14.7 16.2 15.7 2.9 2.4 17.2 16.7
24
54.2 64.1 85.2 4.0 18.3 33.1 16.4 13.9 2.4 2.1 15.7 16.4
4.2 5.1 11.1 19.3 18.4 4.8 4.2 25.0 23.1
62
12
40
20
3.5
3.9
14.0 16.2
-10.7 -11.6
2.4 11.6
7.2
17.8
-9.7
23.6
-68.7
-6.1
Loss
-75.8
PL
23.8
71.1
11.4
-18.1
7.5
20.7
-5.8
14.5
-8.4
63.6
17.8
2.0
2.9
45.1
93.7
-8.7
48.2
-42.2
49.0
79.5
41.6
-16.0
21.9
3.6
22.3
124.2
-12.2
14.5
-3.5
9.1
11.6
8.4
4.4
8.9
25.3
12.2
16.5
Loss
383.2
Loss
84.4 120.9
9.7 24.3
Loss NM
102.9 259.7
LP -434.0
107.7 2.5 2.4 2.1 2.3
20.8 4.2 4.3 17.0 20.4
NM
1.3 1.6 -18.1 -20.9
53.7 12.8 10.3 4.6 21.2
-1,539 2.4 2.5 -0.6 -0.2
11.1
10.2
21.5
8.6
11.6
9.6
11.1
10.8
28.6
76.3
36.9
17.3
31.4
17.5
38.5
21.2
16.7
9.2
46.5
11.9
28.9
25.1
20.3
14.2
11.0
31.3
24.4
20.7
18.2
28.2
36.1
7.4
37.8
15.2
40.0
7.2
1.1
1.2
0.9
1.4
1.8
1.7
2.0
6.8
1.0
1.2
0.9
1.3
1.6
1.5
1.9
44.7
10.6
6.7
8.5
10.5
16.5
10.8
14.8
60.8
10.4
5.5
10.8
11.3
17.5
14.5
17.3
Buy
Neutral
Buy
Buy
421
338
79
624
680
380
110
750
Buy
Buy
Sell
Buy
Buy
Buy
Sell
298
968
78
27
171
195
81
401
1408
61
37
210
282
74
35
46
-21
39
23
44
-8
18.5
88.8
4.3
2.4
12.9
16.9
4.9
26.8
95.2
3.6
3.1
14.8
20.4
7.3
31.1
103.2
4.0
3.2
16.2
21.3
7.9
44.9 16.2 16.1
7.3 8.4 10.9
-15.4 10.7 18.2
28.5 3.1 11.0
15.1 9.5 13.3
20.9 4.6 11.6
49.0 8.6 16.6
26.3 10.3 13.6
23.8
37.4
21.0
8.7
-5.9
20.4
40.7
42.5
19.3
32.0
12.5
18.5
47.2
41.1
20.6
28.4
253.5
47.7
20.6
40.0
24.2
22.4
37.5
28.1
27.8
9.7
32.9
34.1
33.4
16.6
8.6
4.3
4.5
34.0
24.1
44.4
17.7
27.1
17.0
35.6
18.5
18.4
17.6
-3.5
27.3
16.4
27.1
32.1
26.6
47.9
25.8
15.4
17.9
12.1
35.4
104.8
44.7
18.9
29.6
21.0
54.1
30.2
19.9
12.1
52.4
14.1
42.5
35.4
24.5
18.3
39.0
46.3
29.5
29.0
22.6
34.5
49.7
9.4
48.3
16.7
53.2
Neutral
Sell
Sell
Neutral
Buy
Buy
Buy
Buy
Neutral
Neutral
Buy
Buy
Buy
Buy
Buy
Buy
Buy
Buy
Buy
Buy
Buy
Buy
Buy
Buy
Neutral
Buy
Neutral
402
1315
711
788
207
507
320
355
1277
91
1223
483
382
737
2575
138
532
1024
865
2414
1877
273
2152
68
6654
718
238
402
920
578
950
242
523
382
458
1307
117
1550
664
467
1100
3293
194
608
1300
988
3500
2040
318
2700
114
5281
945
167
0
-30
-19
20
17
3
19
29
2
29
27
37
22
49
28
40
14
27
14
45
9
17
25
68
-21
32
-30
11.3
12.6
15.9
41.8
7.0
24.1
5.9
11.7
64.0
7.5
23.4
34.2
9.0
20.8
105.0
7.6
13.6
22.1
29.3
83.1
82.9
7.9
43.3
7.2
137.8
43.0
4.5
14.1
17.2
19.3
45.5
6.6
29.0
8.3
16.7
76.4
9.9
26.3
40.6
13.2
29.4
126.6
9.7
48.2
32.7
35.4
116.4
103.0
9.7
59.6
9.2
176.1
47.2
6.0
18.8
23.0
22.4
49.4
6.9
30.3
11.2
20.8
110.4
11.7
33.4
47.4
17.9
34.9
149.9
11.4
46.5
41.6
41.2
147.9
136.0
12.2
88.1
11.6
203.2
55.6
6.7
2.8 2.6 8.0 9.4
18.7 16.0 19.0 22.6
6.2 5.5 14.6 15.7
1.6 1.3 8.5 7.4
20.0 18.8 69.1 61.8
4.4 3.8 22.5 23.4
5.4 4.8 12.6 13.2
7.6 6.1 27.1 32.0
7.3 6.8 46.8 42.1
1.8 1.5 16.0 17.4
6.9 6.2 13.7 14.0
3.5 3.0 23.4 27.1
3.5 3.2 7.4 11.8
2.8 2.7 7.9 11.0
7.6 6.5 32.5 34.5
4.1 3.6 23.9 26.9
3.0 2.4 7.8 24.2
5.7 4.6 21.7 21.0
6.1 5.1 22.6 22.9
2.2 2.0 8.9 10.2
3.1 2.7 14.1 15.9
4.4 4.0 13.4 14.9
8.1 6.6 17.7 20.1
1.1 1.0 12.6 14.5
8.3 7.4 18.0 20.7
4.0 3.3 26.3 23.6
13.0 10.3 26.9 28.8
13 March 2018
15

MOSL Universe stock performance
Company
Automobiles
Amara Raja
Ashok Ley.
Bajaj Auto
Bharat Forge
Bosch
CEAT
Eicher Mot.
Endurance Tech.
Escorts
Exide Ind
Hero Moto
M&M
Mahindra CIE
Maruti Suzuki
Motherson Sumi
Tata Motors
TVS Motor
Banks - Private
AU Small Fin. Bank
Axis Bank
DCB Bank
Equitas Hold.
Federal Bank
HDFC Bank
ICICI Bank
IDFC Bank
IndusInd
J&K Bank
Kotak Mah. Bk
RBL Bank
South Indian
Yes Bank
Banks - PSU
BOB
BOI
Canara
Indian Bk
PNB
SBI
Union Bk
NBFCs
Aditya Birla Cap
Bajaj Fin.
Capital First
Cholaman.Inv.&Fn
Dewan Hsg.
GRUH Fin.
HDFC
HDFC Stand. Life
Indiabulls Hsg
L&T Fin.Holdings
LIC Hsg Fin
M&M Fin.
Muthoot Fin
1 Day (%)
2.5
-0.9
0.7
-1.7
0.1
0.4
1.6
2.8
0.7
1.7
2.8
1.1
-1.7
1.7
0.8
3.1
0.7
-1.3
2.7
0.4
1.7
0.5
0.7
2.7
-0.1
2.1
-0.7
1.4
2.2
-0.6
2.6
0.6
-2.5
1.4
1.9
-0.9
-0.1
-2.5
-0.3
0.9
0.0
2.9
3.2
0.9
2.0
1.2
1.0
1.6
2.0
-1.2
1.7
1M (%)
-3.8
9.1
-5.8
-5.3
-6.7
-3.7
1.6
8.8
-5.2
0.2
1.8
-1.3
4.6
-3.2
-12.5
-5.4
-1.7
-2.6
-7.7
-6.5
-1.8
-1.1
-0.5
-7.8
-7.5
2.8
-13.9
5.5
-3.9
-12.7
-7.0
-21.6
-34.3
-27.3
-20.5
-41.5
-12.4
-28.4
-9.8
1.5
-7.9
6.6
-2.3
3.5
2.7
-2.5
-7.8
-2.4
-5.4
-6.5
-9.6
12M (%)
-1.9
61.1
3.3
42.4
-19.6
34.5
21.1
84.4
68.1
-0.6
11.3
13.1
9.5
48.0
34.8
-24.9
52.8
Company
MAS Financial Serv.
PNB Housing
Repco Home
Shriram City Union
Shriram Trans.
Capital Goods
ABB
Bharat Elec.
BHEL
Blue Star
CG Cons. Elec.
CG Power & Inds Sol.
Cummins
GE T&D
Havells
K E C Intl
L&T
Siemens
Solar Ind
Thermax
Va Tech Wab.
Voltas
Cement
Ambuja Cem.
ACC
Birla Corp.
Dalmia Bharat
Grasim Inds.
India Cem
J K Cements
JK Lakshmi Ce
Ramco Cem
Orient Cem
Prism Cem
Sagar Cements
Sanghi Inds.
Shree Cem
Ultratech
Consumer
Asian Paints
Britannia
Colgate
Dabur
Emami
Godrej Cons.
GSK Cons.
HUL
ITC
Jyothy Lab
Marico
Nestle
Page Inds
Parag Milk
Pidilite Ind.
P&G Hygiene
1 Day (%)
-0.9
2.2
2.5
2.3
0.7
-0.3
1.3
0.8
-0.4
-2.6
3.1
-0.3
0.8
0.4
-3.4
1.5
1.7
-0.4
1.0
0.1
1.5
2.3
1.9
-0.1
3.6
0.5
3.1
-0.3
1.0
1.9
-2.1
0.4
1.4
6.8
1.0
2.3
0.3
0.7
0.3
0.1
-1.6
0.5
1.6
1.8
4.1
0.3
0.6
-0.4
0.6
2.9
1.4
0.4
1M (%)
-5.1
-10.1
-5.5
-0.1
1.6
-11.3
-4.6
-11.0
6.9
-1.4
-10.5
-8.0
-4.4
-2.3
7.4
-3.0
-11.9
-4.5
-1.6
-10.9
7.7
-6.4
-5.3
-20.1
-1.6
-2.3
-7.7
-2.2
-0.2
0.2
-3.2
-14.6
-5.5
-3.0
-4.4
-0.6
-1.3
2.2
-4.5
-5.1
-1.4
4.8
12.1
-1.6
0.1
-0.3
-0.4
6.8
-2.0
-7.5
-0.2
0.7
12M (%)
16.2
-10.0
0.7
40.8
19.9
5.6
-17.5
44.1
23.5
17.7
-9.2
35.6
19.9
129.3
31.7
-7.8
36.8
36.4
-10.3
67.3
5.1
11.6
16.5
49.6
32.6
-4.4
16.9
0.8
18.0
10.3
25.6
27.2
77.6
1.6
8.5
9.8
56.0
10.5
19.7
6.8
33.8
25.5
51.5
2.6
-5.9
10.4
24.0
51.3
25.8
30.3
39.1
0.7
0.9
-12.7
11.1
33.3
22.3
-17.0
29.8
-12.4
32.9
-1.0
22.6
5.2
-16.9
-23.0
-16.1
6.3
-33.1
-7.1
-37.4
52.3
-5.7
57.5
57.2
46.8
35.2
41.7
38.5
-12.8
50.8
11.7
13 March 2018
16

MOSL Universe stock performance
Company
Prabhat Dairy
United Brew
United Spirits
Healthcare
Alembic Phar
Alkem Lab
Ajanta Pharma
Aurobindo
Biocon
Cadila
Cipla
Divis Lab
Dr Reddy’s
Fortis Health
Glenmark
Granules
GSK Pharma
IPCA Labs
Jubilant Life
Lupin
Laurus Labs
Sanofi India
Shilpa Medicare
Strides Shasun
Sun Pharma
Torrent Pharma
Infrastructure
Ashoka Buildcon
IRB Infra.Devl.
KNR Construct.
Sadbhav Engg.
Logistics
Allcargo Logistics
Concor
Gateway Distriparks
Media
Dish TV
D B Corp
Den Net.
Ent.Network
Hathway Cab.
Hind. Media
HT Media
Jagran Prak.
Music Broadcast
PVR
Prime Focus
Siti Net.
Sun TV
Zee Ent.
Metals
Hindalco
Hind. Zinc
JSPL
JSW Steel
1 Day (%)
1.9
1.7
5.5
1.4
-0.5
2.3
-1.8
0.1
1.5
1.1
1.4
0.8
2.7
0.7
1.3
-0.8
0.6
1.1
0.7
0.3
0.7
0.8
0.7
1.1
-1.3
0.4
0.6
-0.2
1.7
-2.6
-0.7
1.0
-1.4
-2.6
0.1
1.0
-2.7
-1.5
0.1
-1.1
-2.0
-0.1
-1.2
-7.4
1.5
1.3
3.3
1.5
3.8
2.3
1M (%)
-12.4
-4.1
-3.8
-2.5
0.8
-5.1
-4.3
-2.7
-8.0
-6.7
-2.4
-2.4
7.3
0.3
-11.2
-8.1
6.8
-14.1
-8.2
0.7
5.3
-12.2
-9.8
-13.0
-8.0
-5.6
-4.7
-9.9
-3.5
-20.6
-6.5
-3.2
-12.1
-1.1
-15.5
-0.3
-14.4
-6.1
-9.8
-4.4
5.5
-6.4
-11.7
-26.8
-9.3
-1.6
-6.7
3.8
-16.0
-4.1
12M (%)
33.7
34.4
41.9
-13.3
11.4
-20.8
-11.1
68.0
-11.1
-1.4
33.0
-21.1
-16.0
-39.0
-15.4
-16.6
25.2
7.2
-46.8
2.1
19.6
-30.2
-41.1
-25.0
-1.5
25.6
-4.2
62.0
38.8
-4.5
24.3
-18.3
-36.7
-15.4
15.2
-15.6
-10.4
-16.4
3.4
-13.3
-7.3
19.0
-61.8
19.8
12.1
21.1
12.2
83.3
69.3
Company
Nalco
NMDC
Rain Industries
SAIL
Vedanta
Tata Steel
Oil & Gas
Aegis Logistics
BPCL
GAIL
Gujarat Gas
Gujarat St. Pet.
HPCL
IOC
IGL
Mahanagar Gas
MRPL
Oil India
ONGC
PLNG
Reliance Ind.
Retail
Jubilant Food
PC Jeweller
Titan Co.
Technology
Cyient
HCL Tech.
Hexaware
Infosys
KPIT Tech
L&T Infotech
Mindtree
Mphasis
NIIT Tech
Persistent Sys
Tata Elxsi
TCS
Tech Mah
Wipro
Zensar Tech
Telecom
Bharti Airtel
Bharti Infratel
Idea Cellular
Tata Comm
Utiltites
Coal India
CESC
JSW Energy
NHPC Ltd
NTPC
Power Grid
Tata Power
1 Day (%)
2.2
1.4
1.0
4.0
4.4
2.8
-0.1
1.8
2.0
-0.6
-1.9
2.6
3.9
0.9
1.2
0.4
1.6
2.2
0.1
1.9
1.4
0.5
1.2
0.4
2.7
3.7
1.9
3.6
2.0
0.1
3.8
3.5
0.8
1.1
0.6
0.1
1.9
0.6
4.7
1.3
-0.3
1.1
-2.3
-1.5
-1.7
-0.6
4.3
0.2
0.9
1M (%)
-14.9
-10.0
0.0
-24.3
0.8
-12.6
-11.7
-4.0
-3.9
-0.2
-2.2
-6.4
5.6
0.4
-0.8
-2.2
-9.6
-3.8
-7.1
1.6
2.8
-12.0
2.6
-0.3
3.4
13.6
7.4
1.0
-4.2
12.9
-2.0
9.9
5.3
0.8
2.8
5.2
1.0
-4.8
-0.8
0.1
-7.3
-3.9
-0.8
-6.6
-5.8
-9.7
3.8
-1.4
-7.1
12M (%)
-8.8
-11.5
291.1
22.0
27.6
41.2
19.5
7.5
18.0
29.3
22.5
7.2
7.5
47.9
19.8
12.9
-2.3
-4.0
22.0
45.1
93.8
79.8
86.6
33.9
14.9
71.3
16.2
63.9
97.0
71.7
49.4
117.9
33.8
41.6
20.1
30.3
19.4
-4.3
15.3
9.7
-24.7
-16.9
-5.9
21.6
27.0
-11.6
8.9
1.4
-1.6
13 March 2018
17

MOSL Universe stock performance
Company
Others
Arvind
Avenue Super.
Bata India
BSE
Castrol India
Coromandel Intl
Delta Corp
Eveready Inds.
Interglobe
Indo Count
Info Edge
Kaveri Seed
Manpasand
MCX
Monsanto
Navneet Educat.
Oberoi Realty
PI Inds.
Piramal Enterp.
Quess Corp
SRF
S H Kelkar
Team Lease Serv.
Trident
UPL
V-Guard
1 Day (%)
3.3
0.8
0.4
1.9
1.2
-0.7
1.7
-6.0
-0.7
-1.7
-3.3
0.7
1.9
-1.0
0.5
-0.8
1.3
1.2
2.2
3.8
1.3
-0.3
-1.5
1.0
0.8
3.3
1M (%)
-1.0
10.8
-0.5
-5.2
4.5
-4.5
-11.8
-6.3
2.0
-14.3
-1.9
0.8
-9.0
-0.6
2.5
-7.3
14.8
2.5
-10.0
7.8
-0.8
-4.2
-1.8
-11.0
-0.9
6.4
12M (%)
2.8
39.7
-15.8
1.7
60.2
86.8
53.8
46.3
-47.9
49.4
-5.0
8.0
-32.5
3.1
-4.5
55.8
0.4
29.9
52.8
19.9
-5.9
141.1
-12.0
2.1
36.1
13 March 2018
18

THEMATIC/STRATEGY RESEARCH GALLERY

REPORT GALLERY
RECENT INITIATING COVERAGE REPORTS
.
Rs

DIFFERENTIATED PRODUCT GALLERY

Explanation of Investment Rating
Investment Rating
BUY
SELL
NEUTRAL
UNDER REVIEW
NOT RATED
Expected return (over 12-month)
>=15%
< - 10%
> - 10 % to 15%
Rating may undergo a change
We have forward looking estimates for the stock but we refrain from assigning recommendation
*In case the recommendation given by the Research Analyst becomes inconsistent with the investment rating legend, the Research Analyst shall within 28 days of the inconsistency, take appropriate measures to make the recommendation consistent with the investment rating legend.
Disclosures:
The following Disclosures are being made in compliance with the SEBI Research Analyst Regulations 2014 (herein after referred to as the Regulations).
Motilal Oswal Securities Ltd. (MOSL) is a SEBI Registered Research Analyst having registration no. INH000000412. MOSL, the Research Entity (RE) as defined in the Regulations, is engaged in the business of providing Stock broking services,
Investment Advisory Services, Depository participant services & distribution of various financial products. MOSL is a subsidiary company of Motilal Oswal Financial Service Ltd. (MOFSL). MOFSL is a listed public company, the details in respect of
which are available on
www.motilaloswal.com.
MOSL is registered with the Securities & Exchange Board of India (SEBI) and is a registered Trading Member with National Stock Exchange of India Ltd. (NSE) and Bombay Stock Exchange Limited
(BSE), Metropolitan Stock Exchange Of India Ltd. (MSE) for its stock broking activities & is Depository participant with Central Depository Services Limited (CDSL) & National Securities Depository Limited (NSDL) and is member of Association of
Mutual Funds of India (AMFI) for distribution of financial products. Details of associate entities of Motilal Oswal Securities Limited are available on the website at
http://onlinereports.motilaloswal.com/Dormant/documents/Associate%20Details.pdf
Regulatory Enquiries against Motilal Oswal Securities Limited by SEBI:
SEBI pursuant to a complaint from client Shri C.R. Mohanraj alleging unauthorized trading, issued a letter dated 29th April 2014 to MOSL notifying appointment of an Adjudicating Officer as per SEBI regulations to hold inquiry and
adjudge violation of SEBI Regulations; MOSL requested SEBI to provide all documents, records, investigation report relied upon by SEBI which were referred in Show Cause Notice. The matter is closed and MOSL had to pay Rs. 2
lakhs towards penalty for misplacement of original POA of client.
MOSL, it’s associates, Research Analyst or their relative may have any financial interest in the subject company. MOSL and/or its associates and/or Research Analyst may have beneficial ownership of 1% or more securities in the subject company at
the end of the month immediately preceding the date of publication of the Research Report.
MOSL and its associate company(ies), their directors and Research Analyst and their relatives may; (a) from time to time, have a long or short position in, act
as principal in, and buy or sell the securities or derivatives thereof of companies mentioned herein. (b) be engaged in any other transaction involving such securities and earn brokerage or other compensation or act as a market maker in the financial
instruments of the company(ies) discussed herein or act as an advisor or lender/borrower to such company(ies) or may have any other potential conflict of interests with respect to any recommendation and other related information and opinions.;
however the same shall have no bearing whatsoever on the specific recommendations made by the analyst(s), as the recommendations made by the analyst(s) are completely independent of the views of the associates of MOSL even though there
might exist an inherent conflict of interest in some of the stocks mentioned in the research report.
Research Analyst may have served as director/officer, etc. in the subject company in the last 12 month period. MOSL and/or its associates may have
received any compensation from the subject company in the past 12 months.
In the last 12 months period ending on the last day of the month immediately preceding the date of publication of this research report, MOSL or any of its associates may have:
a)
managed or co-managed public offering of securities from subject company of this research report,
b)
received compensation for investment banking or merchant banking or brokerage services from subject company of this research report,
c)
received compensation for products or services other than investment banking or merchant banking or brokerage services from the subject company of this research report.
d)
Subject Company may have been a client of MOSL or its associates during twelve months preceding the date of distribution of the research report.
MOSL and it’s associates have not received any compensation or other benefits from the subject company or third party in connection with the research report. To enhance transparency, MOSL has incorporated a Disclosure of Interest Statement in
this document. This should, however, not be treated as endorsement of the views expressed in the report. MOSL and / or its affiliates do and seek to do business including investment banking with companies covered in its research reports. As a result,
the recipients of this report should be aware that MOSL may have a potential conflict of interest that may affect the objectivity of this report. Compensation of Research Analysts is not based on any specific merchant banking, investment banking or
brokerage service transactions.
Terms & Conditions:
This report has been prepared by MOSL and is meant for sole use by the recipient and not for circulation. The report and information contained herein is strictly confidential and may not be altered in any way, transmitted to, copied or distributed, in part
or in whole, to any other person or to the media or reproduced in any form, without prior written consent of MOSL. The report is based on the facts, figures and information that are considered true, correct, reliable and accurate. The intent of this report
is not recommendatory in nature. The information is obtained from publicly available media or other sources believed to be reliable. Such information has not been independently verified and no guaranty, representation of warranty, express or implied,
is made as to its accuracy, completeness or correctness. All such information and opinions are subject to change without notice. The report is prepared solely for informational purpose and does not constitute an offer document or solicitation of offer to
buy or sell or subscribe for securities or other financial instruments for the clients. Though disseminated to all the customers simultaneously, not all customers may receive this report at the same time. MOSL will not treat recipients as customers by
virtue of their receiving this report.
Analyst Certification
The views expressed in this research report accurately reflect the personal views of the analyst(s) about the subject securities or issues, and no part of the compensation of the research analyst(s) was, is, or will be directly or indirectly related to the
specific recommendations and views expressed by research analyst(s) in this report.
Disclosure of Interest Statement
Analyst ownership of the stock
Companies where there is interest
No
A graph of daily closing prices of securities is available at
www.nseindia.com, www.bseindia.com.
Research Analyst views on Subject Company may vary based on Fundamental research and Technical Research. Proprietary trading desk of MOSL or
its associates maintains arm’s length distance with Research Team as all the activities are segregated from MOSL research activity and therefore it can have an independent view with regards to subject company for which Research Team have
expressed their views.
Regional Disclosures (outside India)
This report is not directed or intended for distribution to or use by any person or entity resident in a state, country or any jurisdiction, where such distribution, publication, availability or use would be contrary to law, regulation or which would subject
MOSL & its group companies to registration or licensing requirements within such jurisdictions.
For Hong Kong:
This report is distributed in Hong Kong by Motilal Oswal capital Markets (Hong Kong) Private Limited, a licensed corporation (CE AYY-301) licensed and regulated by the Hong Kong Securities and Futures Commission (SFC) pursuant to the Securities
and Futures Ordinance (Chapter 571 of the Laws of Hong Kong) “SFO”. As per SEBI (Research Analyst Regulations) 2014 Motilal Oswal Securities (SEBI Reg No. INH000000412) has an agreement with Motilal Oswal capital Markets (Hong Kong)
Private Limited for distribution of research report in Hong Kong. This report is intended for distribution only to “Professional Investors” as defined in Part I of Schedule 1 to SFO. Any investment or investment activity to which this document relates is only
available to professional investor and will be engaged only with professional investors.” Nothing here is an offer or solicitation of these securities, products and services in any jurisdiction where their offer or sale is not qualified or exempt from
registration. The Indian Analyst(s) who compile this report is/are not located in Hong Kong & are not conducting Research Analysis in Hong Kong.
For U.S.
Motilal Oswal Securities Limited (MOSL) is not a registered broker - dealer under the U.S. Securities Exchange Act of 1934, as amended (the"1934 act") and under applicable state laws in the United States. In addition MOSL is not a registered
investment adviser under the U.S. Investment Advisers Act of 1940, as amended (the "Advisers Act" and together with the 1934 Act, the "Acts), and under applicable state laws in the United States. Accordingly, in the absence of specific exemption
under the Acts, any brokerage and investment services provided by MOSL, including the products and services described herein are not available to or intended for U.S. persons. This report is intended for distribution only to "Major Institutional
Investors" as defined by Rule 15a-6(b)(4) of the Exchange Act and interpretations thereof by SEC (henceforth referred to as "major institutional investors"). This document must not be acted on or relied on by persons who are not major institutional
investors. Any investment or investment activity to which this document relates is only available to major institutional investors and will be engaged in only with major institutional investors. In reliance on the exemption from registration provided by Rule
15a-6 of the U.S. Securities Exchange Act of 1934, as amended (the "Exchange Act") and interpretations thereof by the U.S. Securities and Exchange Commission ("SEC") in order to conduct business with Institutional Investors based in the U.S.,
MOSL has entered into a chaperoning agreement with a U.S. registered broker-dealer, Motilal Oswal Securities International Private Limited. ("MOSIPL"). Any business interaction pursuant to this report will have to be executed within the provisions of
this chaperoning agreement.
The Research Analysts contributing to the report may not be registered /qualified as research analyst with FINRA. Such research analyst may not be associated persons of the U.S. registered broker-dealer, MOSIPL, and therefore, may not be subject
to NASD rule 2711 and NYSE Rule 472 restrictions on communication with a subject company, public appearances and trading securities held by a research analyst account.
For Singapore
Motilal Oswal Capital Markets Singapore Pte Limited is acting as an exempt financial advisor under section 23(1)(f) of the Financial Advisers Act(FAA) read with regulation 17(1)(d) of the Financial Advisors Regulations and is a subsidiary of Motilal
Oswal Securities Limited in India. This research is distributed in Singapore by Motilal Oswal Capital Markets Singapore Pte Limited and it is only directed in Singapore to accredited investors, as defined in the Financial Advisers Regulations and the
Securities and Futures Act (Chapter 289), as amended from time to time. In respect of any matter arising from or in connection with the research you could contact the following representatives of Motilal Oswal Capital Markets Singapore Pte Limited:
Disclaimer:
The report and information contained herein is strictly confidential and meant solely for the selected recipient and may not be altered in any way, transmitted to, copied or distributed, in part or in whole, to any other person or to the media or reproduced
in any form, without prior written consent. This report and information herein is solely for informational purpose and may not be used or considered as an offer document or solicitation of offer to buy or sell or subscribe for securities or other financial
instruments. Nothing in this report constitutes investment, legal, accounting and tax advice or a representation that any investment or strategy is suitable or appropriate to your specific circumstances. The securities discussed and opinions expressed in
this report may not be suitable for all investors, who must make their own investment decisions, based on their own investment objectives, financial positions and needs of specific recipient. This may not be taken in substitution for the exercise of
independent judgment by any recipient. Each recipient of this document should make such investigations as it deems necessary to arrive at an independent evaluation of an investment in the securities of companies referred to in this document
(including the merits and risks involved), and should consult its own advisors to determine the merits and risks of such an investment. The investment discussed or views expressed may not be suitable for all investors. Certain transactions -including
those involving futures, options, another derivative products as well as non-investment grade securities - involve substantial risk and are not suitable for all investors. No representation or warranty, express or implied, is made as to the accuracy,
completeness or fairness of the information and opinions contained in this document. The Disclosures of Interest Statement incorporated in this document is provided solely to enhance the transparency and should not be treated as endorsement of the
views expressed in the report. This information is subject to change without any prior notice. The Company reserves the right to make modifications and alternations to this statement as may be required from time to time without any prior approval.
MOSL, its associates, their directors and the employees may from time to time, effect or have effected an own account transaction in, or deal as principal or agent in or for the securities mentioned in this document. They may perform or seek to perform
investment banking or other services for, or solicit investment banking or other business from, any company referred to in this report. Each of these entities functions as a separate, distinct and independent of each other. The recipient should take this
into account before interpreting the document. This report has been prepared on the basis of information that is already available in publicly accessible media or developed through analysis of MOSL. The views expressed are those of the analyst, and
the Company may or may not subscribe to all the views expressed therein. This document is being supplied to you solely for your information and may not be reproduced, redistributed or passed on, directly or indirectly, to any other person or
published, copied, in whole or in part, for any purpose. This report is not directed or intended for distribution to, or use by, any person or entity who is a citizen or resident of or located in any locality, state, country or other jurisdiction, where such
distribution, publication, availability or use would be contrary to law, regulation or which would subject MOSL to any registration or licensing requirement within such jurisdiction. The securities described herein may or may not be eligible for sale in all
jurisdictions or to certain category of investors. Persons in whose possession this document may come are required to inform themselves of and to observe such restriction. Neither the Firm, not its directors, employees, agents or representatives shall
be liable for any damages whether direct or indirect, incidental, special or consequential including lost revenue or lost profits that may arise from or in connection with the use of the information.
The person accessing this information specifically agrees
to exempt MOSL or any of its affiliates or employees from, any and all responsibility/liability arising from such misuse and agrees not to hold MOSL or any of its affiliates or employees responsible for any such misuse and further agrees to hold MOSL
or any of its affiliates or employees free and harmless from all losses, costs, damages, expenses that may be suffered by the person accessing this information due to any errors and delays.
Registered Office Address: Motilal Oswal Tower, Rahimtullah Sayani Road, Opposite Parel ST Depot, Prabhadevi, Mumbai-400025; Tel No.: 022-3980 4263; www.motilaloswal.com. Correspondence Address: Palm Spring Centre, 2nd Floor, Palm
Court Complex, New Link Road, Malad (West), Mumbai- 400 064. Tel No: 022 3080 1000. Compliance Officer: Neeraj Agarwal, Email Id:
na@motilaloswal.com,
Contact No.:022-30801085.
Registration details of group entities.: MOSL: SEBI Registration: INZ000158836 (BSE/NSE/MSE); CDSL: IN-DP-16-2015; NSDL: IN-DP-NSDL-152-2000; Research Analyst: INH000000412. AMFI: ARN 17397. Investment Adviser: INA000007100.
Motilal Oswal Asset Management Company Ltd. (MOAMC): PMS (Registration No.: INP000000670) offers PMS and Mutual Funds products. Motilal Oswal Wealth Management Ltd. (MOWML): PMS (Registration No.: INP000004409) offers wealth
management solutions. *Motilal Oswal Securities Ltd. is a distributor of Mutual Funds, PMS, Fixed Deposit, Bond, NCDs, Insurance and IPO products. * Motilal Oswal Commodities Broker Pvt. Ltd. offers Commodities Products. * Motilal Oswal Real
Estate Investment Advisors II Pvt. Ltd. offers Real Estate products. * Motilal Oswal Private Equity Investment Advisors Pvt. Ltd. offers Private Equity products
13 December 2016
20