3 April 2018
Market snapshot
Equities - India
Close
Chg .%
Sensex
33,255
0.9
Nifty-50
10,212
1.0
Nifty-M 100
19,097
1.8
Equities-Global
Close
Chg .%
S&P 500
2,582
-1.2
Nasdaq
6,870
-2.0
FTSE 100
7,045
0.6
DAX
11,941
-0.3
Hang Seng
12,001
-2.4
Nikkei 225
21,389
1.7
Commodities
Close
Chg .%
Brent (US$/Bbl)
67
-2.5
Gold ($/OZ)
1,341
1.2
Cu (US$/MT)
6,634
0.4
Almn (US$/MT)
2,008
-0.5
Currency
Close
Chg .%
USD/INR
65.2
0.0
USD/EUR
1.2
0.0
USD/JPY
105.9
-0.9
YIELD (%)
Close
1MChg
10 Yrs G-Sec
7.4
0.07
10 Yrs AAA Corp
8.0
-0.16
Flows (USD b)
2-Apr
MTD
FIIs
-0.1
2.0
DIIs
0.1
1.1
Volumes (INRb)
2-Apr
MTD*
Cash
294
294
F&O
3,791
3,791
Note: YTD is calendar year, *Avg
YTD.%
-2.4
-3.0
-9.6
YTD.%
-3.4
-0.5
-8.4
-7.6
2.5
-6.0
YTD.%
0.5
2.9
-8.0
-11.0
YTD.%
2.0
2.5
-6.0
YTDchg
0.1
0.1
YTD
2.2
3.9
YTD*
387
8,176
Today’s top research idea
Tata Chemicals (Initiating Coverage): Flight of rebirth
Transforming into a growth company; re-rating imminent
TTCH is using its cash cows – soda ash and sodium bicarbonate – to build
growth businesses such as consumer and specialty products. In the consumer
business, it enjoys leadership in the domestic table salts market and is fortifying
its pulses and spices portfolios. In the specialty products business, it is
developing nanomaterial and nutritional solutions.
Massive cash generation of INR39.7b via divestment of the urea and phosphatic
fertilizers business and sale of investments coupled with steady accruals from
the soda ash business would help TTCH repay debt. Its interest outgo is likely to
decline from INR4.1b in FY17 to INR2.1b in FY20.
As TTCH scales up its growth businesses and deleverages its balance sheet, we
expect its consolidated RoCE to improve considerably, in turn driving a stock re-
rating. We believe it would be fair to assign ~30% premium to its five-year
average EV/EBITDA of 7.5x. Our SOTP-based target price of INR940 (implied
EV/EBITDA of 9.7x FY20E) implies 36% upside. We initiate coverage with
Buy.
Research covered
Cos/Sector
Tata Chemicals
Motherson Sumi
Financials
Telecom
Economy
Shilpa Medicare
Auto Volumes
Key Highlights
(Initiating Coverage): Flight of rebirth
SMRPBV to acquire Reydel Auto for USD201m (2x EBITDA)
RBI allows spreading of MTM losses, mandates creation of IFR
Competitive intensity to persist in FY19; ARPU recovery merely
delayed
2Q 2018: India’s Quarterly Economic Outlook; Growth forecasts
revised up
Stake sale to mark end of JV with ICE
MAR-18 Volumes (1. Mahindra & Mahindra; 2. Bajaj Auto; 3. Hero
MotoCorp; 4. Eicher Motors; 5. Ashok Leyland; 6. TVS Motor)
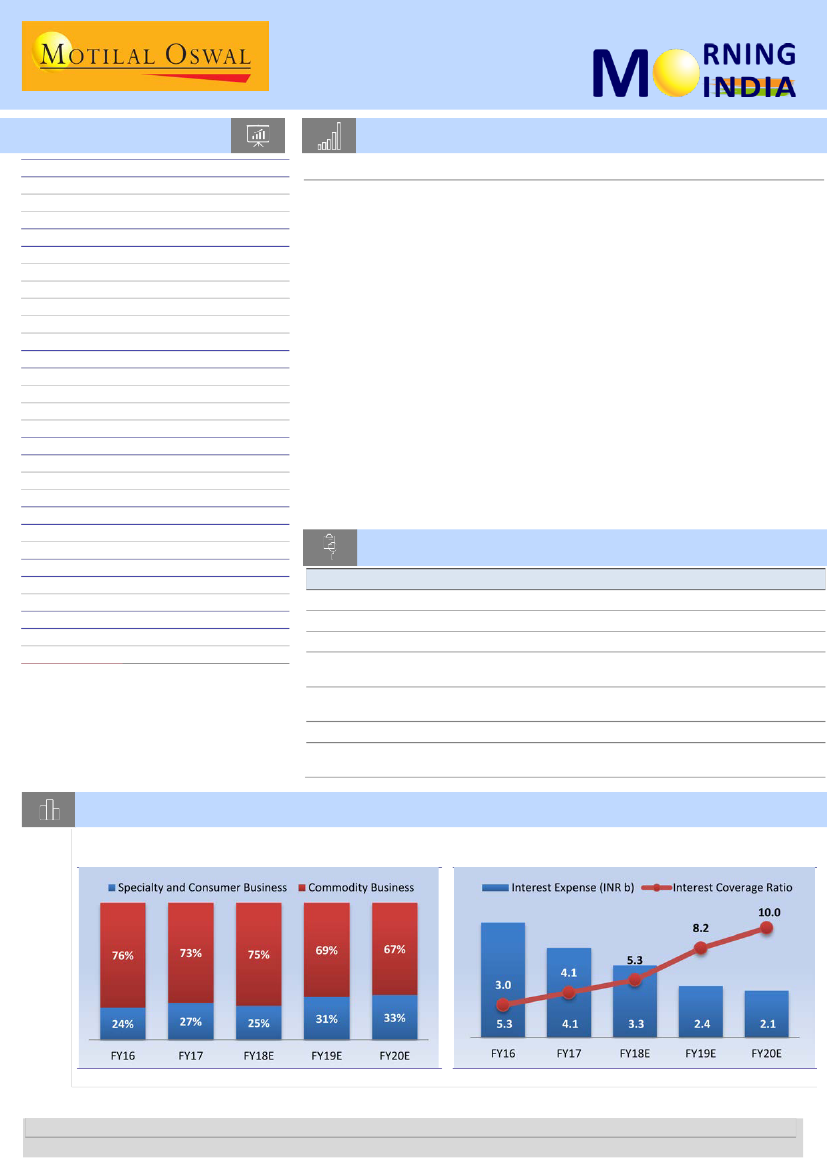
Chart of the Day:
Tata Chemicals (Initiating Coverage): Flight of rebirth
Contribution of specialty & consumer business to increase to
33% in FY20
Debt reduction to lower interest expense
Source: Company, MOSL
Research Team (Gautam.Duggad@MotilalOswal.com)
Investors are advised to refer through important disclosures made at the last page of the Research Report.
Motilal Oswal research is available on www.motilaloswal.com/Institutional-Equities, Bloomberg, Thomson Reuters, Factset and S&P Capital.

In the news today
Kindly click on textbox for the detailed news link
1
RBI lets banks spread out
provisioning for bond market
losses over 4 quarters
The Reserve Bank of India (RBI) on
Monday allowed banks to spread
out the provisioning to cover
losses on their government bond
portfolio across four quarters, in a
relief for lenders who would have
otherwise faced an immediate hit
to their bond portfolio due to …
2
ReNew Power acquires Ostro Energy to become country's largest
RE company
ReNew Power became the largest renewable energy company in India
after it acquired Ostro Energy on Monday. The deal size is estimated to be
$1.55 billion (Rs 100 billion), the biggest deal in the renewable energy
sector. The deal is funded in a 60:40 equity-debt ratio with the company
open to debt refinancing later, according to persons close to the
development. Canada Pension Plan Investment Board (CPPIB) had pumped
in $247 million to assist ReNew in finalising the deal, the company said.
3
Govt rules out excise duty cut to
cushion petrol prices
The government today ruled out
any immediate reduction in excise
duty to cushion relentless rise in
international oil prices that have
sent retail diesel rates in India to
record high and petrol to four-
year high. The BJP-led government
had raised excise duty nine times
between November 2014 and
January 2016 to shore up finances
as global oil prices fell, but...
4
Direct tax mop up at Rs 9.95
lakh crore in FY18, misses
revised estimates
The income tax collections during
the 2017-18 fiscal has exceeded
the Budget target at Rs 9.95 lakh
crore, helped by addition of one
crore new assesses who have
started filing income tax returns.
However, the government has
missed its ambitious target of Rs
10.05 lakh crore as per the revised
estimates set in the Budget ...
5
In top gear, automakers post
highest-ever sales in FY18
Most auto manufacturers,
including some passenger car
makers, have registered double-
digit growth in March. Fiscal
2017-18 also saw some players
register their highest-ever sales.
In the passenger vehicle
segment, market leader Maruti
Suzuki India grew 15 per cent
year-on-year (YoY) in March,
with sales of 1.47 lakh units
(1.27 lakh units). For the fiscal,
the company recorded 14 per
cent volume growth, selling
more than 16.53 lakh units
(14.44 lakh units).
6
Low prices the way forward
for Future Group
Future Group, the country’s
biggest retailer, is changing its
discount pricing strategy to ‘Har
Din Low Prices’, mimicking
Walmart’s global everyday low
pricing business model, putting
pressure on its rivals to drop
grocery prices. The Kishore
Biyani-owned retail chain
claimed that prices of about
1,500 stock keeping units at its …
3 April 2018
7
Highway construction hits
record 10,000 km in FY18
Construction of national
highways in India hit a record
10,000 km in the year ended
March 31 after the government
stepped up the pace of
implementation and awarding
contracts. On average, 27.5 km
of highways were constructed
every day in FY18, while
contracts were awarded for an
average 46 km per day, a top…
2

Initiating Coverage | Sector: Chemicals
Tata Chemicals
BSE Sensex
33,255
S&P CNX
10,212
CMP: INR692
TP: INR940 (+36% )
Buy
Tata Chemicals (TTCH) is a 78-year-old commodities company, reinventing itself as a
specialty and consumer products company. It has a diversified portfolio of businesses:
Stock Info
Bloomberg
Equity Shares (m)
52-Week Range (INR)
1, 6, 12 Rel. Per (%)
M.Cap. (INR b)
M.Cap. (USD b)
Avg Val, INRm
Free float (%)
(a) soda ash and sodium bicarbonate, where it enjoys global leadership, (b) fertilizers,
TTCH IN
254.8
781 / 558
1/3/3
176.1
2.7
565.0
69.2
FY20E
126.3
27.2
12.8
50.3
14.3
423.2
12.3
9.9
13.8
1.6
which it is exiting from, (c) agricultural inputs, through subsidiary, Rallis India, (d)
consumer products such as branded iodized salt, pulses and spices, and (e) a fledging
specialty products business – materials such as highly dispersible silica (HDS) and
nanomaterial, and nutritional products like oligosaccharides and polyols. It also has
sizable financial investments that it can liquidate to fund its growth.
Financial Snapshot (INR b)
Y/E Mar
FY18E FY19E
Net Sales
105.8
115.5
EBITDA
22.6
24.7
PAT
8.6
11.2
EPS (INR)
33.7
44.0
Gr. (%)
0.0
30.5
BV/Sh (INR)
368.7
394.1
RoE (%)
11.3
11.5
RoCE (%)
7.8
9.1
P/E (x)
20.5
15.7
P/BV (x)
1.9
1.8
Flight of rebirth
Transforming into a growth company; re-rating imminent
Shareholding pattern (%)
As On
Dec-17 Sep-17 Dec-16
Promoter
30.8
30.8
30.8
DII
31.5
27.9
29.7
FII
11.5
15.1
18.6
Others
26.2
26.1
21.0
FII Includes depository receipts
TTCH is using its cash cows – soda ash and sodium bicarbonate – to build growth
businesses such as consumer and specialty products. In the consumer business, it
enjoys leadership in the domestic table salts market and is fortifying its pulses and
spices portfolios. In the specialty products business, it is developing nanomaterial
and nutritional solutions.
Massive cash generation of INR39.7b via divestment of the urea and phosphatic
fertilizers business and sale of investments coupled with steady accruals from the
soda ash business would help TTCH repay debt. Its interest outgo is likely to
decline from INR4.1b in FY17 to INR2.1b in FY20.
As TTCH scales up its growth businesses and deleverages its balance sheet, we
expect its consolidated RoCE to improve considerably, in turn driving a stock re-
rating. We believe it would be fair to assign ~30% premium to its five-year
average EV/EBITDA of 7.5x. Our SOTP-based target price of INR940 (implied
EV/EBITDA of 9.7x FY20E) implies 36% upside. We initiate coverage with Buy.
Using cash cows to invest in growth businesses
TTCH is the global leader in soda ash and sodium bicarbonate. These are
mature, commodity businesses, growing at 3-4% per year and yielding
consistent cash flows. TTCH is using these cash cows to build growth businesses
such as consumer and specialty products. The company should be able to
enhance focus on these businesses following its exit from the regulated fertilizer
business. We expect the contribution of specialty and consumer products to
increase from 27% in FY17 to 33% by FY20, based on the progress in its existing
portfolio, though the company’s internal target is to reach 50% via the launch of
new products. TTCH enjoys leadership in the domestic table salts market and
will continue focusing on growing its other specialty and consumer products,
including nutraceuticals and silica. We expect specialty and consumer products
revenue to grow at a CAGR of ~14%, outpacing the overall growth of 9% over
FY18-20.
Tata Chemicals
Flight of rebirth
Sumant Kumar
+
91 22 3078 4702
Sumant.Kumar@motilaloswal.com
3 April 2018
3

Stock Performance (1-year)
To be net debt-free by FY20; RoCE to improve considerably
Divestment of the fertilizer business and sale of Tata Global Beverages shares should
result in cumulative gross cash inflow of ~INR39.7b in FY18. Internal accruals would
add further to cash flows. TTCH is also focusing on working capital, which has
reduced by INR21b in two years. Strong cash flows will allow part repayment of debt
and also help invest in higher-RoCE businesses like specialty and consumer products.
TTCH is investing in manufacturing facilities for new materials (such as HDS and
nanomaterial) and nutritional solutions (such as oligosaccharides and polyol). At full
potential, these businesses should generate RoCE of 20-25%. We expect the
company to be net debt free by FY20 from net-debt-to-equity of 0.7x in FY17.
Interest outgo should reduce from INR4.1b in FY17 to INR2.1b in FY20, enabling 22%
CAGR in continuing business profitability over FY18-20.
Focus now on consumer…
TTCH has been a pioneer in developing the market for iodized salt in India, and
enjoys a share of 25% in the country’s powdered salt market. It has a distribution
network of 1.7m retail outlets, reaching 143m households across India. Compared to
the other prominent FMCG companies in India that have an average retail reach of
5m-6m outlets, we believe TTCH has ample headroom available for growth.
Leveraging on the network, TTCH has expanded its horizons to include branded
pulses, spices, besan (pulse flour) and water purifiers, where it is yet to realize full
potential.
…and specialty products
TTCH is also entering nutritional solutions. We believe nutraceuticals presents a
huge global opportunity, with an estimated B2B market size of ~USD60b in 2016 and
B2C market size of ~USD182b, which is expected to grow at 9% CAGR till 2021. At
full utilization, we expect the current planned nutraceuticals capacity addition (likely
to be commercialized by 1QFY20) to contribute 4% of consolidated sales and 5% of
consolidated EBITDA. This would increase to 9% of consolidated sales and 10% of
consolidated EBITDA on doubling capacity, and 13% of consolidated sales and 15%
of consolidated EBITDA on tripling capacity, with global B2B market share at just 0.1-
0.3%. Besides, it is foraying into yet another technology-enabled, differentiated
business – highly dispersible silica (HDS). HDS is a substitute for carbon black, which
had a market of INR50b in India in 2016.
Initiating coverage with a Buy rating
TTCH has traded at a one-year forward EV/EBITDA of 7.5x (average) for the last five
years. Our SOTP-based target price is INR940 (implied EV/EBITDA of 9.7x).
Considering the increased focus/business transformation toward higher-RoCE
segments (specialty and consumer products) and the divestment of a regulated
business (fertilizers), we believe it is fair to assign ~30% premium to its five-year
average EV/EBITDA. We expect TTCH to continue its journey to become a larger
specialty and consumer play. As at the end of FY17, net debt stood at INR52b. We
expect the company to become net-debt-free by FY20, with (i) cash generated from
the divestment of the fertilizer business, (ii) sale of investment in Tata Global
Beverages shares, (iii) internal accruals, and (iv) potential sale of investment in
group companies. Average free cash flow yield over FY19-20 is estimated at ~9%.
We initiate coverage with a
Buy
rating and a target price of INR940 –36% upside.
3 April 2018
4

Motherson Sumi
BSE SENSEX
33,255
S&P CNX
10,212
2 April 2018
Update
| Sector:
Automobiles
CMP: INR324
TP: INR437(+35%)
Buy
SMRPBV to acquire Reydel Auto for USD201m (2x EBITDA)
Complements SMP, strengthens presence in plastic parts business
Motherson Sumi’s (MSS) 51% subsidiary SMRPBV has entered into an
arrangement for the acquisition of Europe-based Reydel Automotive. Reydel is
engaged in the plastic parts business, and thus, should help MSS’ Samvardhana
Motherson Peguform (SMP) business to consolidate its position in this segment.
Key highlights:
SMRPBV has proposed to acquire a 100% stake in Reydel Automotive for
USD201m. This acquisition is structured under a Lockbox arrangement with
effect from 1
st
January 2017.
This stake would be bought from Cerberus Capital, a private equity player.
Reydel was carved out from Visteon and acquired by Cerberus in 2014.
Acquisition price of equity valued at USD201m implies EV/EBITDA of 2x CY17.
Reydel is a global supplier of instrument panels, door panels, console modules,
decorative parts and cockpit modules, with presence across the EU, South
America and Asia. It has 20 manufacturing facilities, with presence across 16
countries and ~5,650 employees.
For CY17, Reydel had revenues of USD1b, with an EBITDA margin of 6.5% and
an EBIT margin of 4.6%. It had net cash of ~USD63m as of December 2017.
Key customers are PSA, Renault, RSM, SsangYong/M&M, VW and GM. Post this
acquisition, no customer for MSS would account for more than 15% of
revenues.
This acquisition is highly synergistic with SMP’s business, with complementary
portfolio of products, customers and capabilities. Reydel only does interior
parts, whereas SMP also has a sizeable presence in exterior parts. It adds
manufacturing footprint for MSS in countries like the Philippines, Indonesia,
Croatia and Morocco.
It has carried forward losses (not quantified), which can be utilized by SMRPBV.
Reydel is a cash flow positive company, with capex funded via internal accruals.
It has very low net working capital requirement. It does not have any funded
pension liabilities, whereas unfunded pension liabilities stand at USD9m.
This is the second acquisition after MSS announced its 2020 targets. Both PKC
and Reydel would contribute ~USD2.5b revenues to the inorganic revenue
target of USD5.5-6b by FY20.
Valuation view:
We believe the Reydel acquisition is value accretive and a
good fit for MSS’ SMP/MATE business, as it adds new customers, countries and
capabilities. MSS offers strong visibility of earnings growth, along with
improving capital efficiencies. We await further financial details before
incorporating Reydel into our estimates. For MSS, we currently estimate
consol. revenue/EBITDA/PAT CAGR (FY17-20) of 25%/33%/31%. The stock
trades at 25.9x/18.6x FY19E/20E consol. EPS. Maintain
Buy
with a TP of
INR437, valuing 25x FY20E consol. EPS (in line with historical average).
5
Stock Info
Bloomberg
Equity Shares (m)
52-Week Range (INR)
1, 6, 12 Rel. Per (%)
M.Cap. (INR b)
M.Cap. (USD b)
Avg Val, INRm
Free float (%)
MSS IN
2,105
395 / 247
4/-10/18
682.6
10.5
1084.0
38.3
Financials Snapshot (INR b)
Y/E Mar
FY18E FY19E FY20E
Net Sales
571.2 683.2 825.6
EBITDA
51.7
74.7 100.1
PAT
17.0
26.3
36.8
EPS (INR)
8.1
12.5
17.5
Gr. (%)
5.0
54.7
39.6
BV/Sh (INR)
44.8
53.7
65.7
RoE (%)
19.2
25.4
29.3
RoCE (%)
11.8
17.4
21.5
P/E (x)
40.1
25.9
18.6
P/BV (x)
7.2
6.0
4.9
Shareholding pattern (%)
As On
Dec-17 Sep-17 Dec-16
Promoter
61.7
63.1
63.1
DII
8.4
7.6
6.8
FII
20.1
19.7
19.7
Others
9.7
9.6
10.4
FII Includes depository receipts
Stock Performance (1-year)
Motherson Sumi
Sensex - Rebased
390
340
290
240
3 April 2018

Sector Update | 3 April 2018
Financials
RBI allows spreading of MTM losses, mandates creation of IFR
FY19 IFR provision as percentage
Some relief for PSBs
FY19 PPoP
One
In view of the sharp increase in G-Sec yields since 3QFY18 and the corresponding MTM
third of
provision impact on banks, the Reserve Bank of India (RBI) has allowed banks to
IFR
IFR as a
INRb
at
spread their MTM provisions over a maximum of four quarters, beginning the quarter
% of
2%
FY19E
in which the loss was incurred. The 10-year G-Sec yields rose by 67bp in the December
PPOP
2017 quarter – the steepest quarterly increase in the last four years – leading to
Axis Bank
11
1.71
significant MTM losses for PSU banks, which have a higher proportion of AFS/HFT
State Bank
108
5.22
investments on their books compared to private banks (refer Exhibit 3).
Punjab Nat. Bank
17
3.38
The banks utilizing the option are required to make requisite disclosures (including the
Bank of Baroda
14
3.24
balance provisions to be made) in their notes to accounts.
Canara Bank
9
2.57
The RBI has further guided banks to create an Investment Fluctuation Reserve (IFR)
Union Bank
8
2.80
starting FY19, amounting to at least 2% of their total AFS and HFT portfolio, within
BOI
10
3.19
Indian Bank
7
4.25
three years, i.e., by the end of FY21. The IFR will be eligible for inclusion in tier-2
capital.
Impact of FY19 IFR provision on
Banks will be allowed to withdraw any amount in excess of the mandated 2% from
FY19 EPS (%)
their IFR for credit to the P&L account, but will be required to make disclosures for the
same in the notes to accounts. Drawdown from IFR where the balance is less than 2%
IFR
Impact
of AFS/HFT portfolio is allowed, subject to the following conditions:
INRb
at
on FY
2%
19E EPS
The drawn down amount is used only for meeting the minimum CET1/Tier1 capital
requirements.
Axis Bank
11
3.08
There is no surplus in the P&L carried forward into the next year.
State Bank
108
19.1
The amount drawn down is not more than the difference between MTM losses made
Punjab Nat. Bank
17
310.5
Bank of Baroda
14
12.5
during the year and the net profit on sale of investments during the year.
Canara Bank
9
10.6
Our view: This is a big positive for PSBs, for which AFS/HFT comprises ~35-40% of the
Union Bank
8
20.5
investment portfolio. PSU Banks have incurred huge MTM losses in 3QFY18 due to the
BOI
10
15.0
sharp increase in yields in the December quarter. As seen from our analysis in exhibit 4,
Indian Bank
7
7.7
FY19 provisioning requirement as a % of FY19 PPoP is the highest for SBI and INBK, while
EPS impact is the highest for PNB followed by UNBK and SBI. The RBI’s guideline on
creating IFR at 2% of the AFS and HFT category is a step in the right direction. We maintain
our positive stance on SBIN and BOB.
Exhibit 1:
10yr G-sec Yields have increased since Sept
Exhibit 2:
...and similar is the trend for 1yr G-sec Yield
8.0
7.0
6.0
5.0
’17…
8.3
7.5
6.8
6.0
Source: Company, MOSL
3 April 2018
6

2 April 2018
Telecom
Active SMS of smaller players
continues to fall (%)
Competitive intensity to persist in FY19
ARPU recovery merely delayed; retain Buy on Bharti and Idea
Since January 2018, telecom service providers have once again turned to market share
gains at the cost of profitability. The sector might continue to see aggressive pricing
for the next 12 months, leading to market share losses for the smaller players (15%
currently) as well as Vodafone-Idea until the merger settles down.
Bharti’s acquisition of TTSL and Telenor should provide INR33.8b EBITDA in FY20, a
much needed buffer to mitigate the impact of ARPU downtrading. Vodafone-Idea’s
INR200b cash infusion should help take care of FY19 capex, but beyond that, net debt
of INR1.2t and net-debt-to-EBITDA of ~11x might necessitate further cash infusion.
4G devices constitute ~20% of
total handsets (m)
Once the three large players – Bharti, Vodafone-Idea and RJio – have similar network
capability and financial wherewithal, focus should shift back to profitability. We now
expect this to happen only in FY20, later than we had believed earlier.
3g
113
4g
150
We cut our FY20 India wireless EBITDA estimates by 12% for Bharti and by 9% for Idea.
We expect consolidated EBITDA to grow 1% for Bharti and -14% for Vodafone-Idea in
FY19, and recover to 18% and 72%, respectively in FY20.
We maintain Buy on both Bharti and Idea, but cut our target prices. Our target price is
now INR581 (v/s INR680 earlier) for Bharti and INR91 (v/s INR120 earlier) for Idea. As
recovery sets in in the next 3-4 quarters, strong FCF growth should re-rate the stocks.
2g
496
Competitive intensity delays our recovery expectation to FY20
Prioritizing market share over profitability, telcos reversed their ARPU accretion
measures in January 2018, delaying market recovery. In the next 12 months, the
large players (Bharti, Vodafone-Idea and RJio) could continue pricing aggressively to
attract marooned subscribers from TTSL, Telenor, RCom and Aircel.
Jiophone impact likely for next 2-3 quarters
We expect RJio’s Jiophone to target at least 10% share of the 500 feature phone
market in the next 6-8 months, implying monthly subscriber additions of 6m-8m.
However, preference for smartphones even at ~50% higher device price should cap
the long-term impact of Jiophone. Further, the recent aggressive plans are priced
25-30% below data subscribers’ ARPU. However, the marginal utility of subscriber
shift due to lower price plans is diminishing, given the perceived short-term
phenomenon of such discounts. This should limit the downtrading to the next 2-3
quarters.
Bharti and Vodafone-Idea retain subscriber market share, though
revenue/EBITDA impacted
While they have cumulatively lost ~30% in revenue since the launch of RJio, Bharti
and Vodafone-Idea's focus has been to arrest subscriber churn and gain market
share. Bharti has gained 470bp active subscriber market share in the last 10 months,
while Vodafone-Idea reversed active subscriber market share loss in October,
gaining 200bp in the last three months.
3 April 2018
7

ARPU recovery delayed, but definite
Over the next 12 months, as the smaller players are edged out and the Vodafone-
Idea network integration is completed, the flux should settle. The industry would be
left with three large players – Bharti, Vodafone-Idea and RJio. Each would have
strong network capabilities and financial wherewithal to match any undercutting
measures by peers. This, we believe, would trigger ARPU accretion instead of price
undercutting.
Bharti – acquisition to cushion impact of high competition
Bharti's completion of TTSL and Telenor acquisition by 1HFY19 should cushion the
impact of recent low ARPU plans. Including the contribution from the merger, our
India wireless EBITDA estimates stand at INR134.7b for FY19 (a 11% decline) and
INR173.5b for FY20 (a 29% growth), contributing 45% and 49%, respectively of
overall EBITDA.
Vodafone-Idea – cash position vulnerable beyond FY19
Vodafone-Idea’s overall fund raising net of INR90b integration cost is ~INR200b,
which includes (a) equity of INR130b, (b) tower sale of INR80b, (c) Indus stake sale.
This should provide at least enough cash to fund heavy capex in FY19. However,
beyond FY19, market recovery holds the key for cash requirement for capex and
fighting competition. This could be a risky proposition in the situation where peers
continue to keep ARPUs depressed to hurt Vodafone-Idea’s cash generation
potential. The key silver lining is the merger synergies, which could drive INR188b
EBITDA in FY20.
Cutting estimates
Our market recovery expectation is delayed to FY20. We cut our FY20 India wireless
revenue/EBITDA estimates by 4%/12% for Bharti and cut our consolidated
revenue/EBITDA estimates by 10%/9% for Idea. We expect Bharti's consolidated
EBITDA to grow 1% in FY19 and 18% in FY20, cushioned by acquisition, Africa
business and non-wireless India business. We expect Vodafone-Idea's combined
EBITDA to decline 14% in FY19, but grow 72% in FY20, driven by market recovery
and synergy gains.
Retain thesis of high FCF play; maintain Buy
Our key investment thesis remains that the Indian telecom sector can be a high FCF
play, as market recovers and capex peaks out. We maintain Buy on both Bharti and
Idea, but cut our target prices. Our target price is now INR581 (v/s INR680 earlier)
for Bharti and INR91 (v/s INR120 earlier) for Idea. As recovery sets in in the next 3-4
quarters, strong FCF growth should re-rate the stocks.
3 April 2018
8

E
CO
S
COPE
2Q 2018: India’s Quarterly Economic Outlook
Growth forecasts revised up, inflation forecast lowered
2 April 2018
The Economy Observer
Taking into consideration the additional data released in the past quarter, we have revised up our real GVA growth
forecast for both FY18 and FY19 by 30bp to 6.4% and 6.7%, respectively. Inflation, however, is expected to average
4.4% in FY19, much lower than 5.1% estimated earlier.
Our macroeconomic forecasts for the Indian economy are based on a) impact of growing trade protectionism on the
US (and global) economic/trade recovery, b) impact of the possible ~25% hike in the minimum support price (MSP) of
Kharif crops as the government looks to fulfill its promise of at least 1.5x cost as MSP (based on A2+FL) and c)
confirmation from state budgets of 2018-19 that the fiscal support to economic activity has peaked in FY17 and is set
to weaken further in FY19. We have discussed these three themes in this note.
What has changed since the
January 2018
Quarterly Economic Update?
Real sector:
Driven by better-than-expected 3QFY18 data and revisions in previous
quarters’ data, we expect real GVA/GDP to grow 6.4%/6.7% in FY18, better than
previously expected. Furthermore, real GDP is expected to grow 6.9%/7.2% in
FY19/FY20, slightly better/worse than 6.8%/7.4% expected previously.
CPI inflation:
With CPI consistently coming in below our expectations, we have
revised down our FY19/FY20 forecast from 5.1%/4.7% to 4.4%/4.5%. We, however,
continue to expect a prolonged pause from the Reserve Bank of India (RBI).
External sector and exchange rate:
India’s trade deficit has been higher than
expected in the recent past, resulting in a higher current account deficit (CAD) in
3QFY18. Consequently, our FY18/FY19 CAD projections are revised up from
1.4%/1.5% of GDP to 1.7%. Consequently, our REER-based model suggests that the
Indian Rupee (INR) could weaken 2.5% in FY19, which is partly based on its recent
weakness against all major currencies. This is higher than the 1.4% depreciation
expected earlier.
Exhibit 1: Forecasts of key macroeconomic variables for the Indian economy
Actual data
Macro indicators
Nominal GDP
MP
Real GDP
MP
Real GVA
BP
Consumer price index (CPI)
Policy repo rate (year-end)
INRUSD (average)
Current account balance
Fiscal balance
Unit
% YoY
% YoY
% YoY
% YoY
% pa
unit
% of GDP
% of GDP
FY16
10.4
8.2
8.1
4.9
6.75
65.5
(1.1)
(3.9)
FY17
10.8
7.1
7.1
4.5
6.25
67.1
(0.7)
(3.5)
Revised Apr’18 forecasts
FY18F
11.3
6.7
6.4
3.6
6.00
64.4
(1.7)
(3.5)
FY19F
11.6
6.9
6.7
4.4
6.00
66.0
(1.7)
(3.3)
FY20F
12.3
7.2
7.0
4.5
6.00
67.7
(1.7)
(3.1)
Previous Jan’18 forecasts
FY18F
10.0
6.3
6.0
3.8
6.00
64.6
(1.4)
(3.5)
FY19F
11.4
6.8
6.4
5.1
6.00
65.5
(1.5)
(3.2)
FY20F
11.9
7.4
7.0
4.7
6.00
65.7
(1.8)
(3.0)
Source: Various national sources, MOSL
3 April 2018
9

Shilpa Medicare
BSE SENSEX
32,969
S&P CNX
10,114
2 April 2018
Update
| Sector:
Healthcare
CMP: INR465
TP: INR686(+47%)
Buy
Stake sale to mark end of JV with ICE
CRAMS business with ICE will also be lowered
Stock Info
Bloomberg
Equity Shares (m)
52-Week Range (INR)
1, 6, 12 Rel. Per (%)
M.Cap. (INR b)
M.Cap. (USD b)
Avg Val, INRm
Free float (%)
SLPA IN
80
749 / 401
7/-22/-38
36.9
0.6
30.0
46.2
Financials Snapshot (INR b)
FY18E FY19E FY20E
Y/E Mar
7.8
9.5
11.6
Net Sales
1.7
2.3
2.9
EBITDA
1.1
1.9
2.5
PAT
13.3 24.3
30.6
EPS (INR)
-5.0 82.4
25.9
Gr. (%)
127.0 152.9 181.9
BV/Sh (INR)
11.0 17.4
18.3
RoE (%)
8.4 13.5
15.2
RoCE (%)
34.9 19.1
15.2
P/E (x)
3.7
3.0
2.6
P/BV (x)
Shareholding pattern (%)
As On
Dec-17 Sep-17 Dec-16
Promoter
53.8
54.7
54.7
DII
13.1
13.2
7.6
FII
18.7
18.9
18.5
Others
14.4
13.2
19.1
FII Includes depository receipts
Stock Performance (1-year)
Shilpa Medicare
Sensex - Rebased
800
700
600
500
400
Shilpa Medicare (SLPA) recently decided to end its joint venture (JV) with ICE S.P.A
Italy (ICE) – a move that would help it garner proceeds of INR1.3b, as against its
investment of INR800m toward the JV. Furthermore, the amount of annual business
with ICE via CRAMS may be reduced by ~INR500m. The decision was premised on the
increasing uncertainty over the profitability of the JV.
Accordingly, for FY19/FY20, we reduce our (i) sales estimate by 5% to
INR10b/INR12b and (ii) earnings estimate by 8.5% to INR2.1b/INR2.7b.
Consequently, our price target is lowered to INR686 (25x 12M forward earnings).
We, however, remain positive on SLPA and re-iterate our Buy rating, given the
promising outlook for the US formulations business (31 ANDAs pending for approval)
and minimal medium-term regulatory risk.
Rising uncertainty prompts SLPA to sell stake in JV
The Raichem Medicare JV (between SLPA and ICE) has been incurring losses over
the past two years and the outlook, too, remains uncertain. Consequently, SLPA
has decided to sell its stake in Raichem Medicare to ICE for a consideration of
USD20.2m (INR1.3b). The total investment toward the JV till date by SLPA was
~INR800m. The stake sale is expected to conclude by 31
st
October 2018.
Furthermore, the amount of annual business with ICE via CRAMS may be reduced
by ~INR500m .
Change in estimates
For FY19/FY20, we reduce our (i) sales estimates by 5% to INR10b/INR12b and (ii)
earnings estimate by 8.5% to INR2.1b/INR2.7b to factor in the loss of business, and
subsequently, the reduced profitability from both the contract manufacturing
business and the JV. We have also factored in interest income from funds released
post the stake sale. Accordingly, we lower our price target to INR686 (from
INR749), valuing SLPA at 25x 12M forward earnings.
Valuation and view
We remain positive on SLPA on the back of its robust product pipeline for the US
market and stable API business. The company has a healthy oncology portfolio,
with 31 ANDAs pending for approval. In our view, approvals and subsequent
launches would be the key growth drivers for SLPA over the next 2-3 years. We
expect a CAGR (FY17-20) of 14% in sales to INR12b and 30% in PAT to INR2.5b. Re-
iterate
Buy.
3 April 2018
10

Sector Update| 2 April 2018
Automobiles
Mahindra & Mahindra
CMP: INR748
Stock Info
Bloomberg
Equity Shares (m)
M.Cap.(INR b)/(USD b)
52-Week Range (INR)
1, 6, 12 Rel.Per (%)
MM IN
592.6
887.6/13.6
803 / 613
4/13/4
TP: INR943(+26%)
Buy
Wholesales of 90.4k units exceed estimate of 81.1k
UV volumes up 9.6% YoY; Tractor volumes up 46.2% YoY
MM’s volumes grew 19.9% YoY to 90.4k units (est. of 81.1k units) in Mar-18.
Tractors sales increased 46.2% YoY to 28.3k units (est. of 22k), led by a 50% increase in
domestic volumes, while exports declined 3% YoY.
UV sales (incl. pick-ups) stood at 53k units (+9.6% YoY), above estimate of 51k units.
Momentum in pick-ups continued with 13% YoY growth, while passenger utility
vehicles reported growth of 3% YoY.
LCV (>3.5t) and M&HCV sales declined by ~3% YoY and ~6% YoY, respectively.
3W volumes increased ~30% YoY to 6.6k units (est. of 5.3k units).
Speaking on the monthly performance, Rajan Wadhera, President, Automotive Sector,
M&M Ltd. said, “We are particularly buoyed by the growth of our truck business,
which has outperformed the industry. With three of our critical new automotive
launches lined up in FY19, we are confident of increasing our market share in the
utility vehicle space.”
The stock trades at 18x/15.9x FY19E/20E. Maintain Buy.
Financials Snapshot(INR b)
Y/E MARCH 2018E 2019E 2020E
Sales
488.9 551.4 611.6
EBITDA
61.7 70.6
79.8
NP*
43.9 49.2
55.9
Adj.EPS(INR)* 37.0 41.5
47.1
EPS Gr. (%)
17.4 12.1
13.5
Cons.EPS(INR) 39.8 46.2
51.0
BV/Sh. (INR)
243
273
307
RoE (%)
15.2 15.1
15.3
RoCE (%)
14.0 14.1
14.4
Valuations
P/E (x)
20.2 18.0
15.9
P/BV (x)
3.1
2.7
2.4
EV/EBITDA (x) 13.9 11.9
9.0
*incl. MVML
Snapshot of volumes for Mar-18
YoY
Company Sales
Mahindra & Mahindra
UV (incl. pick-ups)
LCV
Three-Wheelers
Tractors
Mar-18
90,354
53,032
2,443
6,602
28,277
Mar-17
75,368
48,395
2,574
5,062
19,337
YoY (%)
chg
19.9
9.6
-5.1
30.4
46.2
MoM
MoM (%)
Feb-18
chg
71,610
26.2
44,268
19.8
1,721
42.0
5,138
28.5
20,483
38.1
FY18YTD FY17YTD (%) chg
866,537
477,300
17,229
54,625
317,383
769,915
440,274
14,343
52,306
262,992
12.5
8.4
20.1
4.4
20.7
FY18
estimate
866,537
477,300
17,229
54,625
317,383
FY18 YTD
Monthly
Gr. (%)
Run rate
22.4
72,211
9.1
39,775
20.1
1,436
4.4
4,552
20.7
26,449
3 April 2018
11

Bajaj Auto
Stock Info
Bloomberg
Equity Shares (m)
M.Cap. (INR b) / (USD b)
52-Week Range (INR)
1, 6, 12 Rel. Per (%)
CMP: INR2,809
BJAUT IN
289.4
812.7/12.5
3473 / 2695
-5/-17/-12
TP: INR3,550 (+26%)
Buy
Mar-18 dispatches of 334.3k units miss estimate of 348k
Domestic volumes of 204k units below est. of 218k; exports in line
BJAUT’s Mar-18 sales increased 22.8% YoY to 334.3k units, below our estimate of
347.6k units.
Domestic volumes of 203.6k units missed our estimate of 218.4k units, while exports
came in line at 130.7k units. Domestic volumes grew 20.3% YoY, while exports rose
27% YoY.
Overall motorcycle volumes increased 10.5% YoY. Domestic motorcycle dispatches
increased ~5% YoY to 159k units. Motorcycle exports grew ~20% YoY to 111k units.
3W volumes remained strong, with overall growth of 130% YoY. Domestic 3W volumes
maintained the positive momentum, growing 150% YoY to 44.6k units. 3W exports
grew 95% YoY to 19.8k units. This marks highest-ever 3W monthly volume for BJAUT.
For FY18, volumes grew 9.3% to ~4m units.
The stock trades at 16.7x/14.2x FY19E/20E consol. EPS. Maintain Buy.
Financial & Valuation (INR b)
Y/E MARCH
2018E 2019E 2020E
Sales
251
275
310
EBITDA
47.4 53.2 62.9
Consol. NP
42.8 48.6 57.1
ConsEPS(INR)
148
168
197
EPS Gr. (%)
4.8 13.5 17.5
BV/Sh. (INR)
649
717
802
RoE (%)
23.9 24.6 26.0
RoCE (%)
21.6 22.5 33.0
Payout (%)
52.0 51.8 50.7
Valuation
P/E (x)
19.0 16.7 14.2
P/BV (x)
4.3
3.9
3.5
EV/EBITDA (x)
13.9 12.1
9.9
Div. Yield (%)
2.3
2.7
3.0
Snapshot of volumes for Mar-18
YoY
Company Sales
Bajaj Auto
Motorcycles
Three-Wheelers
Domestic
Exports
Mar-18
334,348
269,939
64,409
203,600
130,748
Mar-17
272,197
244,235
27,962
169,279
102,918
MoM
MoM (%)
YoY (%)
Feb-18
chg
chg
22.8
357,883
-6.6
10.5
297,514
-9.3
130.3
60,369
6.7
20.3
214,023
-4.9
27.0
143,860
-9.1
FY18YTD
4,006,791
3,369,334
637,457
2,344,214
1,662,577
FY17YTD (%) chg
3,665,864
3,219,932
445,932
2,254,617
1,411,247
9.3
4.6
42.9
4.0
17.8
FY18
estimate
4,006,791
3,369,334
637,457
2,344,214
1,662,577
FY18 YTD
Monthly
Gr. (%)
Run rate
9.3
333,899
4.6
280,778
42.9
53,121
4
195,351
17.8
138,548
3 April 2018
12

Hero MotoCorp
CMP: INR3,641
Stock Info
Bloomberg
Equity Shares (m)
M.Cap.(INR b)/ (USDb)
52-Week Range (INR)
1, 6, 12 Rel. Per (%)
HMCL IN
199.7
727.0/11.2
4200 / 3180
4/-10/1
TP: INR4,027(+11%)
Neutral
Volumes up 20% YoY to 730.5k, above estimate of 667.6k
HMCL records highest-ever monthly volumes in Mar-18
HMCL’s Mar-18 volumes grew 20% YoY to 730,473 units, above our estimate of 667.6k.
With this, it recorded highest-ever monthly volumes in Mar-18.
For FY18, volumes grew 13.8% YoY to ~7.58m units.
It has lined up a slew of new launches for FY19, with four new products in the
premium motorcycle and scooter categories – Xtreme 200R and XPulse in motorcycles
and Duet 125 and Maestro Edge 125 in scooters.
HMCL trades at 18.1/16.9x FY19E/20E EPS. Maintain Neutral.
Financials Snapshot (INR b)
Y/E MARCH
2018E 2019E
Sales
322.1 356.2
EBITDA
53.4 57.3
NP
37.2 40.1
Adj. EPS (INR) 186.1 201.0
EPS Gr. (%)
10.0
8.0
BV/Sh. (INR)
584.0 670.5
RoE (%)
34.1 32.0
RoCE (%)
32.9 31.1
Valuations
P/E (x)
19.6 18.1
P/BV (x)
6.2
5.4
EV/EBITDA (x)
12.1 11.1
Div. Yield (%)
2.5
2.6
2020E
390.1
61.5
43.0
214.9
6.9
757.2
30.1
29.3
16.9
4.8
10.2
2.9
Snapshot of volumes for Mar-18
Company Sales
Hero MotoCorp
Mar-18
730,473
MoM
YoY (%)
MoM (%)
FY18
Mar-17
FY18YTD FY17YTD (%) chg
Feb-18
chg
chg
estimate
609,951
19.8
629,597 16.0 7,582,857 6,663,903 13.8 7,582,856
YoY
FY18 YTD
Monthly
Gr. (%)
Run rate
13.8
631,905
3 April 2018
13

Eicher Motors
CMP: INR28,301
Stock Info
Bloomberg
EIM IN
Equity Shares (m)
27.2
M.Cap.(INR b)/(USD b)
770.1/11.5
52-Week Range (INR) 33484/25316
1, 6, 12 Rel.Per (%)
4/-15/-2
Financials Snapshot(INR b)
Y/E MARCH 2018E 2019E 2020E
Net Income
89.3 107.7 129.4
EBITDA
28.4
35.1
43.9
Net Profit
19.8
28.2
35.9
Adj. EPS (INR) 727.9 1,036.8 1,318.3
EPS Gr. (%)
18.0
42.4
27.2
BV/Sh. (INR) 2,512 3,348 4,436
RoE (%)
32.5
35.4
33.9
RoCE (%)
31.5
30.8
30.7
Payout (%)
0.5
0.6
0.7
Valuations
P/E (x)
38.9
27.3
21.5
P/BV (x)
11.3
8.5
6.4
EV/EBITDA (x) 21.3
17.1
13.4
TP: INR34,485 (+22%)
Buy
VECV Mar-18 wholesales of 9.4k units exceed estimate
VECV’s volumes grow 28.4% in Mar-18.
VECV Mar-18 volumes of 9,411 units were above our estimate of 8.1k units.
Domestic LMD and HD segments grew 50.9% YoY and 26.4% YoY, respectively. Buses
volume declined 20% YoY.
VECV exports grew ~87% YoY to 1,265 units (above est. of 1,053 units).
For FY18, VECV’s volumes grew 12.5% to ~65.9k units.
The stock trades at 27.3x/21.5x FY19E/20E consol. EPS. Maintain Buy.
Snapshot of volumes for Mar-18
YoY
Company Sales
VECV
Domestic LMD
Domestic HD
Domestic Buses
VTI
Total Domestic
Exports
Mar-18
9,411
4,447
2,080
1,453
166
8,146
1,265
Mar-17
7,327
2,947
1,646
1,817
239
6,649
678
YoY (%)
chg
28.4
50.9
26.4
-20.0
-30.5
22.5
86.6
MoM
MoM (%)
Feb-18
chg
6,889
36.6
3,594
23.7
1,345
54.6
844
72.2
93
78.5
5,876
38.6
1,013
24.9
FY18YTD FY17YTD (%) chg
65,928
33,006
12,372
10,494
1,055
56,927
9,001
58,604
26,027
11,109
12,270
1,163
50,569
8,035
12.5
26.8
11.4
-14.5
-9.3
12.6
12.0
FY18
estimate
65,928
33,006
12,372
10,494
1,055
56,927
9,001
FY18 YTD
Monthly
Gr. (%)
Run rate
12.5
5,494
26.8
2,751
11.4
1,031
-14.5
875
0.0
88
12.6
4,744
12.0
750
3 April 2018
14

Ashok Leyland
CMP: INR148
Stock Info
Bloomberg
Equity Shares (m)
M.Cap.(INR b)/ (USDb)
52-Week Range (INR)
1, 6, 12 Rel.Per (%)
AL IN
2,845.9
433.4/6.6
152 / 81
8/16/63
TP: INR179 (+21%)
Buy
Dispatches of 22.5k units above estimate of 21k units
MHCVs grew 11.7% YoY, while LCVs rose 57.6% YoY
AL’s Mar-18 wholesale dispatches grew 20% YoY to 22.5k units, above our estimate of
21k.
M&HCV volumes, which account for 76% of total volumes, grew 11.7% YoY (+24.3%
MoM) to 17.1k units (est. of 16.2k units).
LCVs (Dost) grew 57.6% YoY to 5.4k units (est. of 4.8k units).
For FY18, AL volumes grew 20.5% to ~174.8k units.
The stock trades at 20.5x/16.1x FY19E/20E EPS, and at 11.3x/8.8x EV/EBITDA.
Maintain Buy.
Financials Snapshot(INR b)
Y/E MARCH
2018E 2019E 2020E
Sales
260.4 308.0 360.6
EBITDA
28.4 35.6
42.8
NP
15.9 21.2
26.9
Adj. EPS (INR)
5.4
7.2
9.2
EPS Gr. (%)
28.8 33.1
27.1
BV/Sh. (INR)
23.9 28.5
34.7
RoE (%)
24.3 27.6
29.2
RoCE (%)
20.3 23.3
25.2
Valuations
P/E (x)
27.2 20.5
16.1
P/BV (x)
6.2
5.2
4.3
EV/EBITDA (x)
14.8 11.3
8.8
Div. Yield (%)
1.4
1.5
1.7
Snapshot of volumes for Mar-18
YoY
Company Sales
Ashok Leyland
CV (ex LCV)
LCV
Mar-18
22,453
17,057
5,396
Mar-17
18,701
15,277
3,424
YoY (%)
chg
20.1
11.7
57.6
MoM
MoM (%)
Feb-18
chg
18,181
23.5
13,726
24.3
4,455
21.1
FY18YTD FY17YTD (%) chg
174,831
131,390
43,441
145,084
113,314
31,770
20.5
16.0
37
FY18
estimate
174,831
131,390
43,441
FY18 YTD
Monthly
Gr. (%)
Run rate
20.5
14,569
16.0
10,949
36.7
3,620
3 April 2018
15

TVS Motor
CMP: INR 662
Stock Info
Bloomberg
Equity Shares (m)
M.Cap.(INR b)/ (USDb)
52-Week Range (INR)
1, 6, 12 Rel.Per (%)
TVSL IN
475.1
314.7/4.8
795 / 430
0/-4/41
TP: INR723 (9%)
Neutral
Mar-18 wholesales up 28.1% YoY to 326.7k units
Domestic sales grew by 22.6% YoY; exports up 60.4% YoY
Wholesales of 326.7k units (+28.1% YoY) were above our estimate of 310k.
Domestic volumes grew 22.6% YoY, while exports (18% of volumes) rose 60.4% YoY.
Motorcycle volumes grew 42.4% YoY to 134.4k units (est. 121.4k units).
Scooter volumes increased 20% YoY to 101k units (est. of 103k units).
Moped dispatches rose 13% YoY to 80.4k units (est. 75.8k units).
3W volumes increased 103.2% YoY, with growth across domestic and export sales.
For FY18, volumes grew 18.6% to ~3.47m units.
The stock trades at 27.3x/20.1x FY19E/20E EPS. Maintain Neutral.
Financials Snapshot (INR b)
Y/E MARCH
2018E 2019E 2020E
Sales
151.1 188.2 225.9
EBITDA
11.7 19.1
25.0
Adj. PAT
6.7 11.5
15.7
EPS (INR)
14.1 24.3
33.0
EPS Gr. (%)
20.4 71.8
35.8
BV/Sh (INR)
61.2 80.7 107.7
RoE (%)
25.3 34.2
35.0
RoCE (%)
25.6 36.8
41.3
Payout (%)
25.5 19.8
18.2
Valuations
P/E (x)
46.8 27.3
20.1
P/BV (x)
10.8
8.2
6.2
EV/EBITDA (x)
27.7 16.7
12.5
Div. Yield (%)
0.5
0.6
0.8
Snapshot of volumes for Mar-18
Company Sales
TVS Motor
Motorcycles
Scooters
Mopeds
Three-Wheelers
Total Domestic
Total Exports
Mar-18
326,659
134,412
100,972
80,381
10,894
267,031
59,628
MoM
YoY
MoM
Mar-17
Feb-18
(%) chg
(%) chg
255,043
28.1
290,673
12.4
94,373
42.4
113,296
18.6
84,173
20.0
93,573
7.9
71,135
13.0
74,073
8.5
5,362
103.2
9,731
12.0
217,879
22.6
232,109
15.0
37,164
60.4
58,564
1.8
YoY
FY18YTD
FY17YTD (%) chg
18.6
26.0
30.4
-3.4
42.5
15.7
35.5
FY18
estimate
3,466,110
1,355,576
1,134,918
876,932
98,684
2,891,895
574,215
FY18 YTD
Monthly
Gr. (%)
Run rate
18.6
288,843
26.4
112,965
30.3
94,577
-3.7
73,078
42.5
8,224
15.7
240,991
34.9
47,851
3,466,110 2,922,660
1,355,576 1,075,788
1,134,918 870,099
876,932
907,519
98,684
69,254
2,891,895 2,498,999
574,215
423,661
3 April 2018
16

In conversation
1. VIDEOCON GROUP : Have not given Rs 64 Cr to any company or
individual; Venugopal Dhoot, Chairman
Company has not given any Rs 64 crore investment in NuPower Renewables Pvt
Ltd.
Had some Rs 50,000 investment in Supreme Energy - have sold whatever shares
of Supreme Energy were owned. Not involved in Supreme Energy.
Regarding Tuskar being given Rs 660 crore loan by ICICI Bank, this loan was not
given when Chanda Kochhar was Managing Director. Rs 660 crore loan was
given to foreign company in 2006 and it was written back in 2010 with interest
without default. A show-cause notice was issued by Foreign Exchange
Management Act (FEMA) to company and was replied to properly. FEMA said
that there is no violation. This should not be linked to Tuskar matter.
Company has no investment in Deepak Kochhar’s company today.
2. HAL : Government has no intention of infusing funds in
company; T Suvarna Raju, Chairman & MD
No intentions of any infusion of funds into the company because all
developmental programmes are going good.
Spend on an average of between 6 and 7 percent of turnover on research and
development (R&D). Trend would be same for the next few years to come.
Revenue growth has been dull in H1FY18. Deliveries will happen of booked sales
in Q3 and Q4. Expect a revenue growth of over 10%.
3. TEJAS NETWORKS : Wins order from BSNL for Bharatnet;
Sanjay Nayak, MD & CEO
This order is for BharatNet project. Part of it will be completing of the additional
stuff on phase-I and part of the order is for the phase-II. Do expect to have lot
more orders during the next fiscal.
This order should get executed in the next one-two quarters because the project
is on fast track because the government wants to get this BharatNet phase-II off
the blocks very quickly.
Continue to see healthy margins on this order.
Phase-2 Bharat Net Orders would be worth 3000-4000 crores. Got orders for
47,000 villages in Bharat Net 1 worth INR 1300-1400 crores. Will compete with
MNCs in Phase 2 of BharatNet.
3 April 2018
17

From the think tank
1. Crediting India’s credit information companies
The perception of India’s banking system is at an all-time low. Glitterati
international fugitives, ponzi schemes built on the back of a creaky international
transfer system, a regulator with self-confessed lack of teeth, newspaper exposes,
rumours and innuendos are all contributing grist to this bleak mill. This dark
picture is the result of misuse and abuse by a cosy coterie of “corpocrats” working
hand-in-glove with pliant bank boards and executives, sometimes with a political
nudge, to create one big bad-loan mess. Households have remained largely
untouched by this not only because India’s household credit penetration is low—
retail loans by scheduled banks make up only 11% of gross domestic product
(GDP)—but also because of a relatively new set of institutions—India’s credit
bureaus—that have functioned behind the scenes to mitigate problems in this
sector. There are four of them today, and over the last few years they have been
making remarkable strides in covering a greater and greater proportion of India’s
households.
2. Execution key for defence manufacturing in India
Defexpo 2018, the biennial defence exhibition, will be held at Chennai from 11-
14 April. It has been nearly four years since the Make in India initiative was
announced by Prime Minister Narendra Modi. Fundamentally, the initiative is
meant to enhance manufacturing, attract investments, create jobs and increase
technical depth. But for defence, there is the added criticality of achieving self-
reliance for security. The intensity and complexity of security challenges is
increasing due to the nexus between China and Pakistan. With infrastructural
improvements in Tibet, belligerence on the Line of Actual Control has increased.
China’s military engagements with South Asian and Indian Ocean region states
have been increasing. There is a continuing endeavour by Pakistan to push the
envelope of proxy war. Faced with such security threats, India cannot afford to
be 60-70% import-dependent for defence. Furthermore, the international
community expects India to be a net provider of security in the Indian Ocean
region.
3. Putting electric vehicles before the policy cart
A WhatsApp message currently being circulated explains in great detail why global
investors prefer to invest in China rather than India. The message does cut close
to the bone despite its questionable provenance or authenticity. Far from social
media, there are many real-life case studies which illustrate, in much sharper
relief, India’s famously unpredictable policy environment. A fitting example is
perhaps the current government’s policy trajectory for electric mobility which has
left the Indian automotive industry more confused and uncertain than earlier. It is
instructive to map its policy arc to understand the mechanics of Indian
policymaking. Formal efforts to introduce electric mobility in India began in 2013
with the National Electric Mobility Mission Plan (NEMMP), which envisaged a
manufacturing focus that could put 6-7 million electric/hybrid vehicles on the road
by 2020.
3 April 2018
18

4. India must be practical in managing its trade policies
Rumblings of trade wars, cyber invasions of countries, and mass expulsions of
diplomats mark the end of the Panglossian, “world is flat”, view of globalization.
Social media is in the dock. The World Trade Organization (WTO) is in the
intensive care unit. Economists bravely defending theoretical benefits of free
trade are on the back foot. The Indian government is hard pressed to create
more jobs and sustainable livelihoods. Chinese products are flowing into the
country, providing good value for consumers no doubt, but also killing Indian
enterprises and jobs they provide. When the going gets tough, the tough must
get going. “Make in India” will remain a slogan if both, the Indian government
and Indian entrepreneurs, don’t step up to their challenges. M.K. Gandhi said
that when he was fighting for India’s political freedom, Jamsetji Tata was
fighting for India’s economic freedom. Tata put up a modern, integrated steel
plant against great resistance from the British government. However, he was
determined that India must have industrial capabilities. He turned to American
consultants for technological guidance, and to Indian citizens for financial
support when the London market turned him away. After India’s independence,
its industrial policy nurtured the growth of capabilities within the country.
Foreign companies were welcomed to partner with Indian enterprises. Phased
manufacturing programmes were mandated, whereby, progressively complex
products were made entirely within the country.
International
5. Should tech companies be more tightly regulated?
In the wake of recent high-profile tech scares, such as a fatality involving an
Uber self-driving car and Facebook’s alleged mishandling of users’ personal
data, stricter regulation of the industry – along the lines of, say, the financial
sector – has become the policy question du jour. Stock-market values for leading
tech companies are down – or perhaps just becoming more volatile – in the light
of such concerns. Obviously, rules regarding motor vehicles need to be
examined carefully. In the United States, this is generally a state-level decision,
though the federal National Transportation Safety Board has a very good
reputation for its investigations and often changes how we think about best
practices. The NTSB is investigating the Uber crash and previously assessed a
fatality involving a Tesla vehicle. As for Facebook, press reports suggest that the
company may have made some egregious mistakes. One hopes we will learn
more about the details of its decision-making on data privacy when its chairman
and CEO, Mark Zuckerberg, testifies before Congress, as he has agreed to do.
3 April 2018
19

Click excel icon
for detailed
valuation guide
CMP
(INR)
811
148
2809
721
18556
1541
28301
1261
883
229
3641
748
215
9009
324
339
662
Valuation snapshot
Company
Automobiles
Amara Raja
Ashok Ley.
Bajaj Auto
Bharat Forge
Bosch
CEAT
Eicher Mot.
Endurance Tech.
Escorts
Exide Ind
Hero Moto
M&M
Mahindra CIE
Maruti Suzuki
Motherson Sumi
Tata Motors
TVS Motor
Aggregate
Banks - Private
AU Small Finance
Axis Bank
DCB Bank
Equitas Hold.
Federal Bank
HDFC Bank
ICICI Bank
IDFC Bank
IndusInd
J&K Bank
Kotak Mah. Bk
RBL Bank
South Indian
Yes Bank
Aggregate
Banks - PSU
BOB
BOI
Canara
Indian Bk
PNB
SBI
Union Bk
Aggregate
NBFCs
Aditya Birla Cap
Bajaj Fin.
Capital First
Cholaman.Inv.&Fn
Dewan Hsg.
GRUH Fin.
HDFC
HDFC Stand. Life
Indiabulls Hsg
L&T Fin Holdings
Reco
Buy
Buy
Buy
Buy
Neutral
Buy
Buy
Buy
Sell
Buy
Neutral
Buy
Buy
Buy
Buy
Buy
Neutral
% Upside
TP
EPS (INR)
EPS Gr. YoY (%)
P/E (x)
P/B (x)
ROE (%)
(INR)
Downside
FY18E FY19E FY20E FY18E FY19E FY20E FY18E FY19E FY18E FY19E FY18E FY19E
1000
158
4031
880
21951
1899
34764
1540
714
286
3986
889
303
10972
437
515
741
23
7
44
22
18
23
23
22
-19
25
9
19
41
22
35
52
12
28.3
5.1
148.6
20.2
459.1
63.1
722.7
27.9
36.6
8.0
184.0
39.1
9.6
275.1
8.1
25.3
14.1
34.0
6.4
174.0
26.8
595.2
84.7
1,036
38.2
45.6
9.9
198.6
45.5
12.0
369.7
12.5
54.6
24.3
40.0
7.9
201.7
35.2
731.7
111.7
1,317
51.0
54.9
12.1
212.3
50.2
14.8
470.9
17.5
54.9
32.9
0.9
20.5
5.3
54.2
-3.0
-32.3
17.2
18.8
90.4
-1.3
8.8
42.9
107.8
10.6
5.0
27.8
19.7
17.2
20.3
26.0
17.1
32.7
29.6
34.1
43.3
37.0
24.3
23.3
7.9
16.3
25.0
34.4
54.7
115.6
72.6
46.3
17.6
23.4
15.9
31.5
22.9
31.9
27.2
33.5
20.6
22.6
6.9
10.2
23.1
27.4
39.6
0.5
35.8
15.4
28.7
29.1
18.9
35.7
40.4
24.4
39.2
45.2
24.1
28.6
19.8
19.1
22.4
32.8
40.1
13.4
47.1
24.8
23.8
23.1
16.1
26.9
31.2
18.2
27.3
33.0
19.4
23.2
18.3
16.4
17.9
24.4
25.9
6.2
27.3
17.0
42.0
16.4
18.4
20.9
13.2
23.6
16.7
14.9
23.2
5.3
26.4
21.9
5.7
12.8
19.4
4.6
6.3
4.3
7.0
5.9
2.4
11.3
8.7
3.6
3.6
6.3
3.1
2.2
6.6
7.2
1.6
10.8
4.3
7.9
1.9
2.0
2.2
1.4
4.1
1.7
1.1
4.6
0.6
4.4
3.1
0.9
2.7
2.7
0.9
0.6
0.6
0.9
0.6
1.1
0.5
0.8
4.0
5.4
3.9
5.8
5.3
2.1
8.5
7.2
3.1
3.2
5.5
2.8
2.0
5.6
6.0
1.3
8.2
3.6
6.6
1.7
1.8
2.0
1.3
3.6
1.6
1.0
4.0
0.6
3.8
2.8
0.8
2.3
2.4
0.8
0.5
0.5
0.8
0.6
1.1
0.4
0.8
17.3
22.9
24.0
21.0
15.2
10.1
32.3
20.8
17.2
12.6
33.8
15.0
10.4
19.7
19.2
13.4
25.1
17.5
14.1
4.9
10.0
1.7
9.5
16.2
6.8
6.8
16.8
9.4
11.3
12.2
6.9
17.6
9.9
18.0
25.2
25.3
23.5
17.9
12.3
35.4
23.8
17.3
14.0
31.8
14.9
11.5
22.8
25.4
23.3
34.2
21.5
17.2
10.9
10.3
10.0
10.3
16.2
9.7
6.9
18.7
11.1
13.5
13.4
13.7
19.4
12.6
Buy
Buy
Neutral
Buy
Buy
Buy
Buy
Neutral
Buy
Buy
Buy
Buy
Buy
Buy
641
498
164
147
90
1930
262
48
1806
59
1097
483
23
306
705
710
188
205
149
2400
405
65
2076
100
1220
680
38
410
10
43
14
39
65
24
55
36
15
68
11
41
62
34
10.7
12.2
7.3
1.1
5.5
66.8
10.5
3.0
60.6
9.1
32.7
15.8
1.9
18.5
15.3 21.6 -42.7 43.5 41.1 60.2
30.3 43.7 -20.5 148.0 44.3 40.8
8.9 10.9 4.5 22.2 21.4 22.5
7.0 10.7 -79.9 526.1 51.2 130.8
6.9
8.6 13.8 24.9 25.6 16.4
81.8 102.3 17.6 22.6 25.0 28.9
15.7 20.2 -31.2 49.3 28.4 24.9
3.2
3.9
0.4 7.0 21.9 15.9
77.9 100.1 26.0 28.6 28.5 29.8
11.3 15.3 LP 23.6 35.3 6.5
41.5 54.1 21.9 26.8 30.5 33.5
22.1 29.7 32.8 39.8 34.6 30.6
4.1
5.3 -22.9 115.7 28.9 12.2
23.9 30.7 26.8 29.0 28.9 16.6
8.7 41.0 29.2 27.4
15.8 -46.5 181.9 75.1
11.4 Loss LP 38.9
63.8 -43.1 191.3 104.8
47.7 3.7 37.2 14.5
14.9 PL
LP 2,936
25.7 Loss LP 80.8
17.1 PL
LP 125.6
PL
LP 94.1
NA
42.3
38.9
34.5
26.5
22.1
8.0
5.4
32.8
42.2
45.2
35.4
30.2
18.7
26.8
18.8
14.0
13.9
15.4
47.1
42.4
34.2
27.5
21.5
26.1
23.4
16.3
25.2
22.1
23.2
Buy
Neutral
Neutral
Buy
Buy
Buy
Neutral
142
105
264
302
96
246
95
185
150
415
430
215
375
145
30
44
57
43
123
52
52
3.2
9.0
-14.9 8.2
10.7 31.1
30.3 41.6
-12.5 0.5
-4.2 14.2
-44.6 7.6
44.3 15.7
NM 12.7
24.7 8.5
9.9
7.2
NM 196.5
NM 17.3
NM 12.6
0.0 15.9
41.2
39.9
18.5
23.9
14.0
61.0
42.7
102.0
13.7
21.5
28.4
29.5
14.2
20.1
11.0
51.3
37.5
89.5
11.8
14.6
1.8 5.1
-6.1 3.8
2.0 5.7
9.7 12.3
-6.7 0.3
-2.1 7.0
-18.6 3.5
-2.3 4.8
Buy
Buy
Buy
Buy
Buy
Neutral
Buy
Buy
Buy
Buy
152
1818
632
1476
523
606
1838
481
1244
160
225
2330
960
1520
720
540
2260
485
1630
240
48
28
52
3
38
-11
23
1
31
50
3.7
5.3
7.6
45.6 61.7 82.8
34.2 44.6 56.8
61.8 73.3 89.1
37.4 47.5 59.9
9.9 11.8 14.6
43.0 49.0 57.0
4.7
5.4
6.7
91.1 105.1 128.3
7.4 11.0 13.5
4.0 3.1 12.6 12.4
6.4 5.4 20.2 19.8
2.4 2.1 13.7 15.6
4.5 3.7 20.4 20.2
1.9 1.6 14.0 15.8
18.3 15.1 32.9 32.2
5.1 4.4 17.6 16.5
3.2 2.6 21.7 21.1
3.8 3.4 29.9 30.4
3.1 2.7 15.9 19.7
3 April 2018
20

Company
LIC Hsg Fin
MAS Financial
M&M Fin.
Muthoot Fin
PNB Housing
Repco Home
Shriram City Union
Shriram Trans.
Aggregate
Capital Goods
ABB
Bharat Elec.
BHEL
Blue Star
CG Cons. Elec.
CG Power & Indu.
Cummins
Engineers India
GE T&D
Havells
K E C Intl
L&T
Siemens
Solar Ind
Thermax
Va Tech Wab.
Voltas
Aggregate
Cement
Ambuja Cem.
ACC
Birla Corp.
Dalmia Bharat
Grasim Inds.
India Cem
J K Cements
JK Lakshmi Ce
Ramco Cem
Orient Cem
Prism Cem
Sagar Cements
Sanghi Inds.
Shree Cem
Ultratech
Aggregate
Consumer
Asian Paints
Britannia
Colgate
Dabur
Emami
Future Consumer
Godrej Cons.
GSK Cons.
HUL
Reco
Neutral
Buy
Buy
Neutral
Buy
Buy
Buy
Buy
CMP
(INR)
542
611
471
413
1259
570
2196
1468
% Upside
TP
EPS (INR)
(INR)
Downside
FY18E FY19E FY20E
608
12
38.5 44.3 52.6
750
23
18.6 24.2 30.0
575
22
13.9 19.2 23.0
475
15
43.8 44.8 49.3
1750
39
51.4 69.0 92.3
740
30
33.4 39.0 46.0
2500
14
114.2 140.0 166.8
1750
19
78.7 104.8 125.9
EPS Gr. YoY (%)
P/E (x)
FY18E FY19E FY20E FY18E FY19E
0.6 15.2 18.7 14.1 12.2
24.0 29.6 24.1 32.8 25.3
95.8 38.7 19.4 34.0 24.5
48.1 2.3 10.2 9.4
9.2
62.4 34.4 33.7 24.5 18.2
14.6 16.8 18.1 17.1 14.6
35.4 22.6 19.2 19.2 15.7
42.1 33.1 20.2 18.7 14.0
28.2 22.8 22.6 29.0 23.6
42.9
18.6
26.8
31.6
35.9
42.3
23.1
23.4
36.1
37.1
20.9
23.1
36.3
35.8
32.0
14.1
29.9
25.8
28.8
24.1
18.1
36.3
9.1
20.2
17.8
24.0
24.3
25.8
24.2
18.6
13.7
35.5
32.3
23.2
P/B (x)
ROE (%)
FY18E FY19E FY18E FY19E
2.2 1.9 16.4 16.5
4.6 4.0 20.2 17.0
3.2 2.9 10.9 12.5
2.1 1.8 24.3 21.0
3.4 3.0 14.7 17.4
2.7 2.3 16.9 16.9
2.6 2.2 14.1 15.2
2.6 2.3 14.9 17.5
4.3 3.7 15.0 15.8
7.6 6.6 11.6 15.4
3.7 3.3 17.8 17.6
0.9 0.9 3.6 3.4
9.3 8.6 20.4 28.3
19.9 16.3 50.2 49.9
1.2 1.2 1.7 2.7
5.0 4.6 16.5 20.7
3.7 3.4 13.9 14.1
8.6 7.5 23.5 22.3
8.6 7.6 18.9 20.5
5.3 4.4 21.7 21.1
3.4 3.1 13.0 14.1
5.1 4.7 9.1 12.9
8.1 6.8 20.0 20.6
4.6 4.1 11.9 13.6
2.4 2.1 17.1 15.9
5.6 4.9 16.9 17.6
3.4 3.2 11.0 12.2
2.4
3.2
1.8
4.6
1.6
0.9
3.5
3.5
4.1
2.8
5.5
2.4
2.1
6.5
4.2
3.2
2.2
3.0
1.7
4.1
1.3
0.9
2.9
3.1
3.6
2.5
4.6
2.1
1.8
5.6
3.8
2.9
6.1
10.1
2.1
9.4
5.2
2.2
16.4
7.7
14.4
6.6
11.2
6.5
10.2
15.2
8.4
7.5
26.8
33.9
49.9
25.4
29.0
-1.8
23.6
20.7
76.1
8.0
12.9
9.6
12.0
15.7
4.4
17.8
13.8
15.9
10.3
20.9
12.0
16.1
17.0
12.5
12.4
29.4
35.8
55.5
26.7
33.2
4.9
22.6
21.6
92.0
Sell
Buy
Sell
Neutral
Buy
Neutral
Buy
Buy
Neutral
Buy
Neutral
Buy
Neutral
Neutral
Buy
Buy
Neutral
1293
145
83
777
233
79
716
161
408
508
395
1336
1102
1062
1126
496
638
1240
210
80
780
305
90
1040
200
435
640
385
1670
1285
1100
1350
700
630
-4
45
-3
0
31
14
45
24
7
26
-3
25
17
4
20
41
-1
19.8
7.1
3.2
16.6
5.1
1.1
23.0
6.3
10.3
11.1
16.2
48.6
19.8
24.4
28.0
33.2
18.0
30.1
7.8
3.1
24.6
6.5
1.9
31.0
6.9
11.3
13.7
18.9
57.8
30.4
29.6
35.1
35.1
21.3
35.0 12.1 52.0 16.2 65.2
8.3 12.1 10.0 6.8 20.5
4.0 135.9 -2.4 28.5 26.1
31.2 36.0 48.2 26.9 46.8
7.7
8.9 27.1 18.4 45.7
3.0 -72.2 63.3 58.8 69.2
36.8 -13.2 34.7 18.6 31.1
8.2 48.1 9.2 19.8 25.6
12.9 79.8 9.7 14.2 39.6
17.0 16.5 22.8 24.1 45.6
24.3 36.6 16.7 28.3 24.4
69.6 14.9 18.9 20.4 27.5
34.6 10.9 53.8 13.8 55.8
36.7 18.4 21.5 23.7 43.5
43.5 3.1 25.3 23.9 40.1
38.5 76.0 5.7 9.7 14.9
24.3 16.4 18.4 13.9 35.5
17.8 19.8 19.2 31.0
10.9
72.9
50.6
107.6
145.0
10.4
76.9
25.0
38.8
10.3
6.3
70.6
11.7
668.5
164.5
29.5
31.3
-69.0
41.2
-47.5
-33.4
31.8
34.7
-10.8
LP
713.3
LP
69.3
-6.6
-20.6
-13.1
2.1
14.3
12.9
4.5
-9.6
Loss
10.6
3.1
16.8
38.4
34.5
378.7
41.5
235.5
101.9
27.3
97.2
25.3
66.8
113.1
101.0
82.3
29.1
61.6
83.1
18.2
24.8
17.9
19.2
30.5
LP
15.1
14.1
21.8
30.4
14.2
19.5
39.0
21.4
37.7
36.0
35.2
27.2
88.7
33.4
39.7
31.8
44.2
33.5
29.0
20.2
25.1
19.7
16.2
19.1
276.5
14.2
17.4
18.2
39.9
32.4
86.4
51.4
30.6
40.8
22.7
47.4
30.4
43.0
51.5
37.4
24.9
45.8
52.2
42.5
Neutral
241
Neutral
1537
Buy
765
Buy
2814
Neutral
1090
Neutral
153
Buy
1008
Buy
444
Buy
740
Buy
141
Buy
114
Not Rated 942
Buy
121
Buy
16434
Buy
3983
290
1781
1234
3328
1242
148
1343
470
847
179
159
-
157
18867
5131
20
16
61
18
14
-3
33
6
14
27
39
30
15
29
6.0
47.4
8.9
54.7
35.6
3.7
44.4
9.4
24.3
3.3
2.2
25.2
4.9
359.0
76.3
8.3
63.8
42.4
77.4
119.4
7.6
56.5
18.5
30.5
5.5
4.7
50.6
8.9
463.5
123.3
Neutral
Buy
Buy
Buy
Buy
Buy
Neutral
Neutral
Buy
1149
5104
1057
335
1092
56
1112
5832
1349
1270
5995
1365
415
1505
76
1065
6350
1515
11
17
29
24
38
37
-4
9
12
21.5
84.2
24.0
7.6
24.0
-0.1
20.9
161.0
22.9
25.4
105.1
28.3
9.0
31.3
0.3
24.1
183.8
27.9
30.5
131.5
33.8
10.5
37.3
1.1
27.5
215.7
33.0
53.5 45.3 14.2 12.6
60.6 48.6 18.8 16.2
44.1 37.4 21.4 20.1
44.3 37.1 10.5 9.4
45.5 34.9 12.4 10.9
NM 184.6 9.3 8.9
53.2 46.2 11.2 9.8
36.2 31.7 7.2 6.5
58.8 48.3 44.6 44.3
3 April 2018
21

Company
ITC
Jyothy Lab
Marico
Nestle
Page Inds
Parag Milk
Pidilite Ind.
P&G Hygiene
Prabhat Dairy
United Brew
United Spirits
Aggregate
Healthcare
Alembic Phar
Alkem Lab
Ajanta Pharma
Aurobindo
Biocon
Cadila
Cipla
Divis Lab
Dr Reddy’s
Fortis Health
Glenmark
Granules
GSK Pharma
IPCA Labs
Jubilant Life
Laurus Labs
Lupin
Sanofi India
Shilpa Medicare
Strides Shasun
Sun Pharma
Torrent Pharma
Aggregate
Infrastructure
Ashoka Buildcon
IRB Infra
KNR Constructions
Sadbhav
Engineering
Aggregate
Logistics
Allcargo Logistics
Concor
Gateway Distriparks
Aggregate
Media
Dish TV
D B Corp
Den Net.
Ent.Network
Hathway Cable
Hind. Media
CMP
Reco
(INR)
Neutral
259
Neutral
394
Neutral
328
Neutral
8309
Buy
22203
Neutral
255
Buy
940
Neutral
9360
Not Rated 153
Buy
971
Neutral
3257
% Upside
TP
EPS (INR)
(INR)
Downside
FY18E FY19E FY20E
278
7
9.0 10.2 11.4
380
-4
8.5 10.9 13.6
345
5
6.4
7.6
9.0
7882
-5
140.0 159.1 192.3
27490
24
297.1 415.7 549.8
314
23
8.9 12.4 16.8
1065
13
17.6 20.6 23.7
9303
-1
142.1 171.3 200.8
-
3.5
6.4
9.7
1380
42
14.1 17.4 22.9
3515
8
32.6 56.9 78.5
EPS Gr. YoY (%)
P/E (x)
FY18E FY19E FY20E FY18E FY19E
6.6 13.7 12.4 28.9 25.4
-24.8 29.3 24.0 46.6 36.0
1.2 19.2 18.4 51.7 43.3
13.2 13.6 20.8 59.3 52.2
24.5 39.9 32.2 74.7 53.4
147.7 38.7 35.6 28.5 20.6
5.4 17.0 14.9 53.3 45.6
6.9 20.5 17.3 65.9 54.7
-2.0 83.8 52.1 44.1 24.0
62.0 23.9 31.2 69.0 55.7
22.1 74.3 38.1 99.8 57.3
9.0 18.9 17.6 45.4 38.2
10.8
-10.5
-5.8
13.2
-25.3
18.5
40.9
-17.7
2.4
PL
-22.2
-12.4
42.9
33.2
29.5
7.0
-43.0
9.8
-5.0
-56.2
-48.1
-12.9
-17.4
5.9
33.2
21.9
9.4
43.1
25.0
20.6
33.9
52.2
LP
7.7
25.2
11.9
36.6
30.9
52.7
24.6
14.2
99.2
188.8
61.4
27.6
33.1
19.0
23.5
23.6
10.1
81.5
15.8
22.0
19.7
28.0
164.5
24.7
38.7
11.2
27.7
15.8
22.8
34.6
15.5
26.1
36.7
27.7
28.0
25.1
22.6
28.8
26.0
13.3
78.5
22.9
25.7
33.2
28.7
NM
17.9
16.7
42.6
31.0
17.7
26.7
24.0
36.1
34.9
48.5
37.5
26.3
27.4
21.4
21.7
21.4
12.2
54.9
18.3
21.3
24.8
18.8
46.1
16.6
13.4
38.1
22.7
13.5
17.5
19.3
31.6
17.5
16.8
23.2
20.6
20.6
P/B (x)
ROE (%)
FY18E FY19E FY18E FY19E
6.3 5.8 22.8 23.8
6.8 6.6 14.3 18.5
16.0 15.2 33.0 36.0
25.0 23.4 43.4 46.2
29.8 23.8 39.9 44.6
2.9 2.6 10.8 13.3
12.0 10.4 24.2 24.5
37.0 31.0 61.2 61.8
2.1 2.0 4.9 8.5
9.7 8.4 14.9 16.2
17.2 12.8 17.2 22.3
12.1 11.0 26.6 28.7
4.6 3.9 21.8 19.7
4.5 3.9 16.7 19.3
6.3 5.0 27.0 26.2
2.9 2.4 24.6 21.6
7.0 6.4 8.9 11.6
4.8 4.0 22.7 23.7
3.3 2.9 12.8 13.6
5.2 4.7 16.0 20.0
2.7 2.4 10.0 13.7
1.0 1.0 -0.7 2.2
2.9 2.5 16.4 15.3
1.9 1.8 13.2 13.9
10.2 11.6 23.9 30.5
3.1 2.8 10.5 13.0
3.2 2.6 19.7 21.4
3.5 2.9 14.1 18.3
2.4 2.2 10.4 12.0
5.8 5.3 16.1 16.8
3.7 3.1 11.0 19.0
2.2 1.9 4.6 12.1
3.2 3.0 8.8 13.3
4.4 3.9 17.6 19.9
3.4 3.0 12.6 14.8
2.6
1.3
3.6
3.6
2.1
1.9
3.2
1.9
2.9
2.4
1.2
3.1
3.1
1.9
1.7
3.0
1.8
2.7
2.2 6.9
15.5 13.4
23.6 16.2
13.5 13.7
12.9 12.0
11.7
11.2
6.5
10.6
15.3
12.9
10.7
12.6
Neutral
Buy
Buy
Buy
Neutral
Buy
Neutral
Neutral
Neutral
Buy
Neutral
Buy
Neutral
Buy
Buy
Buy
Buy
Buy
Buy
Buy
Buy
Neutral
541
1926
1406
593
598
385
576
1091
2132
127
546
106
2094
664
846
508
775
5118
465
685
508
1263
555
2500
1840
820
600
500
600
1100
2575
185
550
175
2500
750
1110
613
940
5600
749
989
675
1400
3
30
31
38
0
30
4
1
21
46
1
65
19
13
31
21
21
9
61
44
33
11
23.9
66.8
54.0
44.5
7.6
16.8
22.4
32.9
74.4
-0.8
30.6
6.3
49.1
21.4
47.8
19.0
32.3
141.7
13.3
14.1
13.6
48.0
25.3
88.9
65.8
48.7
10.9
21.0
27.0
44.0
113.2
2.8
32.9
7.9
54.9
29.2
62.6
29.1
40.2
161.8
26.5
40.8
21.9
61.3
30.1
109.9
81.4
53.6
19.8
24.4
33.0
52.7
145.0
7.3
41.1
11.0
61.1
37.3
72.5
35.7
54.1
186.9
33.4
55.7
27.9
78.5
Buy
Neutral
Buy
Buy
255
230
285
389
290
250
375
460
14
9
32
18
2.1
25.4
16.9
13.9
7.0
24.6
14.0
16.0
8.3
21.3
18.2
17.4
LP 238.0 18.1 123.4 36.5
24.8 -3.0 -13.6 9.1
9.4
41.2 -17.3 30.2 16.9 20.4
27.1 14.9
8.6
27.9
16.5
24.3
15.8
11.8
24.2
17.5
21.3
Buy
Neutral
Buy
151
1241
185
223
1330
237
47
7
28
8.9
41.9
6.2
12.9
51.2
10.6
14.9
58.2
13.1
-9.3
10.3
-9.0
5.3
44.2
22.3
71.3
28.5
15.8
13.5
23.4
14.6
109.9
20.1
5,545
75.7
161.9
12.6
17.0
29.6
29.9
27.4
Buy
Buy
Neutral
Buy
Buy
Buy
73
312
105
715
36
224
101
420
90
820
47
305
38
35
-14
15
30
36
-0.5
18.8
-2.9
8.3
-0.2
25.9
1.6
23.0
0.1
16.4
0.8
28.8
3.4
PL
LP
27.6 -7.6 22.0
4.0 Loss LP
28.7 -27.7 98.0
2.0 Loss LP
32.4 0.2 11.3
NM 45.5 18.1 13.0 -11.9 33.2
16.5 13.6 3.1 2.6 20.1 20.9
NM 1,479 2.4 2.4 -6.3 0.2
86.5 43.7 3.8 3.5 4.5 8.4
NM 47.7 2.6 2.4 -1.2 5.2
8.7
7.8
1.2 1.1 15.1 14.6
3 April 2018
22

Company
HT Media
Jagran Prak.
Music Broadcast
PVR
Prime Focus
Siti Net.
Sun TV
Zee Ent.
Aggregate
Metals
Hindalco
Hind. Zinc
JSPL
JSW Steel
Nalco
NMDC
SAIL
Rain Industries
Vedanta
Tata Steel
Aggregate
Oil & Gas
Aegis Logistics
BPCL
GAIL
Gujarat Gas
Gujarat St. Pet.
HPCL
IOC
IGL
Mahanagar Gas
MRPL
Oil India
ONGC
PLNG
Reliance Ind.
Aggregate
Retail
Jubilant Food
PC Jeweller
Titan Co.
Aggregate
Technology
Cyient
HCL Tech.
Hexaware
Infosys
KPIT Tech
L&T Infotech
Mindtree
Mphasis
NIIT Tech
Persistent Sys
Tata Elxsi
TCS
Reco
Neutral
Buy
Buy
Buy
Buy
Neutral
Buy
Buy
CMP
(INR)
87
172
400
1235
90
16
860
580
% Upside
TP
EPS (INR)
(INR)
Downside
FY18E FY19E FY20E
117
35
11.8 12.1 12.7
215
25
10.4 13.1 16.0
469
17
8.2 13.5 17.8
1760
42
22.1 37.3 51.5
130
45
2.5
5.8
7.9
27
73
-0.9 0.1
0.6
1225
42
27.7 35.8 42.5
705
22
13.7 17.6 21.0
EPS Gr. YoY (%)
P/E (x)
FY18E FY19E FY20E FY18E FY19E
59.3 2.6 4.9 7.4
7.2
-2.3 26.4 21.5 16.5 13.1
27.8 64.9 31.4 48.7 29.6
7.8 68.7 37.9 55.8 33.1
100.6 137.5 36.4 36.6 15.4
Loss LP 411.6 NM 123.5
11.6 29.1 18.7 31.0 24.0
2.1 28.7 19.3 42.4 33.0
12.1 43.8 28.1 36.4 25.3
8.2
10.9
29.3
12.4
13.1
8.4
16.9
9.4
8.5
8.3
9.9
26.3
10.3
14.2
25.5
14.1
10.9
9.7
25.3
18.5
9.6
8.3
7.7
14.4
13.4
10.3
59.9
16.0
59.3
45.6
16.9
15.3
22.5
16.1
16.8
20.0
19.8
16.8
16.9
12.9
23.0
19.7
P/B (x)
ROE (%)
FY18E FY19E FY18E FY19E
0.8 0.7 11.5 10.6
2.7 2.4 15.3 18.4
3.8 3.4 8.2 12.2
5.4 4.7 10.2 15.3
3.8 2.4 11.6 18.9
3.0 2.9 -15.8 2.4
7.8 7.1 26.1 30.9
7.2 6.1 18.2 20.0
5.1 4.4 14.0 17.4
1.4
3.6
0.7
2.6
1.3
1.5
0.8
3.3
1.8
1.4
1.6
11.1
2.4
1.8
6.1
2.1
2.4
1.5
5.7
4.7
1.7
0.9
1.0
3.6
1.8
1.5
1.2
3.0
0.7
2.2
1.3
1.4
0.8
2.5
1.6
1.3
1.4
8.4
2.1
1.7
5.1
1.9
2.1
1.3
4.9
4.3
1.5
0.8
1.0
3.0
1.6
1.4
13.8
26.9
-4.0
20.9
-0.3
18.2
-1.0
24.7
14.1
16.9
11.6
31.6
22.7
11.7
16.1
15.0
24.9
17.3
20.8
28.0
20.2
7.1
10.0
23.9
12.8
12.9
16.2
29.8
2.4
19.4
9.8
17.2
4.8
29.8
19.8
16.1
14.6
36.3
21.8
12.1
22.0
14.0
20.2
14.4
20.8
24.4
16.2
10.5
12.8
22.9
12.7
13.2
Buy
Neutral
Buy
Buy
Neutral
Buy
Sell
Buy
Buy
Neutral
211
303
225
297
67
118
73
383
283
579
344
342
361
339
79
215
71
480
416
778
63
13
60
14
17
82
-3
25
47
34
19.2
21.2
-12.7
21.5
-0.2
13.6
-0.9
25.6
22.8
61.9
25.9
27.9
7.7
24.0
5.1
14.0
4.3
40.6
33.4
69.5
26.9 123.8 35.1 3.8 11.0
30.3 7.5 31.7 8.9 14.3
12.2 Loss LP 58.8 NM
23.7 45.3 11.5 -1.0 13.8
5.3
PL
LP
2.6 NM
14.7 37.0 2.9 4.7 8.6
6.5 Loss LP 50.2 NM
44.6 165.9 58.6 9.8 15.0
38.9 50.7 46.4 16.4 12.4
61.5 62.9 12.3 -11.5 9.3
66.7 40.7 7.4 13.9
12.5
45.8
24.0
42.3
13.9
36.4
21.2
12.5
54.6
12.2
28.1
24.3
18.9
74.3
80.4
-22.0
21.5
28.2
43.8
-14.7
-7.7
7.4
27.0
-15.0
-22.6
7.1
24.3
19.6
3.6
50.1
9.2
11.2
59.6
4.9
-9.4
-9.4
17.2
-3.6
-7.7
56.7
32.5
13.4
10.3
11.4
28.0
11.3
4.9
28.7
4.5
15.8
21.1
13.2
1.2
5.0
3.3
4.1
17.9
11.6
10.7
39.5
11.2
15.8
40.7
14.8
9.9
8.8
29.6
17.8
8.9
13.0
10.2
16.3
14.8
11.5
77.6
20.3
75.3
58.0
19.0
15.9
24.9
17.7
18.6
21.8
24.7
19.3
19.8
15.9
27.3
22.2
Buy
Buy
Sell
Buy
Neutral
Buy
Buy
Buy
Buy
Neutral
Buy
Buy
Buy
Buy
256
423
325
837
188
344
171
280
996
112
225
180
231
893
303
549
388
999
191
530
257
416
1228
114
283
230
318
1111
18
30
19
19
2
54
50
49
23
2
26
28
38
24
6.5
37.7
20.6
20.6
12.7
34.7
19.3
9.4
55.9
12.6
17.4
17.6
14.1
60.4
9.7
41.2
22.9
32.9
13.3
31.5
17.5
11.1
53.9
11.6
27.2
23.3
16.0
66.6
Neutral
Buy
Buy
2354
313
944
2185
685
990
-7
119
5
30.3
15.4
12.5
39.3
19.5
15.9
51.6 186.2 29.6 31.3
24.9 44.4 26.6 27.6
19.8 38.8 27.0 24.1
48.6 27.2 26.0
45.9
68.9
20.9
78.6
17.2
82.0
47.8
54.6
60.6
60.5
51.5
161.0
18.1
3.1
21.2
2.6
0.8
16.5
31.5
12.9
17.4
14.4
30.8
-2.1
12.1
3.8
10.9
9.7
10.5
8.8
24.6
14.8
16.9
22.8
18.4
12.8
13.2
7.5
13.4
11.2
29.1
16.7
17.2
8.3
16.2
14.3
18.2
9.3
17.5 17.8 22.5 29.8
3.2 2.8 16.9 18.4
16.0 14.8 23.4 25.9
11.1 10.1 19.2 22.2
3.3
3.9
6.3
4.1
2.5
6.2
5.1
3.3
3.1
2.7
8.8
7.0
3.0
3.5
5.4
3.5
2.2
5.0
4.5
3.0
2.8
2.6
7.0
6.0
17.4
25.1
26.9
24.3
14.3
31.7
19.9
15.3
16.1
17.8
36.0
30.4
17.8
23.9
25.8
23.1
13.8
27.5
24.0
18.7
17.6
21.0
33.8
32.9
Buy
Neutral
Neutral
Buy
Neutral
Buy
Buy
Neutral
Neutral
Buy
Buy
Neutral
686
980
414
1138
223
1410
808
846
882
685
1004
2903
675
950
340
1250
219
1400
725
800
800
900
1236
2700
-2
-3
-18
10
-2
-1
-10
-5
-9
31
23
-7
36.2
61.7
16.6
64.4
12.0
64.7
32.7
43.9
44.6
43.1
36.8
130.6
40.6
64.1
18.4
70.7
13.3
70.3
40.8
50.4
52.2
53.0
43.6
147.3
3 April 2018
23

Company
Tech Mah
Wipro
Zensar Tech
Aggregate
Telecom
Bharti Airtel
Bharti Infratel
Idea Cellular
Tata Comm
Aggregate
Utiltites
Coal India
CESC
JSW Energy
NHPC
NTPC
Power Grid
Tata Power
Aggregate
Others
Arvind
Avenue Supermarts
Bata India
BSE
Castrol India
Coromandel Intl
Delta Corp
Eveready Inds.
Interglobe
Indo Count
Info Edge
Kaveri Seed
Manpasand
MCX
Monsanto
Navneet Education
Oberoi Realty
Quess Corp
PI Inds.
Piramal Enterp.
SRF
S H Kelkar
Team Lease Serv.
Trident
TTK Prestige
UPL
V-Guard
Reco
Buy
Neutral
Buy
CMP
(INR)
640
290
913
% Upside
TP
EPS (INR)
(INR)
Downside
FY18E FY19E FY20E
700
9
39.2 40.9 47.7
300
4
17.9 18.4 21.1
1100
20
54.2 64.1 85.2
EPS Gr. YoY (%)
P/E (x)
FY18E FY19E FY20E FY18E FY19E
26.8 4.5 16.6 16.3 15.6
6.0 2.5 14.6 16.2 15.8
4.0 18.3 33.1 16.9 14.2
4.2 4.9 11.1 18.7 17.9
-49.3
16.5
Loss
383.2
Loss
200.6
9.7
Loss
102.9
LP
109.2
24.2
NM
264.6
-417.9
P/B (x)
ROE (%)
FY18E FY19E FY18E FY19E
3.2 2.8 20.6 19.5
2.8 2.4 17.2 16.6
2.5 2.2 15.7 16.4
4.7 4.1 25.0 23.0
Buy
Neutral
Buy
Buy
394
337
78
636
581
380
91
750
47
13
17
18
3.6
1.8
5.5 -67.5
14.0 16.2 17.8 -6.1
-10.9 -12.9 -10.5 Loss
2.4 11.6 23.6 -75.8
PL
17.8
86.5
3.8
2.4
13.0
17.0
4.9
26.4 30.8 19.2
95.2 103.1 66.8
3.6
4.0 -0.9
3.1
3.2 -18.1
15.2 16.6 5.0
20.7 21.9 21.4
7.3
7.9 -5.8
12.1
14.1
17.2
19.3
45.5
6.6
29.0
7.4
16.7
75.0
9.9
26.3
40.6
13.9
30.2
126.6
9.7
49.8
33.1
35.4
116.4
103.0
9.7
59.6
9.2
176.1
47.2
6.0
18.8
23.0
22.4
49.4
6.9
30.3
10.4
20.8
100.0
11.7
33.4
47.4
18.7
37.0
149.9
11.4
46.5
41.9
41.2
147.9
136.0
12.2
88.1
11.6
203.2
55.6
6.7
-8.4
63.6
17.8
2.2
2.9
45.1
93.7
-8.7
44.9
-42.2
49.0
79.5
38.2
-16.0
21.9
4.8
11.7
124.2
-12.2
14.5
-3.5
9.1
11.6
8.4
4.4
8.9
25.3
215.4 2.3 2.3 2.1 1.1
20.7 4.2 4.3 17.0 20.4
NM 1.3 1.6 -18.4 -23.4
54.8 13.0 10.5 4.6 21.2
-174 2.4 2.5 -0.6 -1.5
10.5
10.4
21.0
9.0
11.2
9.4
11.3
10.5
28.1
78.7
39.0
17.0
31.1
18.4
32.8
22.6
17.7
9.4
45.7
12.2
26.9
23.2
21.7
15.1
10.1
30.7
25.4
21.2
19.3
26.7
39.4
7.0
35.8
15.9
38.0
7.4
1.1
1.2
1.0
1.3
1.8
1.8
2.0
6.9
1.0
1.1
1.0
1.3
1.6
1.5
1.8
47.4
10.4
5.9
8.5
10.6
16.6
10.8
14.8
65.8
10.4
5.5
10.8
11.6
17.7
14.5
17.5
Buy
Buy
Sell
Buy
Buy
Buy
Sell
278
988
75
28
170
195
82
401
1408
61
37
210
282
74
44
43
-19
33
23
45
-10
48.4 16.5 15.6
10.0 8.4 11.4
-5.6 10.5 19.8
28.5 3.1 11.5
16.9 9.3 13.1
22.0 5.9 11.5
49.0 8.6 16.8
28.4 10.6 13.5
23.8
37.4
21.0
8.5
-5.9
20.4
25.7
42.5
19.8
32.0
12.5
18.5
58.4
45.0
20.6
26.8
300.0
49.5
20.6
40.0
24.2
22.4
37.5
28.1
27.8
9.7
32.9
34.1
33.4
16.6
8.6
4.3
4.5
39.7
24.1
33.3
17.7
27.1
17.0
34.6
22.5
18.4
17.6
-6.7
26.8
16.4
27.1
32.1
26.6
47.9
25.8
15.4
17.9
12.1
34.8
108.1
47.2
18.4
29.3
22.2
41.2
32.2
21.2
12.4
51.5
14.5
42.7
33.7
26.1
19.1
40.3
45.9
30.7
29.7
24.0
32.6
54.2
8.9
45.8
17.5
50.5
Neutral
Sell
Sell
Neutral
Buy
Buy
Buy
Buy
Neutral
Neutral
Buy
Buy
Buy
Buy
Buy
Buy
Buy
Buy
Buy
Buy
Buy
Buy
Buy
Buy
Neutral
Buy
Neutral
396
1356
752
772
205
535
244
378
1329
94
1202
496
374
701
2745
146
502
1016
900
2468
1988
258
2348
64
6308
751
226
402
920
578
950
242
523
332
458
1307
117
1550
664
467
1050
3293
194
608
1300
988
3500
2040
318
2700
114
5281
945
167
2
-32
-23
23
18
-2
36
21
-2
25
29
34
25
50
20
33
21
28
10
42
3
23
15
78
-16
26
-26
11.3
12.6
15.9
41.9
7.0
24.1
5.9
11.7
62.6
7.5
23.4
34.2
8.8
20.8
105.0
7.7
12.5
22.1
29.3
83.1
82.9
7.9
43.3
7.2
137.8
43.0
4.5
2.7 2.6 8.0 9.4
19.3 16.5 19.0 22.6
6.5 5.8 14.6 15.7
1.6 1.3 8.5 7.4
19.9 18.7 69.1 61.8
4.7 4.0 22.5 23.4
4.1 3.7 12.6 11.9
8.1 6.5 27.1 32.0
7.6 7.1 45.8 41.4
1.8 1.5 16.0 17.4
6.8 6.1 13.7 14.0
3.6 3.1 23.4 27.1
3.5 3.2 7.2 12.3
2.7 2.6 7.9 11.3
8.1 7.0 32.5 34.5
4.4 3.8 24.2 26.8
2.8 2.3 7.2 25.0
5.7 4.6 21.7 21.3
6.4 5.3 22.6 22.9
2.3 2.0 8.9 10.2
3.3 2.9 14.1 15.9
4.2 3.8 13.4 14.9
8.8 7.2 17.7 20.1
1.1 1.0 12.6 14.5
7.8 7.0 18.0 20.7
4.2 3.4 26.3 23.6
12.3 9.8 26.9 28.8
3 April 2018
24

MOSL Universe stock performance
Company
Automobiles
Amara Raja
Ashok Ley.
Bajaj Auto
Bharat Forge
Bosch
CEAT
Eicher Mot.
Endurance Tech.
Escorts
Exide Ind
Hero Moto
M&M
Mahindra CIE
Maruti Suzuki
Motherson Sumi
Tata Motors
TVS Motor
Banks - Private
AU Small Fin. Bank
Axis Bank
DCB Bank
Equitas Hold.
Federal Bank
HDFC Bank
ICICI Bank
IDFC Bank
IndusInd
J&K Bank
Kotak Mah. Bk
RBL Bank
South Indian
Yes Bank
Banks - PSU
BOB
BOI
Canara
Indian Bk
PNB
SBI
Union Bk
NBFCs
Aditya Birla Cap
Bajaj Fin.
Capital First
Cholaman.Inv.&Fn
Dewan Hsg.
GRUH Fin.
HDFC
HDFC Stand. Life
Indiabulls Hsg
L&T Fin.Holdings
LIC Hsg Fin
M&M Fin.
Muthoot Fin
1 Day (%)
1.7
1.9
2.2
2.9
2.3
2.2
-0.1
-0.2
7.9
3.2
2.7
1.0
-0.1
1.6
4.0
3.5
7.4
3.8
-2.2
1.7
2.5
1.0
2.1
-5.9
1.3
0.6
-1.7
4.7
1.3
2.9
0.4
-0.1
1.1
0.0
0.8
0.9
-1.5
1.1
4.1
2.7
2.3
1.8
2.6
5.0
0.8
6.0
0.6
2.1
1.3
2.0
1.3
1M (%)
-0.2
5.2
-7.2
-8.0
-0.6
-2.5
2.0
-5.9
-0.2
9.6
1.7
2.0
-9.3
1.5
1.4
-8.6
-2.1
7.4
-5.3
1.3
1.0
-4.1
2.8
-14.2
-7.3
6.4
-10.9
0.1
-0.4
-10.2
-4.5
2.6
-7.6
-9.1
-4.9
-4.6
-6.2
-8.1
-6.8
9.7
-5.5
1.7
-2.6
13.2
1.4
6.7
-1.0
-1.3
6.9
10.2
6.4
12M (%)
-8.8
75.2
0.0
38.5
-18.5
16.2
10.8
64.9
63.9
2.3
12.9
16.4
1.4
49.5
30.5
-27.3
53.5
Company
MAS Financial Serv.
PNB Housing
Repco Home
Shriram City Union
Shriram Trans.
Capital Goods
ABB
Bharat Elec.
BHEL
Blue Star
CG Cons. Elec.
CG Power & Inds Sol.
Cummins
Engineers India
GE T&D
Havells
K E C Intl
L&T
Siemens
Solar Ind
Thermax
Va Tech Wab.
Voltas
Cement
Ambuja Cem.
ACC
Birla Corp.
Dalmia Bharat
Grasim Inds.
India Cem
J K Cements
JK Lakshmi Ce
Ramco Cem
Orient Cem
Prism Cem
Sagar Cements
Sanghi Inds.
Shree Cem
Ultratech
Consumer
Asian Paints
Britannia
Colgate
Dabur
Emami
Future Consumer
Godrej Cons.
GSK Cons.
HUL
ITC
Jyothy Lab
Marico
Nestle
Page Inds
Parag Milk
1 Day (%)
2.7
-2.7
4.4
2.9
1.9
0.5
1.8
1.4
3.0
-1.6
1.5
2.1
2.0
0.7
4.1
1.2
1.8
2.7
-1.0
-0.5
0.0
2.9
3.2
1.9
7.3
-2.5
3.4
7.8
-0.8
-4.1
0.9
0.9
5.2
1.9
3.5
1.6
0.9
2.5
2.7
-0.1
2.6
2.3
1.9
1.8
-4.3
1.0
1.1
0.8
0.7
1.3
-2.1
2.0
1M (%)
2.8
3.9
-0.3
9.2
9.7
-15.4
-5.7
-9.0
2.7
-0.2
-3.8
-10.9
-6.2
-2.4
-0.6
-3.6
1.7
-4.5
4.1
-7.0
-9.8
3.3
-4.8
-5.9
-15.5
2.7
-6.6
-2.8
-1.7
3.3
-0.2
-11.9
-9.6
-2.5
2.9
-1.1
-4.0
2.6
3.3
-0.1
3.1
1.1
-6.5
3.2
-14.1
1.8
-1.9
14.6
5.4
5.8
1.5
-8.4
12M (%)
5.6
-18.8
-7.0
36.2
1.0
1.8
-24.1
12.1
7.1
1.7
-24.5
11.7
23.3
8.5
90.0
27.0
-12.4
36.5
16.2
-26.7
54.9
1.4
6.3
3.6
43.0
24.5
-6.1
7.8
-4.0
10.6
7.7
16.7
18.5
74.0
-3.4
-0.2
7.3
50.9
5.9
21.0
3.5
90.7
33.2
13.0
48.3
-7.8
10.2
11.6
24.4
51.7
11.7
1.5
-3.8
-13.3
-1.3
33.8
4.0
-19.1
28.1
-20.7
25.8
-2.3
9.6
-1.2
-17.9
-25.0
-12.8
7.9
-36.1
-15.8
-39.0
54.9
-19.3
53.1
42.5
53.2
22.3
24.8
29.8
-12.0
49.6
11.8
3 April 2018
25

MOSL Universe stock performance
Company
Pidilite Ind.
P&G Hygiene
Prabhat Dairy
United Brew
United Spirits
Healthcare
Alembic Phar
Alkem Lab
Ajanta Pharma
Aurobindo
Biocon
Cadila
Cipla
Divis Lab
Dr Reddy’s
Fortis Health
Glenmark
Granules
GSK Pharma
IPCA Labs
Jubilant Life
Lupin
Laurus Labs
Sanofi India
Shilpa Medicare
Strides Shasun
Sun Pharma
Torrent Pharma
Infrastructure
Ashoka Buildcon
IRB Infra.Devl.
KNR Construct.
Sadbhav Engg.
Logistics
Allcargo Logistics
Concor
Gateway Distriparks
Media
Dish TV
D B Corp
Den Net.
Ent.Network
Hathway Cab.
Hind. Media
HT Media
Jagran Prak.
Music Broadcast
PVR
Prime Focus
Siti Net.
Sun TV
Zee Ent.
Metals
Hindalco
Hind. Zinc
1 Day (%)
2.4
-0.9
2.3
2.6
4.2
-1.6
-2.6
0.0
6.4
0.7
1.6
6.1
0.1
2.4
3.0
3.6
2.5
0.4
1.3
0.9
5.3
1.0
-0.9
0.0
2.0
2.5
1.2
3.6
3.1
0.3
-1.8
2.5
-0.3
6.2
2.5
2.2
4.2
-3.7
5.7
1.4
2.7
0.2
0.6
1.6
6.5
4.0
1.6
0.6
-1.4
0.6
1M (%)
5.1
-0.4
-9.9
-7.8
0.3
-2.1
-13.0
0.4
-5.0
-4.5
-4.7
-0.9
7.2
-4.3
-21.0
0.5
-8.6
-12.0
-2.5
1.5
-3.6
-4.6
0.8
6.2
-3.5
-5.0
-5.2
11.5
2.1
-6.1
-2.3
-15.2
-5.3
-11.6
2.2
-6.1
5.6
-1.1
-1.5
-6.8
-5.3
2.7
1.5
-5.2
-12.2
-16.1
-6.3
4.2
-12.1
-4.1
12M (%)
34.6
24.6
26.0
26.1
49.9
-13.2
-12.7
-20.1
-12.2
58.3
-13.2
-2.7
74.8
-19.0
-29.4
-36.3
-23.5
-23.4
6.4
5.9
-46.3
-1.4
8.5
-26.8
-37.5
-26.2
-18.5
31.7
-2.6
47.1
26.6
-10.3
22.0
-26.8
-32.4
-17.9
26.9
-14.8
-4.2
-21.0
4.5
-10.2
10.9
-13.8
6.9
-58.9
7.6
8.5
8.3
4.8
Company
JSPL
JSW Steel
Nalco
NMDC
Rain Industries
SAIL
Vedanta
Tata Steel
Oil & Gas
Aegis Logistics
BPCL
GAIL
Gujarat Gas
Gujarat St. Pet.
HPCL
IOC
IGL
Mahanagar Gas
MRPL
Oil India
ONGC
PLNG
Reliance Ind.
Retail
Jubilant Food
PC Jeweller
Titan Co.
Technology
Cyient
HCL Tech.
Hexaware
Infosys
KPIT Tech
L&T Infotech
Mindtree
Mphasis
NIIT Tech
Persistent Sys
Tata Elxsi
TCS
Tech Mah
Wipro
Zensar Tech
Telecom
Bharti Airtel
Bharti Infratel
Idea Cellular
Tata Comm
Utiltites
Coal India
CESC
JSW Energy
NHPC Ltd
NTPC
Power Grid
1 Day (%)
2.6
3.0
0.8
-0.7
2.5
4.1
1.5
1.3
-1.0
-1.1
-1.0
0.8
-0.1
0.0
-3.3
0.3
3.5
1.9
4.6
1.2
-0.3
1.1
1.2
-1.9
0.3
-0.4
1.0
10.2
0.3
3.1
5.1
4.4
0.3
2.1
-0.8
1.9
1.9
0.3
2.9
1.4
-1.1
0.2
2.4
2.4
-2.0
2.1
3.4
0.9
0.4
0.4
1M (%)
-9.7
-2.9
0.0
-9.8
5.9
-9.7
-12.6
-14.3
2.5
-4.3
-4.3
-3.4
-6.9
-8.7
-10.5
-8.7
-4.9
-5.1
-3.5
-5.0
-4.3
-5.8
17.2
-5.8
16.5
8.3
3.7
20.2
-2.0
3.8
-0.5
-0.4
-1.0
1.1
-18.1
-3.9
-4.4
4.7
-0.8
2.6
-7.6
-1.6
-6.5
-0.3
-11.2
-1.7
-6.7
0.4
4.5
-1.4
12M (%)
86.0
58.2
-11.4
-11.5
251.2
19.4
2.8
27.2
31.8
-2.2
15.2
9.1
16.7
-1.7
-11.8
38.0
11.3
4.6
1.3
-2.7
14.5
35.3
112.8
50.2
104.6
46.4
12.2
92.7
11.4
72.3
98.2
78.6
46.5
102.1
15.0
37.2
19.4
39.3
12.4
-1.3
12.7
3.5
-9.5
-11.9
-5.1
17.5
19.8
-12.9
2.6
-1.3
3 April 2018
26

MOSL Universe stock performance
Company
Others
Arvind
Avenue Super.
Bata India
BSE
Castrol India
Coromandel Intl
Delta Corp
Eveready Inds.
Interglobe
Indo Count
Info Edge
Kaveri Seed
Manpasand
MCX
Monsanto
Navneet Educat.
Oberoi Realty
PI Inds.
Piramal Enterp.
Quess Corp
SRF
S H Kelkar
Team Lease Serv.
Trident
UPL
V-Guard
1 Day (%)
2.8
2.2
3.0
2.1
-0.1
2.1
-2.6
1.6
3.3
10.3
3.1
2.2
1.4
4.8
0.0
2.8
-1.3
1.4
1.1
-1.2
1.5
-0.2
5.9
8.1
3.2
1.8
1M (%)
-4.7
3.3
4.0
-3.5
1.6
-2.8
-30.7
-4.0
-0.1
-5.9
-7.3
0.4
-4.3
-9.0
8.2
8.8
-1.9
1.8
-3.1
0.1
5.0
-11.0
15.5
-11.0
5.1
-4.6
12M (%)
0.4
112.6
32.5
-21.0
-5.4
70.9
34.8
44.1
26.5
-52.5
50.4
-10.3
5.9
-41.7
8.4
-10.0
36.4
7.5
30.5
47.6
22.3
-13.4
139.5
-25.6
3.5
30.3
3 April 2018
27

THEMATIC/STRATEGY RESEARCH GALLERY

REPORT GALLERY
RECENT INITIATING COVERAGE REPORTS
.
Rs

DIFFERENTIATED PRODUCT GALLERY

NOTES
3 April 2018
28

Explanation of Investment Rating
Investment Rating
BUY
SELL
NEUTRAL
UNDER REVIEW
NOT RATED
*In case the recommendation given by the Research Analyst becomes inconsistent with the investment rating legend, the Research Analyst shall within 28 days of the inconsistency, take appropriate measures to make the recommendation consistent with the investment rating legend.
Expected return (over 12-month)
>=15%
< - 10%
> - 10 % to 15%
Rating may undergo a change
We have forward looking estimates for the stock but we refrain from assigning recommendation
Disclosures:
The following Disclosures are being made in compliance with the SEBI Research Analyst Regulations 2014 (herein after referred to as the Regulations).
Motilal Oswal Securities Ltd. (MOSL) is a SEBI Registered Research Analyst having registration no. INH000000412. MOSL, the Research Entity (RE) as defined in the Regulations, is engaged in the business of providing Stock broking services,
Investment Advisory Services, Depository participant services & distribution of various financial products. MOSL is a subsidiary company of Motilal Oswal Financial Service Ltd. (MOFSL). MOFSL is a listed public company, the details in respect of
which are available on
www.motilaloswal.com.
MOSL is registered with the Securities & Exchange Board of India (SEBI) and is a registered Trading Member with National Stock Exchange of India Ltd. (NSE) and Bombay Stock Exchange Limited
(BSE), Multi Commodity Exchange of India Limited(MCX) and National Commodity & Derivatives Exchange Limited(NCDEX) for its stock broking activities & is Depository participant with Central Depository Services Limited (CDSL) & National
Securities Depository Limited (NSDL) and is member of Association of Mutual Funds of India (AMFI) for distribution of financial products and Insurance Regulatory & Development Authority of India (IRDA) as Corporate Agent for insurance products
.Details
of associate entities of Motilal Oswal Securities Limited are available on the website at
http://onlinereports.motilaloswal.com/Dormant/documents/Associate%20Details.pdf
MOSL, it’s associates, Research Analyst or their relative may have any financial interest in the subject company. MOSL and/or its associates and/or Research Analyst may have beneficial ownership of 1% or more securities in the subject company at
the end of the month immediately preceding the date of publication of the Research Report.
MOSL and its associate company(ies), their directors and Research Analyst and their relatives may; (a) from time to time, have a long or short position in, act
as principal in, and buy or sell the securities or derivatives thereof of companies mentioned herein. (b) be engaged in any other transaction involving such securities and earn brokerage or other compensation or act as a market maker in the financial
instruments of the company(ies) discussed herein or act as an advisor or lender/borrower to such company(ies) or may have any other potential conflict of interests with respect to any recommendation and other related information and opinions.;
however the same shall have no bearing whatsoever on the specific recommendations made by the analyst(s), as the recommendations made by the analyst(s) are completely independent of the views of the associates of MOSL even though there
might exist an inherent conflict of interest in some of the stocks mentioned in the research report.
Research Analyst may have served as director/officer, etc. in the subject company in the last 12 month period. MOSL and/or its associates may have
received any compensation from the subject company in the past 12 months.
In the last 12 months period ending on the last day of the month immediately preceding the date of publication of this research report, MOSL or any of its associates may have:
a)
managed or co-managed public offering of securities from subject company of this research report,
b)
received compensation for investment banking or merchant banking or brokerage services from subject company of this research report,
c)
received compensation for products or services other than investment banking or merchant banking or brokerage services from the subject company of this research report.
d)
Subject Company may have been a client of MOSL or its associates during twelve months preceding the date of distribution of the research report.
MOSL and it’s associates have not received any compensation or other benefits from the subject company or third party in connection with the research report. To enhance transparency, MOSL has incorporated a Disclosure of Interest Statement in
this document. This should, however, not be treated as endorsement of the views expressed in the report. MOSL and / or its affiliates do and seek to do business including investment banking with companies covered in its research reports. As a result,
the recipients of this report should be aware that MOSL may have a potential conflict of interest that may affect the objectivity of this report. Compensation of Research Analysts is not based on any specific merchant banking, investment banking or
brokerage service transactions.
Terms & Conditions:
This report has been prepared by MOSL and is meant for sole use by the recipient and not for circulation. The report and information contained herein is strictly confidential and may not be altered in any way, transmitted to, copied or distributed, in part
or in whole, to any other person or to the media or reproduced in any form, without prior written consent of MOSL. The report is based on the facts, figures and information that are considered true, correct, reliable and accurate. The intent of this report
is not recommendatory in nature. The information is obtained from publicly available media or other sources believed to be reliable. Such information has not been independently verified and no guaranty, representation of warranty, express or implied,
is made as to its accuracy, completeness or correctness. All such information and opinions are subject to change without notice. The report is prepared solely for informational purpose and does not constitute an offer document or solicitation of offer to
buy or sell or subscribe for securities or other financial instruments for the clients. Though disseminated to all the customers simultaneously, not all customers may receive this report at the same time. MOSL will not treat recipients as customers by
virtue of their receiving this report.
Analyst Certification
The views expressed in this research report accurately reflect the personal views of the analyst(s) about the subject securities or issues, and no part of the compensation of the research analyst(s) was, is, or will be directly or indirectly related to the
specific recommendations and views expressed by research analyst(s) in this report.
NOTES
Disclosure of Interest Statement
Analyst ownership of the stock
Companies where there is interest
No
A graph of daily closing prices of securities is available at
www.nseindia.com, www.bseindia.com.
Research Analyst views on Subject Company may vary based on Fundamental research and Technical Research. Proprietary trading desk of MOSL or
its associates maintains arm’s length distance with Research Team as all the activities are segregated from MOSL research activity and therefore it can have an independent view with regards to subject company for which Research Team have
expressed their views.
Regional Disclosures (outside India)
This report is not directed or intended for distribution to or use by any person or entity resident in a state, country or any jurisdiction, where such distribution, publication, availability or use would be contrary to law, regulation or which would subject
MOSL & its group companies to registration or licensing requirements within such jurisdictions.
For Hong Kong:
This report is distributed in Hong Kong by Motilal Oswal capital Markets (Hong Kong) Private Limited, a licensed corporation (CE AYY-301) licensed and regulated by the Hong Kong Securities and Futures Commission (SFC) pursuant to the Securities
and Futures Ordinance (Chapter 571 of the Laws of Hong Kong) “SFO”. As per SEBI (Research Analyst Regulations) 2014 Motilal Oswal Securities (SEBI Reg No. INH000000412) has an agreement with Motilal Oswal capital Markets (Hong Kong)
Private Limited for distribution of research report in Hong Kong. This report is intended for distribution only to “Professional Investors” as defined in Part I of Schedule 1 to SFO. Any investment or investment activity to which this document relates is only
available to professional investor and will be engaged only with professional investors.” Nothing here is an offer or solicitation of these securities, products and services in any jurisdiction where their offer or sale is not qualified or exempt from
registration. The Indian Analyst(s) who compile this report is/are not located in Hong Kong & are not conducting Research Analysis in Hong Kong.
For U.S.
Motilal Oswal Securities Limited (MOSL) is not a registered broker - dealer under the U.S. Securities Exchange Act of 1934, as amended (the"1934 act") and under applicable state laws in the United States. In addition MOSL is not a registered
investment adviser under the U.S. Investment Advisers Act of 1940, as amended (the "Advisers Act" and together with the 1934 Act, the "Acts), and under applicable state laws in the United States. Accordingly, in the absence of specific exemption
under the Acts, any brokerage and investment services provided by MOSL, including the products and services described herein are not available to or intended for U.S. persons. This report is intended for distribution only to "Major Institutional
Investors" as defined by Rule 15a-6(b)(4) of the Exchange Act and interpretations thereof by SEC (henceforth referred to as "major institutional investors"). This document must not be acted on or relied on by persons who are not major institutional
investors. Any investment or investment activity to which this document relates is only available to major institutional investors and will be engaged in only with major institutional investors. In reliance on the exemption from registration provided by Rule
15a-6 of the U.S. Securities Exchange Act of 1934, as amended (the "Exchange Act") and interpretations thereof by the U.S. Securities and Exchange Commission ("SEC") in order to conduct business with Institutional Investors based in the U.S.,
MOSL has entered into a chaperoning agreement with a U.S. registered broker-dealer, Motilal Oswal Securities International Private Limited. ("MOSIPL"). Any business interaction pursuant to this report will have to be executed within the provisions of
this chaperoning agreement.
The Research Analysts contributing to the report may not be registered /qualified as research analyst with FINRA. Such research analyst may not be associated persons of the U.S. registered broker-dealer, MOSIPL, and therefore, may not be subject
to NASD rule 2711 and NYSE Rule 472 restrictions on communication with a subject company, public appearances and trading securities held by a research analyst account.
For Singapore
Motilal Oswal Capital Markets Singapore Pte Limited is acting as an exempt financial advisor under section 23(1)(f) of the Financial Advisers Act(FAA) read with regulation 17(1)(d) of the Financial Advisors Regulations and is a subsidiary of Motilal
Oswal Securities Limited in India. This research is distributed in Singapore by Motilal Oswal Capital Markets Singapore Pte Limited and it is only directed in Singapore to accredited investors, as defined in the Financial Advisers Regulations and the
Securities and Futures Act (Chapter 289), as amended from time to time. In respect of any matter arising from or in connection with the research you could contact the following representatives of Motilal Oswal Capital Markets Singapore Pte Limited:
Disclaimer:
The report and information contained herein is strictly confidential and meant solely for the selected recipient and may not be altered in any way, transmitted to, copied or distributed, in part or in whole, to any other person or to the media or reproduced
in any form, without prior written consent. This report and information herein is solely for informational purpose and may not be used or considered as an offer document or solicitation of offer to buy or sell or subscribe for securities or other financial
instruments. Nothing in this report constitutes investment, legal, accounting and tax advice or a representation that any investment or strategy is suitable or appropriate to your specific circumstances. The securities discussed and opinions expressed in
this report may not be suitable for all investors, who must make their own investment decisions, based on their own investment objectives, financial positions and needs of specific recipient. This may not be taken in substitution for the exercise of
independent judgment by any recipient. Each recipient of this document should make such investigations as it deems necessary to arrive at an independent evaluation of an investment in the securities of companies referred to in this document
(including the merits and risks involved), and should consult its own advisors to determine the merits and risks of such an investment. The investment discussed or views expressed may not be suitable for all investors. Certain transactions -including
those involving futures, options, another derivative products as well as non-investment grade securities - involve substantial risk and are not suitable for all investors. No representation or warranty, express or implied, is made as to the accuracy,
completeness or fairness of the information and opinions contained in this document. The Disclosures of Interest Statement incorporated in this document is provided solely to enhance the transparency and should not be treated as endorsement of the
views expressed in the report. This information is subject to change without any prior notice. The Company reserves the right to make modifications and alternations to this statement as may be required from time to time without any prior approval.
MOSL, its associates, their directors and the employees may from time to time, effect or have effected an own account transaction in, or deal as principal or agent in or for the securities mentioned in this document. They may perform or seek to perform
investment banking or other services for, or solicit investment banking or other business from, any company referred to in this report. Each of these entities functions as a separate, distinct and independent of each other. The recipient should take this
into account before interpreting the document. This report has been prepared on the basis of information that is already available in publicly accessible media or developed through analysis of MOSL. The views expressed are those of the analyst, and
the Company may or may not subscribe to all the views expressed therein. This document is being supplied to you solely for your information and may not be reproduced, redistributed or passed on, directly or indirectly, to any other person or
published, copied, in whole or in part, for any purpose. This report is not directed or intended for distribution to, or use by, any person or entity who is a citizen or resident of or located in any locality, state, country or other jurisdiction, where such
distribution, publication, availability or use would be contrary to law, regulation or which would subject MOSL to any registration or licensing requirement within such jurisdiction. The securities described herein may or may not be eligible for sale in all
jurisdictions or to certain category of investors. Persons in whose possession this document may come are required to inform themselves of and to observe such restriction. Neither the Firm, not its directors, employees, agents or representatives shall
be liable for any damages whether direct or indirect, incidental, special or consequential including lost revenue or lost profits that may arise from or in connection with the use of the information.
The person accessing this information specifically agrees
to exempt MOSL or any of its affiliates or employees from, any and all responsibility/liability arising from such misuse and agrees not to hold MOSL or any of its affiliates or employees responsible for any such misuse and further agrees to hold MOSL
or any of its affiliates or employees free and harmless from all losses, costs, damages, expenses that may be suffered by the person accessing this information due to any errors and delays.
Registered Office Address: Motilal Oswal Tower, Rahimtullah Sayani Road, Opposite Parel ST Depot, Prabhadevi, Mumbai-400025; Tel No.: 022-3980 4263; www.motilaloswal.com. Correspondence Address: Palm Spring Centre, 2nd Floor, Palm
Court Complex, New Link Road, Malad (West), Mumbai- 400 064. Tel No: 022 3080 1000. Compliance Officer: Neeraj Agarwal, Email Id:
na@motilaloswal.com,
Contact No.:022-38281085.
Registration details of group entities.: MOSL: SEBI Registration: INZ000158836 (BSE/NSE/MCX/NCDEX); CDSL: IN-DP-16-2015; NSDL: IN-DP-NSDL-152-2000; Research Analyst: INH000000412. AMFI: ARN 17397. Investment Adviser:
INA000007100.IRDA Corporate Agent-CA0541. Motilal Oswal Asset Management Company Ltd. (MOAMC): PMS (Registration No.: INP000000670) offers PMS and Mutual Funds products. Motilal Oswal Wealth Management Ltd. (MOWML): PMS
(Registration No.: INP000004409) offers wealth management solutions. *Motilal Oswal Securities Ltd. is a distributor of Mutual Funds, PMS, Fixed Deposit, Bond, NCDs, Insurance and IPO products. * Motilal Oswal Commodities Broker Pvt. Ltd. offers
Commodities Products. * Motilal Oswal Real Estate Investment Advisors II Pvt. Ltd. offers Real Estate products. * Motilal Oswal Private Equity Investment Advisors Pvt. Ltd. offers Private Equity products
2 April 2018
12