3 May 2018
Market snapshot
Equities - India
Close
Chg .%
Sensex
35,176
0.0
Nifty-50
10,718
-0.2
Nifty-M 100
19,988
-1.5
Equities-Global
Close
Chg .%
S&P 500
2,636
-0.5
Nasdaq
7,101
0.5
FTSE 100
7,543
0.5
DAX
12,802
1.5
Hang Seng
12,194
-1.1
Nikkei 225
22,473
0.0
Commodities
Close
Chg .%
Brent (US$/Bbl)
73
-2.4
Gold ($/OZ)
1,305
-0.8
Cu (US$/MT)
6,785
0.2
Almn (US$/MT)
2,326
3.1
Currency
Close
Chg .%
USD/INR
66.7
66.7
USD/EUR
1.2
-1.1
USD/JPY
109.8
0.5
YIELD (%)
Close
1MChg
10 Yrs G-Sec
7.8
0.00
10 Yrs AAA Corp
8.4
-0.07
Flows (USD b)
2-May
MTD
FIIs
-0.1
-1.0
DIIs
0.0
1.3
Volumes (INRb)
2-May
MTD*
Cash
385
342
F&O
6,804
7,409
Note: YTD is calendar year, *Avg
YTD.%
3.3
1.8
-5.4
YTD.%
-1.4
2.9
-1.9
-0.9
4.1
-1.3
YTD.%
9.4
0.1
-5.9
3.1
YTD.%
4.4
-0.4
-2.5
YTDchg
0.4
0.5
YTD
1.2
5.1
YTD*
376
8,024
Today’s top research idea
Indusind Bank: BHAFIN’s performance on track; earnings to
accelerate post-merger
Expect RoA/RoE to recover to 2.2%/20.3% by FY20
IndusInd Bank has now entered the fourth planning cycle (FY18-20). Besides
delivering healthy profitability and gaining market share in the existing
businesses, it intends to further develop its long-cherished livelihood financing
theme in this cycle.
IIB has already taken a first step toward this by announcing a merger with its
business correspondent (BC) partner, BHAFIN. It will be able to leverage
BHAFIN’s rural network, and thus, provide last-mile financing to villages
without incurring additional cost.
We expect IIB to report healthy acceleration in earnings over FY18-20 and
project RoA/RoE of 2.2%/20.3% in FY20. Our forecasts are premised on
expectations of steady expansion in margins (FY20E: 4.7%), an improvement in
the C/I ratio (by 190bp) and controlled credit cost.
Research covered
Cos/Sector
IndusInd Bank
HCL Technologies
Hero Motocorp
Dabur India
Interglobe Aviation
Marico
Siemens
Tata Power
Gujarat Gas
Other Results
Automobiles
Results Expectation
Key Highlights
BHAFIN’s performance on track; earnings to accelerate post-merger
Guidance dampens expectations from organic momentum
In-line results; higher other expenses dent EBITDA margin
Domestic FMCG volumes up 7.7%; EBITDA margin at historical highs
Aggressive capacity addition in a lean quarter weighs on profitability
Domestic volumes and operating margins below expectations
Results below expectations due to weak execution and margins
Higher loss at Mundra and lower coal production lead to PAT miss
Ujjwala Scheme in PNG residential
DEWH | AJP | CEAT | TELX | HTML
APR-18 VOLUMES: 1. Bajaj Auto; 2. Ashok Leyland
CSTRL | HMN | HEXW | IRB | JSW | LTFH | PNBHOUSI | VEDL
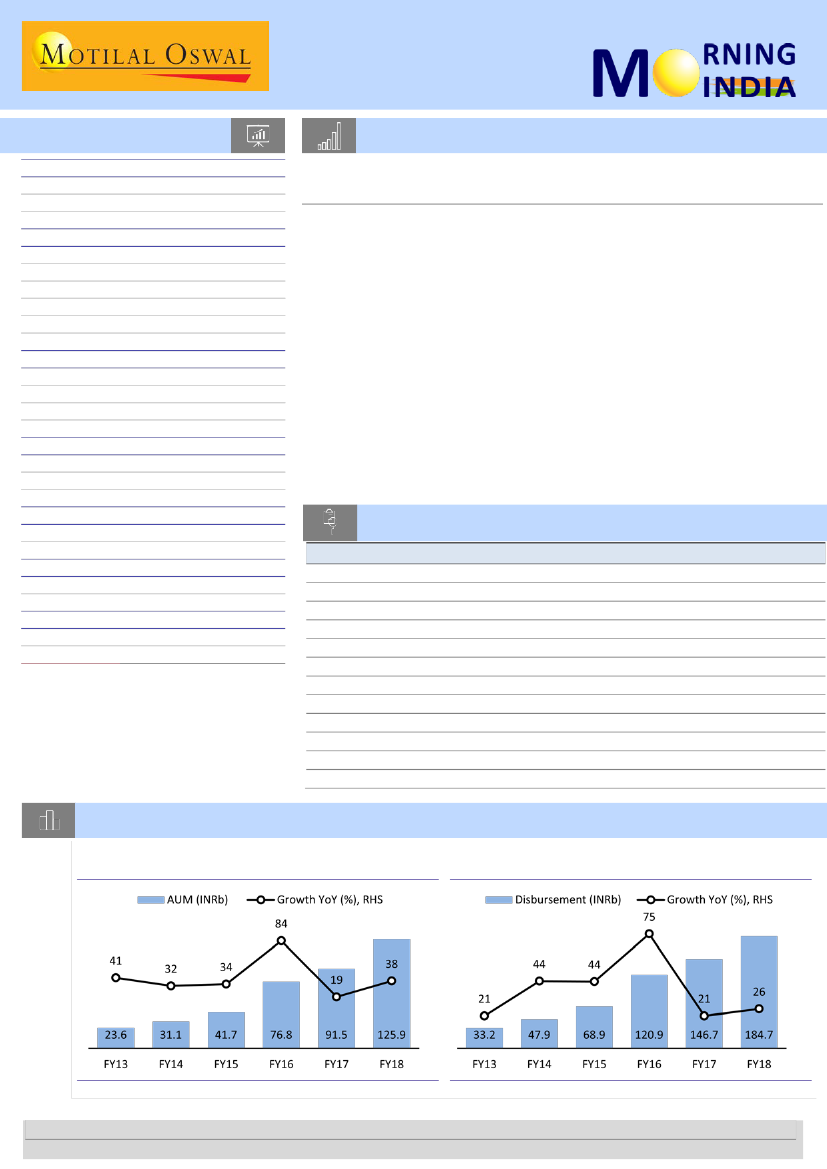
Chart of the Day: Indusind Bank – BHAFIN’s performance on track; earnings to accelerate post-merger
BHAFIN’s AUM has grown at 40% CAGR over
FY12-18…
…while disbursement has grown at 41% CAGR over
FY12-18
Source: Company, MOSL
Research Team (Gautam.Duggad@MotilalOswal.com)
Motilal Oswal research is available on www.motilaloswal.com/Institutional-Equities, Bloomberg, Thomson Reuters, Factset and S&P Capital.
Investors are advised to refer through important disclosures made at the last page of the Research Report.

In the news today
Kindly click on textbox for the detailed news link
1
It’s Dalmia vs UltraTech again
for Binani Cement
The Kolkata bench of the
bankruptcy court on Wednesday
ruled that the lenders of debt-
ridden Binani Cement Ltd should
consider the revised offer of
UltraTech Cement Ltd even as it
allowed Dalmia Bharat Ltd…
2
Federal Reserve officials left interest rates unchanged, acknowledging
inflation is close to target without indicating any intention to veer from
their gradual path of interest-rate increases. “Inflation on a 12-month
basis is expected to run near the committee’s symmetric 2 percent
objective over the medium term,” the policy-setting Federal Open Market
Committee said in a statement Wednesday in Washington…
Fed keeps interest rate unchanged at 1.50-1.75%, says inflation
close to target
3
ONGC sets $2.64 billion capex
for drilling oil, gas wells in
2018/19
Oil and Natural Gas Corp plans to
spend Rs 17,600 crore on drilling a
record 535 wells in 2018-19, the
company said in a statement. The
company has significantly
increased its drilling activity in the
past few years in pursuit of finding
and producing more oil and gas in
the country…
4
For engineering conglomerate
Larsen & Toubro (L&T), the deal
signed on Tuesday with Schneider
may mark the end of non-core
divestments for some time,
according to company officials.
However, analysts remain hopeful
that there is scope for more...
Schneider deal done, L&T says
no more non-core divestment
on the cards
5
The lenders of Essar Steel Ltd on
Wednesday asked ArcelorMittal
Netherlands NV and Numetal
Mauritius to clear their
outstanding dues in order to be
considered as eligible resolution
applicants for the beleaguered
steel company…
Essar Steel lenders ask
ArcelorMittal, Numetal to
clear outstanding dues
6
Sebi probes plunge in IndiGo
shares
The Securities and Exchange
Board of India (Sebi) is looking
into a plunge in shares of
InterGlobe Aviation Ltd just
before the company announced
the departure of its top
executive Aditya Ghosh, two
people aware of the matter
said…
7
Mining moghul Anil Agarwal’s
Vedanta Ltd and state-owned
ONGC were top bidders on
Wednesday for 55 oil and gas
blocks offered in India’s maiden
open acreage auction that was
shunned by domestic private and
international energy majors…
Vedanta, ONGC top bidders in
oil block auction
3 May 2018
2

IndusInd Bank
BSE SENSEX
35,160
S&P CNX
10,739
2 May 2018
Update
| Sector:
Financials
CMP: INR1,872
TP: INR2,150 (+15%)
Buy
BHAFIN’s performance on track; earnings to accelerate post-merger
Expect RoA/RoE to recover to 2.2%/20.3% by FY20
Stock Info
Bloomberg
Equity Shares (m)
52-Week Range (INR)
1, 6, 12 Rel. Per (%)
M.Cap. (INR b)
M.Cap. (USD b)
Avg Val, INRm
Free float (%)
Financials Snapshot (INR b)
2018 2019E
Y/E Mar
NII
OP
NP
NIM (%)
EPS (INR)
EPS Gr. (%)
BV/Sh. (INR)
RoE (%)
RoA (%)
P/E (X)
P/BV (X)
P/ABV (X)
75.0
66.6
36.1
4.2
60.2
25.2
394.1
16.5
1.8
31.1
4.8
4.8
111.1
98.2
53.5
4.7
83.0
37.9
452.9
19.6
2.1
22.6
4.1
4.2
IIB IN
600.2
1898 / 1375
2/11/13
1125
17.5
1986.0
85.0
2020E
145.2
131.4
72.8
4.7
104.4
25.8
577.9
20.3
2.2
17.9
3.2
3.3
After successfully completing three planning cycles, IndusInd Bank (IIB) has now
entered the fourth planning cycle (FY18-20). Besides delivering healthy profitability
and gaining market share in the existing businesses, it intends to further develop its
long-cherished livelihood financing theme in this cycle.
IIB has already taken a first step toward this by announcing a merger with its business
correspondent (BC) partner, Bharat Financial Inclusion (BHAFIN). It will be able to
leverage BHAFIN’s rural network, and thus, provide last-mile financing to villages
without incurring additional cost.
We expect IIB to report healthy acceleration in earnings over FY18-20 (as the
impending merger with BHAFIN gets concluded) and project RoA/RoE of 2.2%/20.3%
in FY20. Our forecasts are premised on expectations of steady expansion in margins
(FY20E: 4.7%), an improvement in the C/I ratio (by 190bp) and controlled credit cost.
We reiterate our Buy rating on IIB, with a target price of INR2,150 (3.3x FY20E ABV).
BHAFIN’s performance on track; demonetization impact waning
BHAFIN has orchestrated an impressive turnaround, led by strong performance
across operating parameters. It delivered AUM/PAT growth of 38% /57% in FY18,
while the GNPL/NNPL ratios declined to 2.4%/0.1% from 6%/2.7% in FY17.
Cumulative collection efficiency for loans disbursed post 1st January 2017 stands at
99.8%, indicating normalization of on-the-ground operations. Margins have been
largely stable, while a reduction in funding cost and an improvement in operating
leverage (cost-income ratio is down to 50% from 74% in FY14) could provide a
booster to earnings growth. BHAFIN has guided for AUM/earnings growth of
43%/36% in FY19.
Merger with BHAFIN to help attain last-mile rural connectivity
IIB intends to leverage BHAFIN’s rural presence to establish an extensive rural
distribution network in ~100,000 villages, with at least one customer touch point
within a 0.5km radius of these villages. The bank also plans to capitalize on the
cross-sell opportunities by mining BHAFIN’s customer base. The focus areas here
would be savings accounts, recurring deposits, partnerships for two-wheeler and
home improvement loans, and PSLC fee income opportunities from an enhanced
loan base qualifying for PSL. We also note that IIB is in the process of running a few
pilot projects to assess the viability of these initiatives (refer Exhibit 16 for more
details).
Shareholding pattern (%)
As On
Mar-18 Dec-17 Mar-17
Promoter
DII
FII
Others
15.0
10.0
57.2
17.8
15.0
11.7
55.3
18.0
15.0
12.3
54.2
18.6
FII Includes depository receipts
Stock Performance (1-year)
Enough levers to achieve ‘Planning Cycle IV’ targets
IIB is aiming to achieve 25-30% loan growth in its Planning Cycle IV (FY17-20). After
achieving 26%+ loan book CAGR over FY12-18, the bank continues witnessing strong
traction across product lines. IIB sees significant headroom for growth to meet its
target from the partnership with BHAFIN. Besides the core business (wherein the
trends are strong in both corporate and vehicle financing segments), IIB anticipates
growth kicker from two areas: (1) microfinance business is re-entering the growth
phase after tiding over asset quality issues post demonetization, and
3 May 2018
3

(2) cross-sell opportunities in this space are significant, as the bank looks to expand
the scope of its partnership with BHAFIN by extending two-wheeler and home
improvement loans to the latter’s existing MFI customer base.
Consumer loan mix to reach ~52% post-merger
The merger with BHAFIN will add ~6% to IIB’s existing loans and ~5% to its balance
sheet. The share of the consumer finance segment, thus, is expected to increase to
~52% (including business banking group). This takes IIB one step closer toward
achieving its desired business mix between the retail and wholesale segments.
Already achieved CASA targets; expect momentum to continue
IIB surpassed its ‘Planning Cycle IV’ CASA targets in FY18 itself, as it reported ~715bp
improvement in CASA ratio. This was led by ~70% YoY growth in SA deposits. The
bank sees significant room for savings deposits growth from two levers: (1) business
from government departments in charge of budgetary allocations and shifting them
from cash basis to its own cashless platforms, and (2) cross-sell of SA accounts to
BHAFIN’s 7.3m customer base.
MFI business via bank can earn better returns; also removes political and
other overhangs
The MFI business can generate relatively high and sustainable RoEs under a banking
set-up due to (a) lower cost of funds (difference of ~400bp between IIB and
BHAFIN), (b) no cap on spreads, (c) higher leverage (10x v/s 5x currently), (d)
elimination of the need to carry excess liquidity, which is required in day-to-day
operations and first loss margins for off-balance sheet, and (e) removal of political
and regulatory overhang. We estimate RoA/RoE for the merged entity to increase to
2.2%/20.3% by FY20, driven by an improvement in margins and cost-ratios, as well
as better fee income opportunities.
Earnings set to accelerate post-merger; maintain Buy with TP of INR2,150
We find IIB attractive for its strong earnings/business growth potential and ability to
deliver industry-leading margins and RoA. With the merger, the bank is set to
establish its presence in niche segments and continue gaining market share with
improving profitability. It is targeting 25-30% loan growth, driven by continued
branch expansion (aiming at 2,000 branches by FY20 v/s 1,400 currently) and
customer acquisition (+2x to 20m). We have built in the BHAFIN merger and
proposed warrant issuance to promoters in our projections. Maintain
Buy
with a
target price of INR2,150 (3.3x FY20E ABV).
3 May 2018
4

HCL Technologies
BSE SENSEX
35,176
Bloomberg
Equity Shares (m)
M.Cap.(INRb)/(USDb)
52-Week Range (INR)
1, 6, 12 Rel. Per (%)
Avg Val, INRm
Free float (%)
S&P CNX
10,718
HCLT IN
1,392
Guidance dampens expectations from organic momentum
1,449.7 / 21.7
Marginal revenue miss:
HCLT’s 4QFY18 revenue grew 8.2% YoY CC (est. of
1107 / 811
+9.1%), EBITDA rose 14.6% YoY (in-line), and PAT increased 10% YoY to
-3/12/4
INR22.3b (est. of INR23.5b). The company delivered QoQ CC revenue growth
1559.0
of 1.2% versus our estimate of +2%. EBIT margin for the quarter was flat
39.8
2 May 2018
4QFY18 Results Update | Sector: Technology
CMP: INR1,001
TP: INR1,050(+5%)
Neutral
Financials & Valuations (INR b)
2018 2019E
Y/E Mar
505.7
564.1
Net Sales
114.4
129.7
EBITDA
87.8
93.3
PAT
62.6
66.9
EPS (INR)
4.5
6.9
Gr. (%)
262.5
290.5
BV/Sh (INR)
25.0
24.0
RoE (%)
22.6
22.2
RoCE (%)
16.6
15.6
P/E (x)
4.0
3.6
P/BV (x)
2020E
617.2
139.5
101.0
72.2
8.0
319.3
23.6
22.1
14.4
3.3
Estimate change
TP change
Rating change
QoQ at 19.6%, in line with our estimate of 19.8%. Full-year FY18 revenue
grew 10.5% YoY CC, EBITDA rose 11% YoY and PAT grew 3.8% YoY.
FY18 revenue growth guidance below expectations:
For FY19, HCLT guided
for CC revenue growth of 9.5-11.5%. From the mid-point, 5.25pp of
contribution would come from inorganic investments (including ~USD200m
from C3i solutions), pegging the organic growth guidance at 5.25%, which is
disappointing, considering expectations of a revival in IMS and Application
Services. Implied CQGR is 2.55-3.3%, but is expected to be lower organically
(our estimate is 1.25-2.2%) since C3i is yet to get integrated.
Implied drag from IMS appears material:
HCLT is pivoting to Mode-2 and
Mode-3 services, which contributed 23.4% to FY18 revenues, growing at
41% YoY (including inorganic investments). This is in sync with the rest of the
industry, where 20-30% of revenues are being contributed by Digital, which
is growing at upwards of 30%. HCLT’s guidance would imply acute pressure
in the remaining ~77%, where the base of large legacy IMS deals will drag
overall growth.
Valuation view:
We have marginally revised down our revenue estimates for
FY19/20 owing to the slight 4Q miss and the tepid FY19 guidance, which was
partly offset by cross-currency tailwinds. Our price target of INR1,050
discounts forward earnings by 14x. We maintain
Neutral,
and would
reconsider the same subject to: [1] greater confidence in IRRs from IBM
deals and/or [2] turnaround in core areas of Application Services and IMS.
4Q
1,817
4.1
120,530
12.7
33.7
11.8
26,490
22.0
20.0
2,150
11.5
20,250
-2.2
5.2
16.5
115,973
85.7
16.9
61.6
1Q
1,884
3.7
121,490
7.2
33.7
11.6
26,810
22.1
20.1
2,690
20.0
21,710
7.2
6.3
15.1
117,781
85.7
16.2
59.8
FY18
2Q
3Q
1,928
1,988
2.3
3.1
124,340 128,080
7.9
8.4
34.0
34.3
11.8
11.2
27,590
29,640
22.2
23.1
19.7
19.6
2,980
2,640
20.4
20.9
21,880
21,940
0.8
0.3
8.6
5.9
15.7
15.7
119,040 119,291
86.0
85.8
15.7
15.2
60.4
60.8
FY17
4Q
2,038
2.5
131,790
9.3
35.0
12.0
30,360
23.0
19.6
2,800
22.1
22,290
1.6
10.1
16.0
120,081
85.7
6,975
11.9
467,220
14.2
33.9
11.8
103,090
22.1
20.3
9,340
18.8
84,570
13.5
59.8
115,973
83.1
FY18
7,838
12.4
505,700
8.2
34.3
11.7
114,400
22.6
19.8
11,110
20.9
87,820
3.8
62.6
120,081
83.7
Est.
4QFY18
2,028
2.0
130,781
8.5
35.6
12.6
30,059
23.0
19.3
1,361
20.5
21,105
-3.8
4.2
15.1
121,091
85.7
(
/ bp)
0.5
52bp
0.8
84bp
-56bp
-61bp
1.0
0.2
34bp
105.8
164bp
5.6
540bp
585bp
-0.8
0bp
Quarterly Performance (Consolidated)
Y/E June
Revenue (USD m)
QoQ (%)
Revenue (INR m)
YoY (%)
GPM (%)
SGA (%)
EBITDA (INRm)
EBITDA Margin (%)
EBIT Ma rgi n (%)
Other i ncome
ETR (%)
Adjusted PAT
QoQ (%)
YoY (%)
EPS
Headcount
Uti l excl . tra i nees (%)
Attri ti on (%)
Fi xed Pri ce (%)
1Q
1,691
6.5
113,360
15.9
34.4
12.1
25,210
22.2
20.6
2,530
21.0
20,430
6.1
14.6
14.5
107,968
85.8
17.8
60.9
FY17
2Q
3Q
1,722
1,745
1.9
1.4
115,190 118,140
14.1
14.2
33.6
33.9
11.8
11.7
25,110
26,280
21.8
22.2
20.1
20.4
2,350
2,310
21.1
21.5
20,150
20,710
-1.4
2.8
10.5
7.9
14.3
14.7
109,795 111,092
85.3
84.6
18.6
17.9
61.3
63.2
3 May 2018
5

2 May 2018
4QFY18 Results Update | Sector: Automobiles
Hero MotoCorp
Neutral
BSE SENSEX
35,176
Bloomberg
Equity Shares (m)
M.Cap.(INRb)/(USDb)
52-Week Range (INR)
1, 6, 12 Rel. Per (%)
Avg Val, INRm
Free float (%)
S&P CNX
10,718
HMCL IN
In-line results; higher other expenses dent EBITDA margin
200
Higher other expenses impact margins:
Revenue rose 23.7% YoY to
731.4 / 11.0
INR85.6b (in-line) in 4QFY18. Realizations were flat YoY/QoQ at INR42.8k (in-
4200 / 3272
line) due to price hikes. While the gross margin was in line at 32.4%, higher
-3/-7/-8
1352.0
other expenses (due to higher marketing spends) led to a miss on the
65.4
EBITDA margin (16% v/s estimate of 16.7%). PAT grew 35% YoY to INR9.7b
CMP: INR3,662
TP: INR4,052(+13%)
Financials & Valuations (INR b)
2018 2019E
Y/E Mar
Net Sales
322.3
365.9
EBITDA
52.8
58.8
PAT
37.0
40.2
EPS (INR)
185.1
201.2
Gr. (%)
9.5
8.6
BV/Sh (INR)
589.3
664.0
RoE (%)
33.8
32.1
RoCE (%)
32.5
30.9
P/E (x)
19.8
18.2
P/BV (x)
6.2
5.5
2020E
402.9
65.7
45.9
229.1
13.9
752.9
32.4
31.3
16.0
4.9
Estimate change
TP change
Rating change
(est. of INR9.8), led by higher other income. For FY18, revenue grew 13.1%
to INR322b (with volume growth of 13.9% and realization decline of 0.7%),
EBITDA margin was flat at 16.4% and PAT increased 9.5% to INR36.9b. HMCL
announced a dividend of INR95/share for FY18 (v/s INR85 for FY17).
Earning call highlights:
a) HMCL indicated double-digit growth for 2W
industry in FY19, driven by continued momentum in rural markets. b) Its
initiatives in the executive 125cc and scooter segments have helped to
partly recover the lost market share. c) Average price hike of INR300 taken
from Jan-18 to Apr-18. d) Haridwar plant incentive expiry to impact margin
by ~60bp from 1QFY19; ramp-up at Halol (100% increase in production in
FY19 to 600k) and commissioning of AP plant (2HFY20) to dilute this impact
in FY20. e) Expect RM inflation impact from 1QFY19 (~100bp impact in
FY18). f) Spare revenue grew 12.9% to INR26.4b in FY18.
Valuation view:
We increase FY20E EPS by 3.5% to factor in Halol ramp-up
and AP plant commissioning. Valuations at 18.2x/16x FY19/20E EPS fairly
capture the medium-term growth prospects. Maintain
Neutral
with a TP of
INR4,052 (17x Mar-20 EPS + INR157/sh of Hero FinCorp).
FY17
4Q
2,002
6,664
23.4
0.5
42,786 42,768
0.2
-0.3
85,640 285,005
67.6
66.8
4.4
4.9
11.9
12.0
13,706 46,348
16.0
16.3
1,665
5,224
15
61
1,483
4,927
13,872 46,585
30.3
27.5
9,674 33,771
34.8
6.9
FY18
7,587
13.9
42,480
-0.7
322,305
67.7
4.8
11.1
52,802
16.4
5,258
63
5,556
52,442
29.5
36,974
9.5
4QE
2,002
23.4
42,834
0.5
85,736
67.7
4.7
10.9
14,336
16.7
1,032
16
1,397
13,954
29.3
9,860
37.4
Var.
(%)
0.0
-0.1
-0.1
0bp
-30bp
100bp
-4.4
-70bp
Quarterly Performance
Y/E March
(INR Million)
Total Volumes ('000 nos)
Growth YoY (%)
Net Realization
Growth YoY (%)
Net Op Revenues
RM Cost (% sales)
Staff Cost (% sales)
Other Exp (% sales)
EBITDA
EBITDA Margins (%)
Other Income
Interest
Depreciation
PBT
Effective Tax Rate (%)
Adj. PAT
Growth (%)
E: MOSL Estimates
1Q
1,745
6.1
42,391
1.0
73,989
67.1
4.5
11.7
12,301
16.6
1,204
15
1,152
12,337
28.4
8,831
18.1
FY17
FY18
2Q
3Q
4Q
1Q
2Q
3Q
1,823 1,473 1,622 1,854 2,023
1,709
15.8
-12.8
-5.8
6.2
10.9
16.0
42,755 43,202 42,682 43,004 41,339 42,796
-1.1
1.1
-2.1
1.4
-3.3
-0.9
77,963 63,646 69,228 79,716 83,620 73,142
66.5
64.9
68.5
67.7
68.1
67.4
4.6
5.9
4.7
4.7
4.6
5.5
11.4
12.3
12.9
11.4
9.9
11.3
13,689 10,797 9,576 12,959 14,557 11,580
17.6
17.0
13.8
16.3
17.4
15.8
1,524 1,319 1,182 1,317 1,176
1,100
16
15
15
16
16
16
1,193 1,249 1,353 1,330 1,360
1,383
14,004 10,853 9,390 12,931 14,357 11,282
28.3
28.9
23.6
29.3
29.6
28.6
10,042 7,720 7,178 9,140 10,105
8,054
27.7
-2.7
-13.9
3.5
0.6
4.3
-0.6
90bp
-1.9
3 May 2018
6

2 May 2018
4QFY18 Results Update | Sector: Consumer
Dabur
Buy
BSE SENSEX
35,176
Bloomberg
Equity Shares (m)
M.Cap.(INRb)/(USDb)
52-Week Range (INR)
1, 6, 12 Rel. Per (%)
Avg Val, INRm
Free float (%)
S&P CNX
10,718
DABUR IN
1761.5
652.3 / 9.8
382 / 265
7/4/13
496.0
31.9
CMP: INR371
TP: INR435 (+17%)
Domestic FMCG volumes up 7.7%; EBITDA margin at historical highs
DABUR’s 4QFY18 consol. sales grew 6.2% YoY
to INR20.3b (est. of INR20.6b).
EBITDA rose 16.2% YoY to INR4.9b (est. of INR4.4b). Adj. PAT increased 18.9%
YoY to INR4b (est. of INR3.6b).
Comparable domestic FMCG business (70% of revenues) sales grew 10% YoY,
led by underlying volume growth of 7.7% (est. of +8.5%).
Consol. EBITDA margin expanded 210bp YoY to 23.9%
(est. of 21.5%), led by
gross margin expansion (+170bp YoY to 50.7%), as well as lower ad spends (-
20bp YoY) and staff costs (-10bp YoY). Note that this is the highest-ever EBITDA
margin reported by DABUR on both quarterly and full-year basis. Adj. PAT grew
18.9% YoY to INR3.9b (est. of INR3.6b).
FY18 consolidated
sales, EBITDA and adj. PAT grew 0.6%, 7.2% and 7.2%,
respectively. EBITDA margin expanded 120bp YoY to 20.9%.
Comments on balance sheet:
Inventory on finished goods increased in FY18 on
account of higher forecast of sales and a change in the packaging norms.
Concall highlights:
1) Slight tailwinds from macros. Category growth has been
subdued, according to Nielsen. 2) Will be able to maintain gross margins in the
domestic business due to price hikes. 3) Capex at INR2.5-3b for FY19 (toward
capacity expansion).
Valuation view:
Changes to the model have not altered our FY19/20 estimates.
The much-vaunted earnings revival in the sector appears poised to come
through, and rural dependent plays are likely to be at the vanguard in FY19.
DABUR has addressed the market share loss issue in its two key categories of
Juices and Honey, while Oral Care continues to do very well. With an expected
EPS CAGR of ~16% going forward (v/s less than 12% CAGR over FY14-17), we
value the stock at 42x March 2020E (10% premium to three-year average) and
derive a target price of INR435. Maintain
Buy.
FY17
2Q
3Q
4.5
-5.2
19,816 18,529
1.3
-5.8
15,730 15,190
4,087
3,339
20.6
18.0
2.1
-10.6
357
333
166
139
893
831
4,456
3,697
873
753
19.6
20.4
3,573
2,938
6.3
-7.5
FY18
2Q
3Q
7.2
13.0
19,589 19,664
-1.1
6.1
15,390 15,630
4,035
4,199
21.4
20.5
20.8
2.7
401
405
133
132
843
663
4,508
4,162
880
833
19.5
20.0
3,619
3,321
1.3
13.1
FY17
4Q
7.7
20,329
6.2
15,477
4,852
23.9
16.2
426
132
732
5,026
1,053
20.9
3,962
18.9
2.0
77,014
-2.1
61,925
15,089
19.6
-0.6
1,429
540
2,984
16,104
3,303
20.5
12,771
2.1
FY18
6.0
77,483
0.6
61,309
16,174
20.9
7.2
1,622
531
3,052
17,074
3,354
19.6
13,689
7.2
(INR Million)
FY18
Var.
4QE
(%)
8.5
20,591
-1.3%
7.5
16,165
9.6%
4,426
21.5
6.0
343
128
664
4,619
8.8%
999
21.6
3,611
9.7%
8.2
Financials & Valuations (INR b)
2018 2019E 2020E
Y/E Mar
Net Sales
77.5
88.3 100.8
EBITDA
16.2
18.7
21.5
NP
13.7
15.9
18.3
EPS (INR)
7.8
9.0
10.4
EPS Gr. (%)
7.2
16.0
15.5
BV/Sh. (INR)
32.4
35.6
38.9
RoE (%)
25.9
26.5
28.0
RoCE (%)
22.9
23.8
25.4
P/E (x)
47.8
41.2
35.7
P/BV (x)
11.5
10.4
9.6
Estimate change
TP change
Rating change
Quarterly Performance (Consolidated)
Y/E March
Domestic Vol Growth (%)
Net Sales
YoY Change (%)
Total Exp
EBITDA
Margins (%)
YoY Growth (%)
Depreciation
Interest
Other Income
PBT
Tax
Rate (%)
Adjusted PAT
YoY Change (%)
E: MOSL Estimates
1Q
4.1
19,522
2.7
16,034
3,488
17.9
10.5
343
118
610
3,637
701
19.3
2,928
12.0
4Q
2.4
19,147
-4.7
14,971
4,176
21.8
0.6
395
117
650
4,314
977
22.6
3,333
0.5
1Q
-4.4
17,901
-8.3
14,812
3,089
17.3
-11.4
391
133
813
3,378
589
17.4
2,787
-4.8
3 May 2018
7

InterGlobe Aviation
BSE SENSEX
35,176
Bloomberg
Equity Shares (m)
M.Cap.(INRb)/(USDb)
52-Week Range (INR)
1, 6, 12 Rel. Per (%)
Avg Val, INRm
Free float (%)
S&P CNX
10,718
INDIGO IN
383.9
475.2 / 7.5
1520 / 1005
-2/4/2
852.0
25.1
2 May 2018
4QFY18 Results Update | Sector: Aviation
CMP: INR1,355
TP: INR1,318(-3%)
Neutral
Aggressive capacity addition in a lean quarter weighs on profitability
INDIGO’s revenue increased 20% YoY (-6% QoQ) to INR58b (our estimate:
INR60b). EBITDAR of INR11.2b (-16% YoY, -42% QoQ) came in significantly
below our estimate of INR14.8b due to a lower yield of INR3.82 (est. of
INR4.08; -4% YoY, -11% QoQ) and higher fuel cost of INR1.39 (est. of INR1.36;
+10% YoY, +10% QoQ). Passenger ticket yield stood at INR3.31 (est. of INR3.51;
-5.6% YoY, -10.6% QoQ). PAT of INR1.2b (est. of INR3.7b; -73% YoY, -85% QoQ)
was further impacted by higher lease rentals of INR9.9b (est. of INR9.6b;
+20.5% YoY, +5.2% QoQ). Higher other income of INR2.6b (est. of INR2.1b; -
12.3% YoY, -5.2% QoQ) largely offset the impact of higher depreciation of
INR1.3b (est. of INR1.15b; +22% YoY, +19.8% QoQ) and higher interest expense
of INR927m (est. of INR837m; +19.4% YoY, +9.8% QoQ).
Ticket yield down ~6% YoY:
INDIGO’s ticket yield declined 6% YoY (-10.6%
QoQ) to INR3.31 (est. of INR3.51), led by aggressive capacity addition in a
lean quarter. Intense competition also took its toll. Total yield declined 4%
YoY (-11% QoQ), led by (a) ancillary revenue (INR6.7b; +21.5% YoY, -5%
QoQ) and (b) other operating income (INR1.4b; +249% YoY, flat QoQ). Other
operating income was likely higher due to credits received from
manufacturers.
For full-year FY18,
revenue stood at INR230b (+24% YoY), EBITDAR at
INR65.7b (+25% YoY) and PAT at INR22.4b (+35% YoY), implying an EPS of
INR58.3/share.
Aggressive ASK guidance for FY19:
Management guided for ASK growth of
25% YoY in FY19 and 18% YoY in 1QFY19. We believe aggressive capacity
addition in a highly competitive market, along with rising crude oil prices,
would hurt margins. We raise our FY19/20 Brent price assumption to
USD65/bbl from USD60/bbl, resulting in ~6% cut in our earnings estimate for
those years.
Rising crude oil price – a major threat:
While crude oil prices are hovering at
~USD72/bbl, we are modeling USD65/bbl for FY19/20. Further increase or
even sustenance of current high price levels would pose a downside risk to
our earnings estimates.
Dividend:
Management has recommended a dividend of INR6/share.
Valuation view:
The stock trades at 14.4x FY20E EPS of INR94.1 and 8.4x
FY20E adj. EV/EBITDAR. Peak valuations leave little room for upside, in our
view. We value INDIGO at 14x FY20 EPS to arrive at a TP of INR1,318.
Maintain
Neutral.
Financials & Valuations (INR b)
Y/E Mar
2018 2019E 2020E
Net Sales
230.2 301.1 361.6
EBITDA
29.6
32.3 43.3
PAT
22.4
27.0 36.2
EPS (INR)
58.3
70.2 94.1
Gr. (%)
35.1
20.4 34.1
BV/Sh (INR)
184.1 195.8 211.6
RoE (%)
41.3
37.0 46.2
RoCE (%)
31.0
37.5 47.2
P/E (x)
23.2
19.3 14.4
P/BV (x)
7.4
6.9
6.4
Adj. EV/EBITDAR
11.1
10.0
8.4
Estimate change
TP change
Rating change
3 May 2018
8

Quarterly performance
Y/E March
Net Sales
YoY Change (%)
Fuel cost
Employee cost
Other expenses
Total Expenditure
EBITDAR
Margins (%)
Net Rentals
EBITDA
Margins (%)
Depreciation
Interest
Other Income
PBT
Tax
Rate (%)
Reported PAT
EPS
YoY Change (%)
E: MOSL Estimates
1Q
45,789
8.7
13,674
4,789
12,046
30,509
15,279
33.4
7,127
8,152
17.8
1,148
1,163
1,626
7,467
1,549
20.7
5,918
15.4
-8.8
FY17
2Q
3Q
41,669 49,865
17.7
16.0
15,524 16,712
5,080 5,273
11,388 13,471
31,992 35,457
9,677 14,409
23.2
28.9
7,721 8,164
1,956 6,245
4.7
12.5
1,189 1,184
610
759
1,608 1,719
1,765 6,022
367 1,149
20.8
19.1
1,398 4,873
3.6
12.7
24.1
-25.9
4Q
48,482
18.5
17,734
5,339
12,087
35,160
13,322
27.5
8,242
5,080
10.5
1,052
777
2,938
6,190
1,786
28.9
4,403
11.5
-24.0
1Q
57,529
25.6
17,929
5,843
14,250
38,022
19,507
33.9
8,537
10,970
19.1
983
770
2,026
11,243
3,132
27.9
8,111
21.1
37.1
FY18
2Q
3Q
52,910 61,779
27.0
23.9
16,781 20,465
6,004 6,137
14,550 15,820
37,335 42,422
15,574 19,357
29.4
31.3
8,193 9,442
7,382 9,915
14.0
16.0
1,025 1,074
857
844
2,146 2,719
7,645 10,716
2,130 3,096
27.9
28.9
5,516 7,620
14.3
19.8
294.5
56.4
4Q
57,991 185,805 230,209
19.6
15.1
23.9
23,677 63,644 78,853
6,566 20,482 78,853
16,519 48,992 61,139
46,762 133,118 164,542
11,229
52,687 65,667
19.4
28.4
28.5
9,931 31,254 36,102
1,298
21,433 29,565
2.2
11.5
12.8
1,286
4,573
4,369
927
3,308
3,398
2,577
7,891
9,469
1,662 21,443 31,267
486
4,852
8,843
29.2
22.6
28.3
1,176 16,592 22,424
3.1
43.2
58.3
-73.3
-17.0
35.1
FY17
FY18
(INR Million)
FY18
Var.
4QE
vs est
59,938
-3%
23.6
22,532
5%
6,600
-1%
16,047
3%
45,179
4%
14,759
-24%
24.6
9,624
3%
5,135
-75%
8.6
-74%
1,153
12%
837
11%
2,051
26%
5,196
-68%
1,507
-68%
29.0
3,689
-68%
9.6
-68%
-16.2
3 May 2018
9

RESULTS
FLASH
BSE SENSEX
35,176
S&P CNX
10,718
2 May 2018
Results Flash | Sector: Consumer
Marico
Neutral
CMP: INR 317
TP: INR350
Domestic volumes and operating margins below expectations
Marico’s 4QFY18 sales grew 12.6% YoY to INR14.8b (est. of INR14.6b).
Domestic volume growth stood at 1% YoY (est. of +5%), while overall volume
growth was 2% YoY. Domestic revenues grew 12% YoY, while reported
international revenues rose 13% YoY (16% growth on a CC basis).
Segmental growth:
Parachute sales grew 24% YoY, with a 5% YoY volumes
decline due to concentrated price increases in 2HFY18 (aggregating to ~22%)
and 15% spikes in volumes in both the base (4QFY17) and preceding quarters
(3QFY18). Saffola sales declined 3% YoY, with a 1% YoY volumes decline. Value
Added Hair Oils (VAHO) sales grew 9%, with 11% volume growth.
Consol. gross margin contracted 550bp YoY to 46.6%,
mainly as copra costs
were up 61% YoY. Consol. A&P expenses declined 50bp YoY. There was a
decrease of 190bp YoY in other expenditure and 50bp YoY in staff costs.
EBITDA margin shrunk 260bp YoY (est. of -20bp) to 17%.
EBITDA declined 2.5% YoY
(est. 9.8% YoY increase) to INR2.5b. EBITDA was 9%
below expectations. Adj. PAT increased 7.2% YoY (est. 5.8% increase) to
INR1.8b. Tax rate at 26% was lower than expectations of 30.7%.
FY18 performance:
Consolidated sales grew 6.8% to INR63.2b. EBITDA margin
shrunk 160bp to 18%. EBITDA was down 1.8% YoY to INR11.4b, while adj. PAT
was up 2% YoY to INR8.3b.
We have a
Neutral
rating on the stock.
Conference Call Details
Date:
3 May 2018
Time:
2:00pm IST
Dial-in details:
+91-22-7115 8050
rd
Financials & Valuations (INR b)
2018E 2019E 2020E
Y/E Mar
Net Sales
63.0
74.0
85.4
EBITDA
11.6
13.7
16.2
NP
8.2
9.7
11.6
EPS (INR)
6.4
7.5
9.0
EPS Gr. (%)
1.7
18.0
18.8
BV/Sh. (INR)
20.6
21.6
24.0
RoE (%)
33.1
35.8
39.3
RoCE (%)
28.3
30.7
33.6
P/E (x)
49.6
42.0
35.4
P/BV (x)
15.4
14.7
13.2
Quarterly Performance
1Q
Domes tic volume growth (%)
8.0
Net Sales
17,523
YoY Change (%)
0.2
COGS
8,400
Gross Profit
9,123
Gros s margin (%)
52.1
Other Expenditure
5,384
% to Sales
30.7
EBITDA
3,740
Margins (%)
21.3
YoY Change (%)
18.2
Depreciation
208
Interes t
54
Other Income
275
PBT
3,753
Tax
1,072
Rate (%)
28.6
Adjusted PAT
2,679
YoY Change (%)
17.2
E: MOSL Estimates
Y/E March
FY17
2Q
3Q
3.4
-4.0
14,395 14,114
-0.8
-7.7
6,785
6,815
7,581
7,328
52.7
51.9
5,050
4,600
35.1
32.6
2,530
2,729
17.6
19.3
11.4
-5.3
218
209
44
21
233
247
2,548
2,700
781
740
29.1
28.9
1,806
1,916
18.0
-6.8
4Q
10.0
13,146
2.2
6,289
6,857
52.2
4,271
32.5
2,586
19.7
23.0
265
47
223
2,497
784
31.4
1,709
25.5
1Q
-9.0
16,815
-4.0
8,782
8,033
47.8
4,790
28.5
3,243
19.3
-13.3
211
35
229
3,226
866
26.8
2,359
-11.9
FY18
2Q
3Q
8.0
9.4
15,363 16,243
6.7
15.1
8,688
8,144
7,219
7,556
46.5
47.0
4,628
4,535
30.1
27.9
2,591
3,021
16.9
18.6
2.4
10.7
235
213
35
39
214
174
2,535
2,943
679
709
26.8
24.1
1,850
2,233
2.5
16.5
4Q
1.0
14,801
12.6
7,896
6,905
46.6
4,382
29.6
2,523
17.0
-2.5
231
53
229
2,468
642
26.0
1,832
7.2
FY17
3.6
59,178
-3.3
28,288
30,890
52.2
19,305
32.6
11,585
19.6
9.7
900
166
978
11,497
3,377
29.4
8,110
14.4
FY18
3.5
63,222
6.8
33,510
29,712
47.0
18,334
29.0
11,377
18.0
-1.8
891
162
846
11,171
2,896
25.9
8,274
2.0
(INR Million)
FY18
Var.
4QE
(%)
5.0
1.3%
14,612
11.1
7,580
7,033
-1.8%
48.1
4,261
29.2
2,772
-9.0%
19.0
9.8
277
83
199
2,611
-5.5%
802
30.7
1,807
1.4%
5.8
3 May 2018
10

RESULTS
FLASH
BSE SENSEX
35,176
S&P CNX
10,718
2 May 2018
Results Flash | Sector: Capital goods
Siemens
Neutral
CMP: INR1128
TP: INR1285(+14%)
Results below expectations due to weak execution and margins
4QFY18 sales rose 12% YoY to INR33b, below our estimate of INR37.4b
(consensus: INR33b). Energy Management (+20% YoY) and Digital Factory
(+19% YoY) reported strong sales growth, which was partly offset by weakness
in Mobility (-43% YoY), Power & Gas (-8% YoY) and Process Industries (-2%
YoY).
Gross margin contracted 50bp YoY (-270bp QoQ) to 31.3%, in line with our
estimate of 31%.
EBITDA rose 16% YoY to INR3.2b, with the margin at 9.8% (+30bp YoY) v/s our
estimate of 10.8% (consensus: 12%). Employee costs rose 10% YoY to INR3.7b.
Other income stood at INR639m (+21% YoY) and the tax rate at 34.7% (-110bp
YoY).
PAT of INR2.2b (+23% YoY) missed our estimate of INR2.9b (consensus:
INR2.24b).
Orders stood at INR29.2b (-38% YoY; 22% growth in base orders of <NR1b size),
with the order book at INR124b (+5% YoY).
Financials & Valuations (INR b)
2018E 2019E 2020E
Y/E Mar
Sales
136.6 140.8 156.7
EBITDA
14.9
16.8
18.5
NP
10.7
12.1
13.6
Adj EPS (INR)
30.0
34.1
38.3
EPS Gr. (%)
51.9
13.6
12.2
BV/Sh (INR)
235.6 257.4 281.8
RoE (%)
12.7
13.2
13.6
RoCE (%)
18.8
19.6
14.2
Payout (%)
44.0
30.0
30.0
Valuations
P/E (x)
37.3
32.9
29.3
P/BV (x)
4.8
4.4
4.0
EV/EBITDA (x)
23.7
20.6
18.3
Div. Yield (%)
0.8
0.9
1.0
Valuation view
The stock trades at 33/30x FY19/20E EPS of 34.1/38.3. We have a
Neutral
rating on
the stock with a target price of INR1,285.
Quarterly Performance
(Standalone)
Y/E September
Total Revenues
Change (%)
EBITDA
As % of Revenues
Depreciation
interest
Other Income
Extra-ordinary Items
PBT
Tax
Effective Tax Rate (%)
Reported PAT
Adjusted PAT
Change (%)
1Q
22,933
-0.9
2,336
10.2
483
20
623
0
2,456
849
34.6
1,607
1,607
44.4
(INR m)
FY17
FY18
MOSLe
FY17
FY18
2Q
3Q
4Q
1Q
2Q
3Q
4Q
2Q
29,288 26,508 31,418 24,295 32,834 34,764 44,684 110,148 136,578 37,378
5.2
1.2
1.7
5.9
12.1
31.1
42.2
4.8
26.4
27.6
2,786 2,255 3,172 2,724 3,228 3,574 5,372 10,512 14,901 4,045
9.5
8.5
10.1
11.2
9.8
10.3
12.0
9.5
10.9
10.8
502
480
502
470
490
500
464
1,967
1,924
500
21
14
22
17
11
19
30
77
77
19
529
731
630
705
639
790 1,157
2,547
3,291
889
72
0 4,230
0
0
0
0
0
0
0
2,864 2,492 7,507 2,942 3,366 3,845 6,036 11,170 16,345 4,414
1,001
863 1,269 1,037 1,169 1,269 2,030
3,982
5,505 1,545
34.9
34.6
16.9
35.2
34.7
33.0
33.6
35.6
33.7
35.0
1,863 1,629 6,238 1,905 2,197 2,576 4,006
7,188 10,840 2,869
1,792 1,629 2,008 1,905 2,197 2,576 4,006
7,034 10,686 2,869
-4.8
27.1
-8.6
18.6
22.6
58.2
99.5
16.6
68.4
60.2
Var %
-12.2%
-20.2%
-23.7%
-23.4%
-23.4%
3 May 2018
11

2 May 2018
4QFY18 Results Update | Sector: Utilities
Tata Power
BSE SENSEX
35,176
Bloomberg
Equity Shares (m)
M.Cap.(INRb)/(USDb)
52-Week Range (INR)
1, 6, 12 Rel. Per (%)
Avg Val, INRm/ Vol m
Free float (%)
S&P CNX
10,718
TPWR IN
2,705
236.9 / 3.5
102 / 76
3/-2/-13
564.0
67.0
CMP: INR87
TP: INR77(-11%)
Sell
Higher loss at Mundra and lower coal production lead to PAT miss
Cutting estimate by 12%/1% for FY19/20; Maintain Sell
Tata Power’s 4QFY18 consol. adj. PAT declined 8% QoQ/30% YoY to INR2.7b (below
our estimate of INR4.5b) due to higher losses at Mundra, lower coal production,
and losses at some of the overseas JV companies. PAT is adjusted for (a)
impairment reversal of INR18.8b, (b) impairment at Georgia Hydro of INR5.2b and
(c) INR2.3b of other one-off items. Net debt (incl. perpetual securities) was
unchanged YoY at INR501b. Consol. PAT increased ~3% YoY to INR14.4b for FY18.
Coal+Mundra:
PAT at its coal and logistics companies declined ~8% QoQ to
INR4.2b. EBITDA at Mundra declined INR1.8b QoQ (recorded a loss of INR1b)
due to higher coal prices and higher PLF. Under-recovery increased
INR0.14/kWh QoQ to INR0.93/kWh at Mundra.
Maithon:
Availability improved from 61% in the previous quarter to 95% in
4QFY18, driving an INR1b QoQ increase in PAT to INR760m.
RE (ex-standalone):
EBITDA increased 32% QoQ to INR4.1b, led by higher
generation. Installed capacity stood at 1.7GW (excluding 0.4GW in standalone).
Cut estimates by 12%/1% for FY19E/20E; Maintain Sell
TPWR has entered into an agreement to sell its investment in Tata
Communications and also in the strategic defence business unit (SBU). We expect
the sale to be executed in FY19, generating after-tax cash inflow of INR30b. We
also increase our coal price estimate from USD70/t to USD80/t. Accounting for
higher losses at Mundra, excluding earnings from Tata Communications and SBU,
and making other adjustments, the PAT estimate is cut by ~12%/1% to
INR17.2b/INR21.1b for FY19E/20E, respectively. The revised TP is INR77/share
based on SOTP (for FY20E). Sale of non-core assets will aid in faster deleveraging.
However, TWPR continues lacking RoE-accretive growth opportunities. Renewable
energy has potential, but is extremely competitive. Maintain
Sell.
FY18
2Q
3Q
76,573 69,499
6.2
4.0
18,498 12,087
24.2
17.4
5,900 5,972
9,814 8,455
1,331
911
-2,641 1,459
1,474
30
-1,488 3,151
-15 3,181
1,553 1,263
3,909 4,197
2,342 6,115
3,830 2,965
FY17
4Q
78,952
10.2
14,878
18.8
6,454
8,975
641
-425
-335
11,323
10,988
-965
2,085
14,037
2,714
FY18
FY18
4QE
97,131
35.5
15,752
16.2
5,964
7,921
-232
0
1,635
0
1,636
935
3,783
4,483
4,483
vs Est
(%)
-19
-6
8
13
-376
-120
572
Financials & Valuations (INR b)
Y/E Mar
2018E 2019E 2020E
Net Sales
293.3 305.3 320.1
EBITDA
63.6
62.1
65.8
PAT
14.5
17.2
21.1
EPS (INR)
5.3
6.3
7.8
Gr. (%)
3.5
18.7
22.7
BV/Sh (INR)
56.4
74.1
78.8
RoE (%)
10.7
9.7
10.2
RoCE (%)
6.3
5.4
5.6
P/E (x)
16.4
13.8
11.2
P/BV (x)
1.6
1.2
1.1
Estimate change
TP change
Rating change
Quarterly Performance (Consolidated) – INR million
Y/E March
Net Sales
YoY Change (%)
EBITDA
Margins (%)
Depreciation
Interest
Other Income
Rate regulated activity
PBT before EO expense
Extra-Ord expense
PBT
Tax
MI & P/L of Asso. Cos.
Reported PAT
Adj PAT
1Q
68,383
-24.9
16,355
23.9
4,393
7,915
-477
-2,721
849
0
849
1,449
1,324
725
725
FY17
2Q
3Q
72,089 66,837
-23.8 -27.6
14,616 14,029
20.3
21.0
4,476 5,318
7,243 7,010
1,029
-792
-3,064 1,523
862 2,432
0
0
862 2,432
-1,117
706
1,383 4,356
3,362 6,082
3,362 6,082
4Q
71,668
-23.2
13,467
18.8
5,698
8,973
2,262
-1,832
-775
-6,515
-7,289
-1,496
3,169
-2,625
3,890
1Q
69,686
1.9
18,311
26.3
5,857
9,286
313
-2,438
1,044
0
1,044
2,630
3,224
1,638
1,638
278,977 293,312
-5.4
5.1
58,467 63,570
21.0
21.7
19,886 23,981
31,140 37,230
2,022
4,327
-6,095
-4,099
3,369
2,587
-6,515 10,308
-3,145 12,895
-458
1,643
10,142 13,514
7,455 24,766
13,969 14,458
213
-39
3 May 2018
12

2 May 2018
4QFY18 Results Update | Sector: Financials
Dewan Housing
BUY
BSE SENSEX
35,176
Bloomberg
Equity Shares (m)
M.Cap.(INRb)/(USDb)
52-Week Range (INR)
1, 6, 12 Rel. Per (%)
Avg Val, INRm
Free float (%)
Financials & Valuations (INR b)
Y/E March
2018 2019E
NII
24.4
30.6
PPP
26.2
32.0
Adj. PAT
11.7
16.2
EPS (INR)
37.4
51.7
EPS Gr. (%)
26.2
38.4
BV (INR)
277
317
RoAA (%)
1.2
1.4
RoE (%)
14.1
17.4
Payout (%)
17.1
16.8
Valuations
P/E (x)
16.8
12.1
P/BV (x)
2.3
2.0
P/ABV (x)
2.3
2.0
Div. Yield (%)
0.9
1.2
S&P CNX
10,718
DEWH IN
Growth trajectory robust; loan yields under pressure
313.2
Dewan Housing Finance’s (DEWH) 4QFY18 PAT (adjusted for stake sale in
196 / 3.0
insurance JV in 4QFY17) grew 26% YoY to INR3.1b (2% above estimate).
680 / 387
21/-5/27
Disbursements in the quarter were up 81% YoY to INR158b,
resulting in
33% YoY AUM growth (fastest growth in the past 18 quarters).
This was
2325.0
driven by 23% YoY AUM growth in the core home loan segment and 52%
60.8
CMP: INR649
TP: INR765 (+18%)
2020E
38.8
39.8
19.9
63.5
22.8
367
1.4
18.6
16.8
9.9
1.7
1.7
1.5
YoY growth in the non-core segment.
The share of non-core loans now
stands at 39% v/s 37% in 3QFY18 and 34% in 4QFY17.
Management has
guided for 22% AUM growth in FY19.
Calculated yield on AUM declined 35bp QoQ (-130bp YoY) to 10.0%, while
cost of funds was largely stable QoQ/YoY at 8.84%. Borrowing mix was
largely unchanged sequentially, with banks accounting for 42% of total
borrowings, followed by capital markets (40%) and others (18%).
C/I ratio (calc.) declined 90bp YoY to 26.3%. DHFL’s focus on reducing
opex is bearing fruit – C/I ratio declined 450bp to 25% over FY16-18.
Asset quality was stable, with the GNPA ratio at 0.96%.
For the full-year FY18, PAT (excl. one-offs) was up 26%, resulting in calc.
RoA/RoE of 1.2%/14%.
Valuation view:
DEWH is a focused play on low-ticket housing. This, along with
the new-found opportunities in LAP and builder finance, is likely to keep its
AUM on a high-growth trajectory. We believe the pressure on margins is
temporary, and margins should revert to normal soon. The continued focus on
cost rationalization is likely to result in higher return ratios and further re-
rating in the medium term. We upgrade FY19/20 EPS estimates by 8/5%.
Maintain
Buy
with a target price of INR765 (2.1x FY20E BVPS).
FY17
2Q
3Q
21,227
23,151
16,307
18,001
4,920
5,150
21.0
20.8
451
514
5,371
5,664
18.3
21.6
1,398
1,497
6.1
9.1
3,972
4,167
23.2
26.9
450
450
3,522
3,717
1,196
1,269
2,326
2,448
29.0
31.7
16.0
16.9
38.5
28.0
26.0
26.4
34.0
34.2
FY18
2Q
3Q
25,034
25,204
19,034
18,944
6,000
6,260
22.0
21.6
1,108
1,138
7,398
7,108
32.4
30.6
1,698
1,781
21.4
19.0
5,411
5,617
36.2
34.8
1,070
1,000
4,341
4,617
1,408
1,558
2,933
3,060
26.1
25.0
24.6
21.7
10.8
12.7
23.9
24.1
32.4
33.7
(INR Million)
FY17
FY18
86,531
66,536
19,995
19.8
2,182
22,177
21.4
5,973
8.7
16,204
26.9
2,180
14,024
4,754
9,270
27.1
18.5
33.1
26.9
33.9
100,239
75,649
24,590
23.0
4,405
28,995
30.7
7,229
21.0
21,766
34.3
4,200
17,566
5,845
11,721
26.4
29.2
23.9
24.9
33.3
DEWH: Quarterly performance
Y/E March
Interes t Income
Interes t Expens es
Net Interest Income
YoY Growth (%)
Fees a nd other i ncome
Net Income
YoY Growth (%)
Opera ti ng Expens es
YoY Growth (%)
Operating Profits
YoY Growth (%)
Provi s i ons
Profit before Tax
Ta x Provi s i ons
Profit after tax
YoY Growth (%)
Loa n growth (%)
Borrowi ngs growth (%)
Cos t to Income Ra ti o (%)
Ta x Ra te (%)
E: MOSL Es ti ma tes
1Q
19,319
14,754
4,565
14.5
275
4,840
15.5
1,361
8.4
3,479
18.6
450
3,029
1,015
2,014
16.2
18.3
20.4
28.1
33.5
4Q
22,835
17,475
5,360
22.6
943
6,303
29.1
1,717
10.8
4,586
37.7
830
3,756
1,273
2,483
30.9
16.7
33.1
27.2
33.9
1Q
23,529
17,869
5,660
24.0
549
6,209
28.3
1,570
15.4
4,640
33.4
830
3,810
1,205
2,605
29.3
19.8
34.4
25.3
31.6
4Q
26,472
19,802
6,670
24.4
1,610
8,280
31.4
2,181
27.0
6,099
33.0
1,300
4,799
1,675
3,124
25.8
27.5
14.0
26.3
34.9
3 May 2018
13

2 May 2018
4QFY18 Results Update | Sector: Healthcare
Ajanta Pharma
Buy
BSE SENSEX
35,176
Bloomberg
Equity Shares (m)
M.Cap.(INRb)/(USDb)
52-Week Range (INR)
1, 6, 12 Rel. Per (%)
Avg. Val, INRm
Free float (%)
S&P CNX
10,718
AJP IN
88.5
118.7 / 1.9
1700 / 1106
-11/3/-36
328.0
29.3
CMP: INR1,340
TP: INR1,560(+16%)
Higher costs dampen FY18 performance; FY19 outlook muted too
Higher fixed overheads drag operating margins:
Revenue grew 11.2% YoY to
INR5.3b (our estimate: INR5b), mainly led by growth in the branded generics
business in Africa. Although the gross margin improved 166bp YoY to 82.3%,
EBITDA margin shrunk 923bp YoY to 26.3% (our estimate: 28.2%) due to higher
fixed overheads related to the newly commissioned facilities. As a result, adj.
PAT declined 23% YoY to INR945m (our estimate: INR1b) in 4QFY18.
Lower EBITDA margin impacts FY18 PAT:
For full-year FY18, revenue grew
6.5% YoY to INR21.3b, EBITDA margin shrunk to 30.9% (from 34.4% in FY17)
and PAT declined 7.5% YoY to INR4.7b.
Muted anti-malaria sales and higher fixed cost to hurt FY19 performance:
AJP
expects to outperform the industry in the domestic formulations, Africa and
Asia branded generics businesses in FY19. The company also guided for better
US sales, led by recent launches and a healthy product pipeline pending for
approval. However, AJP has guided for significantly lower institutional anti-
malaria business, considering steep price erosion and lower off-take from
Global Fund. In addition, increased fixed overheads related to the
commissioning of facilities are expected to affect the EBITDA margin in FY19.
Valuation view:
We have reduced our sales growth estimate by 13.5%/11.9%
for FY19/20 and PAT growth estimate by 21.6%/20.2% for FY19/20 to factor in
lower institutional anti-malaria business and higher operating expenses. We
have also reduced our P/E multiple from 25x to 24x to factor in muted sales
and profit growth in FY19. We continue to value AJP at a premium relative to
peers due to its strong branded generics business, wherein it continues to
outperform industry and enjoy superior margins. Accordingly, we revise our
price target to INR1,560 from INR1,840. Maintain
Buy.
FY17
2Q
3Q
5,158 5,331
16.8
11.8
3,426 3,551
1,732 1,780
33.6
33.4
140
153
8
8
67
192
1,651 1,811
0
0
1,651 1,811
345
385
20.9
21.2
0
0
1,307 1,426
1,307 1,426
26.3
25.2
25.3
26.7
FY18
2Q
3Q
5,404 5,870
4.8
10.1
3,567 3,896
1,837 1,975
34.0
33.6
146
150
1
1
92
152
1,783 1,975
0
0
1,783 1,975
464
501
26.0
25.3
0
0
1,319 1,475
1,319 1,475
0.9
3.4
24.4
25.1
FY17
FY18
FY18 vs Est
4QE (%)
4,992 6.2
3,580 9.2
1,412 -1.2
144 15.6
1
62 -15.5
1,329 -3.6
1329 -3.6
318 5.5
Financials & Valuations (INR b)
2018 2019E 2020E
Y/E Mar
Net Sales
21.3
21.5
26.2
EBITDA
6.6
6.0
7.5
PAT
4.7
4.6
5.7
EPS (INR)
53.0
51.6
65.0
Gr. (%)
-7.5
-2.6
25.9
BV/Sh (INR)
230.8 274.8 329.9
RoE (%)
26.0
20.4
21.5
RoCE (%)
26.0
20.4
21.5
P/E (x)
25.3
26.0
20.6
P/BV (x)
5.8
4.9
4.1
Estimate change
TP change
Rating change
Consolidated - Quarterly Earning Model
Y/E March
Net Sales
YoY Change (%)
Total Expenditure
EBITDA
Margins (%)
Depreciation
Interest
Other Income
PBT before EO expense
Extra-Ord expense
PBT
Tax
Rate (%)
Minority Interest & P/L of Asso. Cos.
Reported PAT
Adj PAT
YoY Change (%)
Margins (%)
E: MOSL Estimates
1Q
4,759
21.6
3,093
1,666
35.0
130
10
55
1,580
0
1,580
385
24.3
0
1,196
1,196
39.0
25.1
4Q
4,768
12.0
3,054
1,714
35.9
189
9
24
1,540
98
1,442
300
20.8
0
1,142
1,220
11.8
25.6
1Q
4,731
-0.6
3,424
1,307
27.6
134
1
48
1,219
32
1,187
239
20.1
0
948
980
-18.0
20.7
4Q
5,303 20,016 21,308
11.2
15.3
6.5
3,908 13,127 14,794
1,395 6,890 6,514
26.3
34.4
30.6
166
612
596
1
35
4
52
337
343
1,280 6,580 6,258
0
98
32
1,280 6,482 6,226
335 1,413 1,541
26.2
21.8
24.7
0
0
0
945 5,068 4,686
945 5,145 4,775
-22.5
24.8
-7.2
17.8
25.7
22.4
1,011 -6.5
1,011 -6.5
3 May 2018
14

Gujarat Gas
BSE SENSEX
35,160
S&P CNX
10,739
2 May 2018
Update
| Sector:
Oil & Gas
CMP: INR883
TP: INR1,195 (+35%)
Buy
Ujjwala Scheme in PNG residential
See little negative impact on financials; positive on volume growth
Government starts Ujjwala Scheme for residential PNG consumers
Stock Info
Bloomberg
Equity Shares (m)
52-Week Range (INR)
1, 6, 12 Rel. Per (%)
M.Cap. (INR b)
M.Cap. (USD b)
Avg Val, INRm
Free float (%)
GUJGA IN
137.7
974 / 722
0/-9/-13
121.6
1.9
185.0
39.1
In 2016, the central government had launched the Ujjwala Scheme to increase
access to subsidized LPG for below poverty line (BPL) consumers.
The Gujarat state government has launched a similar scheme for piped natural
gas (PNG) to BPL consumers.
Do not see much impact currently
Financials Snapshot (INR b)
2018 2019E
Y/E Mar
62.4
78.3
Net Sales
8.9
11.0
EBITDA
3.0
4.8
PAT
21.6
34.7
EPS (INR)
34.3
61.1
Gr. (%)
137.0 165.2
BV/Sh (INR)
16.8
23.0
RoE (%)
15.9
20.4
RoCE (%)
41.0
25.4
P/E (x)
6.4
5.3
P/BV (x)
2020E
88.8
12.8
6.1
44.3
27.5
201.2
24.2
23.8
19.9
4.4
Shareholding pattern (%)
Mar-18 Dec-17 Mar-17
As On
Promoter
50.4
60.9
60.9
DII
2.7
2.6
2.3
FII
14.2
14.3
15.4
Others
32.7
22.2
21.4
FII Includes depository receipts
Stock Performance (1-year)
The management of Gujarat Gas (GUJGA) suggests that for each PNG
residential connection, it incurs ~INR1,600 on installation charges. It collects a
refundable amount of ~INR5,000 as security deposit from consumers.
Under the Ujjwala Scheme, the state government is expected to subsidize the
first-time installation charge of ~INR1,600. The amount would first be borne by
the CGD companies and then refunded by the government.
The security deposit of ~INR5,000 would be recovered by the CGDs in 100
installments of INR50/month.
There could be some increase in working capital due to possible delays in
reimbursement from the state government. Additionally, since the security
deposit would be recovered in installments, the CGDs would not be able to
generate as much interest income as on their usual security deposits.
There is also a likelihood that other state governments /central government
may implement such a scheme which would have a bearing on other CGDs as
well.
Remain bullish on volume pickup
We expect strong volume growth of ~14% in FY19/20 due to increased volumes
from the newly commissioned areas as well as pickup from industries in the
existing geographical areas.
There is increased activism against pollution. Stricter enforcement of emission
norms in industries may result in exponential rise in gas consumption.
Replacement of fuel oil in Bharuch-Ankleshwar-Surat-Vapi region could
generate incremental 1-1.5mmscmd demand primarily from chemical and
pharma companies.
Valuation and view
The stock is currently trading at 19.9x FY20E EPS. We assume sales volume of
7.05/8.01mmscmd and EBITDA/scm of INR4.3/4.4 in FY19/20.
Valuing the company at 27x FY20E EPS of INR44.3, we reiterate our
Buy
recommendation on the stock with a target price of INR1,195.
3 May 2018
15

2 May 2018
4QFY18 Results Update | Sector: Automobiles
CEAT
Buy
BSE SENSEX
35,176
Bloomberg
Equity Shares (m)
M.Cap.(INRb)/(USDb)
52-Week Range (INR)
1, 6, 12 Rel. Per (%)
Avg Val, INRm
Free float (%)
S&P CNX
10,718
CEAT IN
Strong volume growth, but adverse mix/cost inflation restrict margins
40
Operating leverage dilutes impact of RM cost inflation:
4QFY18 consol.
69.4 / 1.1
revenue grew ~14% YoY (+6% QoQ) to INR16.7b (est. of INR16.5b), driven by
2030 / 1408
11% YoY volume growth. Gross margin shrunk 210bp QoQ (+250bp YoY) to
0/-10/-17
39.7% (est. of 38.5%), led by crude-related RM cost inflation (100bp impact)
1295.0
and an adverse mix (100bp impact) due to higher OEM sales. However, the
49.2
CMP: INR1,596
TP: INR1,845(+16%)
Financials & Valuations (INR b)
2018 2019E
Y/E Mar
Net Sales
62,308 70,445
EBITDA
9.9
10.5
PAT
2,587
3,435
EPS (INR)
64.0
84.9
Gr. (%)
-31.5
32.8
BV/Sh (INR)
644.3
717.9
RoE (%)
10.3
12.5
RoCE (%)
8.5
9.2
P/E (x)
25.0
18.8
P/BV (x)
2.5
2.2
2020E
84,131
12.2
4,600
113.7
33.9
816.6
14.8
10.6
14.0
2.0
Estimate change
TP change
Rating change
impact was diluted by operating leverage, resulting in a stable EBITDA
margin on a QoQ basis at 11.8% (+280bp YoY). Adj. PAT grew 16% YoY to
INR929m, below our estimate of INR964m, due to a higher tax rate.
For FY18,
CEAT’s revenue grew ~8% to INR62.3b, driven by ~3% volume
growth. EBITDA declined ~7% to INR6.1b, with the margin contracting 150bp
to 9.9%. Adj. PAT declined ~31% YoY to INR2.5b.
Other highlights:
Revenue contribution from the strategic focus areas rose
to 48% in FY18 (46% in FY17). Net debt reduced by INR846m to INR7.4b as
on 31
st
March 2018, with the net D/E ratio marginally down to 0.3x.
Earnings call highlights:
a) Witnessed robust growth in the OEM segment in
4Q, with OEM and exports outpacing replacement demand. b) Expect
further RM cost inflation of 1.2-1.5% QoQ in 1Q/2QFY19 at the current level
of crude prices. c) Took a price increase of ~0.5% in Apr-18; company is
confident about passing on cost inflation, given the conducive demand
environment. d) De-bottlenecking of PCR capacity in the next 1-2 months;
new capacities to come up in TBR by 3QFY19, in PCR by 2HFY20 and in OTR
by 1HFY20. e) Phasing out capex – INR15b-17b for FY19 and INR8b for FY20.
Valuation and view:
We maintain our earnings estimates for FY19E/20. The
stock trades at 18.8x/13.8x FY19/20E consol. EPS. Maintain
Buy
with a target
price of INR1,845 (16x FY20 consol. EPS).
FY18
62,308
8.1
61.1
7.0
22.0
6,139
9.9
1,686
974
303
3,783
340
3,443
38.9
-238
2,341
2,548
-31.1
(INR Million)
FY18
Var
4QE
%
16,484
2
12.0
61.5
-116
7.0
-13
20.5
48
1,813
9
11.0
80
462
267
66
1,150
18
0
1,150
-3
24.0
-90
964
-20
964
-4
20.9
Consolidated
Y/E March
Net Sales
YoY Change (%)
RM cost (%)
Employee cost (%)
Other expenses (%)
EBITDA
Margins (%)
Depreciation
Interest
Other Income
PBT before exceptional exp.
Exceptional expense
PBT
Tax Rate (%)
Minority Interest & P/L of Asso. Cos.
Reported PAT
Adj PAT
YoY Change (%)
E: MOSL Estimates
1Q
14,702
3.9
56.9
6.5
24.0
1,854
12.6
302
252
57
1,356
9
1,347
30.9
-102
1,033
1,039
-14.7
FY17
FY18
FY17
2Q
3Q
4Q
1Q
2Q
3Q
4Q
14,269 13,976 14,718 14,597 15,230 15,742 16,739 57,665
5.6
1.3
5.5
-0.7
6.7
12.6
13.7
-7.0
57.4
58.7
62.9
65.8
60.6
58.2
60.3
59.0
7.0
7.6
7.1
6.9
7.3
7.1
6.9
7.0
22.6
22.8
21.0
23.6
20.6
22.8
21.0
22.6
1,854 1,535 1,325
547 1,747 1,870 1,976 6,568
13.0
11.0
9.0
3.7
11.5
11.9
11.8
11.4
317
351
460
396
409
433
448 1,431
162
191
212
226
237
273
238
817
37
57
36
103
65
66
69
186
1,411 1,050
689
28 1,166 1,230 1,359 4,506
0
0
125
4
80
10
246
133
1,411 1,050
564
25 1,086 1,220 1,113 4,373
30.5
25.0
-7.9 192.3
38.7
38.9
35.7
24.3
-84
-50
-55
-37
-65
-82
-55
-290
1,065
838
663
14
730
826
771 3,599
1,065
838
798
11
779
833
929 3,700
0.5 -26.1 -24.8 -99.0 -26.8
-0.7
16.5 -17.1
3 May 2018
16

2 May 2018
4QFY18 Results Update | Sector: Technology
Tata Elxsi
Buy
BSE SENSEX
35,176
Bloomberg
Equity Shares (m)
M.Cap.(INRb)/(USDb)
52-Week Range (INR)
1, 6, 12 Rel. Per (%)
Avg Val, INRm
Free float (%)
S&P CNX
10,718
TELX IN
62
74.6 / 1.1
1257 / 644
17/35/41
696.0
55.4
CMP: INR1,215
TP: INR1,400 (+15%)
Ending the year on a positive note…
…setting the stage for continued traction
Financials & Valuations (INR b)
2018 2019E
Y/E Mar
Net Sales
13.9
15.8
EBITDA
3.5
4.0
PAT
2.4
2.7
EPS (INR)
38.7
43.6
Gr. (%)
37.7
12.6
BV/Sh (INR)
116.2
144.8
RoE (%)
37.6
33.4
RoCE (%)
37.6
33.4
44.5
29.6
P/E (x)
16.2
11.9
P/BV (x)
2020E
18.4
4.7
3.2
51.5
18.2
218.0
28.4
43.1
24.8
9.5
Estimate change
TP change
Rating change
Industry leading growth rates:
TELX’s revenue grew 15% YoY (our estimate:
+14%) to INR3.8b. EBITDA margin expanded 210bp YoY to 25.3% (largely in-
line). PAT growth of 58% YoY to INR703m was above our estimate because
of higher other income. For FY18, TELX clocked 15% CC growth, 120bp
margin expansion and 38% PAT growth.
Outlook positive
:
TELX’s achieved 15% growth in FY18, despite challenges in
some major engagements and setbacks in the vertical of Broadcast.
However, with these issues now behind, visibility of growth from new
customers and an encouraging pick-up in new technologies and IP, the
outlook for FY19 appears optimistic.
Profits maintained despite investments:
To stay ahead of the curve, TELX
has been early at developing competencies in new technologies. Over the
last few quarters, it has been making significant progress in the areas of
augmented reality, artificial intelligence and analytics. Despite investments,
it was able to expand margins over the year. However, this isn’t likely to be
the case going forward, and the target would be to maintain margins. Part of
the expansion was also driven by 100% growth in IP revenue, which now
constitutes 5% of total revenue. With strong growth expectations, IP
revenue would enable TELX to expand clientele, introduce non-linearity in
the business and also improve positioning.
Valuation view:
TELX’s efforts to reduce dependency on selected few
accounts (top account now 22% of revenue), significant available
opportunities (especially in budding segments like Medical) and continued
traction in Automotive (60% of revenue) augur well. We raise our earnings
estimate by ~3% for FY19/20, and expect 17% revenue and PAT CAGR over
FY18E-20. We value the stock at 26x FY20E EPS, and maintain Buy with a TP
of INR1,400.
FY17
2Q
3Q
3,042 3,102
15.4
13.2
2,267 2,389
775
713
25.5
23.0
64
69
-26
24
685
668
685
668
231
226
33.6
33.9
455
441
455
441
19.3
8.4
14.9
14.2
FY18
2Q
3Q
3,422 3,455
12.5
11.4
2,581 2,520
840
935
24.6
27.1
64
63
89
68
864
940
864
940
292
313
33.8
33.2
572
628
572
628
25.9
42.2
16.7
18.2
FY17
FY18
FY18
4QE
3,717
14.0
2,788
929
25.0
82
58
905
905
299
33.0
607
607
36.3
16.3
Var
(%)
1
2
Quarterly Performance (Consolidated)
Y/E March
Net Sales
YoY Cha nge (%)
Tota l Expendi ture
EBITDA
Ma rgi ns (%)
Depreci a ti on
Other Income
PBT before EO expense
PBT
Ta x
Ra te (%)
Reported PAT
Adj PAT
YoY Cha nge (%)
Ma rgi ns (%)
1Q
2,959
21.5
2,268
691
23.3
67
8
632
632
215
34.0
417
417
16.7
14.1
4Q
3,260
10.9
2,503
758
23.2
68
-21
669
669
224
33.4
445
445
8.3
13.6
1Q
3,232
9.3
2,498
734
22.7
65
79
749
749
251
33.6
497
497
19.3
15.4
4Q
3,754 12,330 13,863
15.1
14.7
12.4
2,803 9,398 10,403
951 2,932 3,460
25.3
23.8
25.0
61
269
254
196
-48
432
1,086 2,615 3,639
1,086
2,615 3,639
383
862 1,227
35.3
33.0
33.7
703 1,753 2,412
703 1,753 2,412
58.0
12.6
37.7
18.7
14.2
17.4
20
20
16
16
3 May 2018
17

RESULTS
FLASH
BSE SENSEX
35,716
S&P CNX
10,718
2 May 2018
Results Flash | Sector: Media
HT Media
Neutral
CMP: INR88
TP: INR98
Conference Call Details
Date:
3 May 2018
Time:
11:00am IST
Dial-in details:
+91 22 7115 8103
Valuation snapshot
2018
Y/E Mar
Net Sales
23.5
EBITDA
4.0
NP
3.0
EPS (INR)
13.2
EPS Gr. (%)
78.9
BV/Sh. (INR)
109.6
RoE (%)
12.8
RoCE (%)
12.0
P/E (x)
6.7
P/BV (x)
0.8
EV/EBITDA (x)
6.4
rd
High other income drives PAT – up 193%, 81% beat
Revenue declined 4% YoY (and 10% QoQ) to INR5.6b, a 5% miss.
Yet, EBITDA grew 10% YoY (declined 40% QoQ; 11% miss) to INR805m, mainly
driven by lower SGA expenses (down 12% YoY).
EBITDA margin expanded 190bp YoY (but declined 720bp QoQ) to 14.3%
against our estimate of 15.4%.
PAT surged 193% YoY (but declined 40% QoQ) to INR750m, higher than our
estimate of INR415m. This was primarily led by 73% YoY rise in other income
to INR843m potentially due to MTM gains.
At CMP of INR88, the stock trades at 7.3x FY19E and 6.9x FY20E EPS.
2019E
24.5
4.0
2.8
12.1
-8.6
121.2
10.5
10.3
7.3
0.7
5.4
2020E
25.4
3.9
2.9
12.7
4.9
133.4
10.0
10.0
6.9
0.7
4.5
Consolidated - Quarterly Earnings Model
Y/E March
Net Sales
YoY Change (%)
Total Expenditure
EBITDA
Margins (%)
Depreciation
Interest
Other Income
PBT before EO expense
Extra-Ord expense
PBT
Tax
Rate (%)
Minority Interest & P/L of Asso. Cos.
Reported PAT
Adj PAT
YoY Change (%)
Margins (%)
FY17
1Q
2Q
3Q
6,147 6,022 6,499
4.5
0.2
-4.6
5,504 5,518 5,394
643
505 1,105
10.5
8.4
17.0
295
304
312
247
245
241
478
780
549
579
736 1,100
0
0
0
579
736 1,100
186
224
36
32.2 30.5
3.3
168
202
150
224
309
914
224
309
914
-9.5 -16.1 32.9
3.6
5.1
14.1
4Q
5,853
-7.3
5,122
731
12.5
337
218
488
665
0
665
225
33.8
184
256
256
-40.7
4.4
FY18
1Q
2Q
3Q
5,990 5,606 6,254
-2.5
-6.9
-3.8
5,191 4,561 4,907
799 1,045 1,347
13.3 18.6
21.5
320
317
307
194
199
194
531
435
645
817
965 1,491
0
-31
0
817
997 1,491
239
219
121
29.2 22.0
8.1
162
116
126
415
662 1,244
415
638
933
85.5 106.3
2.1
6.9
11.4
14.9
FY17
4Q
5,612
-4.1
4,807
805
14.3
284
230
843
1,134
0
1,134
280
24.7
103
750
750
193.5
13.4
24,521
-2.0
21,538
2,983
12.2
1,248
951
2,295
3,079
0
3,079
671
21.8
705
1,703
1,703
-1.9
6.9
FY18
(INR Million)
Est Var
4QFY18E (%)
23,462 5,894
-5
-4.3
0.7
19,466 4,987
-4
3,996
908
-11
17.0
15.4 -105bps
1,228
329
-14
816
202
14
2,455
465
81
4,407
841
35
-31
0
4,438
841
35
859
292
19.4
34.7
507
134
3,072
415
81
3,047
415
81
78.9
62.4
13.0
7.0
633bps
3 May 2018
18

Sector Update| 2 May 2018
Automobiles
Bajaj Auto
Stock Info
Bloomberg
Equity Shares (m)
M.Cap. (INR b) / (USD b)
52-Week Range (INR)
1, 6, 12 Rel. Per (%)
CMP: INR2,965
BJAUT IN
289.4
812.7/12.5
3473 / 2695
-5/-17/-12
TP: INR3,550 (+20%)
Buy
Dispatches at ~415k units, much ahead of estimate of ~331k
Domestic volumes up 29% YoY to 229k units; exports up 22% to 186k units
BJAUT’s Apr-18 sales increased 25.9% YoY to 415.2k units, exceeding our estimate of
330.5k units.
Domestic volumes of 229.5k units were above our estimate of 189k units. Exports at
185.7k units (highest-ever) were also above our estimate of 141.5k units. Domestic
volumes grew 29% YoY, while exports rose 22% YoY.
Overall motorcycle volumes rose 18.9% YoY. Domestic motorcycle dispatches were up
~24% YoY to 200.7k units. Motorcycle exports grew ~13% YoY to 148.9k units.
3W volumes remained strong, with overall growth of 83% YoY. Domestic 3W volumes
maintained the positive momentum, growing 80% YoY to 28.7k units. 3W exports
grew 85% YoY to 36.8k units. This marks highest-ever 3W export monthly volumes for
BJAUT.
The stock trades at 17.7x/15x FY19E/20E consol. EPS. Maintain Buy.
Financial & Valuation (INR b)
Y/E MARCH
2018E 2019E 2020E
Sales
251
275
310
EBITDA
47.4 53.2 62.9
Consol. NP
42.8 48.6 57.1
ConsEPS(INR)
148
168
197
EPS Gr. (%)
4.8 13.5 17.5
BV/Sh. (INR)
649
717
802
RoE (%)
23.9 24.6 26.0
RoCE (%)
21.6 22.5 33.0
Payout (%)
52.8 53.7 51.8
Valuation
P/E (x)
20.1 17.7 15.0
P/BV (x)
4.6
4.1
3.7
EV/EBITDA (x)
14.9 12.9 10.6
Div. Yield (%)
2.2
2.5
2.9
Snapshot of volumes for Apr-18
YoY
Company Sales
Bajaj Auto
Motorcycles
Three-Wheelers
Domestic
Exports
Apr-18
415,168
349,617
65,551
229,464
185,704
Apr-17
329,800
293,932
35,868
177,887
151,913
MoM
YoY (%)
MoM
Mar-18
chg
(%) chg
25.9 334,348 24.2
18.9 269,939 29.5
82.8
64,409
1.8
29.0 203,600 12.7
22.2 130,748 42.0
FY19 YTD FY18 YTD (%) chg
415,168
349,617
65,551
229,464
185,704
329,800
293,932
35,868
177,887
151,913
25.9
18.9
82.8
29.0
22.2
FY19
estimate
4,342,169
3,683,021
659,148
2,472,048
1,870,121
Residual FY19 YTD
Monthly Monthly
Gr. (%)
Run rate Run rate
8.4
9.3
3.4
5.5
12.5
357,000
303,037
53,963
203,871
153,129
415,168
349,617
65,551
229,464
185,704
3 May 2018
19

Ashok Leyland
CMP: INR161
Stock Info
Bloomberg
Equity Shares (m)
M.Cap.(INR b)/ (USDb)
52-Week Range (INR)
1, 6, 12 Rel. Per (%)
AL IN
2,845.9
472.5/7.1
112 / 74
3/3/-29
TP: INR179 (+11%)
Buy
Apr-18 sales of 12.7k units below estimate of 17.8k units
On a low base, MHCVs grew by 98.2% YoY and LCVs by 45% YoY
Financials Snapshot (INR b)
Y/E MARCH 2018E 2019E 2020E
Sales
260.4 308.0 360.6
EBITDA
28.4 35.6
42.8
NP
15.9 21.2
26.9
Adj. EPS (INR)
5.4
7.2
9.2
EPS Gr. (%)
28.8 33.1
27.1
BV/Sh. (INR)
23.9 28.5
34.7
RoE (%)
24.3 27.6
29.2
RoCE (%)
20.3 23.3
25.2
Valuations
P/E (x)
29.7 22.3
17.5
P/BV (x)
6.7
5.7
4.7
EV/EBITDA (x) 16.2 12.4
9.7
Div. Yield (%)
1.2
1.4
1.5
AL’s Apr-18 wholesale dispatches grew 79% YoY to 12.7k units (est. of 17.8k units), led
by a low base (pre-buy impact of BS-3 to BS-4 shift).
M&HCV volumes, which account for 70.7% of total volumes, grew 98.2% YoY (-47.4%
MoM) to 8.9k units (est. of 13k units).
LCVs grew 45% YoY to 3.7k units (est. of 4.8k units).
The stock trades at 22.3x/17.5x FY19E/20E EPS, and at 12.4x/9.7x EV/EBITDA.
Maintain Buy.
Snapshot of volumes for Apr-18
Company Sales
Ashok Leyland
CV (ex LCV)
LCV
Apr-18
12,677
8,968
3,709
MoM
YoY (%)
MoM
Apr-17
Mar-18
chg
(%) chg
7,083
79.0 22,453 -43.5
4,525
98.2 17,057 -47.4
2,558
45.0
5,396
-31.3
YoY
FY19
YTD
12,677
8,968
3,709
FY18
YTD
7,083
4,525
2,558
(%) chg
79.0
98.2
45
FY19
estimate
198,067
146,327
51,740
Residual FY19 YTD
Monthly Monthly
Gr. (%)
Run rate Run rate
13.3
16,854 12,677
11.4
12,487
8,968
19.1
4,366
3,709
3 May 2018
20

March 2018 Results Preview | Sector: Oil & Gas
Castrol (India)
Bloomberg
Equity Shares (m)
M. Cap. (INR b)/(USD b)
52-Week Range (INR)
1,6,12 Rel Perf. (%)
CSTRL IN
989.1
203 / 3
227 / 172
4 / 9 / -17
CMP: INR205
TP: INR247 (+21%)
Buy
We expect revenue to grow 3% YoY (-7% QoQ) to INR9.1b, led by
volumes at 51.2m liters (+2% YoY, -3% QoQ) and realization at
INR177/liter (+1% YoY, -1% QoQ).
We expect CSTRL to report EBITDA of INR2.6b (-2% YoY, -16%
QoQ). EBITDA margin would be 28.6%, lower than 29.8% in
1QCY17.
We estimate net profit at INR1.7b (-3% YoY, -12% QoQ).
The stock trades at 28.9x CY19E EPS of INR7.1. Maintain Buy.
Financial Snapshot (INR b)
Y/E Dec
2016 2017 2018E 2019E
Sales
EBITDA
PAT
EPS (INR)
EPS Gr. (%)
BV/Sh.(INR)
RoE (%)
RoCE (%)
Payout (%)
Valuations
P/E (x)
P/BV (x)
EV/EBITDA (x)
Div. Yield (%)
30.0
20.7
19.5
2.7
29.2
19.9
18.8
2.3
30.0
18.7
18.8
2.5
28.9
17.4
19.1
2.6
33.6
9.9
6.7
6.8
5.8
9.9
86.3
86.4
97.4
35.8
10.3
6.9
7.0
2.9
10.3
69.1
69.2
81.5
36.8
10.0
6.7
6.8
-2.8
11.0
63.8
63.9
90.0
37.6
9.7
7.0
7.1
4.0
11.7
62.3
62.4
90.0
Key issues to watch for
(a) Volume growth.
(b) Operating margin expansion.
(c) Launch of new products.
(d) Competitive pressure from other players.
Quarterly Performance
Y/E December
Net Sales
YoY Change (%)
Total Expenditure
EBITDA
YoY Change (%)
Margins (%)
Depreciation
Interest
Other Income
PBT
Tax
Rate (%)
PAT
YoY Change (%)
Margins (%)
E: MOSL Estimates
1Q
8,822
3.5
6,189
2,633
4.7
29.8
123
3
185
2,692
902
34
1,790
3.8
20.3
CY17
2Q
8,704
-10.1
6,609
2,095
-33.4
24.1
118
1
155
2,131
752
35
1,379
-33.3
15.8
3Q
8,614
13.1
6,078
2,536
19.1
29.4
111
2
333
2,756
974
35
1,782
27.5
20.7
4Q
9,703
24.5
6,637
3,066
41.7
31.6
103
6
164
3,121
1,154
37
1,967
26.3
20.3
1QE
9,062
2.7
6,473
2,590
-1.7
28.6
115
3
200
2,672
935
35
1,736
-3.0
19.2
CY18E
2QE
9,328
7.2
6,673
2,655
26.7
28.5
128
4
224
2,747
961
35
1,785
29.5
19.1
(INR Million)
CY17
CY18E
3QE
8,888
3.2
6,672
2,216
-12.6
24.9
125
4
210
2,297
804
35
1,493
-16.2
16.8
4QE
9,537
-1.7
7,027
2,510
-18.1
26.3
108
4
229
2,626
919
35
1,707
-13.2
17.9
35,843
6.7
25,513
10,330
3.8
28.8
455
12
837
10,700
3,782
35
6,918
2.5
19.3
36,816
2.7
26,845
9,970
-3.5
27.1
476
15
863
10,342
3,620
35
6,722
-2.8
18.3
3 May 2018
21

March 2018 Results Preview | Consumer
Emami
Bloomberg
Equity Shares (m)
M. Cap. (INR b)/(USD b)
52-Week Range (INR)
1,6,12 Rel Perf. (%)
HMN IN
227.0
249 / 4
1428 / 1000
4 / -5 / -7
CMP: INR1,099 TP: INR1,475 (+34%)
Buy
We project Emami’s (HMN) sales to grow ~9% YoY to INR6.3b,
with ~8% domestic volume growth on a base of negative volume
growth.
Gross margin is likely to remain flattish at 62.2% in 4QFY18.
Mentha prices are up sharply by 48% YoY and down 5% QoQ in
the quarter.
We expect EBITDA margin to contract 80bp to 30%. EBITDA is
likely to grow ~6% YoY to INR1.9b.
PAT before amortization is expected to decline 3.4% YoY to
INR1.4b due to a high tax rate of 15.4% (full-year tax rate taken at
MAT) compared to 6.9% in the base quarter 4QFY17.
The stock trades at 35.5x/29.8x FY19E/20E EPS of
INR31.0/INR36.9; maintain Buy.
Financial Snapshot (INR b)
Y/E March
2017 2018E 2019E 2020E
Sales
EBITDA
NP
EPS (INR)
EPS Gr. (%)
BV/Sh. (INR)
RoE (%)
RoCE (%)
Payout (%)
Valuations
P/E (x)
P/BV (x)
EV/EBITDA (x)
Div. Yld (%)
41.4
14.2
33.3
0.8
43.9
12.3
34.0
0.8
35.5
10.9
27.0
0.8
29.8
10.7
23.1
0.8
24.9
7.6
6.0
26.5
4.5
77.3
35.8
31.0
33.0
25.5
7.3
5.7
25.0
-5.7
30.1
29.3
35.2
30.3
9.2
7.0
31.0
23.8
32.6
37.3
29.0
34.8
10.7
8.4
36.9
19.1
36.2
42.9
24.9
89.1 101.2 102.9
Key issues to watch for
Volume growth and broad consumer demand across categories.
Recovery in wholesale channel.
Outlook for mentha oil prices.
Competitive intensity, especially from Patanjali.
Quaterly performance
Y/E MARCH
Domestic volume Growth (%)
Net Sales
YoY Change (%)
COGS
Gross Profit
Gross margin (%)
Other Expenditure
% to sales
EBITDA
Margins (%)
YoY Change
Depreciation
Interest
Other Income
PBT
Tax
Rate (%)
PAT before Amortization
YoY Change (%)
Amortization
Reported PAT
E: MOSL Estimates
1Q
18.0
6,454
20.1
2,287
4,167
64.6
2,695
41.8
1,473
22.8
49.2
106
125
51
1,292
117
9.1
1,175
18.0
609
567
FY17
2Q
11.0
5,728
8.0
1,848
3,880
67.7
2,128
37.1
1,752
30.6
15.1
111
160
87
1,568
230
14.7
1,336
9.6
680
661
3Q
0.2
7,138
-1.5
2,227
4,911
68.8
2,325
32.6
2,585
36.2
3.7
112
127
82
2,428
381
15.7
2,047
4.8
705
1,342
4Q
-1.5
5,777
-4.4
2,184
3,594
62.2
1,812
31.4
1,781
30.8
-4.7
140
168
92
1,565
108
6.9
1,456
-6.6
623
833
1Q
-18.0
5,411
-16.2
1,967
3,444
63.6
2,642
48.8
802
14.8
-45.6
153
79
65
635
28
4.4
605
-48.5
598
10
FY18
2Q
10.0
6,281
9.7
2,053
4,228
67.3
2,215
35.3
2,013
32.1
14.9
146
104
53
1,817
227
12.5
1,590
19.0
604
987
FY17
3Q
6.0
7,566
6.0
2,334
5,233
69.2
2,586
34.2
2,647
35.0
2.4
195
92
55
2,414
338
14.0
2,077
1.4
604
1,471
4QE
8.0
6,291
8.9
2,376
3,916
62.2
2,029
32.3
1,886
30.0
5.9
194
86
57
1,663
256
15.4
1,407
-3.4
593
814
6.9
25,097
4.7
8,546
16,552
65.9
8,960
35.7
7,591
30.2
10.5
469
580
311
6,853
836
12.2
6,014
5.0
2,617
3,403
FY18E
1.5
25,550
1.8
8,729
16,821
65.8
9,472
37.1
7,348
28.8
-3.2
687
362
230
6,529
849
13.0
5,680
-5.6
2,400
3,280
3 May 2018
22

March 2018 Results Preview | Sector: Technology
Hexaware Technologies
Bloomberg
Equity Shares (m)
M. Cap. (INR b)/(USD b)
52-Week Range (INR)
1,6,12 Rel Perf. (%)
HEXW IN
301.8
125 / 2
420 / 200
23 / 51 / 82
CMP: INR416
TP: INR340 (-18%)
Neutral
Financial Snapshot (INR b)
y/e Dec
2016 2017E 2018E 2019E
Sales
EBITDA
PAT
EPS (INR)
EPS Gr. (%)
BV/Sh. (INR)
RoE (%)
RoCE (%)
Payout (%)
Valuation
P/E (x)
P/BV (x)
EV/EBITDA (x)
Div yld (%)
30.2
7.3
20.4
1.3
24.9
6.3
17.7
1.0
22.1
5.4
15.9
1.9
19.7
4.7
13.6
1.9
35.3
5.7
4.2
13.7
5.8
56.3
26.5
24.2
38.6
39.4
6.6
5.0
16.6
21.2
66.0
26.9
24.6
23.5
44.8
7.4
5.6
18.7
12.7
76.3
26.1
25.3
41.6
51.1
8.4
6.3
21.0
12.5
87.7
25.6
25.3
37.0
We expect USD revenue to increase by 3.6% and CC revenue to
grow by 3%.
Ramp-down in key customers is now behind, and we expect the
company to start delivering towards its stated outlook for CY18,
which requires a CQGR of 3% through the year.
We expect stability in EBITDA margins at 16% (+10bp QoQ).
Pressure from customer ramp-downs, wage hikes and transition
costs impacted margins in the two quarters before this.
Our PAT estimate for the quarter is INR1,316m, up 8.6% from the
previous quarter, on the back of revenue growth, stable margins
and higher other income.
The stock trades at 22.1x CY18E and 19.7x CY19E earnings.
Neutral.
Key issues to watch for
Large deal pipeline and traction post the increased S&M spend.
Health of top customers.
Margin outlook now that the revenue pressures are behind.
Quarterly Performance (Indian GAAP)
Y/E Dec
Revenue (USD m)
QoQ (%)
Revenue (INR m)
YoY (%)
GPM (%)
SGA (%)
EBITDA
EBITDA Margin (%)
EBIT Margin (%)
Other income
ETR (%)
PAT
QoQ (%)
YoY (%)
EPS (INR)
Headcount
Utilization (%)
Attrition (%)
Offshore rev. (%)
E: MOSL Estimates
1Q
144.7
4.2
9,605
17.1
34.1
17.2
1,623
16.9
15.3
28
23.8
1,139
-6.3
35.3
3.8
12,734
78.9
14.9
35.5
CY17
2Q
152.6
5.5
9,836
13.1
33.7
17.4
1,598
16.2
14.6
146
22.9
1,224
7.4
22.5
4.1
13,098
80.8
13.8
35.3
3Q
154.0
0.9
9,931
9.8
35.2
17.7
1,734
17.5
15.8
178
18.9
1,420
16.0
27.5
4.7
13,488
79.7
13.7
34.6
4Q
156.1
1.4
10,048
6.8
32.8
16.9
1,599
15.9
14.3
132
23.0
1,211
-14.7
-0.4
4.0
13,705
80.9
13.1
34.9
1QE
161.8
3.6
10,414
8.4
32.4
16.4
1,662
16.0
14.4
154
20.5
1,316
8.6
15.5
4.4
14,489
78.0
33.9
CY18
2QE
3QE
168.5
176.8
4.1
4.9
11,037 11,583
12.2
16.6
33.6
33.8
17.0
16.5
1,837
2,004
16.6
17.3
15.2
15.9
89
66
20.5
20.5
1,402
1,515
6.6
8.1
14.6
6.7
4.7
5.0
15,037 15,821
79.0
79.0
34.5
34.6
CY17
4QE
179.4
1.5
11,754
17.0
32.3
16.5
1,861
15.8
14.4
62
20.5
1,398
-7.8
15.4
4.6
16,291
77.0
34.0
607
15.7
39,420
11.5
33.9
17.3
6,554
16.6
15.0
484
22.0
4,994
19.7
16.6
13,705
81.4
35.1
(INR m)
CY18E
687
13.0
44,788
13.6
33.0
16.6
7,364
16.4
15.0
371
20.5
5,630
12.7
18.7
16,291
79.9
34.2
3 May 2018
23

March 2018 Results Preview | Sector: Infrastructure
IRB Infra
Bloomberg
Equity Shares (m)
M. Cap. (INR b)/(USD b)
52-Week Range (INR)
1,6,12 Rel Perf. (%)
IRB IN
351.5
85 / 1
272 / 194
9 / 9 / -11
CMP: INR242
TP: INR240 (-1%)
Neutral
IRB is expected to register flattish revenue growth of 1% YoY to
INR16.4b on account of transfer of BoT projects to InvIT.
EBITDA is expected to register growth of 1.4% YoY to INR8.3b.
EBITDA margin is expected to improve 30bp YoY to 51%.
PAT is expected to improve 31% YoY to INR2.5b led by higher other
income and lower tax rate for the quarter.
IRB won orders worth INR89b in the HAM and BoT segments.
Financial Snapshot (INR b)
Y/E March
2017 2018E 2019E 2020E
Net Sales
EBITDA
PAT
EPS (INR)
EPS Gr. (%)
BV/Sh. INR
RoE (%)
RoCE (%)
Valuations
P/E (x)
P/BV (x)
EV/EBITDA (x)
Div Yield (%)
* Consolidated
67.9
1.0
27.8
0.9
31.0
1.0
15.2
1.9
38.7
1.0
15.1
1.5
26.3
1.0
11.5
2.3
282.2
8.3
4.9
1.3
NM
88.0
1.5
0.7
291.0
14.2
10.8
2.9
119.0
88.9
3.3
2.5
311.2 354.9
15.5
8.6
2.3
-19.9
89.6
2.6
1.7
22.5
12.7
3.5
-19.9
90.7
3.8
3.0
Key issues to watch
Execution timelines for the recently-won HAM projects.
Impact on the EPC margins of the company once execution of
lower-margin HAM projects starts.
Quarterly Performance (INR m)
Y/E March
Net Sales
YoY Change (%)
Total Expenditure
EBITDA
Margins (%)
Depreciation
Interest
Other Income
PBT before EO expense
Extra-Ord expense
PBT
Tax
Rate (%)
Min Int & P/Lof Asso. Cos.
Reported PAT
Adj PAT
YoY Change (%)
Margins (%)
1Q
15,173
36.8
7,434
7,740
51.0
2,207
3,282
308
2,558
0
2,558
740
28.9
0
1,818
1,818
10.4
12.0
FY17
2Q
12,906
12.3
5,816
7,090
54.9
2,274
3,396
336
1,757
0
1,757
335
19.1
0
1,422
1,422
-4.6
11.0
3Q
14,109
5.8
6,674
7,435
52.7
1,803
3,389
298
2,541
0
2,541
699
27.5
0
1,842
1,842
8.6
13.1
4Q
16,271
5.9
8,053
8,218
50.5
2,264
3,260
289
2,983
0
2,983
911
30.5
0
2,072
2,072
37.1
12.7
1Q
18,169
19.7
9,991
8,178
45.0
1,816
2,854
535
4,044
0
4,044
1,665
41.2
0
2,379
2,379
30.8
13.1
FY18E
2Q
3Q
11,227
12,962
-13.0
-8.1
5,503
6,222
5,724
6,740
51.0
52.0
1,260
1,212
2,356
2,366
424
455
2,532
3,616
1,041
0
3,573
3,616
1,225
1,100
34.3
30.4
2
2
2,346
2,514
1,503
2,514
5.7
36.5
13.4
19.4
FY17
4QE
16,416
0.9
8,078
8,338
50.8
1,418
3,588
376
3,707
0
3,707
987
26.6
2
2,718
2,718
31.2
16.6
58,459
14.0
27,976
30,483
52.1
8,548
13,327
1,232
9,839
0
9,839
2,685
27.3
8
7,146
7,146
11.8
12.2
FY18E
58,774
0.5
29,793
28,981
49.3
5,706
11,165
1,790
13,899
0
13,899
4,977
35.8
6
8,916
8,916
24.8
15.2
3 May 2018
24

March 2018 Results Preview | Sector: Utilities
JSW Energy
Bloomberg
Equity Shares (m)
M. Cap. (INR b)/(USD b)
52-Week Range (INR)
1,6,12 Rel Perf. (%)
JSW IN
1640.1
130 / 2
98 / 60
0 / -1 / 12
CMP: INR79
TP: INR53 (-33%)
Sell
Financial Snapshot (INR Million)
y/e march
2017 2018E 2019E 2020E
Sales
EBITDA
NP
EPS (INR)
EPS Gr. (%)
BV/Sh. (INR )
RoE (%)
RoCE (%)
Payout (%)
VALUATION
P/E (x)
P/BV (x)
EV/EBITDA (x)
Div. Yield (%)
21.0
1.3
8.5
2.5
21.2
1.2
9.6
2.5
22.5
1.2
9.4
2.5
20.3
1.2
9.1
2.5
826.3
33.2
6.3
3.8
-51.5
63.2
6.3
8.6
52.1
815.4
28.6
6.2
3.8
-0.9
64.6
5.9
7.8
52.6
845.6
29.0
5.9
3.6
-5.6
65.8
5.5
7.5
55.7
918.0
31.3
6.5
4.0
10.5
67.3
6.0
7.5
50.4
We estimate JSW Energy’s EBITDA to decline 11% YoY to INR5.2b
on lower generation at Hydro and merchant power plants.
Vijaynagar PLF is estimated at 45% v/s 77% in the previous year.
Imported coal prices are estimated to be broadly flat QoQ at
USD84/t. Sell.
Key issues to watch for
International coal prices.
Short-term power market prices.
Consolidated performance
Y/E March
Net Sales
YoY Change (%)
Total Expenditure
EBITDA
Margins (%)
Depreciation
Interest
Other Income
PBT before EO expense
PBT
Tax
Rate (%)
MI and Associates
Reported PAT
Adj PAT
YoY Change (%)
1Q
24,500
16.3
13,328
11,173
45.6
2,398
4,293
416
4,899
4,899
1,248
25.5
-14
3,665
3,665
32.1
FY17
2Q
3Q
20,470 19,043
-19.1
-28.1
10,843 12,468
9,627
6,575
47.0
34.5
2,471
2,444
4,356
4,229
516
505
3,316
407
3,316
407
1,167
249
35.2
61.2
-25
-56
2,174
214
2,174
214
-42.3
-93.3
4Q
18,621
-30.6
12,752
5,869
31.5
2,379
3,970
732
253
253
22
8.6
-11
242
242
-92.1
1Q
22,316
-8.9
13,628
8,688
38.9
2,428
3,963
1,025
3,323
3,323
1,114
33.5
36
2,173
2,173
-40.7
FY18E
2Q
3Q
20,490 19,932
0.1
4.7
11,667 14,079
8,824
5,853
43.1
29.4
2,449
2,407
3,910
3,406
1,705
879
4,170
920
4,170
920
1,202
198
28.8
21.5
-1
254
2,969
469
2,969
469
36.6
119.1
(INR Million)
FY17
FY18E
4QE
18,803
1.0
13,568
5,235
27.8
2,417
3,351
994
461
461
60
13.0
-224
625
625
158.0
82,634
-17.1
49,391
33,244
40.2
9,692
16,848
2,170
8,875
8,875
2,685
30.3
-106
6,295
6,295
-51.2
81,541
-1.3
52,942
28,600
35.1
9,700
14,629
4,604
8,874
8,874
2,574
29.0
66
6,235
6,235
-1.0
3 May 2018
25

March 2018 Results Preview | Sector: Financials
L&T Finance
Bloomberg
Equity Shares (m)
M. Cap. (INR b)/(USD b)
52-Week Range (INR)
1,6,12 Rel Perf. (%)
LTFH IN
1817.2
295 / 5
214 / 119
2 / -23 / 20
CMP: INR162
TP: INR240 (+48%)
Buy
Financial Snapshot (INR b)
Y/E March
NII
PPP
PAT
EPS (INR)
BV/Sh. INR
RoAA (%)
RoE (%)
Payout (%)
Valuation
P/E (x)
P/BV (x)
Div. Yld (%)
2017
31.4
26.7
9.2
5.2
44.3
1.3
12.4
19.8
30.9
3.7
0.6
2018E
37.2
36.1
13.3
6.7
61.7
1.7
13.3
15.2
24.1
2.6
0.5
2019E 2020E
43.6
43.5
17.8
9.0
69.3
1.9
13.7
14.9
18.1
2.3
0.7
50.0
51.4
22.5
11.3
79.0
2.1
15.3
14.7
14.3
2.1
0.9
The company is likely to report strong numbers in the rural and
housing finance segment. Performance in the wholesale finance
segment is a key monitorable.
We expect 22% YoY growth in the focus segments, driven by
33%/47%/11% YoY growth in the rural/housing/wholesale
segments. AUM (including de-focused book) is likely to cross
INR790b.
Total income is likely to grow 33% YoY, driven by loan mix (rural
and housing have higher margins than wholesale finance) and
increased contribution from non-fund-based businesses.
Asset quality is likely to remain stable. We model provisions of
INR5.4b, as against INR4.9b in 3QFY18 and INR6.9b in 4QFY17.
The stock trades at 2.3x FY19E and 2.1x FY20E BV. Maintain Buy.
Key issues to watch for
Commentary on outlook for rural and housing finance segment.
Competition in the wholesale finance segment, especially
renewables.
Asset quality outlook in the builder financing segment.
RoE target post capital infusion.
Quarterly performance
Y/E March
Interest Income
Interest Expenses
Net Interest Income
YoY Growth (%)
Other income
Total Income
YoY Growth (%)
Operating Expenses
YoY Growth (%)
Operating Profits
YoY Growth (%)
Provisions
Profit before Tax
Tax Provisions
P/L of Associate Company
Profit after tax
YoY Growth (%)
Loan growth (%)
Cost to Income Ratio (%)
Tax Rate (%)
E: MOSL Estimates
1Q
19,965
11,557
8,408
14.7
342
8,751
13.1
3,222
3.6
5,529
19.4
2,530
2,999
951
26
2,074
8.2
18.2
36.8
31.7
FY17
2Q
20,876
11,532
9,343
17.4
540
9,883
17.7
3,327
-1.9
6,557
31.0
3,202
3,354
888
15
2,481
16.3
18.5
33.7
26.5
3Q
20,940
11,602
9,338
16.0
679
10,018
17.9
3,154
-1.4
6,864
29.7
3,282
3,582
811
(63)
2,709
28.7
10.4
31.5
34.5
4Q
21,626
11,580
10,046
20.9
755
10,801
22.3
3,063
-10.7
7,738
43.2
6,885
853
-2,286
19
3,158
34.3
14.4
28.4
-267.9
1Q
22,587
12,326
10,261
22.0
1,071
11,332
29.5
3,277
1.7
8,055
45.7
4,587
3,468
378
2
3,092
49.1
17.2
28.9
10.9
FY18E
2Q
3Q
23,838
26,302
12,967
13,596
10,871
12,706
16.4
36.1
1,109
709
11,980
13,415
21.2
33.9
3,419
4,006
2.8
27.0
8,561
9,409
30.6
37.1
4,707
4,928
3,855
4,480
230
636
(22)
(4)
3,602
3,841
45.2
41.8
18.8
22.6
28.5
29.9
6.0
14.2
FY17
4QE
27,138
14,284
12,854
28.0
1,553
14,407
33.4
4,313
40.8
10,094
30.4
5,444
4,650
663
15
4,002
26.7
18.7
29.9
14.3
83,406
46,270
37,136
17.3
2,317
39,453
17.9
12,765
-2.8
26,688
31.2
15,899
10,789
364
-3
10,427
87
10.4
32.4
3.4
(INR M)
FY18
99,865
53,173
46,692
25.7
4,441
51,133
29.6
15,014
17.6
36,119
35.3
19,665
16,454
1,907
-9
14,556
39.6
19.6
29.4
11.6
3 May 2018
26

March 2018 Results Preview | Sector: Financials
PNB Housing Finance
Bloomberg
Equity Shares (m)
M. Cap. (INR b)/(USD b)
52-Week Range (INR)
1,6,12 Rel Perf. (%)
PNBHOUSI IN
165.6
211 / 3
1715 / 1006
7 / -22 / -6
CMP: INR1,273 TP: INR1,750 (+37%)
Buy
Financial Snapshot (INR b)
Y/E March
NII
PPP
PAT
EPS (INR)
BV/Sh. (INR)
RoAA (%)
RoE (%)
Payout (%)
P/E (x)
P/BV (x)
Div. Yield (%)
2017 2018E 2019E 2020E
10.0
15.1
21.0
27.4
9.1
15.1
20.9
27.6
5.2
8.4
11.2
14.6
31.6
50.9
67.5
88.1
329.5 369.8 423.2 492.9
1.4
1.5
1.4
1.3
13.8
14.6
17.0
19.2
22.8
20.9
20.9
20.9
40.3
25.0
18.9
14.5
3.9
3.4
3.0
2.6
0.5
0.7
1.0
1.2
The company will continue its robust growth trajectory. AUM is
expected to grow 12% QoQ and 55% YoY to INR644b.
Calculated margins are likely to decline ~40bp YoY/ 14bp QoQ to
2.9%, led by a decline in yields.
As a result, total income is expected to grow 37% YoY to INR5.5b.
Asset quality is likely to remain largely stable. GNPL ratio in the
prior quarter was 0.42%.
We estimate provisions of INR594m as against INR561m in 3QFY18.
PAT is expected to grow 53% YoY to INR2.33b.
The stock trades at 3x FY19E and 2.6x FY20E BV. Maintain Buy.
Key issues to watch for
Management commentary on business growth and steps taken to
sustain AUM growth.
Impact of RERA.
Plans of branch expansion.
Movement in yields and margins, with declining cost of funds.
Quarterly performance (INR m)
Y/E March
Interest Income
Interest Expenses
Net Interest Income
YoY Growth (%)
Other income
Total Income
YoY Growth (%)
Operating Expenses
YoY Growth (%)
Operating Profits
YoY Growth (%)
Provisions
Profit before Tax
Tax Provisions
Profit after tax
YoY Growth (%)
Loans growth (%)
Cost to Income Ratio (%)
Tax Rate (%)
E: MOSL Estimates
1Q
8,172
6,080
2,092
457
2,549
797
1,752
280
1,472
513
959
FY17
2Q
9,130
6,847
2,284
572
2,856
1,008
1,848
-225
2,073
696
1,377
3Q
9,376
6,731
2,645
611
3,257
870
2,387
308
2,079
702
1,378
41.2
26.7
33.7
4Q
10,106
6,779
3,327
654
3,981
898
3,083
667
2,416
892
1,524
41.8
22.6
36.9
31.3
34.8
35.3
33.6
1Q
10,965
7,529
3,436
64.2
958
4,394
72.4
1,082
35.7
3,312
89.1
481
2,831
984
1,848
92.6
42.4
24.6
34.7
FY18E
2Q
12,225
8,361
3,865
69.2
933
4,798
68.0
1,101
9.2
3,697
100.1
503
3,194
1,114
2,080
51.1
51.2
23.0
34.9
3Q
13,357
9,250
4,107
55.2
1,029
5,136
57.7
1,237
42.2
3,899
63.3
561
3,339
1,164
2,175
57.8
61.1
24.1
34.9
4QE
14,685
10,310
4,375
31.5
1,080
5,455
37.0
1,293
44.0
4,162
35.0
594
3,568
1,239
2,330
52.9
61.1
23.7
34.7
FY17
36,785
26,437
10,348
45.3
2,294
12,642
50.6
3,573
41.7
9,069
54.5
1,029
8,040
2,803
5,237
60.0
41.8
28.3
34.9
FY18E
51,233
35,450
15,783
52.5
4,000
19,783
56.5
4,712
31.9
15,070
66.2
2,138
12,932
4,500
8,432
61.0
61.1
23.8
34.8
3 May 2018
27

March 2018 Results Preview | Sector: Metals
Vedanta
Bloomberg
Equity Shares (m)
M. Cap. (INR b)/(USD b)
52-Week Range (INR)
1,6,12 Rel Perf. (%)
VEDL IN
3717.0
1056 / 16
356 / 218
-10 / -17 / -7
CMP:INR284
TP: INR346 (+22%)
Buy
Financial Snapshot (INR Billion)
Y/E March
2017 2018E 2019E 2020E
Sales
EBITDA *
NP
Adj. EPS (INR)
EPS Gr (%)
BV/Sh. (INR)
RoE (%)
RoCE (%)
Payout (%)
Valuation
P/E (x)
P/BV
EV/EBITDA, x*
Div. Yield (%)
18.8
1.7
8.2
6.8
12.4
1.8
7.5
7.5
8.5
1.6
5.5
3.7
7.3
1.4
4.7
4.3
162.7
9.7
12.4
154.2
722.3
175.5
56.3
15.1
886
198.2
84.8
22.8
50.7
159.9
14.1
14.0
111.5
1,041
258.5
124.2
33.4
46.4
176.8
19.8
18.4
37.5
1,123
286.2
144.6
38.9
16.4
196.8
20.8
19.4
37.4
We expect VEDL’s EBITDA to increase 7% QoQ (down 1% YoY) to
INR72b, driven by oil, aluminum and iron ore. Adjusted PAT is
estimated to increase 28% QoQ to INR28.4b on higher other
income and lower tax rate.
Aluminum:
EBITDA is expected to increase by 16% QoQ to
INR7.1b, driven by higher LME (up ~USD65/t) and volumes (up 4%
QoQ to 444kt), partly offset by higher costs.
Zinc India:
EBITDA is expected to increase 5% QoQ to INR34.1b on
higher zinc and silver volumes.
Power:
EBITDA is expected to decline 17% QoQ to INR4.9b off a
stronger base.
Copper:
EBITDA is expected to increase 7% QoQ to INR3.2b.
Oil & Gas:
EBITDA is expected to increase 17% QoQ to INR15.8b
on higher oil prices and volumes.
Key issues to watch for
Progress on ramp-up of 1.25mtpa smelter.
Movement in base metal prices.
Quarterly Performance (Consolidated)
Y/E March
Net Sales
Change (YoY %)
EBITDA
Copper
Aluminum
Iron ore
Power
Zinc-India
Zinc-International
Oil&Gas
Others
Finance cost
DD&A
Other Income
PBT (before EO item)
EO exp. (income)
PBT (after EO item)
Total Tax
% Tax
Reported PAT
Profit from Asso.
Minority interest
Adjusted PAT
Change (YoY %)
1Q
144,371
-15.2
34,396
4,379
2,660
3,730
3,870
11,309
2,490
7,937
-1,978
13,931
14,920
10,935
16,480
0
16,480
4,914
29.8
11,567
0
5,417
6,150
-56.4
FY17
2Q
3Q
158,596 194,171
-4.2
30.5
46,674
59,964
3,779
4,479
4,200
6,520
1,050
4,710
4,030
4,452
20,767
27,834
3,390
2,020
10,391
10,837
-934
-887
14,503
15,082
15,289
15,203
12,521
9,160
29,403
38,840
0
0
29,403
38,840
6,623
8,968
22.5
23.1
22,780
29,872
2
-20
10,261
11,188
12,521
18,663
50.1 -1,124.9
4Q
225,113
40.9
73,501
4,312
9,900
3,870
4,565
37,480
1,380
11,210
784
15,035
16,037
9,208
51,637
1,144
50,493
20,604
40.8
29,889
-8
15,775
15,249
34.8
1Q
182,850
26.7
48,740
2,130
5,280
400
1,100
23,840
3,210
13,850
-1,070
15,920
13,860
10,550
29,510
0
29,510
6,810
23.1
22,700
0
7,450
15,250
148.0
FY18
2Q
3Q
215,900 243,610
36.1
25.5
56,690
67,630
3,920
2,970
4,570
6,100
-40
2,310
3,660
5,950
30,240
32,440
3,890
4,460
11,760
13,590
-1,310
-190
13,840
13,060
14,260
15,490
8,760
5,730
37,350
44,810
-1,860
1,580
39,210
43,230
9,350
13,640
23.8
31.6
29,860
29,590
0
0
8,950
9,060
19,050
22,110
52.1
18.5
FY17
4QE
243,595
8.2
72,488
3,180
7,057
3,115
4,933
34,136
4,228
15,839
13,001
15,645
7,500
51,342
51,342
14,092
27.4
37,250
15
8,859
28,406
86.3
(INR Million)
FY18E
722,250
12.4
213,319
16,926
23,057
13,224
16,425
95,302
9,261
40,132
-1,008
58,550
62,915
45,806
137,660
1,144
136,516
37,783
27.7
98,733
-27
43,584
56,266
-73.8
885,955
22.7
245,548
12,200
23,007
5,785
15,643
120,656
15,788
55,039
-2,570
55,821
59,255
32,540
163,012
-280
163,292
43,892
26.9
119,400
15
34,319
84,816
50.7
3 May 2018
28

In conversation
1. DHFL : Not seeing any kind of stress on loan against property
segment; Harshil Mehta, Joint MD and CEO
Compared to last year, the numbers look good, predominantly riding on the
affordable housing story cutting across the outskirts and tier II, tier III markets.
Did see good uptick in home loans business. At the same time, there was also
good uptick with respect to loan against property and SME business on the back
of GST implementation.
Profitability predominantly comes from the home loan business because at a
portfolio business and at an AUM level more than two thirds continue to be the
retail home loans.
On loan against property, ticket size continues to be retail at about Rs 40-45 lakh
which tells the granularity of that business. To that extent company is not seeing
any kind of stress.
2. DABUR : Expect international business to grow in double-digit;
Sunil Duggal, Chief Executive Officer
Saw some improvement in rural demand in March and going forward, given
good monsoon and other stimulus, the HPC would grow at high single digits and
the company would be able to beat that with a double-digit growth in the first
quarter.
House and personal care (HPC) category is still around 5-5.5%, which is not very
good but the company has managed to beat that with 7-8%.
Do not expect improvement in gross margins going forward and expect them to
sustain at current levels in the first half.
The downsides which happened on account of competitiveness is largely behind.
Expect international business to grow in double-digit on back of high margins
products doing better.
Regarding volume growth, company hopes to be around 8-10% in H1FY19 and
expect to do better than that in H2.
3. L&T : We sold automation business because it's capital
intensive; SN Subrahmanyan, Managing Director and Chief
Executive Officer
Transaction took time since it was an international deal.
E&A business is one of the oldest business of the company. Has been with
company for the last five-six decades.
Have done a share purchase and business transaction agreement and the
process has to go through the necessary normal regulatory approvals including
Competitive Commission of India’s approvals. So that is a process that will take
time.
Electric and automation (E&A) business required a fair amount of capital
spending and did not fit into the industrial culture of company.
Moving on to focus more on infra, construction, EPC projects. Will focus more
on manufacturing, defence & services.
3 May 2018
29

From the think tank
1. The Centre needs more resources, not less
A former chief minister of a state was irked with the conditionalities imposed by
the erstwhile Planning Commission (PC). He said: “You earmark money for
schemes that are not needed for my state. When I need money for water, you
give it for roads.” That chief minister became the prime minister, and one of his
first actions was to shut down the PC. Of course, he wasn’t the only chief minister
who had tiffs with the PC. The PC had no constitutional basis, nor was it set up
with Parliament’s approval. It was the result of an executive order, and so was its
shutting down. Over many decades, the PC acquired enormous fiscal power and
implied discretion in the allocation of funds to various states for developmental
projects and schemes. This clout coloured centre-state relations, since,
technically, the PC was simply giving money that anyway belonged to the states,
except that it came with strings attached. Its funding was carved out of the Union
budget as gross budgetary support.
2. Are we reading too much into Aditya Ghosh’s resignation?
Developments at Interglobe Aviation Ltd, the parent company of IndiGo, may
seem to suggest that something sinister was behind the departure of its long-
term president Aditya Ghosh, after what can only be described as a spectacular
10 years at the country’s leading airline. Sure, IndiGo has in recent months faced
some headwinds, in particular the problem with the Airbus A320neo aircraft
powered by Pratt & Whitney engines, which forced it to cancel thousands of
flights. There have been other problem areas as well including a rather
unnecessary face-off with the government over temporarily moving part of its
operations to a new terminal in Delhi. But to say that Ghosh was directly
responsible for any of these would be a bit churlish. Indeed, given how quickly
the airline resumed normal operations after both events indicates the
operational robustness the 42-year-old CEO had built, as much a key to its
success, as its tight financial management.
3. The difficulty of making sense of Indian jobs data
The jobs debate has kept economists busy. Their estimates of how many jobs are
being created in India vary wildly. Consider the most recent disagreement. Surjit
Bhalla of The Observatory Group estimates that 15 million jobs were created in
fiscal year 2017. Mahesh Vyas of the Centre for Monitoring Indian Economy
believes the number is barely a tenth of that. Their exchange should be seen
against the wider debate on whether India has been growing without generating
enough jobs for a young population. Indian labour market data is devilishly
difficult to analyse. There are several reasons why this is so. First, a large part of
the labour force is in the informal sector, where information is very difficult to
collect on a monthly basis. Second, sample survey data is often confusing because
of the withdrawal of women from the labour force over the past 15 years. Third,
employment numbers for the young need to be handled with care since more
children are staying back in college rather than seeking work. Fourth, the
formalization of the Indian economy means that there are profound structural
shifts taking place in the composition of the labour force.
3 May 2018
30

4. Hole in a pocket: story of Indian health spend
Public health expenditure (PHE) accounted for 1.03% of India’s gross domestic
product (GDP) in 2002, according to the World Health Organization (WHO)
global health expenditure database. The same year, the National Health Policy
(NHP) declared the government’s intention to increase PHE to 2-3% of the gross
domestic product (GDP). Not much has changed since then. In 2014, WHO data
showed that India’s PHE as a percentage of GDP stood at 1.41%. The
government’s own National Health Profile 2017 pegs this at 0.98% in 2014,
rising to 1.18% in 2017. India is ranked among the worst nations on this
parameter, flanked by Madagascar at 1.47 and Turkmenistan at 1.35. Typical
points of reference, such as the BRICS nations, are each at well above 3%. Even a
small South Asian nation like Sri Lanka spends 1.96% of GDP on public health.
While spending is small, even these funds are not utilized entirely. The centre
and states are jointly responsible for this situation. Health is a state subject as
per the Constitution. The centre is involved in policymaking and fund allocation,
while states have more scope for implementing health services, and topping up
the central allocation.
International
5. What to expect from the trump-KIM summit
Since the April 27 summit between South Korean President Moon Jae-in and his
North Korean counterpart, Kim Jong-un, US President Donald Trump has sought,
unsurprisingly, to portray himself as the mastermind behind inter-Korean
diplomacy. But, despite the rays of hope emanating from the peninsula, Trump
may come to regret having taken center stage, especially as his own summit
with Kim draws closer. In preparation for that event – now tentatively scheduled
for late May or early June – Trump will likely eschew reading or listening to
expert advice, and will allow himself to be buffeted by conflicting information.
After all, he is reportedly unable to absorb comprehensive, organized policy
briefings, and his opinions tend to reflect those of whomever he spoke to last.
Beyond that, he is generally guided by a sense of indignation against his
predecessors, especially President Barack Obama, for having been too gullible or
unfocused to solve the problem at hand. But the emotional Moon-Kim meeting
in Panmunjom, the “peace village” on the border of the two Koreas, poses an
enormous challenge for Trump, who wants a big, showy display of his own deal-
making magic, so that he can tell the world, “Now you see the crisis; now you
don’t.” Unfortunately, North Korea’s desire for nuclear weapons cannot simply
be conjured away.
3 May 2018
31

Click excel icon
for detailed
valuation guide
Valuation snapshot
Company
Automobiles
Amara Raja
Ashok Ley.
Bajaj Auto
Bharat Forge
Bosch
CEAT
Eicher Mot.
Endurance Tech.
Escorts
Exide Ind
Hero Moto
M&M
Mahindra CIE
Maruti Suzuki
Motherson Sumi
Tata Motors
TVS Motor
Aggregate
Banks - Private
Axis Bank
DCB Bank
Equitas Hold.
Federal Bank
HDFC Bank
ICICI Bank
IDFC Bank
IndusInd
J&K Bank
Kotak Mah. Bk
RBL Bank
South Indian
Yes Bank
Aggregate
Banks - PSU
BOB
BOI
Canara
Indian Bk
PNB
SBI
Union Bk
Aggregate
NBFCs
Aditya Birla Cap
Bajaj Fin.
Capital First
Cholaman.Inv.&Fn
Dewan Hsg.
GRUH Fin.
HDFC
HDFC Stand. Life
Indiabulls Hsg
L&T Fin Holdings
LIC Hsg Fin
Reco
Buy
Buy
Buy
Buy
Neutral
Buy
Buy
Buy
Sell
Buy
Neutral
Buy
Buy
Buy
Buy
Buy
Neutral
CMP TP % Upside
EPS (INR)
EPS Gr. YoY (%)
P/E (x)
P/B (x)
ROE (%)
(INR) (INR) Downside FY18E FY19E FY20E FY18E FY19E FY20E FY18E FY19E FY18E FY19E FY18E FY19E
886 1000
161 179
2965 3550
767 869
19459 19096
1596 1845
30479 34772
1259 1531
985 826
249 286
3662 4052
863 914
242 274
8753 10468
351 437
336 565
638 709
13
11
20
13
-2
16
14
22
-16
15
13
6
13
20
25
68
11
28.3
5.4
147.9
20.0
459.1
64.0
814.4
27.9
39.1
8.0
186.1
39.7
9.6
266.7
8.1
25.5
14.1
34.0 40.0 0.9
7.2
9.2 28.8
167.8 197.2 4.8
26.4 34.8 52.8
582.9 694.4 -3.0
88.7 115.7 -31.5
1,045.3 1,337.1 32.1
38.2 51.0 18.8
49.5 59.0 103.5
9.9
12.1 -1.3
202.0 221.3 10.0
46.9 51.2 45.1
13.7 16.6 107.8
349.9 444.8 7.3
12.5 17.5 5.0
56.6 58.7 28.8
22.4 32.4 20.4
18.0
19.4
9.7
7.5
6.8
79.3
18.1
3.2
83.0
10.0
40.5
22.1
4.1
24.3
35.8
11.5
11.9
8.5
94.5
25.5
3.8
104.4
14.4
50.1
29.5
5.3
32.1
-92.8
13.8
-82.3
15.3
19.4
-27.2
0.3
25.2
LP
21.3
27.3
-22.9
26.3
5.2
20.3
33.1
13.5
32.1
27.0
38.8
28.4
37.0
26.5
23.3
8.5
18.0
43.1
31.2
54.7
121.8
58.8
46.3
#####
22.4
710.5
22.0
16.9
63.0
7.2
37.9
13.5
24.5
46.1
115.7
31.7
44.2
17.6
27.1
17.5
31.7
19.1
30.4
27.9
33.5
19.3
22.6
9.6
9.3
20.5
27.1
39.6
3.7
44.1
16.4
84.1
17.9
58.1
25.9
19.3
40.8
19.2
25.8
43.6
23.6
33.6
28.9
32.3
33.7
31.3
29.7
20.1
38.4
42.4
25.0
37.4
45.1
25.2
31.0
19.7
21.7
25.2
32.8
43.4
13.2
45.1
26.3
471.0
24.3
177.7
17.8
29.1
24.9
15.9
31.0
6.4
38.6
34.2
13.5
19.2
31.0
42.3
NM
NM
10.1
NM
84.2
NM
0.0
43.3
42.6
18.6
27.5
17.4
68.2
45.5
92.2
14.4
26.3
13.6
26.0
22.3
17.7
29.1
33.4
18.0
29.2
32.9
19.9
25.1
18.1
18.4
17.6
25.0
28.1
5.9
28.4
18.0
26.9
19.8
21.9
14.6
24.9
15.3
14.8
22.5
5.7
31.0
23.4
6.3
14.6
21.5
16.2
16.1
11.7
7.4
2,741
12.9
12.2
14.1
29.8
30.9
14.3
22.8
11.5
58.5
39.2
76.6
12.0
18.9
11.9
5.1
6.7
4.6
7.4
6.2
2.5
12.1
8.6
4.0
3.9
6.3
3.6
2.5
6.3
7.8
1.6
10.4
4.6
2.1
2.3
2.5
1.6
4.8
1.8
1.1
4.7
0.6
4.7
3.3
1.0
3.2
3.2
0.9
0.6
0.6
0.9
0.5
1.0
0.5
0.8
4.4
5.7
4.1
6.2
5.6
2.2
9.0
7.2
3.5
3.5
5.5
3.2
2.2
5.5
6.5
1.3
8.1
3.9
1.9
2.1
2.3
1.4
3.7
1.6
1.0
4.1
0.5
4.4
3.0
0.9
2.7
2.7
17.3
24.3
23.9
20.9
15.2
10.3
36.3
20.8
18.3
12.6
34.1
14.6
10.4
18.5
19.2
13.5
25.3
17.5
0.5
10.9
1.4
9.6
17.9
7.2
6.8
16.5
9.1
10.9
11.6
6.9
17.7
10.4
18.0
27.6
24.6
23.3
17.5
13.0
35.5
23.8
18.7
14.0
32.2
14.8
13.1
21.4
25.4
24.0
32.0
21.5
7.4
11.1
10.7
10.2
16.9
11.1
6.9
19.6
9.9
12.0
13.3
13.7
19.9
12.7
Buy
Neutral
Buy
Buy
Buy
Buy
Neutral
Buy
Buy
Buy
Buy
Buy
Buy
523
193
165
99
1970
277
48
1867
57
1257
518
26
354
600
198
185
124
2400
370
65
2150
100
1400
650
38
444
15
2
12
25
22
34
36
15
77
11
25
46
25
1.1
8.0
0.9
5.6
67.8
11.1
3.0
60.2
8.8
32.5
15.1
1.9
18.4
Buy
Neutral
Neutral
Buy
Buy
Buy
Neutral
144
101
257
307
93
241
92
185
112
280
371
160
362
104
28
10
9
21
72
50
13
3.4
-18.8
-2.4
30.3
-5.7
2.9
-38.8
8.9
6.3
21.9
41.6
0.0
18.7
7.6
15.7 -43.1 161.5 75.6
12.1 Loss LP 91.8
61.3
PL
LP 179.6
47.7 3.7 37.2 14.5
14.3
PL
LP 42,272
34.0 861.1 553.8 81.6
17.1
PL
LP 125.6
PL
LP 101.3
42.4
34.2
27.5
19.1
19.9
20.4
18.9
25.8
20.9
29.0
18.7
0.9 2.0 5.0
0.5 -7.7 3.0
0.6 -0.4 4.1
0.9 9.7 12.3
0.6 -3.0 0.0
0.9 -0.3 5.7
0.4 -16.0 3.4
0.8 -0.8 5.5
Buy
Buy
Buy
Buy
Buy
Neutral
Buy
Buy
Buy
Buy
Neutral
160
1906
637
1712
649
676
1911
509
1300
174
538
225
2330
960
1930
765
600
2225
475
1650
240
610
41
22
51
13
18
-11
16
-7
27
38
13
3.7
5.3
7.6
NA 45.2
44.8 61.7 82.8 39.8 37.8
34.2 44.6 56.8 38.9 30.2
62.3 75.0 89.3 35.5 20.4
37.4 56.4 67.6 26.2 50.8
9.9 11.6 13.9 21.9 16.6
42.0 48.7 57.9 5.3 16.1
5.5
6.6
8.4 23.5 20.4
90.2 108.8 131.5 31.5 20.6
6.6
9.2
11.8 26.0 39.1
39.4 45.0 53.5 3.0 14.3
4.2 3.2 12.6 12.4
6.7 5.7 20.2 19.9
2.4 2.1 13.7 15.6
5.2 4.3 20.6 20.7
2.3 2.0 14.1 18.6
20.0 16.6 32.6 31.0
5.1 4.5 18.4 17.5
3.3 2.8 21.7 21.7
4.3 3.7 30.7 33.2
2.8 2.5 13.1 14.0
2.2 1.9 17.0 17.2
3 May 2018
32

Click excel icon
for detailed
valuation guide
CMP
(INR)
612
508
444
1416
586
2400
1556
TP % Upside
EPS (INR)
(INR) Downside FY18E FY19E FY20E
750
23
18.6 24.2 30.0
600
18
14.5 20.7 26.5
475
7
44.0 44.7 49.8
1750
24
50.9 67.5 88.1
740
26
32.9 39.0 46.0
2800
17
100.8 145.9 175.9
1950
25
69.1 118.2 141.5
Valuation snapshot
Company
MAS Financial
M&M Fin.
Muthoot Fin
PNB Housing
Repco Home
Shriram City Union
Shriram Trans.
Aggregate
Capital Goods
ABB
Bharat Elec.
BHEL
Blue Star
CG Cons. Elec.
CG Power & Indu.
Cummins
Engineers India
GE T&D
Havells
K E C Intl
L&T
Siemens
Solar Ind
Thermax
Va Tech Wab.
Voltas
Aggregate
Cement
Ambuja Cem.
ACC
Birla Corp.
Dalmia Bharat
Grasim Inds.
India Cem
JK Lakshmi Ce
Ramco Cem
Orient Cem
Prism Cem
Sagar Cements
Sanghi Inds.
Shree Cem
Ultratech
Aggregate
Consumer
Asian Paints
Britannia
Colgate
Dabur
Emami
Future Consumer
Godrej Cons.
GSK Cons.
HUL
ITC
Jyothy Lab
Reco
Buy
Buy
Neutral
Buy
Buy
Buy
Buy
EPS Gr. YoY (%)
P/E (x)
P/B (x)
ROE (%)
FY18E FY19E FY20E FY18E FY19E FY18E FY19E FY18E FY19E
24.0 29.6 24.1 32.8 25.3 4.6 4.1 20.2 17.0
104.9 42.9 27.9 35.0 24.5 3.4 3.1 10.5 13.1
48.9 1.6 11.4 10.1
9.9
2.3 1.9 24.5 20.9
61.0 32.7 30.4 27.8 21.0 3.8 3.3 14.6 17.0
13.0 18.5 18.1 17.8 15.0 2.8 2.4 16.7 16.9
19.5 44.8 20.6 23.8 16.4 2.9 2.5 12.7 16.3
24.7 71.0 19.8 22.5 13.2 2.8 2.4 13.1 19.5
26.8 28.0 23.2 32.5 25.4 4.7 4.0 14.5 15.9
16.2
7.6
19.4
26.9
18.4
58.8
18.6
19.8
14.2
24.1
28.3
20.0
13.8
23.7
23.9
9.8
13.9
18.6
68.0
19.9
27.7
48.2
46.1
71.6
32.2
24.6
37.0
48.8
25.9
28.9
57.1
43.6
39.9
15.1
35.0
32.7
44.7
17.9
24.3
32.5
36.3
43.8
23.9
22.5
33.8
39.7
22.2
24.3
37.1
35.9
31.8
14.3
29.5
27.0
30.4
25.7
17.9
41.0
11.2
21.5
27.2
27.8
41.0
24.8
20.0
13.1
32.8
33.2
26.4
48.1
51.6
39.9
41.1
35.8
191.8
45.8
33.1
52.1
28.2
33.4
7.9 6.9 11.6 15.4
3.3 3.0 16.6 16.7
1.0 1.0 3.6 4.0
9.6 8.9 20.4 28.3
20.1 16.5 50.2 49.9
1.2 1.2 1.7 2.7
5.1 4.8 16.5 20.7
3.5 3.3 13.9 14.1
8.1 7.0 23.5 22.3
9.2 8.2 18.9 20.5
5.6 4.7 21.7 21.1
3.6 3.3 13.0 14.0
5.2 4.8 9.1 12.9
8.1 6.8 20.0 20.6
4.6 4.1 11.9 13.6
2.4 2.1 17.1 16.0
5.6 4.9 16.9 17.6
3.6 3.3 10.9 12.3
2.4
3.3
1.8
4.9
1.5
0.9
3.4
4.6
3.0
5.8
2.6
1.9
6.5
4.2
3.3
15.1
20.0
22.9
11.6
12.4
9.7
11.2
7.5
47.0
7.0
6.3
2.3
3.1
1.7
4.4
1.4
0.8
3.0
4.1
2.8
4.8
2.3
1.7
5.5
3.8
3.0
13.4
17.2
21.5
10.4
11.0
9.2
9.8
6.8
46.2
6.4
6.1
6.1
10.1
1.7
8.9
6.9
1.7
4.8
14.3
2.8
11.9
6.5
9.7
16.3
9.3
8.0
26.8
33.9
49.9
25.4
30.1
-1.8
24.0
20.7
78.2
22.8
14.3
7.8
12.4
9.6
11.3
12.9
3.9
11.7
15.6
7.1
21.2
12.0
15.6
18.2
12.2
11.5
29.4
35.8
55.5
26.7
32.6
4.9
22.8
21.6
89.6
23.8
18.5
Sell
Buy
Sell
Neutral
Buy
Neutral
Buy
Buy
Neutral
Buy
Neutral
Buy
Neutral
Neutral
Buy
Buy
Neutral
1347
130
88
800
235
82
741
155
381
543
419
1402
1128
1065
1119
502
629
1240
196
80
880
305
90
1040
200
430
630
385
1690
1285
1100
1350
700
660
-8
51
-9
10
30
10
40
29
13
16
-8
21
14
3
21
39
5
19.8
6.5
3.2
16.6
5.1
1.1
23.0
6.3
10.3
11.1
16.2
48.6
19.8
24.4
28.0
33.3
18.0
30.1
7.3
3.6
24.6
6.5
1.9
31.0
6.9
11.3
13.7
18.9
57.6
30.4
29.6
35.1
35.2
21.3
35.0 12.1 52.0
7.8
3.7 11.4
4.3 135.9 14.2
31.2 36.0 48.2
7.7
8.9 27.1
3.0 -72.2 63.3
36.8 -13.2 34.7
8.2 48.1 9.2
12.9 79.8 9.7
17.0 16.5 22.8
24.3 36.6 16.7
69.0 14.8 18.5
34.6 10.9 53.8
36.7 18.4 21.5
43.5 3.1 25.3
38.6 76.4 5.7
24.3 16.4 18.4
16.8 21.2
12.7
79.6
50.5
102.1
111.8
9.4
21.2
37.8
8.3
6.5
70.6
11.3
683.8
171.3
29.5
31.3
-74.0
34.0
-29.8
-48.5
-17.7
-11.9
LP
769.4
LP
59.3
1.1
-12.3
-7.1
34.2
28.1
470.3
39.1
105.6
129.3
163.8
23.4
163.6
105.1
101.0
86.0
30.3
43.8
58.3
Neutral
Neutral
Buy
Buy
Neutral
Neutral
Buy
Buy
Buy
Buy
Not Rated
Buy
Buy
Buy
246 264
1561 1747
756 1004
2964 3350
1095 1187
143 148
411 470
824 967
146 179
121 144
1014
-
111 157
16601 19731
4021 4818
7
12
33
13
8
4
14
17
23
19
41
19
20
6.0
47.4
7.4
52.0
47.6
2.9
5.7
24.0
1.3
2.4
25.2
4.6
388.5
84.3
8.1
60.7
42.3
72.3
97.9
6.6
15.1
29.7
3.6
4.9
50.6
8.5
506.3
121.2
56.8 40.7
31.0 32.9
19.2 101.9
41.3 57.1
14.2 23.0
41.8 49.2
40.5 71.8
27.6 34.3
133.3 108.1
32.7 50.8
39.7 40.3
32.5 24.3
35.1 42.7
41.3 47.7
32.3 41.8
56.9
64.4
47.1
49.0
44.3
NM
52.4
37.7
61.4
32.1
43.2
Neutral
Buy
Buy
Buy
Buy
Buy
Neutral
Neutral
Buy
Neutral
Neutral
1222
5424
1129
371
1108
58
1117
6078
1472
287
366
1250
6180
1420
435
1475
76
1140
6230
1530
275
405
2
14
26
17
33
32
2
3
4
-4
11
21.5
84.2
24.0
7.6
25.0
-0.1
21.3
161.0
24.0
9.0
8.5
25.4 30.5 2.1 18.2 20.2
105.1 131.5 14.3 24.8 25.1
28.3 33.8 12.9 17.9 19.7
9.0
10.5 4.5 19.2 16.2
31.0 36.9 -5.7 23.8 19.1
0.3
1.1 Loss LP 276.5
24.4 27.8 12.7 14.4 14.1
183.8 215.7 3.1 14.1 17.4
28.3 33.3 22.1 17.9 17.8
10.2 11.4 6.6 13.7 12.4
10.9 13.6 -24.8 29.3 24.0
3 May 2018
33

Click excel icon
for detailed
valuation guide
CMP TP % Upside
EPS (INR)
Reco
(INR) (INR) Downside FY18E FY19E FY20E
Neutral
317 350
10
6.4
7.5
9.0
Neutral
9224 8870
-4
140.0 163.8 193.5
Buy
23663 27490
16
297.1 415.7 549.8
Buy
1103 1115
1
17.6 20.6 23.7
Neutral
9663 9672
0
142.1 171.3 200.8
Not Rated 179
-
3.5
6.4
9.7
Buy
1162 1450
25
14.1 17.4 22.9
Neutral
3582 3510
-2
32.6 56.9 78.5
Valuation snapshot
P/B (x)
ROE (%)
FY18E FY19E FY18E FY19E
15.4 14.7 33.1 35.8
26.0 24.7 40.3 45.0
31.7 25.4 39.9 44.6
14.1 12.2 24.2 24.5
38.2 32.0 61.2 61.8
2.5 2.3 4.9 8.5
11.6 10.1 14.9 16.2
18.9 14.1 17.2 22.3
13.3 12.1 26.9 28.8
4.5 3.8 22.5 19.8
4.7 4.1 16.4 19.5
6.0 4.8 27.0 26.2
3.1 2.6 24.2 21.7
7.7 7.1 7.2 11.5
5.1 4.2 21.6 22.8
3.5 3.1 12.4 13.3
5.7 5.1 16.0 20.0
2.8 2.4 9.0 13.9
1.3 1.2 1.2 2.2
3.0 2.6 16.4 15.3
2.0 1.8 13.2 13.9
12.0 14.9 19.7 27.2
3.4 3.1 10.5 13.0
3.1 2.6 19.7 21.4
3.5 2.9 14.1 18.3
2.5 2.3 10.1 12.1
5.5 5.1 16.1 16.8
3.7 3.0 11.0 17.4
2.0 1.8 4.6 12.1
3.3 3.0 8.5 13.2
4.8 4.2 17.6 19.9
3.7 3.3 12.2 14.7
2.9
1.6
4.0
3.5
2.4
1.7
3.4
1.8
3.0
2.7
1.4
3.4
3.1
2.2
1.6
3.2
1.6
2.8
2.2
15.5
23.6
13.5
12.9
10.8
9.4
6.6
9.1
6.9
13.4
16.2
13.7
12.0
13.7
13.4
10.7
12.7
Company
Marico
Nestle
Page Inds
Pidilite Ind.
P&G Hygiene
Prabhat Dairy
United Brew
United Spirits
Aggregate
Healthcare
Alembic Phar
Alkem Lab
Ajanta Pharma
Aurobindo
Biocon
Cadila
Cipla
Divis Lab
Dr Reddy’s
Fortis Health
Glenmark
Granules
GSK Pharma
IPCA Labs
Jubilant Life
Laurus Labs
Lupin
Sanofi India
Shilpa Medicare
Strides Shasun
Sun Pharma
Torrent Pharma
Aggregate
Infrastructure
Ashoka Buildcon
IRB Infra
KNR Constructions
Sadbhav Engineering
Aggregate
Logistics
Allcargo Logistics
Concor
Gateway Distriparks
Aggregate
Media
Dish TV
D B Corp
Den Net.
Ent.Network
Hathway Cable
Hind. Media
HT Media
Jagran Prak.
Music Broadcast
PVR
EPS Gr. YoY (%)
P/E (x)
FY18E FY19E FY20E FY18E FY19E
1.7 18.0 18.8 49.6 42.0
13.2 17.0 18.1 65.9 56.3
24.5 39.9 32.2 79.6 56.9
5.4 17.0 14.9 62.5 53.5
6.9 20.5 17.3 68.0 56.4
-2.0 83.8 52.1 51.4 28.0
62.0 23.9 31.2 82.6 66.7
22.1 74.3 38.1 109.7 63.0
9.9 18.1 17.4 49.6 42.0
20.9
22.5
20.4
13.0
61.5
20.2
23.3
27.0
18.5
57.6
16.7
13.5
54.8
25.0
13.3
17.4
19.9
30.2
19.2
15.4
24.0
22.5
22.5
40.2
11.0
22.7
23.9
18.0
12.1
24.9
15.8
21.9
Neutral
Buy
Buy
Buy
Neutral
Buy
Neutral
Neutral
Neutral
Buy
Neutral
Buy
Neutral
Buy
Buy
Buy
Buy
Buy
Buy
Buy
Buy
Neutral
534
2009
1341
632
664
406
610
1187
2113
159
551
107
2337
730
832
505
800
4881
466
626
516
1379
555
2500
1560
820
600
555
600
1100
2575
185
550
175
2500
750
1110
613
940
5600
686
989
675
1400
4
24
16
30
-10
37
-2
-7
22
17
0
64
7
3
33
21
17
15
47
58
31
1
24.8
65.4
54.0
43.8
6.2
16.0
21.6
32.9
67.1
1.5
30.6
6.3
38.3
21.4
47.8
19.0
31.0
141.7
13.3
14.1
13.2
48.0
25.6 30.5 15.0 3.1 19.1 21.5
89.5 110.6 -12.4 36.9 23.6 30.7
65.8 81.4 -5.8 21.9 23.6 24.8
48.7 53.6 11.4 11.2 10.1 14.4
10.8 19.8 -39.2 73.9 83.3 106.9
20.1 23.3 12.7 25.5 15.9 25.4
26.2 32.0 35.7 21.3 22.3 28.3
44.0 52.7 -17.7 33.9 19.7 36.1
114.1 146.1 -7.6 70.0 28.0 31.5
2.8
7.3 -85.8 87.8 164.5 108.1
32.9 41.1 -22.2 7.7 24.7 18.0
7.9
11.0 -12.4 25.2 38.7 16.8
42.6 48.5 11.5 11.2 13.7 61.0
29.2 37.3 33.2 36.6 27.7 34.1
62.6 72.5 29.5 30.9 15.8 17.4
29.1 35.7 7.0 52.7 22.8 26.5
40.2 54.1 -45.2 29.5 34.6 25.8
161.8 186.9 9.8 14.2 15.5 34.4
24.3 30.6 -5.0 82.4 25.9 35.0
40.8 55.7 -56.2 188.8 36.7 44.3
21.5 27.7 -49.6 63.3 28.8 39.1
61.3 78.5 -12.9 27.6 28.0 28.7
-19.7 35.0 25.6 30.3
7.0
24.6
14.0
16.0
8.3
21.3
18.2
17.4
LP
24.8
41.2
27.1
238.0 18.1 136.0
-3.0 -13.6 10.6
-17.3 30.2 18.8
14.9 8.6
27.4
18.7
38.6
52.1
69.8
50.8
LP
25.8
LP
113.8
LP
11.3
2.6
30.5
62.3
68.7
16.3
21.0
21.8
20.3
109.9
20.1
5,545
86.9
161.9
12.6
4.9
21.5
31.4
37.9
16.8
37.8
26.9
33.0
Buy
Neutral
Buy
Buy
281
270
317
382
290
240
375
460
3
-11
18
21
2.1
25.4
16.9
13.9
Buy
Buy
Buy
138 198
1328 1553
168 231
44
17
38
8.2
35.1
6.2
11.4
53.4
10.6
13.2
64.6
12.9
-16.5
12.5
-8.3
4.6
PL
-10.4
Loss
-37.2
Loss
0.2
59.3
-5.3
29.9
7.8
Buy
Buy
Neutral
Buy
Buy
Buy
Neutral
Buy
Buy
Buy
75
298
107
680
34
221
87
168
375
1409
101
420
90
820
47
305
98
215
469
1760
35
41
-16
21
40
38
13
28
25
25
-0.3
18.3
-2.9
7.2
-0.2
25.9
11.8
10.1
8.3
22.1
1.6
23.0
0.1
15.3
0.8
28.8
12.1
13.1
13.5
37.3
3.4
27.6
4.0
28.7
2.0
32.4
12.7
16.0
17.8
51.5
NM
46.5 17.8 12.9 -7.8 32.1
16.3 12.9 3.0 2.5 19.6 21.0
NM 1,508.3 2.4 2.4 -6.3 0.2
94.8 44.3 3.7 3.4 3.9 7.9
NM
44.1 2.4 2.2 -1.2 5.2
8.5
7.7
1.2 1.0 15.1 14.6
7.4
7.2
0.8 0.7 11.5 10.6
16.7 12.8 2.7 2.3 14.9 18.5
45.0 27.7 3.6 3.2 8.3 12.2
63.7 37.8 6.2 5.4 10.2 15.3
3 May 2018
34

Click excel icon
for detailed
valuation guide
CMP
(INR)
97
17
870
596
TP % Upside
EPS (INR)
(INR) Downside FY18E FY19E FY20E
130
34
2.5
5.8
7.9
27
61
-0.9
0.1
0.6
1225
41
27.7 35.8 42.5
705
18
13.0 17.6 21.0
Valuation snapshot
Company
Prime Focus
Siti Net.
Sun TV
Zee Ent.
Aggregate
Metals
Hindalco
Hind. Zinc
JSPL
JSW Steel
Nalco
NMDC
SAIL
Rain Industries
Vedanta
Tata Steel
Aggregate
Oil & Gas
Aegis Logistics
BPCL
GAIL
Gujarat Gas
Gujarat St. Pet.
HPCL
IOC
IGL
Mahanagar Gas
MRPL
Oil India
ONGC
PLNG
Reliance Ind.
Aggregate
Retail
Jubilant Food
PC Jeweller
Titan Co.
Aggregate
Technology
Cyient
HCL Tech.
Hexaware
Infosys
KPIT Tech
L&T Infotech
Mindtree
Mphasis
NIIT Tech
Persistent Sys
Tata Elxsi
TCS
Tech Mah
Wipro
Zensar Tech
Aggregate
Reco
Buy
Neutral
Buy
Buy
EPS Gr. YoY (%)
P/E (x)
P/B (x)
ROE (%)
FY18E FY19E FY20E FY18E FY19E FY18E FY19E FY18E FY19E
100.6 137.5 36.4 39.6 16.7 4.1 2.6 11.6 18.9
Loss LP 411.6 NM 133.0 3.2 3.2 -15.8 2.4
11.6 29.1 18.7 31.4 24.3 7.9 7.1 26.1 30.9
-2.9 35.4 19.3 45.9 33.9 7.4 6.3 17.4 20.2
9.9 46.6 28.2 38.4 26.2 5.3 4.6 13.7 17.5
12.0
14.6
NM
14.6
18.3
9.1
NM
12.0
12.3
9.9
14.9
46.7
9.5
15.4
40.5
14.2
7.5
7.8
29.8
15.9
9.1
12.1
10.7
16.2
16.0
12.4
84.1
7.2
77.0
57.1
21.1
15.8
27.1
18.5
20.2
23.1
30.6
22.8
24.5
19.2
33.0
26.5
16.6
14.6
24.6
21.3
8.4
11.5
31.0
13.1
8.0
8.8
16.9
7.6
8.7
8.3
10.6
30.7
9.2
14.1
25.1
13.5
9.2
9.1
25.3
16.5
9.3
8.2
8.3
14.1
13.9
11.3
64.9
5.7
60.6
44.9
19.1
15.1
24.1
17.1
18.8
20.9
24.2
19.8
20.7
16.5
27.9
23.2
15.6
14.4
19.4
20.3
1.5
3.6
0.8
2.8
1.6
1.6
0.8
2.6
1.8
1.4
1.7
12.8
2.2
1.8
6.4
2.0
2.0
1.4
5.7
4.2
1.6
0.9
1.0
3.5
2.0
1.6
1.3
3.0
0.7
2.3
1.4
1.4
0.8
2.0
1.6
1.3
1.6
9.7
1.9
1.6
5.3
1.8
1.8
1.3
4.9
3.8
1.4
0.8
1.0
3.0
1.7
1.5
13.7
26.7
-4.0
20.9
8.4
18.2
-1.0
24.7
14.2
16.0
11.7
30.7
24.1
11.9
16.8
15.0
28.2
18.5
20.7
28.0
18.9
7.4
9.6
23.7
13.0
13.2
17.0
28.6
2.4
19.4
18.3
17.2
4.8
29.8
19.3
16.2
14.7
35.9
21.6
12.0
23.0
14.0
20.6
14.4
20.8
24.4
16.1
10.5
12.0
22.9
13.2
13.1
Buy
Neutral
Buy
Buy
Buy
Buy
Sell
Buy
Buy
Neutral
228
308
239
315
80
124
73
307
283
575
374
336
362
334
120
215
71
480
346
778
64
9
52
6
51
74
-3
56
22
35
18.9
21.1
-12.7
21.5
4.3
13.6
-0.9
25.6
23.0
58.2
27.3
26.8
7.7
24.0
9.9
14.0
4.3
40.6
32.4
69.4
30.6 121.3 44.1 12.0
30.6 7.2 26.8 14.2
12.2 Loss LP 58.8
23.7 45.3 11.5 -1.0
10.2 16.8 128.2 3.2
14.7 37.0 2.9
4.7
6.5 Loss LP 50.2
44.6 165.9 58.6 9.8
38.7 51.9 41.1 19.3
61.4 53.4 19.1 -11.5
68.6 40.2 10.0
12.3
46.5
24.6
44.3
13.9
37.8
21.7
12.5
54.6
12.4
28.1
23.5
18.8
74.9
74.2
-17.3
23.9
34.3
43.8
-2.9
-1.2
6.9
27.0
-20.7
-18.3
2.3
23.0
20.7
5.5
52.1
2.9
8.8
61.1
4.9
-17.8
-15.0
17.7
-3.6
-2.5
48.1
29.6
14.3
15.0
9.7
28.5
13.0
7.7
27.5
4.5
16.5
23.1
13.2
1.2
8.3
3.3
8.2
17.9
6.8
10.7
31.3
27.6
24.1
26.0
11.8
8.1
12.5
10.8
29.2
17.9
23.9
8.0
15.9
21.7
18.2
10.9
16.4
13.0
27.2
10.9
Buy
Buy
Sell
Buy
Neutral
Buy
Buy
Buy
Buy
Neutral
Buy
Buy
Buy
Buy
293 303
381 554
323 285
872 1195
179 191
298 536
161 261
280 416
891 1228
107 119
222 260
180 222
226 317
973 1150
3
46
-12
37
6
80
62
49
38
11
17
24
40
18
6.3
40.0
21.0
21.6
12.7
39.5
20.7
9.4
55.9
11.7
18.3
16.8
14.0
60.9
9.5
41.2
22.9
34.7
13.3
32.5
17.6
11.1
53.9
11.4
27.2
21.8
16.0
70.1
Neutral
Buy
Buy
2553 2185
111 520
965 1090
-14
370
13
30.3
15.4
12.5
39.3
19.5
15.9
51.6 186.2 29.6
24.9 44.4 26.6
19.8 38.8 27.0
48.6 27.2
18.9 19.3 22.5 29.8
1.1 1.0 16.9 18.4
16.3 15.1 23.4 25.9
11.0 9.9 19.2 22.2
3.8
3.9
6.8
4.2
2.8
6.6
6.3
3.9
3.9
3.1
10.6
8.1
3.3
2.6
3.6
5.3
3.5
3.5
5.9
3.8
2.5
5.4
5.5
3.6
3.5
2.9
8.5
7.0
2.9
2.2
3.1
4.7
18.1
25.7
26.9
24.1
14.9
32.4
18.8
15.3
16.2
16.7
36.0
30.3
20.9
17.0
15.3
24.8
18.1
24.4
26.1
22.9
14.0
28.4
24.3
18.8
17.8
18.7
33.8
32.5
20.1
16.4
17.1
23.2
Buy
Neutral
Neutral
Buy
Neutral
Buy
Buy
Neutral
Neutral
Buy
Buy
Neutral
Buy
Neutral
Buy
805
1001
450
1198
254
1529
1052
1004
1100
777
1214
3498
662
276
1298
750
1050
340
1330
250
1400
1000
800
800
860
1400
3000
700
300
1400
-7
1
-24
11
-1
-8
-5
-20
-27
11
15
-14
6
9
8
38.2
63.4
16.6
64.8
12.5
66.3
34.4
44.0
44.8
40.4
36.8
132.1
39.8
18.9
52.8
42.2 47.1 24.8 10.3
66.3 71.6 6.0 4.5
18.7 21.0 21.2 12.7
70.1 77.7 3.1 8.3
13.5 17.5 5.1 7.8
73.3 86.3 19.5 10.5
43.5 53.9 38.0 26.7
50.8 54.9 13.0 15.6
53.1 61.6 17.9 18.5
47.0 57.2 7.2 16.4
43.6 51.5 30.8 18.4
150.5 166.9 -1.0 13.9
42.3 49.3 28.8 6.4
19.2 21.7 11.8 1.3
67.0 85.2 1.3 27.0
5.0 5.1
3 May 2018
35

Click excel icon
for detailed
valuation guide
Valuation snapshot
Company
Telecom
Bharti Airtel
Bharti Infratel
Idea Cellular
Tata Comm
Aggregate
Utilities
Coal India
CESC
JSW Energy
NHPC
NTPC
Power Grid
Tata Power
Aggregate
Others
Arvind
Avenue Supermarts
BSE
Castrol India
Coromandel Intl
Delta Corp
Interglobe
Indo Count
Info Edge
Kaveri Seed
Manpasand
MCX
Navneet Education
Oberoi Realty
Phoenix Mills
Quess Corp
PI Inds.
Piramal Enterp.
SRF
S H Kelkar
Tata Chemicals
Team Lease Serv.
Trident
TTK Prestige
UPL
V-Guard
Reco
Buy
Neutral
Buy
Buy
CMP TP % Upside
EPS (INR)
EPS Gr. YoY (%)
P/E (x)
P/B (x)
ROE (%)
(INR) (INR) Downside FY18E FY19E FY20E FY18E FY19E FY20E FY18E FY19E FY18E FY19E FY18E FY19E
408
313
67
629
581
346
85
750
42
10
26
19
4.1
13.6
-9.6
2.2
1.9
13.7
-12.3
11.0
5.6 -63.3 -53.8 197.1 100.1
14.2 -8.1 0.4
3.6
23.0
-10.5 Loss Loss Loss
NM
22.8 -77.4 388.0 108.3 280.0
-99.3 PL
LP 5,520.2
16.5
9.5
10.5
7.0
9.3
6.0
8.6
11.0
34.1
33.4
11.2
4.0
4.5
41.4
33.4
17.8
27.1
17.0
34.6
16.6
17.6
-3.4
26.2
26.6
16.2
27.1
31.7
26.6
14.3
47.9
24.3
15.4
19.2
12.1
15.8
12.2
21.6
11.5
13.1
12.1
17.9
13.9
35.9
119.0
19.1
28.7
18.7
45.3
20.8
12.2
53.2
15.1
44.7
35.7
19.0
40.1
44.3
50.2
28.8
31.2
30.3
31.0
22.7
62.6
12.0
44.6
16.6
52.8
216.9 2.3 2.3 2.4 1.1
22.9 3.4 3.6 15.6 15.2
NM
1.1 1.3 -16.0 -21.9
57.4 12.9 10.5 4.3 20.2
-149 2.3 2.4 0.0 -1.6
10.6
10.2
22.9
9.4
11.2
9.9
12.0
10.8
29.0
86.6
17.1
29.5
15.5
36.4
18.0
9.2
47.3
12.8
28.2
26.2
14.9
10.8
29.9
33.5
22.6
22.2
22.4
25.3
17.4
45.5
6.6
34.9
15.7
39.8
7.5
1.2
1.3
1.0
1.3
1.9
1.9
2.1
7.0
1.1
1.2
1.0
1.3
1.6
1.6
1.9
47.4
10.3
5.9
8.6
10.6
16.6
10.8
14.8
65.8
11.1
5.5
10.3
11.6
17.7
14.5
17.5
Buy
Buy
Sell
Buy
Buy
Buy
Sell
281
1044
82
28
170
205
87
397
1391
53
36
214
287
77
41
33
-35
28
26
40
-11
17.8 26.4 30.8 19.2 48.4
85.6 102.0 111.7 65.0 19.2
3.8
3.6
4.0
-0.9 -5.6
2.4
3.0
3.2 -17.2 22.2
13.0 15.2 16.6 5.0 16.9
16.9 20.7 21.9 21.3 22.1
4.9
7.3
7.9
-5.8 49.0
12.1 28.2
11.3
12.6
42.6
7.0
24.1
5.8
64.7
7.4
23.4
34.2
8.8
21.2
7.7
13.5
14.1
22.8
29.9
83.1
77.4
7.9
33.7
43.3
5.7
137.8
44.2
4.5
14.1
17.2
47.6
6.8
29.0
7.2
75.0
9.8
26.3
40.6
13.9
28.9
9.8
50.3
20.9
34.1
38.1
116.4
105.0
9.7
44.0
59.6
10.3
176.1
46.7
6.0
18.8
23.0
52.9
7.1
30.3
10.2
100.0
11.5
33.4
47.4
18.7
33.7
11.5
48.6
26.3
43.1
44.2
147.9
138.3
12.2
50.3
88.1
12.8
203.2
55.6
6.7
-8.4
63.6
4.0
2.9
45.1
89.8
49.6
-43.2
49.0
79.5
38.2
-14.6
4.7
21.4
28.4
130.7
-10.5
14.5
-9.9
9.1
0.0
11.6
-14.2
4.4
5.9
25.3
23.8
37.4
11.6
-2.8
20.4
24.5
15.9
32.5
12.5
18.5
58.4
36.5
27.4
271.7
48.1
49.6
27.3
40.0
35.6
22.4
30.5
37.5
81.3
27.8
5.6
32.9
Neutral
Sell
Buy
Buy
Buy
Buy
Neutral
Neutral
Buy
Buy
Buy
Buy
Buy
Buy
Buy
Buy
Buy
Buy
Buy
Buy
Buy
Buy
Buy
Neutral
Buy
Neutral
408
1493
815
200
451
263
1348
90
1243
518
392
757
146
543
625
1142
860
2589
2347
245
765
2710
68
6148
733
237
402
920
1070
247
523
327
1318
104
1550
664
467
1050
194
654
732
1300
1061
3500
2351
318
940
2700
114
5281
945
167
-1
-38
31
23
16
25
-3
15
25
28
19
39
33
20
17
14
23
35
0
30
23
0
68
-14
29
-29
2.8 2.6 8.0 9.4
21.2 18.1 19.0 22.6
1.7 1.3 8.7 7.7
19.4 18.2 69.1 63.8
3.9 3.4 22.5 23.4
4.4 4.0 12.3 11.5
7.7 7.2 47.3 41.3
1.8 1.5 15.7 17.2
7.0 6.3 13.7 14.0
3.7 3.2 23.4 27.1
3.7 3.3 7.2 12.3
2.8 2.7 7.9 10.4
4.3 3.7 24.2 26.9
3.0 2.5 7.8 25.1
3.3 2.6 8.5 9.8
6.3 5.1 22.3 21.7
6.1 5.0 23.0 24.3
2.4 2.1 8.9 10.2
3.9 3.4 13.3 16.3
4.0 3.6 13.4 14.9
2.1 1.9 11.3 11.5
10.2 8.3 17.7 20.1
1.2 1.0 10.1 16.5
7.6 6.8 18.0 20.7
4.0 3.3 26.9 23.3
12.9 10.3 26.9 28.8
3 May 2018
36

MOSL Universe stock performance
Company
Automobiles
Amara Raja
Ashok Ley.
Bajaj Auto
Bharat Forge
Bosch
CEAT
Eicher Mot.
Endurance Tech.
Escorts
Exide Ind
Hero Moto
M&M
Mahindra CIE
Maruti Suzuki
Motherson Sumi
Tata Motors
TVS Motor
Banks - Private
Axis Bank
DCB Bank
Equitas Hold.
Federal Bank
HDFC Bank
ICICI Bank
IDFC Bank
IndusInd
J&K Bank
Kotak Mah. Bk
RBL Bank
South Indian
Yes Bank
Banks - PSU
BOB
BOI
Canara
Indian Bk
PNB
SBI
Union Bk
NBFCs
Aditya Birla Cap
Bajaj Fin.
Capital First
Cholaman.Inv.&Fn
Dewan Hsg.
GRUH Fin.
HDFC
HDFC Stand. Life
Indiabulls Hsg
L&T Fin.Holdings
LIC Hsg Fin
M&M Fin.
Muthoot Fin
1 Day (%)
2.8
-1.8
0.6
-0.7
0.3
0.1
-2.4
-1.4
-1.8
0.3
-1.9
-1.2
-3.1
-0.8
0.2
-1.2
-4.5
1.0
-0.8
6.4
0.6
1.3
-2.6
-1.1
-1.7
-0.8
3.9
-2.4
-1.9
-2.2
-3.1
-2.5
-3.5
-4.4
-2.5
-2.3
-3.7
-0.1
0.0
-0.8
-1.6
1.3
-0.3
1.4
-1.9
-0.5
0.6
-1.6
-3.7
-1.8
1M (%)
9.2
9.0
5.6
6.5
4.9
3.4
7.7
-0.1
11.6
8.5
0.6
15.4
12.6
-2.8
8.2
-0.8
-3.7
5.1
17.7
11.7
9.6
2.1
5.8
-0.2
3.4
-4.6
14.6
7.3
10.9
15.7
1.4
-3.0
-2.9
1.8
-3.7
-2.3
-3.3
5.1
4.8
0.7
15.9
24.0
11.5
3.9
5.9
4.4
8.6
-0.8
7.9
7.5
12M (%)
-0.5
93.1
2.1
32.3
-15.7
-0.3
18.3
55.6
74.7
7.7
9.3
28.6
1.7
30.5
31.3
-25.6
28.9
3.6
-1.8
1.0
-12.1
27.8
10.5
-26.7
28.8
-28.2
37.0
-11.5
1.8
8.6
-23.7
-44.0
-30.0
-4.0
-45.7
-16.5
-46.0
Company
MAS Financial Serv.
PNB Housing
Repco Home
Shriram City Union
Shriram Trans.
Capital Goods
ABB
Bharat Elec.
BHEL
Blue Star
CG Cons. Elec.
CG Power & Inds Sol.
Cummins
Engineers India
GE T&D
Havells
K E C Intl
L&T
Siemens
Solar Ind
Thermax
Va Tech Wab.
Voltas
Cement
Ambuja Cem.
ACC
Birla Corp.
Dalmia Bharat
Grasim Inds.
India Cem
JK Lakshmi Ce
Ramco Cem
Orient Cem
Prism Cem
Sagar Cements
Sanghi Inds.
Shree Cem
Ultratech
Consumer
Asian Paints
Britannia
Colgate
Dabur
Emami
Future Consumer
Godrej Cons.
GSK Cons.
HUL
ITC
Jyothy Lab
Marico
Nestle
Page Inds
Pidilite Ind.
1 Day (%)
-2.1
1.4
-9.1
-0.7
-3.5
-0.6
-0.9
-0.2
-0.2
-0.4
-2.4
-3.8
-2.1
0.5
-0.6
2.9
0.1
0.6
0.8
-2.1
-1.2
-2.2
-1.7
-1.4
-0.9
-2.8
0.3
-3.0
0.9
0.0
4.7
-2.6
-1.8
-1.4
-1.4
-2.2
1.8
-1.5
0.4
0.4
-1.3
-3.1
0.0
-0.5
-2.5
2.0
0.8
-4.8
-1.9
-2.2
1.5
1M (%)
0.2
12.9
2.8
9.1
6.0
4.2
-10.0
6.1
2.9
0.9
3.5
3.4
-4.1
-6.4
7.0
6.0
4.9
2.4
0.2
-0.6
1.2
-1.4
2.1
1.6
-1.2
5.4
0.4
-6.7
-7.3
11.3
3.2
5.4
7.6
-8.1
1.0
1.0
6.3
6.3
6.8
10.7
1.5
3.9
0.4
4.2
9.1
11.0
-7.2
-3.5
11.0
6.6
17.3
12M (%)
4.8
-24.0
9.1
54.3
-4.5
-21.8
-25.1
18.5
6.5
4.2
-25.9
-9.1
13.8
13.5
92.8
21.6
-15.5
34.7
8.8
-26.4
52.0
1.6
-1.9
-1.9
35.3
13.8
-32.3
-11.9
20.6
-12.1
-0.1
22.9
52.6
-13.3
-4.4
9.5
51.8
9.6
30.7
6.1
75.0
25.6
17.3
58.4
3.1
-7.2
-0.7
37.4
60.9
53.3
50.1
-15.9
57.3
45.0
72.2
20.7
21.2
30.0
-23.8
53.1
12.8
3 May 2018
37

MOSL Universe stock performance
Company
P&G Hygiene
Prabhat Dairy
United Brew
United Spirits
Healthcare
Alembic Phar
Alkem Lab
Ajanta Pharma
Aurobindo
Biocon
Cadila
Cipla
Divis Lab
Dr Reddy’s
Fortis Health
Glenmark
Granules
GSK Pharma
IPCA Labs
Jubilant Life
Lupin
Laurus Labs
Sanofi India
Shilpa Medicare
Strides Shasun
Sun Pharma
Torrent Pharma
Infrastructure
Ashoka Buildcon
IRB Infra.Devl.
KNR Construct.
Sadbhav Engg.
Logistics
Allcargo Logistics
Concor
Gateway Distriparks
Media
Dish TV
D B Corp
Den Net.
Ent.Network
Hathway Cab.
Hind. Media
HT Media
Jagran Prak.
Music Broadcast
PVR
Prime Focus
Siti Net.
Sun TV
Zee Ent.
Metals
Hindalco
Hind. Zinc
JSPL
1 Day (%)
1.6
-0.5
-3.0
-1.1
-0.3
2.0
-0.7
-1.3
-0.7
-1.4
0.6
-0.8
0.1
4.3
-3.7
-1.7
0.2
-2.9
-5.1
-1.4
-1.4
-0.3
-0.5
-1.5
-2.4
-2.6
-1.1
-4.3
-2.1
0.0
-1.7
1.7
-0.5
-1.0
-1.0
3.6
-1.8
-4.0
-4.7
-4.0
-1.5
-1.8
-2.4
0.7
-1.2
-1.1
1.5
-3.1
-5.8
-5.1
1M (%)
3.2
16.5
19.6
10.0
-1.3
4.3
-4.6
6.7
10.9
5.6
5.9
8.8
-0.9
24.9
0.8
0.7
11.6
10.0
-1.5
3.2
-0.6
-4.6
0.2
-5.8
1.5
9.2
10.2
17.2
11.4
-1.8
-8.9
7.0
-9.5
2.3
-4.5
2.0
-5.3
-7.6
-1.3
0.0
-2.1
-6.0
14.1
8.2
7.7
1.2
2.8
8.1
1.8
6.0
12M (%)
31.0
50.3
50.6
85.1
-13.7
1.1
-18.5
6.0
83.1
-9.2
10.1
89.4
-18.1
-30.2
-38.2
-29.6
-3.6
24.1
9.6
-38.7
-4.4
16.3
-33.8
-39.3
-18.5
-0.8
44.9
1.0
57.1
14.0
-25.8
10.5
-37.2
-21.5
-21.3
11.8
-15.9
-23.6
-24.0
5.4
-15.0
7.7
-11.7
-9.1
-51.3
-5.8
11.4
14.1
14.8
109.9
Company
JSW Steel
Nalco
NMDC
Rain Industries
SAIL
Vedanta
Tata Steel
Oil & Gas
Aegis Logistics
BPCL
GAIL
Gujarat Gas
Gujarat St. Pet.
HPCL
IOC
IGL
Mahanagar Gas
MRPL
Oil India
ONGC
PLNG
Reliance Ind.
Retail
Jubilant Food
PC Jeweller
Titan Co.
Technology
Cyient
HCL Tech.
Hexaware
Infosys
KPIT Tech
L&T Infotech
Mindtree
Mphasis
NIIT Tech
Persistent Sys
Tata Elxsi
TCS
Tech Mah
Wipro
Zensar Tech
Telecom
Bharti Airtel
Bharti Infratel
Idea Cellular
Tata Comm
Utiltites
Coal India
CESC
JSW Energy
NHPC Ltd
NTPC
Power Grid
Tata Power
1 Day (%)
-3.1
-1.4
-0.9
-4.2
-6.0
-5.0
-3.3
1.6
-2.0
-0.6
-1.2
0.7
-2.3
-0.8
-2.9
0.2
-0.9
-4.3
-0.4
-0.3
1.0
0.1
-23.7
-1.6
5.5
-4.8
0.3
-0.1
-2.0
-2.5
-3.1
-2.9
-5.5
-3.9
-1.8
-1.0
-1.4
-1.2
2.8
-0.4
0.0
-2.7
1.2
-1.1
-1.6
-2.8
-0.9
-0.9
-1.3
-1.4
1M (%)
6.2
18.1
4.8
-19.9
-0.1
0.3
-0.6
14.3
-10.0
-0.7
4.2
-4.6
-13.5
-5.6
0.2
-10.6
-4.3
-1.4
-0.2
-2.0
9.0
8.4
-64.7
2.2
17.3
2.2
8.8
5.3
13.5
8.4
30.2
18.6
24.7
13.4
21.0
20.5
3.4
-4.9
42.1
3.4
-7.0
-13.4
-1.1
1.1
5.7
9.0
0.9
0.1
5.3
6.2
12M (%)
61.0
16.7
-3.1
155.3
23.2
17.2
37.0
50.9
-22.8
0.2
4.0
-2.7
-19.1
-27.3
32.1
-12.5
-17.4
1.2
-6.5
6.2
42.0
145.0
-47.9
99.0
44.3
21.8
98.1
30.1
91.2
114.9
116.7
78.0
137.2
32.7
59.0
52.6
58.4
11.3
48.3
17.4
-11.6
-20.7
-11.9
2.0
9.1
31.7
-11.6
5.2
-0.5
4.4
3 May 2018
38

MOSL Universe stock performance
Company
Others
Arvind
Avenue Super.
BSE
Castrol India
Coromandel Intl
Delta Corp
Interglobe
Indo Count
Info Edge
Kaveri Seed
Manpasand
MCX
Navneet Educat.
Oberoi Realty
Phoenix Mills
PI Inds.
Piramal Enterp.
Quess Corp
SRF
S H Kelkar
Tata Chemicals
Team Lease Serv.
Trident
UPL
V-Guard
1 Day (%)
-3.8
0.0
-1.1
3.1
-4.4
-2.8
-3.7
-3.4
0.3
-3.2
-1.7
-2.8
0.4
-1.0
-0.4
-1.0
-0.6
-1.8
-1.9
0.8
0.3
-2.2
-1.8
0.2
-1.5
1M (%)
3.1
10.1
5.5
-2.2
-15.6
7.6
1.5
-3.4
3.4
4.5
4.8
7.9
-0.4
8.3
2.4
-4.4
4.9
12.4
18.0
-5.0
10.6
15.4
5.8
-2.4
4.6
12M (%)
-0.3
98.4
-18.9
-8.2
25.9
62.8
19.9
-55.8
47.3
-8.2
11.3
-36.1
-12.7
38.9
52.1
-0.4
1.7
45.3
32.8
-25.3
17.1
149.0
-18.6
-8.9
24.3
3 May 2018
39

NOTES
3 May 2018
40

THEMATIC/STRATEGY RESEARCH GALLERY

REPORT GALLERY
RECENT INITIATING COVERAGE REPORTS
.
Rs

DIFFERENTIATED PRODUCT GALLERY

Explanation of Investment Rating
Investment Rating
BUY
SELL
NEUTRAL
UNDER REVIEW
NOT RATED
Expected return (over 12-month)
>=15%
< - 10%
> - 10 % to 15%
Rating may undergo a change
We have forward looking estimates for the stock but we refrain from assigning recommendation
*In case the recommendation given by the Research Analyst becomes inconsistent with the investment rating legend, the Research Analyst shall within 28 days of the inconsistency, take appropriate measures to make the recommendation consistent with the investment rating legend.
Disclosures:
The following Disclosures are being made in compliance with the SEBI Research Analyst Regulations 2014 (herein after referred to as the Regulations).
Motilal Oswal Securities Ltd. (MOSL) is a SEBI Registered Research Analyst having registration no. INH000000412. MOSL, the Research Entity (RE) as defined in the Regulations, is engaged in the business of providing Stock broking services,
Investment Advisory Services, Depository participant services & distribution of various financial products. MOSL is a subsidiary company of Motilal Oswal Financial Service Ltd. (MOFSL). MOFSL is a listed public company, the details in respect of
which are available on www.motilaloswal.com. MOSL is registered with the Securities & Exchange Board of India (SEBI) and is a registered Trading Member with National Stock Exchange of India Ltd. (NSE) and Bombay Stock Exchange Limited
(BSE), Multi Commodity Exchange of India Limited(MCX) and National Commodity & Derivatives Exchange Limited(NCDEX) for its stock broking activities & is Depository participant with Central Depository Services Limited (CDSL) & National
Securities Depository Limited (NSDL) and is member of Association of Mutual Funds of India (AMFI) for distribution of financial products and Insurance Regulatory & Development Authority of India (IRDA) as Corporate Agent for insurance products
.Details of associate entities of Motilal Oswal Securities Limited are available on the website at http://onlinereports.motilaloswal.com/Dormant/documents/Associate%20Details.pdf
MOSL, it’s associates, Research Analyst or their relative may have any financial interest in the subject company. MOSL and/or its associates and/or Research Analyst may have beneficial ownership of 1% or more securities in the subject company at
the end of the month immediately preceding the date of publication of the Research Report. MOSL and its associate company(ies), their directors and Research Analyst and their relatives may; (a) from time to time, have a long or short position in, act
as principal in, and buy or sell the securities or derivatives thereof of companies mentioned herein. (b) be engaged in any other transaction involving such securities and earn brokerage or other compensation or act as a market maker in the financial
instruments of the company(ies) discussed herein or act as an advisor or lender/borrower to such company(ies) or may have any other potential conflict of interests with respect to any recommendation and other related information and opinions.;
however the same shall have no bearing whatsoever on the specific recommendations made by the analyst(s), as the recommendations made by the analyst(s) are completely independent of the views of the associates of MOSL even though there
might exist an inherent conflict of interest in some of the stocks mentioned in the research report. Research Analyst may have served as director/officer, etc. in the subject company in the last 12 month period. MOSL and/or its associates may have
received any compensation from the subject company in the past 12 months.
In the last 12 months period ending on the last day of the month immediately preceding the date of publication of this research report, MOSL or any of its associates may have:
a)
managed or co-managed public offering of securities from subject company of this research report,
b)
received compensation for investment banking or merchant banking or brokerage services from subject company of this research report,
c)
received compensation for products or services other than investment banking or merchant banking or brokerage services from the subject company of this research report.
d)
Subject Company may have been a client of MOSL or its associates during twelve months preceding the date of distribution of the research report.
MOSL and it’s associates have not received any compensation or other benefits from the subject company or third party in connection with the research report. To enhance transparency, MOSL has incorporated a Disclosure of Interest Statement in
this document. This should, however, not be treated as endorsement of the views expressed in the report. MOSL and / or its affiliates do and seek to do business including investment banking with companies covered in its research reports. As a result,
the recipients of this report should be aware that MOSL may have a potential conflict of interest that may affect the objectivity of this report. Compensation of Research Analysts is not based on any specific merchant banking, investment banking or
brokerage service transactions.
Terms & Conditions:
This report has been prepared by MOSL and is meant for sole use by the recipient and not for circulation. The report and information contained herein is strictly confidential and may not be altered in any way, transmitted to, copied or distributed, in part
or in whole, to any other person or to the media or reproduced in any form, without prior written consent of MOSL. The report is based on the facts, figures and information that are considered true, correct, reliable and accurate. The intent of this report
is not recommendatory in nature. The information is obtained from publicly available media or other sources believed to be reliable. Such information has not been independently verified and no guaranty, representation of warranty, express or implied,
is made as to its accuracy, completeness or correctness. All such information and opinions are subject to change without notice. The report is prepared solely for informational purpose and does not constitute an offer document or solicitation of offer to
buy or sell or subscribe for securities or other financial instruments for the clients. Though disseminated to all the customers simultaneously, not all customers may receive this report at the same time. MOSL will not treat recipients as customers by
virtue of their receiving this report.
Analyst Certification
The views expressed in this research report accurately reflect the personal views of the analyst(s) about the subject securities or issues, and no part of the compensation of the research analyst(s) was, is, or will be directly or indirectly related to the
specific recommendations and views expressed by research analyst(s) in this report.
Disclosure of Interest Statement
Analyst ownership of the stock
Companies where there is interest
No
A graph of daily closing prices of securities is available at www.nseindia.com, www.bseindia.com. Research Analyst views on Subject Company may vary based on Fundamental research and Technical Research. Proprietary trading desk of MOSL or
its associates maintains arm’s length distance with Research Team as all the activities are segregated from MOSL research activity and therefore it can have an independent view with regards to subject company for which Research Team have
expressed their views.
Regional Disclosures (outside India)
This report is not directed or intended for distribution to or use by any person or entity resident in a state, country or any jurisdiction, where such distribution, publication, availability or use would be contrary to law, regulation or which would subject
MOSL & its group companies to registration or licensing requirements within such jurisdictions.
For Hong Kong:
This report is distributed in Hong Kong by Motilal Oswal capital Markets (Hong Kong) Private Limited, a licensed corporation (CE AYY-301) licensed and regulated by the Hong Kong Securities and Futures Commission (SFC) pursuant to the Securities
and Futures Ordinance (Chapter 571 of the Laws of Hong Kong) “SFO”. As per SEBI (Research Analyst Regulations) 2014 Motilal Oswal Securities (SEBI Reg No. INH000000412) has an agreement with Motilal Oswal capital Markets (Hong Kong)
Private Limited for distribution of research report in Hong Kong. This report is intended for distribution only to “Professional Investors” as defined in Part I of Schedule 1 to SFO. Any investment or investment activity to which this document relates is only
available to professional investor and will be engaged only with professional investors.” Nothing here is an offer or solicitation of these securities, products and services in any jurisdiction where their offer or sale is not qualified or exempt from
registration. The Indian Analyst(s) who compile this report is/are not located in Hong Kong & are not conducting Research Analysis in Hong Kong.
For U.S.
Motilal Oswal Securities Limited (MOSL) is not a registered broker - dealer under the U.S. Securities Exchange Act of 1934, as amended (the"1934 act") and under applicable state laws in the United States. In addition MOSL is not a registered
investment adviser under the U.S. Investment Advisers Act of 1940, as amended (the "Advisers Act" and together with the 1934 Act, the "Acts), and under applicable state laws in the United States. Accordingly, in the absence of specific exemption
under the Acts, any brokerage and investment services provided by MOSL, including the products and services described herein are not available to or intended for U.S. persons. This report is intended for distribution only to "Major Institutional
Investors" as defined by Rule 15a-6(b)(4) of the Exchange Act and interpretations thereof by SEC (henceforth referred to as "major institutional investors"). This document must not be acted on or relied on by persons who are not major institutional
investors. Any investment or investment activity to which this document relates is only available to major institutional investors and will be engaged in only with major institutional investors. In reliance on the exemption from registration provided by Rule
15a-6 of the U.S. Securities Exchange Act of 1934, as amended (the "Exchange Act") and interpretations thereof by the U.S. Securities and Exchange Commission ("SEC") in order to conduct business with Institutional Investors based in the U.S.,
MOSL has entered into a chaperoning agreement with a U.S. registered broker-dealer, Motilal Oswal Securities International Private Limited. ("MOSIPL"). Any business interaction pursuant to this report will have to be executed within the provisions of
this chaperoning agreement.
The Research Analysts contributing to the report may not be registered /qualified as research analyst with FINRA. Such research analyst may not be associated persons of the U.S. registered broker-dealer, MOSIPL, and therefore, may not be subject
to NASD rule 2711 and NYSE Rule 472 restrictions on communication with a subject company, public appearances and trading securities held by a research analyst account.
For Singapore
Motilal Oswal Capital Markets Singapore Pte Limited is acting as an exempt financial advisor under section 23(1)(f) of the Financial Advisers Act(FAA) read with regulation 17(1)(d) of the Financial Advisors Regulations and is a subsidiary of Motilal
Oswal Securities Limited in India. This research is distributed in Singapore by Motilal Oswal Capital Markets Singapore Pte Limited and it is only directed in Singapore to accredited investors, as defined in the Financial Advisers Regulations and the
Securities and Futures Act (Chapter 289), as amended from time to time. In respect of any matter arising from or in connection with the research you could contact the following representatives of Motilal Oswal Capital Markets Singapore Pte Limited:
Disclaimer:
The report and information contained herein is strictly confidential and meant solely for the selected recipient and may not be altered in any way, transmitted to, copied or distributed, in part or in whole, to any other person or to the media or reproduced
in any form, without prior written consent. This report and information herein is solely for informational purpose and may not be used or considered as an offer document or solicitation of offer to buy or sell or subscribe for securities or other financial
instruments. Nothing in this report constitutes investment, legal, accounting and tax advice or a representation that any investment or strategy is suitable or appropriate to your specific circumstances. The securities discussed and opinions expressed in
this report may not be suitable for all investors, who must make their own investment decisions, based on their own investment objectives, financial positions and needs of specific recipient. This may not be taken in substitution for the exercise of
independent judgment by any recipient. Each recipient of this document should make such investigations as it deems necessary to arrive at an independent evaluation of an investment in the securities of companies referred to in this document
(including the merits and risks involved), and should consult its own advisors to determine the merits and risks of such an investment. The investment discussed or views expressed may not be suitable for all investors. Certain transactions -including
those involving futures, options, another derivative products as well as non-investment grade securities - involve substantial risk and are not suitable for all investors. No representation or warranty, express or implied, is made as to the accuracy,
completeness or fairness of the information and opinions contained in this document. The Disclosures of Interest Statement incorporated in this document is provided solely to enhance the transparency and should not be treated as endorsement of the
views expressed in the report. This information is subject to change without any prior notice. The Company reserves the right to make modifications and alternations to this statement as may be required from time to time without any prior approval.
MOSL, its associates, their directors and the employees may from time to time, effect or have effected an own account transaction in, or deal as principal or agent in or for the securities mentioned in this document. They may perform or seek to perform
investment banking or other services for, or solicit investment banking or other business from, any company referred to in this report. Each of these entities functions as a separate, distinct and independent of each other. The recipient should take this
into account before interpreting the document. This report has been prepared on the basis of information that is already available in publicly accessible media or developed through analysis of MOSL. The views expressed are those of the analyst, and
the Company may or may not subscribe to all the views expressed therein. This document is being supplied to you solely for your information and may not be reproduced, redistributed or passed on, directly or indirectly, to any other person or
published, copied, in whole or in part, for any purpose. This report is not directed or intended for distribution to, or use by, any person or entity who is a citizen or resident of or located in any locality, state, country or other jurisdiction, where such
distribution, publication, availability or use would be contrary to law, regulation or which would subject MOSL to any registration or licensing requirement within such jurisdiction. The securities described herein may or may not be eligible for sale in all
jurisdictions or to certain category of investors. Persons in whose possession this document may come are required to inform themselves of and to observe such restriction. Neither the Firm, not its directors, employees, agents or representatives shall
be liable for any damages whether direct or indirect, incidental, special or consequential including lost revenue or lost profits that may arise from or in connection with the use of the information. The person accessing this information specifically agrees
to exempt MOSL or any of its affiliates or employees from, any and all responsibility/liability arising from such misuse and agrees not to hold MOSL or any of its affiliates or employees responsible for any such misuse and further agrees to hold MOSL
or any of its affiliates or employees free and harmless from all losses, costs, damages, expenses that may be suffered by the person accessing this information due to any errors and delays.
Registered Office Address: Motilal Oswal Tower, Rahimtullah Sayani Road, Opposite Parel ST Depot, Prabhadevi, Mumbai-400025; Tel No.: 022-3980 4263; www.motilaloswal.com. Correspondence Address: Palm Spring Centre, 2nd Floor, Palm
Court Complex, New Link Road, Malad (West), Mumbai- 400 064. Tel No: 022 3080 1000. Compliance Officer: Neeraj Agarwal, Email Id:
na@motilaloswal.com,
Contact No.:022-38281085.
Registration details of group entities.: MOSL: SEBI Registration: INZ000158836 (BSE/NSE/MCX/NCDEX); CDSL: IN-DP-16-2015; NSDL: IN-DP-NSDL-152-2000; Research Analyst: INH000000412. AMFI: ARN 17397. Investment Adviser:
INA000007100.IRDA Corporate Agent-CA0541. Motilal Oswal Asset Management Company Ltd. (MOAMC): PMS (Registration No.: INP000000670) offers PMS and Mutual Funds products. Motilal Oswal Wealth Management Ltd. (MOWML): PMS
(Registration No.: INP000004409) offers wealth management solutions. *Motilal Oswal Securities Ltd. is a distributor of Mutual Funds, PMS, Fixed Deposit, Bond, NCDs, Insurance and IPO products. * Motilal Oswal Commodities Broker Pvt. Ltd. offers
Commodities Products. * Motilal Oswal Real Estate Investment Advisors II Pvt. Ltd. offers Real Estate products. * Motilal Oswal Private Equity Investment Advisors Pvt. Ltd. offers Private Equity products
13 December 2016
41