IndusInd Bank
BSE SENSEX
35,160
S&P CNX
10,739
2 May 2018
Update
| Sector:
Financials
CMP: INR1,872
TP: INR2,150 (+15%)
Buy
BHAFIN’s performance on track; earnings to accelerate post-merger
Expect RoA/RoE to recover to 2.2%/20.3% by FY20
Stock Info
Bloomberg
Equity Shares (m)
52-Week Range (INR)
1, 6, 12 Rel. Per (%)
M.Cap. (INR b)
M.Cap. (USD b)
Avg Val, INRm
Free float (%)
Financials Snapshot (INR b)
2018 2019E
Y/E Mar
NII
OP
NP
NIM (%)
EPS (INR)
EPS Gr. (%)
BV/Sh. (INR)
RoE (%)
RoA (%)
P/E (X)
P/BV (X)
P/ABV (X)
75.0
66.6
36.1
4.2
60.2
25.2
394.1
16.5
1.8
31.1
4.8
4.8
111.1
98.2
53.5
4.7
83.0
37.9
452.9
19.6
2.1
22.6
4.1
4.2
IIB IN
600.2
1898 / 1375
2/11/13
1125
17.5
1986.0
85.0
2020E
145.2
131.4
72.8
4.7
104.4
25.8
577.9
20.3
2.2
17.9
3.2
3.3
After successfully completing three planning cycles, IndusInd Bank (IIB) has now
entered the fourth planning cycle (FY18-20). Besides delivering healthy profitability
and gaining market share in the existing businesses, it intends to further develop its
long-cherished livelihood financing theme in this cycle.
IIB has already taken a first step toward this by announcing a merger with its business
correspondent (BC) partner, Bharat Financial Inclusion (BHAFIN). It will be able to
leverage BHAFIN’s rural network, and thus, provide last-mile financing to villages
without incurring additional cost.
We expect IIB to report healthy acceleration in earnings over FY18-20 (as the
impending merger with BHAFIN gets concluded) and project RoA/RoE of 2.2%/20.3%
in FY20. Our forecasts are premised on expectations of steady expansion in margins
(FY20E: 4.7%), an improvement in the C/I ratio (by 190bp) and controlled credit cost.
We reiterate our Buy rating on IIB, with a target price of INR2,150 (3.8x FY20E ABV).
BHAFIN’s performance on track; demonetization impact waning
BHAFIN has orchestrated an impressive turnaround, led by strong performance
across operating parameters. It delivered AUM/PAT growth of 38% /57% in FY18,
while the GNPL/NNPL ratios declined to 2.4%/0.1% from 6%/2.7% in FY17.
Cumulative collection efficiency for loans disbursed post 1st January 2017 stands at
99.8%, indicating normalization of on-the-ground operations. Margins have been
largely stable, while a reduction in funding cost and an improvement in operating
leverage (cost-income ratio is down to 50% from 74% in FY14) could provide a
booster to earnings growth. BHAFIN has guided for AUM/earnings growth of
43%/36% in FY19.
Merger with BHAFIN to help attain last-mile rural connectivity
IIB intends to leverage BHAFIN’s rural presence to establish an extensive rural
distribution network in ~100,000 villages, with at least one customer touch point
within a 0.5km radius of these villages. The bank also plans to capitalize on the
cross-sell opportunities by mining BHAFIN’s customer base. The focus areas here
would be savings accounts, recurring deposits, partnerships for two-wheeler and
home improvement loans, and PSLC fee income opportunities from an enhanced
loan base qualifying for PSL. We also note that IIB is in the process of running a few
pilot projects to assess the viability of these initiatives (refer Exhibit 16 for more
details).
Shareholding pattern (%)
As On
Mar-18 Dec-17 Mar-17
Promoter
DII
FII
Others
15.0
10.0
57.2
17.8
15.0
11.7
55.3
18.0
15.0
12.3
54.2
18.6
FII Includes depository receipts
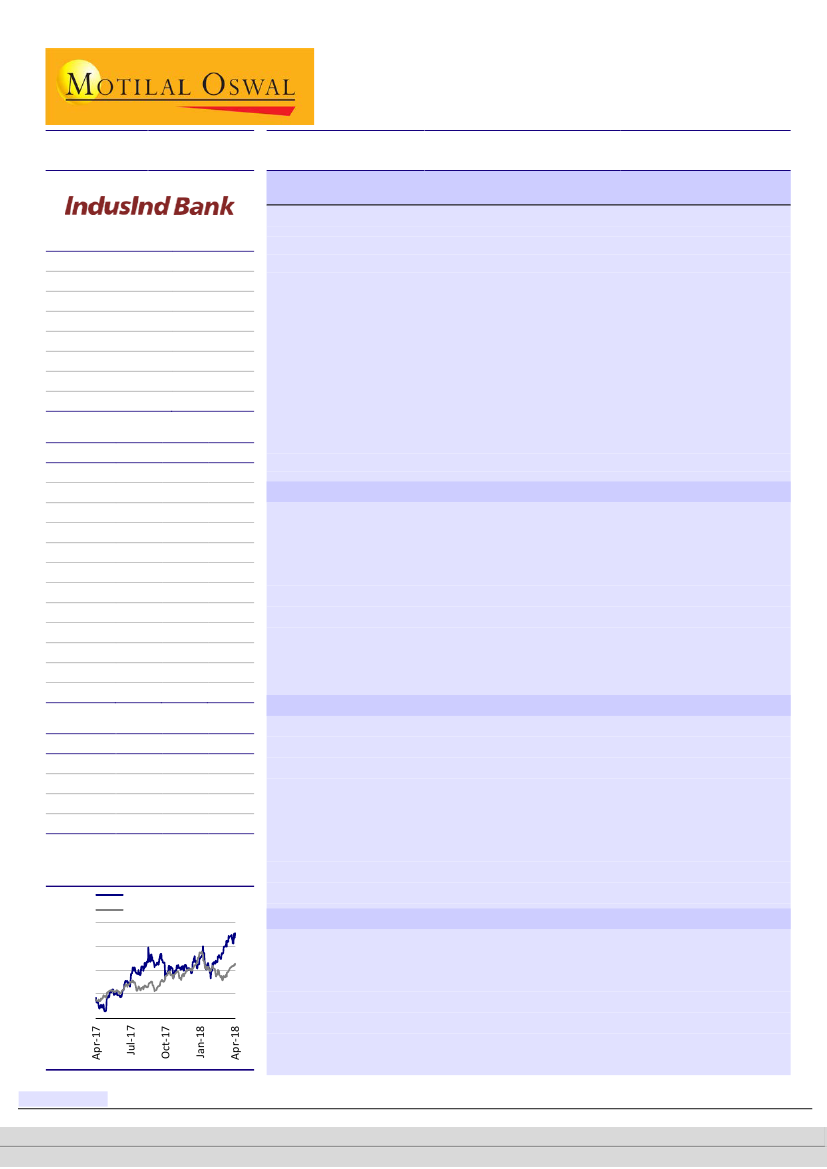
Stock Performance (1-year)
IndusInd Bank
Sensex - Rebased
1,950
1,800
1,650
1,500
1,350
Enough levers to achieve ‘Planning Cycle IV’ targets
IIB is aiming to achieve 25-30% loan growth in its Planning Cycle IV (FY17-20). After
achieving 26%+ loan book CAGR over FY12-18, the bank continues witnessing strong
traction across product lines. IIB sees significant headroom for growth to meet its
target from the partnership with BHAFIN. Besides the core business (wherein the
trends are strong in both corporate and vehicle financing segments), IIB anticipates
growth kicker from two areas: (1) microfinance business is re-entering the growth
phase after tiding over asset quality issues post demonetization, and
Research Analyst: Nitin Aggarwal
(Nitin.Aggarwal@MotilalOswal.com); +91 22 3982 5540
| Anirvan Sarkar
(Anirvan.Sarkar@MotilalOswal.com); +91 22 3982 5505
Alpesh Mehta
(Alpesh.Mehta@MotilalOswal.com); +91 22 3982 5415
| Parth Gutka
(Parth.Gutka@motilaloswal.com); +91 22 3010 2746
Investors are advised to refer through important disclosures made at the last page of the Research Report.
Motilal Oswal research is available on www.motilaloswal.com/Institutional-Equities, Bloomberg, Thomson Reuters, Factset and S&P Capital.

IndusInd Bank
(2) cross-sell opportunities in this space are significant, as the bank looks to expand
the scope of its partnership with BHAFIN by extending two-wheeler and home
improvement loans to the latter’s existing MFI customer base.
Consumer loan mix to reach ~52% post-merger
The merger with BHAFIN will add ~6% to IIB’s existing loans and ~5% to its balance
sheet. The share of the consumer finance segment, thus, is expected to increase to
~52% (including business banking group). This takes IIB one step closer toward
achieving its desired business mix between the retail and wholesale segments.
Already achieved CASA targets; expect momentum to continue
IIB surpassed its ‘Planning Cycle IV’ CASA targets in FY18 itself, as it reported ~715bp
improvement in CASA ratio. This was led by ~70% YoY growth in SA deposits. The
bank sees significant room for savings deposits growth from two levers: (1) business
from government departments in charge of budgetary allocations and shifting them
from cash basis to its own cashless platforms, and (2) cross-sell of SA accounts to
BHAFIN’s 7.3m customer base.
MFI business via bank can earn better returns; also removes political and
other overhangs
The MFI business can generate relatively high and sustainable RoEs under a banking
set-up due to (a) lower cost of funds (difference of ~400bp between IIB and
BHAFIN), (b) no cap on spreads, (c) higher leverage (10x v/s 5x currently), (d)
elimination of the need to carry excess liquidity, which is required in day-to-day
operations and first loss margins for off-balance sheet, and (e) removal of political
and regulatory overhang. We estimate RoA/RoE for the merged entity to increase to
2.2%/20.3% by FY20, driven by an improvement in margins and cost-ratios, as well
as better fee income opportunities.
Earnings set to accelerate post-merger; maintain Buy with TP of INR2,150
We find IIB attractive for its strong earnings/business growth potential and ability to
deliver industry-leading margins and RoA. With the merger, the bank is set to
establish its presence in niche segments and continue gaining market share with
improving profitability. It is targeting 25-30% loan growth, driven by continued
branch expansion (aiming at 2,000 branches by FY20 v/s 1,400 currently) and
customer acquisition (+2x to 20m). We have built in the BHAFIN merger and
proposed warrant issuance to promoters in our projections. Maintain
Buy
with a
target price of INR2,150 (3.8x FY20E ABV).
2 May 2018
2

IndusInd Bank
Exhibit 1: Financials for the merged entity
IndusInd Bank -
pre-merger projections
FY19E
FY20E
Profit and loss account
NII
Other Income
Net Income
Opex
PPP
Provisions
PBT
Tax
PAT
Growth
Balance sheet
Equity
Reserves and surplus
Networth
Growth
Loans
Growth
Total Assets
Growth
Key Ratios
EPS
BV
RoA
RoE
94,794
64,658
159,453
74,184
85,269
13,746
71,524
24,318
47,206
29.2
5,982
265,509
271,491
17.4
1,790,980
26.2
2,774,684
25.7
78.9
447.6
1.89
19.1
120,082
80,823
200,905
91,428
109,477
17,593
91,884
31,241
60,644
28.5
5,982
317,357
323,338
19.1
2,265,590
26.5
3,502,657
26.2
101.4
534.3
1.93
20.7
Merged Entity
(current estimates)
FY19E
FY20E
111,072
69,826
180,898
82,674
98,224
17,137
81,087
27,570
53,518
145,243
88,680
233,922
102,517
131,405
21,154
110,252
37,486
72,766
36.0
7,050
402,414
409,463
30.3
2,515,381
25.6
3,699,691
31.0
104.4
577.9
2.2
20.3
Source: Company, MOSL
6,892
307,336
314,228
2,001,934
2,825,210
83.0
452.9
2.1
19.6
2 May 2018
3

IndusInd Bank
BHAFIN’s performance on track; demonetization impact waning
BHAFIN has orchestrated an impressive turnaround, led by a strong performance
across operating parameters. It delivered AUM/PAT growth of 38% /57% in FY18,
while the GNPL/NNPL ratios declined to 2.4%/0.1% in the year from 6%/2.7% in
FY17. Cumulative collection efficiency for loans disbursed post 1
st
January 2017
stands at 99.8%, indicating normalization of on-the-ground operations. Margins
have been largely stable, while a reduction in funding cost and an improvement in
operating leverage (cost-income ratio is down to 50% from 74% in FY14) could
provide a booster to earnings growth. BHAFIN has guided for AUM/earnings growth
of 43%/36% in FY19.
Exhibit 2: BHAFIN: Earnings have shown steady progression over past three quarters (INR m)
Y/E March
Income from operations
Other Income
Operating Income
Interest expenses
Other income
Net Income
Operating Expenses
Operating Profits
Provisions
Profit before tax
Tax Provisions
Net Profit
Asset quality
Gross NPA
Net NPA
GNPA (%)
NNPA (%)
AUM related
Overall AUM
On balance sheet
Other details
CAR
Branches
Centers (Sangam)
Loan officers
1Q
3,341
348
3,690
1,361
452
2,780
1,269
1,511
120
1,391
-969
2,359
35
16
0.06
0.03
84,630
62,270
23
1,368
226,307
7,914
FY17
2Q
3,692
382
4,074
1,576
422
2,921
1,372
1,548
90
1,459
0
1,459
63
30
0.10
0.04
90,460
69,350
33
1,359
262,183
9,308
3Q
3,682
407
4,089
1,643
460
2,906
1,440
1,466
38
1,428
0
1,428
41
19
0.06
0.03
85,310
68,910
36
1,391
274,773
9,422
4Q
3,290
388
3,678
1,646
415
2,447
1,451
996
3,346
-2,349
0
-2,349
4,281
1,853
6.00
2.70
91,500
71,760
34
1,399
279,252
9,157
1Q
3,720
392
4,112
1,749
519
2,881
1,493
1,388
1,759
-371
0
-371
4,635
689
6.00
1.00
96,310
77,090
32
1,408
286,259
9,251
FY18
2Q
4,237
396
4,633
1,759
421
3,295
1,602
1,693
499
1,194
0
1,194
4,414
222
5.20
0.30
105,970
84,350
31
1,452
295,140
9,470
3Q
4,576
416
4,992
1,783
401
3,610
1,942
1,668
86
1,582
0
1,582
4,114
135
4.60
0.20
114,660
86,470
31
1,513
308,273
9,960
4Q
4,900
492
5,392
1,813
506
4,085
1,981
2,104
6
2,098
-7
2,105
2,110
80
2.40
0.10
125,940
88,590
33
1,567
335,070
10,208
FY17
14,005
1,526
15,531
6,225
1,748
11,054
5,533
5,522
3,594
1,928
-969
2,897
4,281
1,853
6.0
2.7
91,500
71,760
34
1,399
279,252
9,157
FY18
17,432
1,696
19,128
7,104
1,848
13,871
7,018
6,854
2,350
4,503
-7
4,510
2,110
80
2.4
0.1
125,940
88,590
33
1,567
335,070
10,208
Source: Company, MOSL
Merger with BHAFIN to help attain last mile rural connectivity
IIB primarily does business in metro and urban areas, with limited rural presence.
BHAFIN, on the other hand, has a significant rural footprint, with ~80% of its AUM in
rural areas. IIB, thus, intends to leverage BHAFIN’s rural presence to establish an
extensive rural distribution network in ~100,000 villages, with at least one customer
touch point within a 0.5km radius of these villages. The bank also plans to capitalize
on the cross-sell opportunities by mining BHAFIN’s customer base. The focus areas
here would be savings accounts, recurring deposits, partnerships for two-wheeler
and home improvement loans, and PSLC fee income opportunities from an
enhanced loan base qualifying for PSL. We also note that IIB is in the process of
running a few pilot projects to assess the viability of these initiatives.
2 May 2018
4

IndusInd Bank
Exhibit 3: Post-merger, IIB to expand its reach to more states – focus to be mainly on asset
branches (% share in private banks)
MAHARASHTRA
UTTAR PRADESH
KARNATAKA
ODISHA
BIHAR
WEST BENGAL
RAJASTHAN
MADHYA PRADESH
HARYANA
PUNJAB
CHATTISGARH
KERALA
JHARKHAND
TELANGANA
GUJARAT
TAMIL NADU
ANDHRA PRADESH
OTHERS
TOTAL
ENTERING NEW STATES
Gujarat
Tamil Nadu
Assam
Tripura
Overall
BFIN
148
158
178
188
178
150
84
80
34
27
53
70
70
-
-
-
-
15
1,433
5
5
5
5
1,453
IIB
174
112
40
43
31
60
103
88
103
116
35
40
27
60
103
75
44
146
1,400
Merged entity
322
270
218
231
209
210
187
168
137
143
88
110
97
60
103
75
44
2,833
Post-merger (%)
11.4
9.5
7.7
8.2
7.4
7.4
6.6
5.9
4.8
5.0
3.1
3.9
3.4
2.1
3.6
2.6
1.6
1,400
2,853
Source: Company, MOSL
Enough levers to meet ‘Planning Cycle IV’ targets
After achieving 26%+ loan book CAGR over FY12-18, IIB is aiming to deliver 25-30%
loan growth over FY18-20. The bank sees significant headroom for growth to meet
its target from the partnership with BHAFIN. Growth is expected to come from two
areas: (1)
Microfinance business
is re-entering the growth phase post tiding over
the asset quality issues post demonetization; growth opportunities in this space are
immense, with the government’s consistent push towards promoting financial
inclusion. (2)
Cross-sell opportunities
in this space are also huge, as the bank
expands the scope of its partnership with BHAFIN to extend two-wheeler and home
improvement loans to the latter’s existing MFI customer base.
In vehicle financing, the bank is witnessing impressive traction in tractor financing
(15%+ volume growth) in rural areas – the share of tractor financing in the overall
consumer book increased from 3.2% in 1QFY17 to 4.8% in 4QFY18. The bank is also
witnessing strong growth in CV and construction equipment financing, while growth
in two-wheeler financing has been relatively modest. In addition to this, the bank is
focusing on ‘impact financing’ to enter into newer geographies/segments of lending
where it has less comfort. It plans to do this in four stages: 1) co-underwriting with
an experienced player, 2) securitization/assignment of cleared book, 3) lending to
un-cleared book and 4) BC-led lending to the business.
2 May 2018
5

IndusInd Bank
Exhibit 4: Share of tractor financing as proportion of total
consumer book has increased steadily over past two years…
Tractor financing as % of total consumer book
Exhibit 5: ….led by a recovery in tractor sales volume
Domestic Tractor sales ('000)
3.2
3.6
4.1
4.0
4.4
4.6
4.7
4.8
480
536
527
634
551
493
693
582
Source: MOSL, Company
Mix of consumer loan increases to ~52% post-merger
IIB has always aimed to diversify its loan mix with a retail:corporate mix of 50:50
(from 40:60 now). The merger with BHAFIN will add ~6% to IIB’s existing loans and
~5% to its balance sheet. The share of the consumer finance segment, thus, is
expected to increase to ~52% (including business banking group). This thus takes IIB
closer toward achieving its desired business mix between the retail and wholesale
segments.
Exhibit 7: Proportion of MFI will increase to 8.4% post-
merger, while mix of consumer portfolio will increase to
52%
Exhibit 6: Pre-merger corporate: Proportion of retail loan
stands 46% of the total loan book
Large corp
Mid size corp
Small Corp
MFI Book
CFD (incl BBG)
3%
Source: Company, MOSL
43%
30%
44%
27%
Large corp
Mid size corp
Small Corp
MFI Book
CFD (incl BBG)
18%
6%
8.4%
16%
5%
Source: Company, MOSL
The merger with BHAFIN will not only support IIB to achieve its retail mix target, but
will also help it accelerate retail book growth. This is because the microfinance book
of BHAFIN is expected to grow at a 45% CAGR over FY17-20, while that of
standalone IIB is expected to grow at a relatively modest pace. This will help IIB
grow the share of low-ticket retail loans on its balance sheet.
2 May 2018
6

IndusInd Bank
Exhibit 8: BHAFIN’s AUM has grown at 40% CAGR over
FY12-18…
AUM (INRb)
Growth YoY (%), RHS
84
41
32
34
38
19
21
23.6
FY13
31.1
FY14
41.7
FY15
76.8
FY16
91.5
FY17
125.9
FY18
33.2
FY13
47.9
FY14
68.9
FY15
120.9
FY16
44
44
21
146.7
FY17
26
184.7
FY18
Exhibit 9: …while disbursement has grown at 41% CAGR
over FY12-18
Disbursement (INRb)
75
Growth YoY (%), RHS
Source: Company, MOSL
Already achieved CASA targets; expect momentum to continue
IIB surpassed its ‘Planning Cycle IV’ CASA targets in FY18 itself, as it reported ~715bp
improvement in the CASA ratio. This was led by ~70% YoY growth in SA deposits.
The bank sees significant room for savings deposits growth from two levers: (1)
Business from government departments in charge of budgetary allocations and
shifting them from cash basis to its own cashless platform. (2) Cross-sell of SA
accounts to BHAFIN’s 7.3m customer base. We expect the enhanced CASA base to
help IIB (i) bridge the funding cost gap with bigger banks (with a more established
liability franchise) and (ii) protect margins against any drop in yields from
competition in the retail space.
Exhibit 10: CASA ratio has shown significant improvement (~715bp over FY18) driven by
higher share of government business
SA (%)
CA (%)
Source: MOSL, Company
Margins set to expand sharply; borrowing cost for BHAFIN will ease
significantly
Incremental cost of
borrowing for BHAFIN
stands at 8.5%
Borrowing cost for BHAFIN will ease significantly as IIB repays all borrowings on day
one of the merger (according to regulatory requirement, a bank cannot lend to
another bank). We note that cost of borrowings for BHAFIN stands at ~9.6% (8.5%
on incremental basis), while that for IIB is at 6.6%. We, thus, estimate margins to
improve to 4.7% by FY20 from ~4% currently.
2 May 2018
7

IndusInd Bank
Exhibit 12: BHAFIN’s cost of borrowing is expected to come
down significantly post-merger
4.7
13.0
12.8
IIB
BHAFIN
11.7
10.7
6.3
6.6
Exhibit 11: NIMs to expand to 4.7% by FY20E
3.9
3.9
4.0
4.2
4.2
4.6
8.1
6.2
6.3
9.6
FY14
FY15
FY16
FY17
FY18
FY19e
FY20e
FY14
FY15
FY16
FY17
FY18
Source: Company, MOSL
Cost-income ratio likely to moderate to 43.8% for merged entity
Pick-up in revenue growth on the back of improved margins and stronger fee
income opportunities arising from PSLC sale are expected to drive a reduction in the
cost-income ratio for the merged entity. Besides this, higher operating leverage and
continuous process improvement (e.g., currently 98% of loans are disbursed directly
into the bank account of the customer; alongside BHAFIN has also started a pilot
project on cashless recovery of loans) should further help control operating costs.
Notably, such process improvement initiatives undertaken by BHAFIN have already
helped it reduce the center meeting duration from 45mins to 20mins, enabling sales
personnel to do more center meetings per day. We, thus, expect the cost-income
ratio for the merged entity to decline by 180bp to 43.8% over FY18-20.
Exhibit 13: CI ratio for merged entity is likely to decline by ~180bp to 43.8% by FY20
74.5
61.1
45.7
48.1
47.0 48.3
46.7
50.0
45.7
50.4
45.7
43.8
IIB
BHAFIN
FY14
FY15
FY16
FY17
FY18
FY19e
FY20e
Source: MOSL, Company
2 May 2018
8

IndusInd Bank
Experimenting with home improvement loans and two wheeler loans –
Pilot study
The merger underscores IIB management’s vision of capturing the potential in
livelihood loans. Apart from livestock and agriculture loans, BHAFIN has identified
huge unmet demand for home improvement and two-wheeler loans, which can be
added to the existing product portfolio.
Banks face major difficulties in servicing rural customers for home
improvement/extensions loans. The challenges include (i) home improvement loans
are normally taken from money lenders and families (although at a relatively high
borrowing cost), (ii) lack of title deeds in case of home loans, (iii) high transaction
cost per borrower and (iv) lack of distribution reach for technical and legal
assessment. However, leveraging its distribution network, BHAFIN has started pilot
projects to capitalize on the huge unmet demand (see exhibit 16).
Exhibit 14: Huge unmet demand for rural home improvement/extensions loans
Gap filled by:
own funds - 66%;
family ,friends & Money lenders - 34%
1,400
84
Annual Disbursement (INRb)
Annual Demand (INRb)
Source: Company, MOSL
Operating challenges in
rural (a) lack of title deeds
(b) high transaction cost (c)
lack of skilled manpower for
technical and legal
assessment
Exhibit 15: No formal lender of such scale due to operating challenges in this space
Salaried
Professionals
Self employed
Metro
very high
high
moderate
Urban
high
moderate
low
Semi urban
moderate
low
very low
Rural
No competition
No competition
No competition
Source: Company, MOSL
2 May 2018
9

IndusInd Bank
Exhibit 16: Pilot products
Purpose
Eligibility criteria
Ticket Size
Loan Tenure
LTV
Repayment frequency
Purpose
Home improvement and extension
- Should have completed at least 3 IGL loan cycles
- Age between 18 to 55yrs
INR0.1m to INR0.3m
3 to 5 yrs
Maximum 50% of the property value or 75% of the work estimate
whichever is lower
Monthly
Purchase of two wheeler
- Member of the JLG
- Minimum two IGL loan cycle completed
- should not have availed IGL/MTL/LTL in last 12 weeks
- exposure to borrower capped to INR0.1m across all the lenders
INR33,044 to INR54,950
104 Weeks
Maximum 80% of on road price of the vehicle
(subject to a maximum amount of INR54,950)
Weekly
Source: Company, MOSL
Portfolio outstanding for
home loans as on FY18 is
INR7.3m (no. of outstanding
loans: 30)
Pilot for two-wheeler loans
has resumed from April 17.
Portfolio outstanding for
two-wheelers as on FY18 is
INR35m (no. of outstanding
loans: 967)
Eligibility criteria
Ticket Size
Loan Tenure
LTV
Repayment frequency
2 May 2018
10

IndusInd Bank
Valuation view: Growth opportunities galore with improved profitability;
Maintain Buy with a PT of INR2, 150
Strong core profitability (3%+ of average assets v/s private banks’ average of
2.5% and HDFCB’s 2.7%), an improving CASA ratio (best among mid-sized private
banks), healthy return ratios (ROA of 1.9%+ and ROE of 16-17%) and strong
capitalization (tier 1 ratio of ~14.6%) are key positives. We expect IIB to report
strong 25%-30% loan growth, driven by multi-product portfolio, new product
addition, market share gains and base effect.
Performance in the first three planning cycles under the leadership of Mr Sobti
has been extremely impressive. Now, the bank has communicated its ‘Planning
Cycle IV’ (2017-20) target with a clear focus on growth with profitability and
increasing balance sheet granularity. IIB is targeting strong growth (25-30%), a
higher share of non-vehicle retail loans (25% by FY20 v/s 14% currently), a
strengthened liability franchise (by maintaining CASA ratio above 40%), return
on risk weighted assets of >2.4%, continued branch expansion (2,000 by FY20
v/s 1,400 currently) and customer acquisition (2x increase to 20m+).
Overall, we expect underlying growth in consumer finance division products to
continue reviving, with broad-based growth in the vehicle finance division and
new product additions. IIB is already witnessing healthy growth in LAP and
credit cards. Corporate loan growth is likely to be opportunistic (based on
spreads available). Less sell-down of loans and thoughtful selection of project
loans are also expected to prove beneficial.
NIMs are expected to improve, led by a higher-yielding microfinance book from
BHAFIN, higher share of retail liabilities, an expected improvement in the loan
mix toward high-yielding CFD, benefit of refinancing a few NCLT-related cases,
and higher share of fixed-rate loans. Close-to-customer business model of CV
financing has helped IIB maintain a strong asset quality performance, even
during tough times.
Superior margins, a focused fee income strategy and control over C/I ratio are
expected to keep earnings momentum healthy (~32% CAGR over FY18-20).
Capitalization remains one of the best in the industry, with a Tier 1 ratio of
14.6%. Moreover, the merger with BHAFIN should strengthen the bank's
earnings profile and further boost return ratios. We revise our numbers as we
build in the BHAFIN merger and the proposed warrant issuance to promoters in
our projections. Maintain
Buy
with a target price of INR2, 150 (3.3x FY20 ABV).
2 May 2018
11

IndusInd Bank
Exhibit 17: We estimate FY20E ROA/ROE to expand to 2.2%/20.3%
ROA
1.8
1.8
19.0
16.6
15.3
FY17
16.5
1.8
ROE
2.1
19.3
19.2
1.6
1.6
17.8
1.8
1.8
19.6
20.3
2.2
1.4
17.5
FY11
FY12
FY13
FY14
FY15
FY16
FY18
FY19e
FY20e
Source: MOSL, Company
Exhibit 18: DuPont Analysis of merged entity (% of average assets)
Y/E March
Net Interest Income
Non-Interest income
Total Income
Operating Expenses
Employee cost
Others
Operating Profit
Core operating Profits
Provisions
PBT
Tax
RoA
RoE
FY13
3.41
2.08
5.49
2.68
1.01
1.67
2.81
2.71
0.40
2.41
0.79
1.62
17.8
FY14
3.61
2.36
5.96
2.73
1.01
1.72
3.24
3.08
0.58
2.65
0.90
1.76
17.5
FY15
3.44
2.56
6.00
2.89
0.99
1.90
3.12
3.00
0.39
2.73
0.92
1.80
19.0
FY16
3.59
2.62
6.21
2.92
0.98
1.93
3.29
3.17
0.53
2.76
0.94
1.82
16.6
FY17
3.80
2.62
6.42
3.00
0.95
2.05
3.42
3.25
0.68
2.74
0.94
1.80
15.3
FY18
3.75
2.37
6.12
2.79
0.89
1.90
3.33
3.04
0.59
2.74
0.94
1.80
16.5
FY19E
4.41
2.77
7.18
3.28
1.16
2.12
3.90
3.62
0.68
3.22
1.09
2.12
19.6
FY20E
4.45
2.7
7.17
3.14
1.1
2.0
4.03
3.8
0.65
3.38
1.1
2.23
20.3
Source: Company, MOSL
2 May 2018
12

IndusInd Bank
Financials and valuations (IndusInd Bank)
Income Statement
Y/E March
Interest Income
Interest Expense
Net Interest Income
Growth (%)
Non-Interest Income
Total Income
Growth (%)
Operating Expenses
Pre Provision Profits
Growth (%)
Core PPP
Growth (%)
Provisions (excl tax)
PBT
Tax
Tax Rate (%)
PAT
Growth (%)
Balance Sheet
Y/E March
Equity Share Capital
Reserves & Surplus
Net Worth
Deposits
Growth (%)
of which CASA Dep
Borrowings
Other Liabilities & Prov.
Total Liabilities
Current Assets
Investments
Growth (%)
Loans
Growth (%)
Fixed Assets
Other Assets
Total Assets
Asset Quality
GNPA (INR m)
NNPA (INR m)
GNPA Ratio
NNPA Ratio
Slippage Ratio
Credit Cost
PCR (Excl Tech. write off)
E: MOSL Estimates
2013
69,832
47,504
22,329
31.0
13,630
35,958
32.4
17,564
18,395
34.0
17,750
35.0
2,631
15,764
5,152
32.7
10,612
32.2
2013
5,229
70,967
76,195
541,167
27.7
158,674
94,596
21,000
733,065
68,487
196,542
34.9
443,206
26.4
7,561
17,269
733,065
4,578
1,368
1.0
0.3
1.33
0.55
70.1
2014
82,535
53,628
28,907
29.5
18,905
47,812
33.0
21,853
25,960
41.1
24,676
39.0
4,676
21,283
7,203
33.8
14,080
32.7
2015
96,920
62,717
34,203
18.3
25,480
59,683
24.8
28,701
30,982
19.3
29,824
20.9
3,891
27,092
9,155
33.8
17,937
27.4
2016
115,807
70,641
45,166
32.1
32,969
78,135
30.9
36,721
41,414
33.7
39,892
33.8
6,722
34,693
11,828
34.1
22,864
27.5
2017
144,057
83,431
60,626
34.2
41,715
102,341
31.0
47,831
54,510
31.6
51,741
29.7
10,913
43,597
14,918
34.2
28,679
25.4
2017
5,982
200,328
206,309
1,265,722
36.1
466,460
224,537
89,764
1,786,484
186,283
367,021
17.6
1,130,805
27.9
13,352
89,023
1,786,484
10,549
4,388
0.9
0.4
1.42
0.70
58.4
2018E
172,808
97,833
74,975
23.7
47,501
122,476
19.7
55,914
66,561
22.1
60,831
17.6
11,754
54,807
18,747
34.2
36,060
25.7
2018E
6,002
232,269
238,271
1,516,392
19.8
667,290
382,891
78,563
2,216,262
132,159
500,767
36.4
1,449,537
28.2
13,388
120,412
2,216,262
17,049
7,457
1.2
0.5
1.84
0.91
56.3
2019E
247,903
136,831
111,072
48.1
69,826
180,898
47.7
82,674
98,224
47.6
91,348
50.2
17,137
81,087
27,570
34.0
53,518
48.4
2019E
6,892
307,336
314,228
1,948,563
28.5
820,345
444,422
117,996
2,825,210
236,906
629,226
25.7
2,001,934
38.1
16,337
-59,193
2,825,210
25,219
8,217
1.3
0.4
1.25
0.80
67.4
2020E
319,473
174,231
145,243
30.8
88,680
233,922
29.3
102,517
131,405
33.8
123,154
34.8
21,154
110,252
37,486
34.0
72,766
36.0
2020E
7,050
402,414
409,463
2,435,704
25.0
1,057,096
717,636
136,888
3,699,691
312,181
786,533
25.0
2,515,381
25.6
17,989
67,607
3,699,691
26,238
7,192
1.0
0.3
1.05
0.80
72.6
2014
2015
2016
5,256
5,295
5,950
85,063
101,010
170,872
90,319
106,305
176,822
605,023
741,344
930,001
11.8
22.5
25.4
196,909
252,996
327,240
147,620
206,181
221,559
27,187
63,900
72,050
870,259 1,117,869 1,400,570
67,694
107,791
101,119
215,630
228,780
312,143
9.7
6.1
36.4
551,018
687,882
884,193
24.3
24.8
28.5
10,164
11,576
12,553
25,753
81,840
90,561
870,259 1,117,869 1,400,570
6,208
1,841
1.1
0.3
1.26
0.63
70.4
5,629
2,104
0.8
0.3
1.43
0.55
62.6
7,768
3,216
0.9
0.4
1.08
0.64
58.6
2 May 2018
13

IndusInd Bank
Financials and valuations (IndusInd Bank)
Ratios
Y/E March
Yield and Cost Ratios (%)
Avg. Yield-Earning Assets
Avg. Yield on loans
Avg. Yield on Investments
Avg. Cost-Int. Bear. Liab.
Avg. Cost of Deposits
Interest Spread
Net Interest Margin
Capitalisation Ratios (%)
CAR
Tier I
Tier II
Profitability Ratios and Valuations
RoE
RoA
RoRWA
Book Value (INR)
Growth (%)
Price-BV (x)
Adjusted BV (INR)
Price-ABV (x)
EPS (INR)
Growth (%)
Price-Earnings (x)
Dividend Per Share (INR)
Dividend Yield (%)
E: MOSL Estimates
2013
11.1
14.1
6.1
8.3
8.3
2.7
3.7
2014
10.7
13.3
7.7
7.7
7.6
3.1
3.9
2015
10.4
12.5
7.5
7.4
7.7
2.7
3.9
2016
10.0
11.8
7.2
6.7
6.8
3.1
4.0
2017
9.7
11.4
7.2
6.3
6.3
3.3
4.2
2018E
9.2
10.6
6.6
5.8
6.1
3.1
4.2
2019E
10.0
11.6
7.3
6.4
6.0
4.0
4.7
2020E
9.9
11.4
7.1
6.3
5.9
3.9
4.7
15.4
13.8
1.6
13.8
12.7
1.1
12.1
11.2
0.9
15.5
14.9
0.6
15.3
14.7
0.6
15.0
14.6
0.5
14.8
14.4
0.3
15.3
15.0
0.3
17.8
1.6
2.0
143.7
17.5
1.8
2.1
167.9
16.8
165.4
26.9
25.4
4.1
19.0
1.8
2.0
197.0
17.3
194.2
34.0
26.6
4.8
16.6
1.8
2.0
293.9
49.2
290.1
40.7
19.6
5.9
15.3
1.8
2.0
341.7
16.3
336.6
48.1
18.2
7.2
141.9
21.4
3.5
16.5
1.8
2.1
393.8
15.2
4.8
385.1
4.9
60.2
25.2
31.1
8.8
0.5
19.6
2.1
2.3
452.9
15.0
4.1
444.6
4.2
83.0
37.9
22.6
8.8
0.5
20.3
2.2
2.6
577.9
27.6
3.2
570.8
3.3
104.4
25.8
17.9
10.5
0.6
2 May 2018
14

IndusInd Bank
NOTES
2 May 2018
15

Explanation of Investment Rating
Investment Rating
BUY
SELL
NEUTRAL
UNDER REVIEW
NOT RATED
Expected return (over 12-month)
>=15%
< - 10%
> - 10 % to 15%
Rating may undergo a change
We have forward looking estimates for the stock but we refrain from assigning recommendation
IndusInd Bank
*In case the recommendation given by the Research Analyst becomes inconsistent with the investment rating legend, the Research Analyst shall within 28 days of the inconsistency, take appropriate measures to make the recommendation consistent with the investment rating legend.
Disclosures:
NOTES
The following Disclosures are being made in compliance with the SEBI Research Analyst Regulations 2014 (herein after referred to as the Regulations).
Motilal Oswal Securities Ltd. (MOSL) is a SEBI Registered Research Analyst having registration no. INH000000412. MOSL, the Research Entity (RE) as defined in the Regulations, is engaged in the business of providing Stock broking services,
Investment Advisory Services, Depository participant services & distribution of various financial products. MOSL is a subsidiary company of Motilal Oswal Financial Service Ltd. (MOFSL). MOFSL is a listed public company, the details in respect of
which are available on
www.motilaloswal.com.
MOSL is registered with the Securities & Exchange Board of India (SEBI) and is a registered Trading Member with National Stock Exchange of India Ltd. (NSE) and Bombay Stock Exchange Limited
(BSE), Metropolitan Stock Exchange Of India Ltd. (MSE) for its stock broking activities & is Depository participant with Central Depository Services Limited (CDSL) & National Securities Depository Limited (NSDL) and is member of Association of
Mutual Funds of India (AMFI) for distribution of financial products. Details of associate entities of Motilal Oswal Securities Limited are available on the website at
http://onlinereports.motilaloswal.com/Dormant/documents/Associate%20Details.pdf
MOSL, it’s associates, Research Analyst or their relative may have any financial interest in the subject company. MOSL and/or its associates and/or Research Analyst may have beneficial ownership of 1% or more securities in the subject company at
the end of the month immediately preceding the date of publication of the Research Report.
MOSL and its associate company(ies), their directors and Research Analyst and their relatives may; (a) from time to time, have a long or short position in, act
as principal in, and buy or sell the securities or derivatives thereof of companies mentioned herein. (b) be engaged in any other transaction involving such securities and earn brokerage or other compensation or act as a market maker in the financial
instruments of the company(ies) discussed herein or act as an advisor or lender/borrower to such company(ies) or may have any other potential conflict of interests with respect to any recommendation and other related information and opinions.;
however the same shall have no bearing whatsoever on the specific recommendations made by the analyst(s), as the recommendations made by the analyst(s) are completely independent of the views of the associates of MOSL even though there
might exist an inherent conflict of interest in some of the stocks mentioned in the research report.
Research Analyst may have served as director/officer, etc. in the subject company in the last 12 month period. MOSL and/or its associates may have
received any compensation from the subject company in the past 12 months.
In the last 12 months period ending on the last day of the month immediately preceding the date of publication of this research report, MOSL or any of its associates may have:
a)
managed or co-managed public offering of securities from subject company of this research report,
b)
received compensation for investment banking or merchant banking or brokerage services from subject company of this research report,
c)
received compensation for products or services other than investment banking or merchant banking or brokerage services from the subject company of this research report.
d)
Subject Company may have been a client of MOSL or its associates during twelve months preceding the date of distribution of the research report.
MOSL and it’s associates have not received any compensation or other benefits from the subject company or third party in connection with the research report. To enhance transparency, MOSL has incorporated a Disclosure of Interest Statement in
this document. This should, however, not be treated as endorsement of the views expressed in the report. MOSL and / or its affiliates do and seek to do business including investment banking with companies covered in its research reports. As a result,
the recipients of this report should be aware that MOSL may have a potential conflict of interest that may affect the objectivity of this report. Compensation of Research Analysts is not based on any specific merchant banking, investment banking or
brokerage service transactions.
Terms & Conditions:
This report has been prepared by MOSL and is meant for sole use by the recipient and not for circulation. The report and information contained herein is strictly confidential and may not be altered in any way, transmitted to, copied or distributed, in part
or in whole, to any other person or to the media or reproduced in any form, without prior written consent of MOSL. The report is based on the facts, figures and information that are considered true, correct, reliable and accurate. The intent of this report
is not recommendatory in nature. The information is obtained from publicly available media or other sources believed to be reliable. Such information has not been independently verified and no guaranty, representation of warranty, express or implied,
is made as to its accuracy, completeness or correctness. All such information and opinions are subject to change without notice. The report is prepared solely for informational purpose and does not constitute an offer document or solicitation of offer to
buy or sell or subscribe for securities or other financial instruments for the clients. Though disseminated to all the customers simultaneously, not all customers may receive this report at the same time. MOSL will not treat recipients as customers by
virtue of their receiving this report.
Analyst Certification
The views expressed in this research report accurately reflect the personal views of the analyst(s) about the subject securities or issues, and no part of the compensation of the research analyst(s) was, is, or will be directly or indirectly related to the
specific recommendations and views expressed by research analyst(s) in this report.
Disclosure of Interest Statement
Analyst ownership of the stock
IndusInd Bank
No
A graph of daily closing prices of securities is available at
www.nseindia.com, www.bseindia.com.
Research Analyst views on Subject Company may vary based on Fundamental research and Technical Research. Proprietary trading desk of MOSL or
its associates maintains arm’s length distance with Research Team as all the activities are segregated from MOSL research activity and therefore it can have an independent view with regards to subject company for which Research Team have
expressed their views.
Regional Disclosures (outside India)
This report is not directed or intended for distribution to or use by any person or entity resident in a state, country or any jurisdiction, where such distribution, publication, availability or use would be contrary to law, regulation or which would subject
MOSL & its group companies to registration or licensing requirements within such jurisdictions.
For Hong Kong:
This report is distributed in Hong Kong by Motilal Oswal capital Markets (Hong Kong) Private Limited, a licensed corporation (CE AYY-301) licensed and regulated by the Hong Kong Securities and Futures Commission (SFC) pursuant to the Securities
and Futures Ordinance (Chapter 571 of the Laws of Hong Kong) “SFO”. As per SEBI (Research Analyst Regulations) 2014 Motilal Oswal Securities (SEBI Reg No. INH000000412) has an agreement with Motilal Oswal capital Markets (Hong Kong)
Private Limited for distribution of research report in Hong Kong. This report is intended for distribution only to “Professional Investors” as defined in Part I of Schedule 1 to SFO. Any investment or investment activity to which this document relates is only
available to professional investor and will be engaged only with professional investors.” Nothing here is an offer or solicitation of these securities, products and services in any jurisdiction where their offer or sale is not qualified or exempt from
registration. The Indian Analyst(s) who compile this report is/are not located in Hong Kong & are not conducting Research Analysis in Hong Kong.
For U.S.
Motilal Oswal Securities Limited (MOSL) is not a registered broker - dealer under the U.S. Securities Exchange Act of 1934, as amended (the"1934 act") and under applicable state laws in the United States. In addition MOSL is not a registered
investment adviser under the U.S. Investment Advisers Act of 1940, as amended (the "Advisers Act" and together with the 1934 Act, the "Acts), and under applicable state laws in the United States. Accordingly, in the absence of specific exemption
under the Acts, any brokerage and investment services provided by MOSL, including the products and services described herein are not available to or intended for U.S. persons. This report is intended for distribution only to "Major Institutional
Investors" as defined by Rule 15a-6(b)(4) of the Exchange Act and interpretations thereof by SEC (henceforth referred to as "major institutional investors"). This document must not be acted on or relied on by persons who are not major institutional
investors. Any investment or investment activity to which this document relates is only available to major institutional investors and will be engaged in only with major institutional investors. In reliance on the exemption from registration provided by Rule
15a-6 of the U.S. Securities Exchange Act of 1934, as amended (the "Exchange Act") and interpretations thereof by the U.S. Securities and Exchange Commission ("SEC") in order to conduct business with Institutional Investors based in the U.S.,
MOSL has entered into a chaperoning agreement with a U.S. registered broker-dealer, Motilal Oswal Securities International Private Limited. ("MOSIPL"). Any business interaction pursuant to this report will have to be executed within the provisions of
this chaperoning agreement.
The Research Analysts contributing to the report may not be registered /qualified as research analyst with FINRA. Such research analyst may not be associated persons of the U.S. registered broker-dealer, MOSIPL, and therefore, may not be subject
to NASD rule 2711 and NYSE Rule 472 restrictions on communication with a subject company, public appearances and trading securities held by a research analyst account.
For Singapore
In Singapore, this report is being distributed by Motilal Oswal Capital Markets Singapore Pte Ltd (“MOCMSPL”) (Co.Reg. NO. 201129401Z) which is a holder of a capital markets services license and an exempt financial adviser in Singapore,
as per the approved agreement under Paragraph 9 of Third Schedule of Securities and Futures Act (CAP 289) and Paragraph 11 of First Schedule of Financial Advisors Act (CAP 110) provided to MOCMSPL by Monetary Authority of Singapore.
Persons in Singapore should contact MOCMSPL in respect of any matter arising from, or in connection with this report/publication/communication. This report is distributed solely to persons who qualify as “Institutional Investors”, of which some of
whom may consist of "accredited" institutional investors as defined in section 4A(1) of the Securities and Futures Act, Chapter 289 of Singapore (“the SFA”). Accordingly, if a Singapore person is not or ceases to be such an institutional investor, such
Singapore Person must immediately discontinue any use of this Report and inform MOCMSPL.
Disclaimer:
The report and information contained herein is strictly confidential and meant solely for the selected recipient and may not be altered in any way, transmitted to, copied or distributed, in part or in whole, to any other person or to the media or reproduced
in any form, without prior written consent. This report and information herein is solely for informational purpose and may not be used or considered as an offer document or solicitation of offer to buy or sell or subscribe for securities or other financial
instruments. Nothing in this report constitutes investment, legal, accounting and tax advice or a representation that any investment or strategy is suitable or appropriate to your specific circumstances. The securities discussed and opinions expressed in
this report may not be suitable for all investors, who must make their own investment decisions, based on their own investment objectives, financial positions and needs of specific recipient. This may not be taken in substitution for the exercise of
independent judgment by any recipient. Each recipient of this document should make such investigations as it deems necessary to arrive at an independent evaluation of an investment in the securities of companies referred to in this document
(including the merits and risks involved), and should consult its own advisors to determine the merits and risks of such an investment. The investment discussed or views expressed may not be suitable for all investors. Certain transactions -including
those involving futures, options, another derivative products as well as non-investment grade securities - involve substantial risk and are not suitable for all investors. No representation or warranty, express or implied, is made as to the accuracy,
completeness or fairness of the information and opinions contained in this document. The Disclosures of Interest Statement incorporated in this document is provided solely to enhance the transparency and should not be treated as endorsement of the
views expressed in the report. This information is subject to change without any prior notice. The Company reserves the right to make modifications and alternations to this statement as may be required from time to time without any prior approval.
MOSL, its associates, their directors and the employees may from time to time, effect or have effected an own account transaction in, or deal as principal or agent in or for the securities mentioned in this document. They may perform or seek to perform
investment banking or other services for, or solicit investment banking or other business from, any company referred to in this report. Each of these entities functions as a separate, distinct and independent of each other. The recipient should take this
into account before interpreting the document. This report has been prepared on the basis of information that is already available in publicly accessible media or developed through analysis of MOSL. The views expressed are those of the analyst, and
the Company may or may not subscribe to all the views expressed therein. This document is being supplied to you solely for your information and may not be reproduced, redistributed or passed on, directly or indirectly, to any other person or
published, copied, in whole or in part, for any purpose. This report is not directed or intended for distribution to, or use by, any person or entity who is a citizen or resident of or located in any locality, state, country or other jurisdiction, where such
distribution, publication, availability or use would be contrary to law, regulation or which would subject MOSL to any registration or licensing requirement within such jurisdiction. The securities described herein may or may not be eligible for sale in all
jurisdictions or to certain category of investors. Persons in whose possession this document may come are required to inform themselves of and to observe such restriction. Neither the Firm, not its directors, employees, agents or representatives shall
be liable for any damages whether direct or indirect, incidental, special or consequential including lost revenue or lost profits that may arise from or in connection with the use of the information.
The person accessing this information specifically agrees
to exempt MOSL or any of its affiliates or employees from, any and all responsibility/liability arising from such misuse and agrees not to hold MOSL or any of its affiliates or employees responsible for any such misuse and further agrees to hold MOSL
or any of its affiliates or employees free and harmless from all losses, costs, damages, expenses that may be suffered by the person accessing this information due to any errors and delays.
Registered Office Address: Motilal Oswal Tower, Rahimtullah Sayani Road, Opposite Parel ST Depot, Prabhadevi, Mumbai-400025; Tel No.: 022-3980 4263; www.motilaloswal.com. Correspondence Address: Palm Spring Centre, 2nd Floor, Palm
Court Complex, New Link Road, Malad (West), Mumbai- 400 064. Tel No: 022 3080 1000. Compliance Officer: Neeraj Agarwal, Email Id:
na@motilaloswal.com,
Contact No.:022-38281085.
Registration details of group entities.: MOSL: SEBI Registration: INZ000158836 (BSE/NSE/MCX/NCDEX); CDSL: IN-DP-16-2015; NSDL: IN-DP-NSDL-152-2000; Research Analyst: INH000000412. AMFI: ARN 17397. Investment Adviser:
INA000007100.IRDA Corporate Agent-CA0541. Motilal Oswal Asset Management Company Ltd. (MOAMC): PMS (Registration No.: INP000000670) offers PMS and Mutual Funds products. Motilal Oswal Wealth Management Ltd. (MOWML): PMS
(Registration No.: INP000004409) offers wealth management solutions. *Motilal Oswal Securities Ltd. is a distributor of Mutual Funds, PMS, Fixed Deposit, Bond, NCDs, Insurance and IPO products. * Motilal Oswal Commodities Broker Pvt. Ltd. offers
Commodities Products. * Motilal Oswal Real Estate Investment Advisors II Pvt. Ltd. offers Real Estate products. * Motilal Oswal Private Equity Investment Advisors Pvt. Ltd. offers Private Equity products
2 May 2018
16