15 May 2018
Market snapshot
Equities - India
Close
Chg .%
Sensex
35,557
0.1
Nifty-50
10,807
0.0
Nifty-M 100
19,275
-1.2
Equities-Global
Close
Chg .%
S&P 500
2,730
0.1
Nasdaq
7,411
0.1
FTSE 100
7,711
-0.2
DAX
12,978
-0.2
Hang Seng
12,545
1.6
Nikkei 225
22,866
0.5
Commodities
Close
Chg .%
Brent (US$/Bbl)
78
1.6
Gold ($/OZ)
1,314
-0.4
Cu (US$/MT)
6,856
-0.8
Almn (US$/MT)
2,316
1.7
Currency
Close
Chg .%
USD/INR
67.5
0.3
USD/EUR
1.2
-0.1
USD/JPY
109.7
0.2
YIELD (%)
Close
1MChg
10 Yrs G-Sec
7.8
0.10
10 Yrs AAA Corp
8.5
0.10
Flows (USD b)
14-May
MTD
FIIs
0.1
-0.8
DIIs
0.1
1.4
Volumes (INRb)
14-May
MTD*
Cash
305
337
F&O
4,044
6,375
Note: YTD is calendar year, *Avg
YTD.%
4.4
2.6
-8.8
YTD.%
2.1
7.4
0.3
0.5
7.1
0.4
YTD.%
16.4
0.8
-4.9
2.7
YTD.%
5.7
-0.6
-2.7
YTDchg
0.5
0.6
YTD
1.2
5.1
YTD*
372
7,872
Today’s top research theme
Value Migration – Digging deeper, exploring more themes
Pace of migration accelerating in BFSI and Jewelry
"Value Migration" is defined as a flow of economic and shareholder value away
from obsolete business models to new, more effective designs that are better
able to satisfy customers' most important priorities.
Value Migration happens in three stages-Value Inflow, Stability and Value
Outflow. In our Theme Report on Value Migration published in January 2017,
we had highlighted 26 case studies in which value migration is either prevalent
or will drive changes in future.
In this sequel, we look at the progress/updates on some of the cases already
highlighted and also dwell on two interesting new themes of Value Migration
Information Technology - staring at Phase-3 of Value Migration? After basking
in glory of low cost-talent, we are now witnessing value outflow towards
models built on the combination of automation, cloud and digital technologies.
Green metamorphosis - Value Migration from Oil to Gas. In the last few years,
rising pollution has been at the forefront of the policy making and judicial
activism in India with the focus on increasing penetration of gas.
Consumer: Jewelry - massive Value Migration unfolding from unorganized to
organized space. Titan the only pan-national branded jewelry player is at the
forefront to capture this long-term opportunity. In addition to it, pace of Value
Migration is accelerating in BFSI space from PSU Banks to Private Banks.
Research covered
Key Highlights
Digging deeper, exploring more themes
April CPI higher than expected but not alarming enough
Impressive volume growth; superior execution, good monsoon
HUL
make the growth story even more compelling
Titan Company
A gem that’s getting even more lustrous
KEC International Results exceed expectations led by strong execution
Solar Industries
Results exceed expectations led by robust overseas performance
Blue Star
Margins miss our estimates, but exceed consensus
South Indian Bank Loan growth picks up; asset quality deteriorates marginally
Healthcare
Volumes remain the key, while prices continue to drag growth
Metals Weekly
Zinc and lead prices increase 3-4% WoW
Results Expectation BRIT | CROMPTON | ENDU | LPC | MRPL | PI | PNB
Cos/Sector
Value Migration
Ecoscope
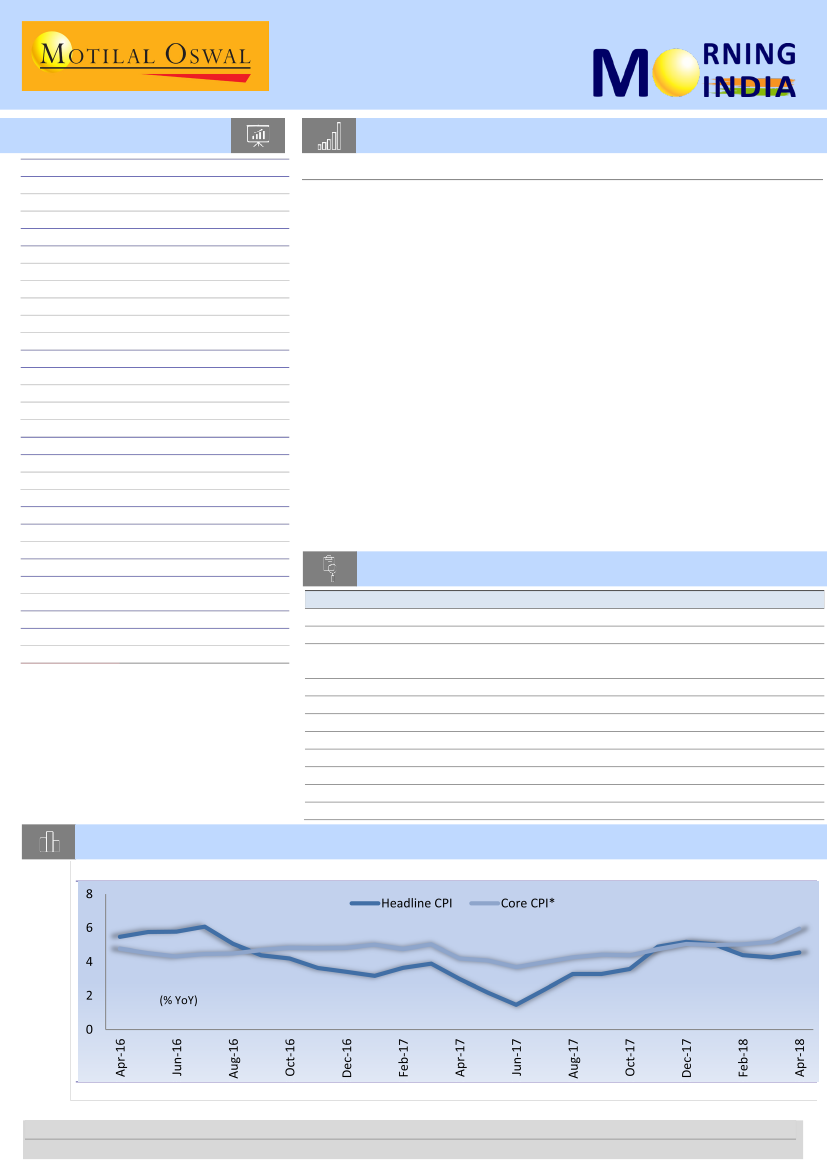
Chart of the Day: Ecoscope – April CPI higher than expected but not alarming enough to prompt a hike rate
Retail inflation rises to 4.6% in April 2018
* Excluding F&B and F&L
Source: Central Statistics Office (CSO), MOSL
Research Team (Gautam.Duggad@MotilalOswal.com)
Motilal Oswal research is available on www.motilaloswal.com/Institutional-Equities, Bloomberg, Thomson Reuters, Factset and S&P Capital.
Investors are advised to refer through important disclosures made at the last page of the Research Report.

In the news today
Kindly click on textbox for the detailed news link
1
Cabinet reshuffle: Piyush Goyal
gets finance, Smriti Irani loses
I&B ministry
Railways and coal minister Piyush
Goyal will handle the finance and
corporate affairs portfolios while
finance minister Arun Jaitley, who
underwent a kidney transplant on
Monday, recuperates, Rashtrapati
Bhavan said in a press
communique…
2
The government on Monday initiated the process of removing top
bankers, including Allahabad Bank managing director Usha
Ananthasubramanian and two executive directors of Punjab National Bank
(PNB), charged by the Central Bureau of Investigation (CBI) in the
Rs12,636-crore fraud involving jewellers Nirav Modi and Mehul Choksi.
The move is a part of the government’s broader efforts to clean up the
banking system…
Allahabad Bank CEO to be axed for involvement in PNB fraud case
3
RBI places deposit, lending
curbs on Allahabad Bank
State-owned Allahabad Bank on
Monday said the Reserve Bank of
India (RBI) has asked it to freeze
lending after its capital-to-risk
weighted assets ratio (CRAR) fell
below the mandatory 9% at the
end of March.…
4
Retail inflation surges to
4.58%, WPI at 4-month high in
April
The first month of the current
financial year has brought some
bad news on the inflation front
with both retail (Consumer Price
Index or CPI) and producer
(Wholesale Price Index or WPI)
inflation showing a surge raising
the possibility of a policy rate hike
by the Reserve Bank in the near
future...
5
IDBI directors Ravi, Karpe
step down
State-run lender IDBI Bank has
informed the stock exchanges
that two independent directors
— Ninad Karpe and S. Ravi —
have quit the board. In a filing
with the BSE, the bank said that
they had sent their resignation
letters last week…
6
Petrol, diesel prices hiked
after Karnataka elections
State-run oil marketing
companies on Monday raised
petrol and diesel prices by 17
paise and 21 paise per litre
respectively, after retail
automobile fuel prices remained
unchanged since 24 April…
7
Manipal further sweetens
offer to acquire Fortis
hospitals
The race to acquire the hospital
business of beleaguered Fortis
Healthcare Ltd took an
unexpected turn on Monday as
TPG-backed Manipal Hospitals
submitted a revised bid for the
hospital chain, even as the Sunil
Munjal-led group was planning
to do an open offer to facilitate
the smooth exit of small…
15 May 2018
2

Thematic | Value Migration
Value Migration
Value Migration 2.0: Digging deeper, exploring more themes
Pace of migration accelerating in BFSI and Jewelry
In our Theme Report on
Value Migration
published in January 2017, we had dwelt
upon the importance of staying with winning business models in ultra-disruptive
times. India is indeed witnessing a phase of heightened disruption over the last three
years, with transformational and game-changing reforms like GST, RERA, IBC
(Insolvency and Bankruptcy resolutions), and Demonetization, driving underlying
changes in the way businesses operate and create value for stakeholders.
To recap, along with various nitty-gritties of Value Migration, we had highlighted 26
case studies in our report, which touched upon cases where (a) Value Migration is
already prevalent and has left a trail of winners/losers, and (b) Value Migration can
drive changes in the ensuing decade. We had also discussed the disruptions caused by
unlisted players and consequent challenges they posed to the listed ones.
In this sequel, we look at the progress/updates on some of the cases already
highlighted and also dwell on two interesting new themes of Value Migration.
Recap: What is Value Migration?
Value Migration is defined by
Adrian Slywotzky,
author of the book “Value
Migration”, as a flow of economic and shareholder value away from obsolete
business models to new, more effective designs that are better able to satisfy
customers’ most important priorities. The framework tries to identify industries
where Value Migration is underway and can help pick potential winners early in
the cycle.
Value Migration happens in three stages: [A]
Value Inflow:
In this phase, a
company or an industry captures value from other industries or companies due
to superior value proposition. The market share and profit margins of the
company or industry expand. [B]
Stability:
In this phase, competitive equilibrium
is established. Growth rates moderate. [C]
Value Outflow:
Value starts to move
away towards companies or industries meeting evolving customer needs. In this
phase, market share declines, margins contract, and growth stops.
BFSI – pace of Value Migration accelerating
Value Migration from public sector (PSU) to private sector banks is one of the most
prominent themes underway today. While the thesis has been playing out right and
has many more legs to go, it is the pace of migration that has surprised us positively.
We believe while the corporate banking sector in India has been under tremendous
pressure over the past few years, the private sector banks are likely to emerge even
stronger, while PSU banks will continue to face challenges on capitalization and
growth. We further note that private sector banks have done a phenomenal job in
building their liability franchise (strong traction in CASA mix) using both digital
capabilities and rapidly expanding branch network. PSU banks’ market share loss has
accelerated and we expect the trend to continue. Overall, there is a long way to go
for PSU to private sector banks Value Migration and digitization will drive the trend
further, in our view.
15 May 2018
3

Information Technology – staring at Phase-3 of Value Migration?
For the best part of the last decade, the Indian IT services industry basked in the
glory of low-cost talent, offering services 40-60% cheaper, with admirable flexibility
to their global clients. It was the answer to large developed market clients’ need to
optimize their IT spending. Championed by local and MNC peers alike, the model
stabilized, and then, growth rates began to wane.
Fast forward to today’s era – clients’ spending pattern has moved to the duality of:
[1] optimizing IT spends on existing programs further by use of cloud, automation,
AI, RPA and SaaS technologies; and [2] investing these savings towards their digital
transformation.
As a result of the above, the pie of bread-and-butter services for the industry has
been directly hit, and the new services that provide growth opportunity are not
moving the needle as much, thanks to low base. Besides, the new models are
significantly deviant from status quo, requiring companies to embrace bold moves
such as cannibalizing existing streams of cash generation, resetting to a lower
profitability (at least in the interim) and actively chasing acquisitions.
In this context, we witness the three phases of Value Migration, starting from value
inflow benefiting the regime of low cost sourcing route to IT spending optimization
to value outflow towards models built on the combination of automation, cloud and
digital technologies.
Oil & Gas: Green metamorphosis – Value Migration from Oil to Gas
In the last few years, rising pollution has been at the forefront of the policy making
and judicial activism in India. The focus on increasing penetration of gas becomes all
the more important considering that in the latest study of the World Health
Organization (WHO), half of the 20 most polluted cities globally are Indian. Policy
initiatives in exploration and production (E&P) like Hydrocarbon Exploration
Licensing Policy (HELP), Open Acreage Licensing Policy (OALP), premium pricing for
gas production from difficult fields, and National Data Repository among others are
expected to boost domestic gas production by ~10% YoY for the next 3-4 years.
With enabling policies, increase in gas supply and improvement in pipeline
infrastructure, broadly, the whole gas sector is expected to benefit – producers,
importers, transmission companies and city gas distribution companies (CGDs).
Consumer: Jewelry – massive Value Migration unfolding; multiple tailwinds
conspire to augment the trend
Opportunity for branded jewelers in an era of demonetization/formalization of the
economy and Titan being the key beneficiary was one of the high-conviction themes
we had focused upon as a part of long term Value Migration opportunities. Since
then, additional growth drivers have emerged – GST implementation, which has
further tilted the balance in favor of organized trade, rigorous provisions under
PMLA, and credit squeeze for unorganized trade as fallout of the Nirav Modi scam.
This is over and above the initiatives undertaken by company – aggressive expansion
15 May 2018
4

plans, focus on wedding jewelry portfolio. Titan has already been witnessing healthy
market share expansion away from the unorganized trade and has delivered strong
performance over the last 18 months on revenue as well as profitability front. From
a longer-term perspective, the management has guided for strong ~20% five-year
revenue CAGR in its jewelry division. In our view, the Value Migration opportunity in
the jewelry industry remains immense, given the size of the industry and Titan, as
the only pan-national branded jewelry player, is at the forefront to capture this
long-term opportunity.
Synopsis of Value Migration case-studies
S.N. Industry
1
2
3
4
BFSI
IT
O&G
CONSUMER - Jewelry
Value migration thesis
PSU Banks to Private Banks
Legacy models to Digital
Oil to Gas
Unorganized to Organized
Remarks
The pace of migration has accelerated
Entering Phase 3 of Value Migration
Policy thrust - multiple winners
Winners/Losers
HDFC BANK, IndusInd, KMB
Large-cap IT
IGL, Gujarat Gas, MGL
Source: Company, MOSL
Rapid market share gains for organized plays Titan
15 May 2018
5

E
CO
S
COPE
April CPI higher than expected but not alarming enough to prompt a hike rate
MSP announcement in early June holds the key
14 May 2018
The Economy Observer
CPI inflation rose to a three-month high of 4.6% YoY in April 2018 from 4.3% in the previous month. The number was
higher than our estimate/market consensus of 4.4%.
Food inflation was unchanged at 2.8% YoY in April 2018 versus the previous month, but came in slightly higher than our
estimate of 2.7%. While most food items witnessed a pick-up in inflation, this was offset by a sharp fall in vegetables
inflation.
Core inflation surged to a 45-month high of 6% YoY in April from 5.2% in the previous month. The number was higher
than our estimate of 5.7%. Inflation in core services rose to a 27-month high of 5.2% YoY, while that in housing edged
up to 8.5% YoY.
The RBI's inflation forecast was 4.7%-5.1% for 1HFY19. Although the April reading is lower than the range, we expect
inflation to rise over the next two months to touch 5.4% in June, overshooting the RBI’s expectations. We believe that
this is not alarming enough for the RBI to hike rates. However, the MSP announcement for Kharif crops – likely in early
June – remains the key trigger for the MPC.
CPI inflation at three-month high in April:
After declining in the previous three
months, CPI-based inflation rose to a three-month high of 4.6% YoY in April
2018
(Exhibit 1).
The number was higher than our estimate and market
consensus of 4.4%. Higher food and core inflation led to higher-than-expected
inflation reading in the month.
Food inflation unchanged at 2.8%...:
Food inflation (weight in CPI: 39.1%) was
unchanged at 2.8% YoY in April 2018 versus the preceding month, but was
slightly higher than our estimate of 2.7%. This is the lowest reading in six
months. Among food items, inflation in fruits surged sharply to 9.7% YoY in April
from 5.7% in the preceding month. Inflation in cereals, pulses, oils & fats, meat
& fish and spices also picked up in the month. However, this was offset by a
sharp fall in vegetables inflation
(Exhibit 2).
…while core inflation touches 45-month high…:
Further, core inflation (all items
excluding ‘food & beverages’, ‘pan, tobacco and intoxicants’ and ‘fuel & light’)
surged to a 45-month high of 6% YoY in April 2018 (our estimate: 5.7%) from
5.2% in the preceding month. Core-core inflation (excluding petrol/diesel from
core inflation) also shot up to 6% from 5.4% in March. Inflation in the fuel &
light group fell to 5.2% YoY in April 2018 from 5.7% in the previous month.
…due to a surge in inflation in ‘core services’:
Further refinement of CPI items
shows that inflation in ‘core services’ rose to a 27-month high of 5.2% YoY in
April from 4.7% in March
(Exhibit 4).
Inflation in both housing and goods inched
up 20bp MoM to 8.5% and 3.9%, respectively.
The RBI's inflation forecast was 4.7%-5.1% for 1HFY19. Although the April
reading is lower than the range, we expect inflation to rise over the next two
months to touch 5.4% in June, overshooting the RBI’s expectations. We
believe that this is not alarming enough for the RBI to hike rates. However, the
MSP announcement for Kharif crops – likely in early June – remains the key
trigger for the MPC.
15 May 2018
6

Hindustan Unilever
BSE SENSEX
35,557
Bloomberg
Equity Shares (m)
M.Cap.(INRb)/(USDb)
52-Week Range (INR)
1, 6, 12 Rel. Per (%)
Avg Val, INRm/ Vol m
Free float (%)
S&P CNX
10,807
HUVR IN
2,163.9
3256.6.0 / 51.1
1522 / 975
3/9/36
1560.0
32.8
14 May 2018
4QFY18 Results Update | Sector: Consumer
CMP: INR1,505
TP: INR1,805(+20%)
Buy
Impressive volume growth; superior execution, good monsoon make the
growth story even more compelling
HUVR’s 4QFY18 reported net sales grew 10.8% YoY to INR91b.
Domestic
comparable consumer business sales were up 16% YoY, with underlying
volume growth of 11% YoY (est. of +7%). EBITDA grew 24% YoY to INR20.5b
(est. of INR19.1b) and PAT (bei) rose 26% YoY to INR14.1b (est. of INR13b).
Gross margin expanded 150bp YoY to 52.6%. Other operating expenses as % of
sales were down 90bp YoY. Thus, EBITDA margin expanded 240bp YoY to
22.5%. Comparable margin expanded 160bp YoY.
FY18 performance:
Sales, EBITDA and adj. PAT grew 8%, 20% and 21%,
respectively. EBITDA margin expanded 210bp.
Concall highlights:
(1)
Demand is improving gradually – the trend is likely to
continue.
(2)
Naturals is growing at ~2.5x that of HUL average.
(3)
WIMI is
growing at 1.5x that of all-India average over the past three years.
Valuation view:
21% growth in PAT (bei) in FY18 was the highest since FY13,
and we believe EPS growth will sustain at similar levels over the next two years.
HUL’s superior volume growth outperformance – even compared to much
smaller players – is appreciable. Commodity inflation, unless it spirals out of
control, is likely to increasingly contribute to sales growth, and margin
trajectory is impressive and will be aided further by leverage arising from
strong sales growth. Four key trends are particularly relevant for HUL resulting
in an elevation in its earnings growth trajectory compared to the past – (i) its
rapidly improving adaptability to market requirements, (ii) its recognition of
Naturals as a key sub-segment across categories, (iii) continuing strong trend
toward premiumization and (d) extensive plans to employ technology. On a
target multiple of 51x Mar’20E EPS (15% premium to three-year average due to
significantly improving business fundamentals), we get a TP of INR1,805 (prior:
INR1,515). Maintain
Buy.
(INR Million)
4Q
4.0
82,130
6.4
40,220
41,910
51.0
16,510
12.2
20.1
1,080
60
830
16,200
4,360
26.9
11,180
7.6
11,830
1Q
0.0
85,290
4.9
40,840
44,450
52.1
18,660
14.1
21.9
1,140
60
1,130
18,590
5,630
30.3
12,920
14.6
12,830
FY18
2Q
3Q
4.0
11.0
83,090 85,900
5.9
11.5
39,290 39,050
43,800 46,850
52.7
54.5
16,820 16,800
19.7
23.9
20.2
19.6
1,150
1,210
60
50
2,040
1,520
17,650 17,060
5,250
3,590
29.7
21.0
12,360 11,980
14.2
30.2
12,760 13,260
4Q
11.0
90,970
10.8
43,140
47,830
52.6
20,480
24.0
22.5
1,280
40
1,000
20,160
6,010
29.8
14,090
26.0
13,510
Ind AS
Ind AS
FY17
FY18
0.8
6.0
318,887 345,250
2.7
8.3
156,835 162,320
162,052 182,930
50.8
53.0
60,463
72,760
5.1
20.3
19.0
21.1
3,958
4,780
219
210
5,254
5,690
61,541
73,460
19,058
20,480
31.0
27.9
42,474
51,350
3.2
20.9
44,893
52,360
Est.
Variance
4QE
7.0
89,864
1.2%
9.4
42,556
47,308
52.6
19,090
7.3%
15.6
21.2
1,111
96
850
18,732
7.6%
5,699
30.4
13,033
8.1%
16.6
13,033
Financials & Valuations (INR b)
Y/E Mar
2018 2019E
Net Sales
339.3 387.6
EBITDA
72.8
87.4
PAT
53.0
62.7
EPS (INR)
24.5
29.0
Gr. (%)
24.7
18.3
BV/Sh (INR)
32.7
35.1
RoE (%)
78.1
85.5
RoCE (%)
100.2 112.4
P/E (x)
61.5
51.9
P/BV (x)
46.0
42.9
2020E
442.1
105.9
76.7
35.4
22.3
38.7
96.1
126.3
42.5
38.9
Estimate change
TP change
Rating change
Quarterly performance
Y/E March
Domestic volume growth (%)
Net Sales
YoY Change (%)
COGS
Gross Profit
Margin %
EBITDA
YoY Change (%)
Margins (%)
Depreci a ti on
Interes t
Other Income
PBT
Ta x
Rate (%)
Adjusted PAT
YoY Change (%)
Reported Profit
1Q
4.0
81,270
3.6
39,555
41,715
51.3
16,347
8.1
20.1
933
60
1,076
16,431
5,411
32.9
11,277
6.1
11,727
FY17
2Q
3Q
-1.0
-4.0
78,427 77,060
1.4
-0.7
39,620 37,440
38,807 39,620
49.5
51.4
14,046 13,560
5.1
-5.2
17.9
17.6
945
1,000
49
50
2,528
820
15,580 13,330
4,807
4,480
30.9
33.6
10,818
9,199
9.3
-10.2
10,956 10,380
15 May 2018
7

11 May 2018
4QFY18 Results Update | Sector: Capital Goods
Titan Company
Buy
BSE SENSEX
35,557
S&P CNX
10,807
CMP: INR921
TP: INR1,125(+22%)
A gem that’s getting even more lustrous
High earnings growth with strong visibility deserves premium valuations
We attended Titan’s (TTAN) Annual Investor Forum 2018. Key takeaways:
Stock Info
Bloomberg
Equity Shares (m)
52-Week Range (INR)
1, 6, 12 Rel. Per (%)
M.Cap. (INR b)
M.Cap. (USD b)
Avg Val ( INR m)
Free float (%)
Jewelry growth prospects improving
TTAN IN
887.8
1006 / 460
-11/11/68
817.7
12.6
1662.0
47.1
Financials Snapshot (INR b)
Y/E Mar
2018 2019E 2020E
Sales
161.2 197.3 239.0
EBITDA
16.4
21.0
26.1
Adj. PAT
11.0
14.4
18.2
Adj. EPS (INR)
12.6
16.2
20.5
EPS Gr. (%)
39.5
28.8
26.1
BV/Sh.(INR)
57.3
64.0
67.1
RoE (%)
23.9
26.7
31.2
RoCE (%)
24.6
27.3
31.9
P/E (x)
73.1
56.8
45.0
P/BV (x)
16.1
14.4
13.7
Shareholding pattern (%)
As On
Mar-18 Dec-17 Mar-17
52.9
52.9
53.1
Promoter
6.3
5.9
5.4
DII
20.7
21.3
21.1
FII
20.1
20.0
20.4
Others
FII Includes depository receipts
Stock Performance (1-year)
Titan Company
Sensex - Rebased
1,050
950
850
750
650
550
450
Management remained confident about the Jewelry segment growth prospects
and reiterated its recently revised growth guidance (expects 2.5x growth – 20%
CAGR – in the segment over FY18-23, as against the previous guidance of 2.5x
growth over FY17-22). The company confirmed the 25% Jewelry segment
growth target for FY19, exhibiting confidence about growing rapidly despite
the previous year’s strong performance (+25% in FY18). Jewelry growth is likely
to be muted this quarter because of an extremely high base (50%+ growth in
1QFY18), but the rest of the year is likely to be good enough to compensate for
that. Management also cited that the competitive advantage versus peers is
getting bigger over the past few quarters.
Management quantified its five key pillars of growth for the first time.
a)
Wedding jewelry
sales proportion is likely to increase from 35% of jewelry
sales in FY18 to 50% by FY23.
b)
High-value diamond jewelry
sales proportion is likely to increase from 30%
of diamond jewelry sales in FY18 to 50% in FY23. In these premium
categories, the company is targeting customers with annual income of
INR1-5m, a segment that the Central Board of Direct Taxes expects to grow
at a 23% CAGR over the next five years.
c)
Golden Harvest:
It continues to be one of the key pillars.
d)
Low-share markets:
TTAN has identified 15-20 cities in the country where
it has a less than national average market share. Market share in these 17
cities is expected to increase from ~4% to ~8% by FY23.
e)
Middle India focus:
From 250 stores in 150 towns in FY18, TTAN is likely to
have 400 stores in 250 towns by FY23, which is quite remarkable
expansion, in our view.
f)
Exchange sales:
Management also added a sixth pillar of growth, i.e., sale
of jewelry to customers coming for exchange of old jewelry. The
contribution of this segment has increased from 20% to 40% of sales over
the past 18 months, and it is likely to reach 50% by FY23. Higher proportion
of exchange sales also reduces the vulnerability to import curbs on gold
(similar to FY13). Such curbs are possible if the current account deficit
worsens drastically from the current impressively low levels.
In addition, new products are playing a big part in driving growth. Proportion of
new products has increased consistently every year to 30% of sales as of FY18,
and is likely to reach ~50% by FY23. Of 20% revenue CAGR over FY18-23E, SSSG
is likely to contribute 12-13%, which augurs well for profitability.
15 May 2018
8

Overall strategy continues to evolve
Managing Director Mr Bhaskar Bhat also highlighted a) the company’s efforts
toward moving to the next level of consumer understanding across businesses,
b) catering more specifically to Gen A (higher brand loyalty, higher ticket size
compared to more value conscious and bargain hunting millennial). These
customers also toggle between brick-and-mortar and online, and thus, there is a
need to build strong capability in both, (c) reaching 50 million customers by
FY23 across businesses, from ~20m in FY18, (d) targeting a much higher share of
the luxury market, wherein it expects to have huge learning through products
like Favre Leuba and also the Mont Blanc JV and (e) working toward a new
organization culture that needs to keep evolving as the customers do.
Adjusted for the GST impact, Watches segment grew in double-digits in FY18 (for
the first time in many years), with volume growth of 8%. EBIT margin of 13% also
staged a smart recovery. ‘Fast Track’ has been a strong driver of growth over the
past two years (grew by 11% in FY17 and by 14% in FY18). TTAN has also seen
success in the wearables market, and is now the third largest player in India in a
yet nascent market, which includes bands imported from China. The company is
spending disproportionately in digital advertising, eCommerce sales are growing
at over 90%, and large format stores are doing well with sales now exceeding
INR3b. New women-specific launches like ‘Titan Ceramic Edge’ and ‘We’ are doing
very well. Titan Raga’s digital-only range launched in association with designer
Masaba Gupta has received a good response. Management believes that while it
will be present in the digital space in wearables, the future of wearables devices in
India is in the analog space. TTAN is also launching smart watches under its
economy brand ‘Sonata’. The five pillars of growth in the watches segment over
the next few years are (a) technology, (b) increasing the number of customers, (c)
new brands, (d) continued focus on profitability and (e) growth.
As part of the strategic review of the eyewear business toward the latter part of
FY18, it was decided that customer acquisition will be a key focus area. The
company had 1.4m customers in eyewear and another 1m in sunglasses in FY18.
By FY23, it is targeting 10m customers per year. Growth in the eyewear business
has been decent over the past decade since inception, but same-store sales
average growth for this period was only ~6%, with a similar number in FY18 as
well. It is still perceived as a premium product. Instead of reducing prices, the
company will introduce products in the INR1,000-2,000 range (this was lacking
earlier) while retaining the focus on design, style and service levels. The
company has 500 stores, but is competing against largely mom and pop stores,
which are 30,000 in number across the country. Only 32% of people having
vision difficulties use remedial eyewear and only 30% of those buy these
products in any given year. With the help of Caratlane, the online jewelry
company that TTAN acquired last year, this division has spruced up its omni-
channel presence, has increased advertising, improved performance ratings and
bettered optometrist availability in stores. The backend has also been made
much stronger, enabling industry-first practices like same-day delivery and 30
minute delivery of lenses.
9
Watches business now appears on a strong footing
Now looking to democratize the eyewear business
15 May 2018

Valuation view
Management’s optimism about the Jewelry business is being reflected in its
revised strong guidance of 20% CAGR for the next five years, sharply increased
store expansion target of 40 in FY19, and commentary about further margin
expansion led by operating leverage. Recent developments in the sector are
only strengthening the case for further rapid growth of the Tanishq business.
High valuations are fully deserved for a business that has perhaps the best top-
line growth potential in the large-cap FMCG/retail space. Moreover, the
improving margins outlook drives our earnings growth expectations higher.
Maintain
Buy
with a target price of INR1,125, based on 55x March 2020E EPS
(30% premium to three-year average P/E).
15 May 2018
10

RESULTS
FLASH
BSE SENSEX
35,557
S&P CNX
10,807
KEC International
Blue star
Neutral
14 May 2018
Results Flash | Sector: Capital Goods
CMP: INR408
TP: INR390(-5%)
Results exceed expectations led by strong execution
Sales of INR36.6b (+29% YoY) were ahead of our estimate of INR32b.
EBITDA stood at INR3.7b (+23% YoY), with the margin of 10.1% coming in
below our estimate of 10.9%.
Interest cost of INR656m was lower than our estimate of INR703m, while
depreciation stood at INR275m v/s our estimate of INR440m.
Tax rate of 32% was lower than our estimate of 36.5%.
PAT of INR1.96b (+35% YoY) was ahead of our estimate of INR1.52b.
Conference Call Details
Date:
15
May 2018
Time:
10:00am IST
Dial-in details:
+91-22-6280 1213
th
Financials & Valuations (INR b)
FY18 FY19E
Y/E Mar
Net Sales
95.5 110.7
EBITDA
9.8
11.3
NP
4.2
4.9
EPS (INR)
16.2
18.9
EPS Gr. (%)
36.6
16.7
BV/Sh. (INR)
74.6
89.6
RoE (%)
21.7
21.1
RoCE (%)
14.9
15.1
Div. Yield
0.7
0.8
FY20E
134.3
Valuation view:
13.8
The stock trades at 22/17x FY19/20E EPS of INR18.9/24.3. We have a
Neutral
6.2
rating on the stock with a target price of INR390, valuing the business at 16x
24.3
FY20E EPS.
28.3
108.9
22.3
16.2
1.0
Quarterly performance (Consolidated)
Y/E March
Sales
Change (%)
EBITDA
Change (%)
As of % Sales
Depreciation
Interest
Other Income
PBT
Tax
Effective Tax Rate (%)
Reported PAT
Change (%)
Adj PAT
Change (%)
1Q
17,487
-6.9
1,496
6.3
8.6
291
720
50
535
226
42.2
309
83.2
309
83.2
FY17
FY18
FY17 FY18E
2Q
3Q
4Q
1Q
2Q
3Q
4Q
20,742 19,123 28,492 18,568 21,322 24,049 36,642 85,844 95,524
2.6
-7.2
11.3
6.2
2.8
25.8
28.6
0.8
11.3
1,853 1,818 3,011 1,763 2,158 2,441 3,699 8,179 9,793
22.5
8.8
29.2
17.9
16.5
34.3
22.8
20.4
19.7
8.9
9.5
10.6
9.5
10.1
10.2
10.1
9.5
10.3
310
298
408
272
279
272
275 1,297 1,262
596
583
637
631
572
607
656 2,536 2,514
55
70
114
98
57
123
126
289
387
1,003 1,006 2,081
958 1,365 1,686 2,894 4,634 6,404
352
380
625
329
471
568
930 1,587 2,241
35.1
37.8
30.1
34.3
34.5
33.7
32.2
34.2
35.0
650
626 1,455
630
894 1,118 1,963 3,048 4,163
131.0 139.0
90.5 103.5
37.4
78.5
34.9
59.2
36.6
650
626 1,455
630
894 1,118 1,963 3,048 4,163
131.0 139.0
90.5 103.5
37.4
78.5
34.9
59.2
36.6
(INR m)
MOSL
Var.
4Q Est Vs Est
31,585
16%
10.9
3,430
8%
13.9
10.9
440
703
109
2,395
21%
874
36.5
1,522
29%
4.6
1,522
29%
4.6
15 May 2018
11

14 May 2018
4QFY18 Results Update | Sector: Capital Goods
Solar Industries
Neutral
BSE SENSEX
35,557
Bloomberg
Equity Shares (m)
M.Cap.(INRb)/(USDb)
52-Week Range (INR)
1, 6, 12 Rel. Per (%)
Avg Val, INRm
Free float (%)
S&P CNX
10,807
SOIL IN
90.5
96.4/ 1.5
1232 / 797
-4/-10/14
42.0
26.9
CMP: INR1,065
TP: INR1,100 (+3%)
Results exceed expectations led by robust overseas performance
Operational performance ahead of expectations:
Consol. revenue rose 30%
YoY to INR5.8b (est. of INR5.0b) in 4QFY18. EBIDTA grew 28.5% YoY to INR1.2b
(est. of INR951m), with the EBIDTA margin of 20.5% (-30bps YoY) ahead of our
estimate of 19.1%. Adj. net profit rose 21.1% YoY to INR678m (est. of
INR547m). Performance beat was driven by a better-than-expected
performance from the overseas and exports business segment. For FY18,
revenue stood at INR19.2b (+21.3% YoY), operating profit at INR4.1b (+27.1%
YoY) and adj. PAT at INR2.3b (+17.3% YoY).
Overseas and exports segment drives revenue performance:
Consol. revenue
was driven by a robust performance of the overseas and export segment (+81%
YoY). On the domestic front, 4Q saw robust demand from the infra and housing
space (+29.3% YoY), whereas revenue from CIL remained muted (+3.2% YoY)
due to weak realization on account of soft AN prices (-5% YoY). Realization fell
(-2% YoY) in the bulk segments, as lower raw material cost (ammonium nitrate)
was passed on to consumers.
Defence business to witness traction in FY19:
Revenue from the Defence
business stood at INR187m (v/s INR29m in 4QFY17), driven by a pick-up in
execution of orders in hand. SOIL expects revenue contribution to reach INR2b
in FY19 from INR378m in FY18. Defence order backlog stands at INR2.6b, and
SOIL has participated in RFP for three new products tenders, which it expects
to materialize in FY19.
Maintain Neutral:
We maintain
Neutral
with a TP of INR1,100, valuing SOIL at
30x FY20E EPS (earnings CAGR of 23% over FY18-20E). The stock trades at
premium valuations (10-year average P/E multiple of 20x), given SOIL’s
presence in Defense (huge business opportunity here due to government
focus) and strong growth in the core business segment of Explosives, led by a
pick-up in mining activity.
FY17
2Q
3Q
3,174 4,215
-4.3
9.5
696
768
0.2
0.3
21.9
18.2
98
95
73
68
0
47
525
652
133
157
25.4
24.1
391
495
-5.2
12.1
391
495
6.1
20.3
FY18
2Q
3Q
4,084 4,657
28.7
10.5
872 1,043
25.4
35.9
21.4
22.4
128
137
79
106
33
26
699
826
216
249
30.9
30.2
483
577
23.3
16.4
483
577
23.3
16.4
FY17
FY18
FY18
4QE
4,975
14.1
951
10.6
19.1
148
55
54
803
256
31.9
547
9.3
547
9.3
Financials & Valuations (INR b)
2018E 2019E 2020E
Y/E Mar
Net Sales
19.2
23.1
28.5
EBITDA
4.1
4.9
6.2
PAT
1.3
1.7
2.3
EPS (INR)
24.4
28.9
36.8
Gr. (%)
18.2
18.6
27.4
BV/Sh (INR)
119.8 142.9 172.3
RoE (%)
21.9
22.0
23.4
RoCE (%)
23.9
25.3
27.3
P/E (x)
43.5
36.7
28.8
P/BV (x)
8.9
7.4
6.2
Estimate change
TP change
Rating change
Quarterly Performance (Consolidated)
Y/E March
Sales
Change (%)
EBITDA
Change (%)
As of % Sales
Depreciation
Interest
Other Income
PBT
Tax
Effective Tax Rate (%)
Reported PAT
Change (%)
Adj PAT
Change (%)
1Q
4,030
4.8
868
20.7
21.5
94
68
32
738
237
32.1
501
9.6
471
13.9
(INR m)
4Q
4,421
7.6
919
6.9
20.8
101
63
44
799
240
30.0
560
22.6
560
29.2
1Q
4,667
15.8
1,010
16.4
21.6
125
50
25
860
261
30.4
599
19.5
548
16.3
4Q
5,753 15,800 19,161
30.1
9.1
21.3
1,181 3,239 4,116
28.5
6.5
27.1
20.5
20.5
21.5
123
387
513
84
269
327
38
132
121
1,012 2,715 3,396
334
767 1,061
33.0
28.3
31.2
678 1,947 2,336
21.1
3.6
4.5
678 1,947 2,285
21.1
17.3
Var.
Vs Est
15.6
24.2
26.1
23.9
23.9
15 May 2018
12

RESULTS
FLASH
BSE SENSEX
35,557
S&P CNX
10,807
14 May 2018
Results Flash | Sector: Capital Goods
Blue star
Neutral
CMP: INR767
TP: INR875(13%)
Margins miss our estimates, but exceed consensus
Sales of INR14.8b (+8% YoY) were in line with our estimate of INR15b
(consensus: INR15.2b). Electro Mechanical projects sales were up 7% (~11% on
LTL basis) to INR7.3b, while Unitary cooling segment sales grew 7% YoY to
INR6.92b (up ~18-20% on LTL basis). UCP segment sales were strong in 4QFY18,
despite channel filling in 3QFY18 due to the implementation of new energy
rating norms.
Gross margin expanded 200bp YoY to 30.7%.
EBITDA rose 23% YoY to INR927m, with the margin at 6.3% (+80bp YoY), below
our estimate of 7.1% (consensus: 6%). EBIT margin in EMP segment stood at
5.6% (+90bp YoY) and in UCP segment at 9.9% (+120bp YoY). Unallocated
expenses stood at INR406m (+12% YoY, +41% QoQ on likely higher
advertisement spend on water purifiers during the quarter).
Other income stood at INR13m v/s our estimate of INR38m. Tax rate was 29%
v/s our estimate of 30%.
PAT of INR460m (+24% YoY) missed our estimate of INR602m (Consensus:
INR440m).
Conference Call Details
Date:
15
May 2018
Time:
11:00am IST
Dial-in details:
+91-22-6280 1102
th
Financials & Valuations (INR b)
FY18 FY19E
Y/E Mar
47.5
56.3
Net Sales
2.9
3.9
EBITDA
1.4
2.1
NP
15.1
22.4
EPS (INR)
17.0
48.6
EPS Gr. (%)
87.0
97.3
BV/Sh. (INR)
18.1
24.3
RoE (%)
15.2
19.8
RoCE (%)
Div. Yield
1.3
1.3
FY20E
65.1
4.8
2.9
30.1
34.5
111.2
28.9
24.6
1.8
Valuation view:
The stock trades at 34/25x FY19/20E EPS of INR22.4/30.1. We have a
Neutral
rating on the stock with an SOTP-based price target of INR875 (UCP business at
30x FY20E EPS, MEP at 15x, and professional electronics at 15x).
(INR m)
FY18
Var.
4QE Vs Est
14,977
-1
8.9
1,069
-13
41.4
7.1
153
96
38
858
-24
261
30.4
597
56.8
602
61.8
-22
-24
Quarterly performance (Consolidated)
Y/E March
Sales
Change (%)
EBITDA
Change (%)
As of % Sales
Depreciation
Interest
Other Income
PBT
Tax
Effective Tax Rate (%)
Reported PAT
(before MI and share of associates)
Change (%)
Adj PAT
Change (%)
1Q
12,117
18.8
791
5.1
6.5
135
92
85
649
145
22.3
504
35.7
514
38.3
FY17
FY18
2Q
3Q
4Q
1Q
2Q
3Q
4Q
8,911 9,224 13,731 14,611 8,390 9,835 14,784
6.2 17.1
17.6 20.6
-5.8
6.6
7.7
422
386
756
903
492
535
927
-4.6
9.5
25.6 14.1 16.6
38.8
22.7
4.7
4.2
5.5
6.2
5.9
5.4
6.3
150
155
166
125
158
172
183
88
85
114
48
59
74
107
81
11
37
37
12
14
13
266
157
514
766
288
303
650
73
15
133
183
84
93
186
27.6
9.7
25.9 23.9 29.3
30.7
28.5
193
-1.3
200
-4.6
142
-10.6
145
-7.0
381
-2.5
372
-6.5
583
15.7
585
13.8
204
5.5
208
4.0
210
48.3
188
29.7
465
22.1
460
23.6
FY17
FY18E
43,983 47,502
15.3
8.0
2,355 2,857
2.0
21.3
5.4
6.0
606
638
378
287
215
75
1,586 1,955
367
546
23.1
27.9
1,231
5.5
1,231
5.5
1,493
17.0
1,440
17.0
15 May 2018
13

RESULTS
FLASH
BSE SENSEX
35,557
S&P CNX
10,807
South Indian Bank
TP:INR38
Buy
14 May 2018
Results Flash | Sector: Capital Goods
CMP: INR26
Loan growth picks up; asset quality deteriorates marginally
Conference Call Details
Date:
15 May, 2018
Time:
11:00am IST
Dial-in details:
+91-22-6280 1360
th
Financials & Valuations (INR b)
Y/E March
2018 2019E
NII
19.7
23.1
OP
14.8
17.4
NP
3.3
5.9
NIM (%)
2.8
2.9
EPS (INR)
1.9
3.3
BV/Sh. (INR)
28.2
30.0
ABV/Sh.
(INR)
22.8
25.4
RoE (%)
6.6
10.9
RoA (%)
0.4
0.7
P/E(X)
14.3
8.1
P/BV (X)
0.9
0.9
P/ABV (X)
1.2
1.0
2020E
28.4
22.3
8.9
3.2
4.9
34.1
30.3
15.0
0.9
5.4
0.8
0.9
SIB’s reported PAT was flattish QoQ (-1%), but grew 51% YoY off a relatively
low base. PPoP declined 6% QoQ, led by a 6% QoQ increase in opex with
sequentially flat total income. Provisions at INR1.49b (1.1% annualized credit
cost) were below expected, leading to an 815bp QoQ decline in PCR to 41.2%.
The bank utilized RBI’s dispensation to spread MTM losses and provided
INR129.6m, leaving INR344m to be provided over the next three quarters
NII grew -3%/+12% QoQ/YoY even as advances recorded 5.7%/17.6% YoY
growth, as the NIM contracted 15bp QoQ to 2.73% led by a 14bp sequential
decline in reported spreads. Opex grew 6%/22% QoQ/YoY (the bank utilized
RBI’s dispensation to spread out gratuity provisions, leaving INR204.5m to be
further provided). CI ratio increased to 53.7% from 50.6% in 3QFY18.
Loan growth of 5.7%/17.6% QoQ/YoY was led by robust growth in retail and
agri (+19% YoY each), while corporate book grew 14% YoY, in line with the
bank’s retail-focused strategy. Corporate book has decreased to 37% of
advances from 38% a year ago.
Slippages were elevated at INR6.14b (INR2.58b in 3QFY18), of which INR1.9b
was from restructured book (roads). Slippages declined in retail (0.18% v/s
0.38% in 3Q), but increased in agri (0.71% v/s 0.18% in 3Q) and SME (0.3% vs
0.18% in 3Q). Recoveries, upgrades and write-offs came in at INR4.08b.
Absolute GNPA increased 11.6% QoQ to INR19.8b (3.59%, +19bp QoQ), while
NNPA rose 16.9% QoQ to INR14.2b (2.6%, +25bp), with calculated PCR
declining 326bp QoQ to 28.5%. Total net stressed loans at INR14.7b rose
marginally QoQ (INR14.6b in 3Q), but decreased to 2.7% of loans in percentage
terms (2.8% in 3Q).
Other highlights:
a) CASA ratio stood at 23.8% (-110bp QoQ). b) 78% of
corporate book is now investment grade (74% in 3Q).
Valuation and view:
Management is focused on building a low-ticket loan book
with steady balance sheet clean-up, which will help asset quality improve
substantially. We believe the asset quality stress is largely behind us and await
clarity on future credit costs. We will revisit our estimates post earnings call.
15 May 2018
14

Sector Update | 15 May 2018
Healthcare
Performance of top companies:
April 2018)
Company
IPM
Sun Pharma
Abbott India
Cipla
Zydus Cadila
Mankind
Alkem
Lupin
Torrent Pharma
Pfizer
Glenmark Pharma
Sanofi
Dr Reddy Labs
GSK Pharma
Alembic Pharma
Ipca Labs
Natco
Ajanta Pharma
Merck
Biocon
MAT
gr
(%)
5.8
5.6
9.0
4.6
5.9
7.1
6.2
10.7
4.8
(4.4)
8.3
8.7
6.3
6.9
(0.8)
(5.9)
0.6
7.7
5.0
10.6
Apr-
18
(%)
7.8
5.5
13.8
4.6
4.7
4.7
13.2
15.7
9.5
2.4
12.8
6.6
10.1
2.5
7.7
5.5
(15.0)
10.8
8.0
3.6
Volumes remain the key, while prices continue to drag growth
Lupin, Abbott and Alkem witness highest YoY growth for the quarter
Indian pharmaceutical market's (IPM) secondary sales grew 7.8% YoY in April
2018 and 8.2% YoY during the period February-April 2018. Since July 2017, the
momentum in growth has been largely due to volumes, followed by new
launches. While volume growth was 6.8% YoY, new launches aided 2.5% YoY
growth during the quarter ended April 2018.
Pricing continued to be under pressure, with 1.1% YoY decline in the quarter
ended April 2018. Prices have been in contraction mode for 12 months now.
On moving annual total (MAT) basis, YoY growth was stable at 5.8% during the
12 months ended April as against 5.7% in the 12 months ended March 2018.
Partly on low base of past year, Lupin reported the highest growth in April 2018
(15.7% YoY), followed by Abbott India (+13.8%), Alkem (+13.2%) and Dr Reddy’s
(+10%). Glenmark (+13%), Ajanta Pharma (+11%), and Torrent Pharma (+9.5%)
outperformed IPM in April.
Despite YoY fall of 23.1% during the three months ended April 2017, Natco
Pharma’s secondary sales declined 15% YoY during the three months ended
April 2018. 60% of the reported companies underperformed IPM growth in April
on 12M basis.
Amongst therapies, which form 70% of IPM, Respiratory (7.7% of IPM)
maintained its strong growth trajectory for the month (+16.1% YoY), followed by
Anti-diabetic (+10.3%; 9.2% of IPM) and Cardiac (+9.7%; 12.2% of IPM).
Ophthal (1.9% of IPM) and Vaccines (1.8% of IPM) were the only therapies that
reported decline of 0.7% and 3.6%, respectively in April 2018.
In value terms, secondary sales grew 5% YoY for DPCO-listed products and 8.2%
YoY for non-DPCO products in April 2018. Volumes grew 6.8% YoY for DPCO-
listed products and 6.2% YoY for non-DPCO products in April.
FDC-banned drugs (~2% of IPM) grew ~15% in April, while non-banned drugs
grew 7.9% YoY. Secondary sales for Indian companies increased 7.5% YoY, while
those of MNCs grew 9.1% YoY in April.
Respiratory, Hormones and Anti-diabetic lead among therapies
DPCO v/s non-DPCO market (April 2018)
FDC ban impact (April 2018)
Volumes continue to grow, however price decline restricts growth
Volume Growth (%)
9.7
7.6
4.8
3.6
1.3
3.3
3.2
1.1
3M-Apr-17
3.1
2.8
0.6
-0.3
3M-Jul 17
3.6
2.9
2.6
-1.9
3M-Oct-17
Price Growth (%)
New Product Growth (%)
8.4
6.9
2.8
-1.3
3M-Jan-18
Total Growth (%)
8.2
6.8
2.5
-1.1
3M-Apr-18
Source: AIOCD, MOSL
3M-Jan 17
15 May 2018
15

Metals Weekly
Zinc and lead prices increase 3-4% WoW
14 May 2018
Update
Indian steel: Long product (TMT Mumbai) prices were down ~1% WoW. Sponge iron prices were down ~1%
WoW, while domestic scrap prices declined ~6% WoW. Domestic iron ore prices were unchanged. Pellet prices
were marginally higher. Domestic HRC prices were unchanged, but import and export offers were marginally
lower.
Raw materials prices inch up: Iron ore prices (China cfr) were up ~1% WoW. Thermal coal prices were also up
~1% WoW. Coking coal prices were up ~3% WoW. China's pellet import prices were down ~1% WoW. Chinese
graphite electrode prices were lower WoW.
Europe: HRC prices were unchanged. CIS HRC export prices were marginally lower WoW. Rotterdam scrap
prices were up ~2% WoW.
China prices inched up: Chinese local HRC prices were up ~1% WoW, while rebar prices were up ~2% WoW.
Export rebar prices were up ~1% WoW, but HRC prices were down ~1% WoW.
Base metals mixed trend: Aluminum (cash LME) prices were down ~2% WoW. Alumina prices were down
~12% WoW. Copper (cash LME) prices were up ~1% WoW. Zinc was up ~4% WoW, while lead rose ~3% WoW.
Brent crude prices were up ~3% WoW.
15 May 2018
16

March 2018 Results Preview | Consumer
Britannia Industries
Bloomberg
Equity Shares (m)
M. Cap. (INR b)/(USD b)
52-Week Range (INR)
1,6,12 Rel Perf. (%)
BRIT IN
120.0
611 / 9
5121 / 3320
5 / 11 / 39
CMP: INR5,093 TP: INR6,180 (+21%)
Buy
Financial Snapshot (INR b)
Y/E March
2017 2018E 2019E 2020E
Sales
EBITDA
Adj. PAT
Adj. EPS (INR)
EPS Gr. (%)
BV/Sh.(INR)
RoE (%)
RoCE (%)
Payout (%)
Valuations
P/E (x)
P/BV (x)
EV/EBITDA (x)
Div. Yield (%)
69.1
22.7
51.1
0.5
60.5
18.7
41.5
0.6
48.5
16.1
33.3
1.0
38.7
15.0
26.5
1.8
89.6
11.9
8.8
73.7
7.3
36.9
31.1
32.7
99.0 118.6 142.6
14.5
10.1
14.3
33.9
28.9
35.0
18.1
12.6
24.8
35.8
30.9
50.0
22.6
15.8
25.1
40.1
35.0
70.0
84.2 105.1 131.5
224.7 271.7 315.8 340.3
We expect Britannia’s (BRIT) sales to grow 14.9% YoY to INR25.8b,
with base business volumes growing 12% on a favorable base of
2% volume growth.
Wheat and sugar are down YoY. Gross margins are likely to
expand 60bp YoY to 38.6% in 4QFY18.
We expect 170bp YoY expansion in operating margin to 15.4%.
Estimate 29.3% EBITDA growth and 28.3% adj. PAT growth for the
quarter.
The stock trades at 48.5x/38.7x FY19E/20E EPS of
INR105.1/INR131.5; maintain Buy. Britannia is one of our top
picks in the tier-II consumer space.
Key issues to watch for
Pace of rural recovery.
Outlook for raw materials.
Update on dairy business.
Quarterly Performance
Y/E March
Base business volume growth (%)
Net Sales
YoY Change (%)
COGS
Gross Profit
Margins (%)
Other Operating Exp
% of Sales
Total Exp
EBITDA
Margins (%)
YoY Growth (%)
Depreciation
Interest
Other Income
PBT
Tax
Rate (%)
Adjusted PAT
YoY Change (%)
1Q
10.0
21,063
8.5
12,879
8,184
38.9
5,367
25.5
18,246
2,817
13.4
3.5
279
15
739
3,263
1,071
32.8
2,192
13.2
FY17
2Q
10.0
23,612
11.0
14,902
8,709
36.9
5,578
23.6
20,481
3,131
13.3
2.0
289
15
670
3,496
1,156
33.1
2,340
5.8
3Q
2.0
22,648
5.6
14,190
8,458
37.3
5,487
24.2
19,678
2,970
13.1
0.9
303
11
544
3,201
997
31.1
2,204
4.6
4Q
2.0
22,444
5.2
13,915
8,528
38.0
5,448
24.3
19,363
3,081
13.7
6.1
322
13
335
3,081
973
31.6
2,108
5.9
1Q
2.0
22,248
5.6
13,873
8,375
37.6
5,479
24.6
19,352
2,896
13.0
2.8
332
13
741
3,293
1,133
34.4
2,160
-1.5
FY18
2Q
5.0
25,365
7.4
15,840
9,525
37.6
5,836
23.0
21,676
3,689
14.5
17.8
336
14
596
3,934
1,326
33.7
2,609
11.5
FY17
3Q
11.0
25,583
13.0
15,745
9,838
38.5
5,946
23.2
21,691
3,892
15.2
31.0
329
26
451
3,989
1,354
33.9
2,635
19.6
4QE
12.0
25,799
14.9
15,849
9,950
38.6
5,967
23.1
21,816
3,983
15.4
29.3
402
2
518
4,097
1,394
34.0
2,703
28.3
6.0
89,623
7.4
55,887
33,736
37.6
21,872
24.4
77,759
11,864
13.2
-5.1
1,193
55
2,424
13,040
4,197
32.2
8,843
7.3
FY18E
7.5
98,996
10.5
61,307
37,689
38.1
23,228
23.5
84,535
14,461
14.6
21.9
1,399
55
2,306
15,313
5,206
34.0
10,107
14.3
E: MOSL Estimates
15 May 2018
17

March 2018 Results Preview | Sector: Capital Goods
Crompton
Bloomberg
Equity Shares (m)
M. Cap. (INR b)/(USD b)
52-Week Range (INR)
1,6,12 Rel Perf. (%)
CROMPTON IN
626.8
145 / 2
295 / 200
1 / 0 / -9
CMP: INR231
TP: INR305 (+32%)
Buy
Financial Snapshot (INR b)
Y/E March
2017 2018E 2019E 2020E
Net Sales
EBITDA
Adj. PAT
EPS (INR)
EPS Gr. (%)
BV/Sh. (INR)
RoE (%)
RoCE (%)
Payout (%)
Valuations
P/E (x)
P/BV (x)
EV/EBITDA (x)
Div Yield (%)
* Consolidated
49.6
27.0
30.8
0.7
45.5
19.9
28.3
0.7
35.8
16.3
23.0
1.4
30.3
13.4
20.0
1.7
39.8
4.9
2.9
4.7
146.1
8.6
76.4
32.5
32.7
41.4
5.3
3.2
5.1
8.9
11.7
50.2
28.4
33.0
46.6
6.4
4.1
6.5
27.1
14.3
49.9
30.8
50.0
52.6
7.3
4.8
7.7
18.4
17.3
48.5
34.5
50.0
We expect sales to register growth of 8% YoY, driven by 16%
growth in the lighting segment.
We expect operating profit of INR1.6b in 3QFY18, an improvement
of 16% YoY, and 90bp expansion in EBITDA margin to 13.8%.
Net profit is expected to be INR1b in 4QFY18 as against INR885m in
4QFY17, implying a growth of 20.7%. Maintain
Buy.
Key issues to watch
Details of segmental sales, as CROMPTON intends to improve
sales of its premium category products.
Ad spends incurred by the company during the quarter, as
CROMPTON intends to position itself as an electrical consumer
durables brand as against its current positioning as a fans brand.
Crompton: Quarterly Estimates (Standalone)
Y/E March
Sales
Change (%)
EBITDA
Change (%)
As of % Sales
Depreciation
Interest
Other Income
PBT
Tax
Effective Tax Rate (%)
Adjusted PAT
Change (%)
Reported PAT
Change (%)
1Q
10,962
1,573
14.4
28
180
34
1,400
465
33.2
935
935
FY17
2Q
3Q
8,737
8,792
8.5
1,012
972
17.4
11.6
11.1
27
26
161
162
41
50
865
834
286
290
33.1
34.8
579
544
28.3
574
544
32.0
4Q
10,762
7.4
1,386
9.0
12.9
29
153
69
1,273
388
30.5
885
16.6
864
29.8
1Q
10,554
-3.7
1,294
-17.8
12.3
32
162
97
1,198
395
33.0
802
(14.2)
802
(14.2)
FY18
2Q
3Q
9,597
9,382
9.8
6.7
1,207
1,165
19.3
19.8
12.6
12.4
32
32
157
158
35
66
1,054
1,040
346
345
32.8
33.2
708
695
22.3
27.9
708
695
23.3
27.9
FY17
4QE
11,650
8.3
1,608
16.1
13.8
32
153
58
1,481
437
29.5
1,043
17.9
1,043
20.7
39,759
119.5
4,902
134.0
12.3
110
655
195
4,331
1,399
32.3
2,932
138.7
2,907
166.9
FY18
41,438
4.2
5,274
7.6
12.7
128
686
256
4,716
1,524
32.3
3,193
8.9
3,193
9.8
15 May 2018
18

March 2018 Results Preview | Sector: Automobiles
Endurance Technologies
Bloomberg
Equity Shares (m)
M. Cap. (INR b)/(USD b)
52-Week Range (INR)
1,6,12 Rel. Perf. (%)
ENDU IN
140.7
178 / 3
1422 / 767
-4 / 23 / 52
CMP: INR1,263 TP: INR1,531(+21%)
Buy
Financial Snapshot (INR Billion)
Y/E March
2017 2018E 2019E 2020E
Sales
EBITDA
NP
Adj EPS (INR)
EPS Gr. (%)
BV/Sh. (INR)
RoE (%)
RoCE (%)
Valuations
P/E (x)
P/BV (x)
EV/EBITDA (x)
53.8
10.3
23.9
45.3
8.7
20.2
33.0
7.2
16.1
24.8
6.0
12.7
55.9
7.6
3.3
23.5
9.9
20.8
15.6
64.2
9.0
3.9
27.9
18.8
20.8
17.4
73.3
11.1
5.4
38.2
37.0
23.8
21.1
86.0
13.8
7.2
51.0
33.5
26.4
24.5
122.9 145.7 175.7 211.3
We expect 21.2% YoY growth (5.8% QoQ) in consolidated revenue
to INR16.7b, led by strong performance in domestic as well as
exports segments.
Consolidated EBITDA is expected to grow 21.6% YoY (3.6% QoQ),
led by healthy growth in the operating performance of both
Indian and European operations.
EBITDA margin is likely to remain flat YoY (-30bp QoQ) at 13.8%
mainly due to RM cost inflation.
We expect PAT to grow 20% YoY (+4.7% QoQ) to INR1b.
The stock trades at 33x FY19E EPS and 24.8x FY20 EPS. Maintain
Buy.
Key issues to watch for
Update on supplies to HMSI and Hero MotoCorp.
Update on new products in India.
EU business: Level of ramp-up at new plant in Germany.
Consolidated - Quarterly
Y/E March
INR m
Net Sales
YoY Change (%)
RM Cost (% of sales)
Staff Cost (% of sales)
Other Exp. (% of sales)
EBITDA
Margins (%)
Depreciation
Interest
Other Income
Exceptional Item
Rep. PBT
Eff. Tax Rate (%)
Adj. PAT
YoY Change (%)
1Q
14,402
13.3
58.4
9.8
18.9
1,865
13.0
684
104
89
0
1,166
24.5
880
15.2
FY17
2Q
3Q
14,482 13,193
7.5
2.3
57.8
57.0
8.9
10.5
19.4
19.1
2,008
1,773
13.9
13.4
699
741
81
88
54
69
0
0
1,281
1,014
30.3
26.7
893
743
14.8
13.5
4Q
13,803
4.8
57.4
9.9
18.9
1,898
13.8
781
49
119
0
1,186
29.6
835
3.3
1Q
15,503
7.6
59.0
9.5
17.6
2,136
13.8
742
57
60
0
1,397
30.9
965
9.7
FY18
2Q
3Q
16,204 15,809
11.9
19.8
59.3
57.4
8.6
9.3
18.0
19.2
2,292
2,229
14.1
14.1
768
798
69
47
62
84
0
269
1,517
1,199
34.3
34.8
997
957
11.6
28.8
FY17
4QE
16,723
21.2
58.0
9.0
19.2
2,309
13.8
804
60
72
0
1,516
33.9
1,002
20.0
55,880
6.8
57.7
9.8
19.0
7,555
13.5
2,905
322
319
0
4,646
28.9
3,303
9.9
(INR m)
FY18E
64,240
15.0
58.4
9.1
18.5
8,965
14.0
3,113
233
278
269
5,629
33.4
3,746
18.8
15 May 2018
19

March 2018 Results Preview | Sector: Healthcare
Lupin
Bloomberg
Equity Shares (m)
M. Cap. (INR b)/(USD b)
52-Week Range (INR)
1,6,12 Rel Perf. (%)
LPC IN
451.6
356 / 5
1465 / 727
0 / -29 / -57
CMP: INR789
TP: INR940 (+19%)
Buy
Financial Snapshot (INR Billion)
Y/E MARCH
2017 2018E 2019E 2020E
Sales
EBITDA
NP
EPS (INR)
EPS Gro. (%)
BV/Sh. (INR)
RoE (%)
RoCE (%)
Valuations
P/E (x)
P/BV (x)
EV/EBITDA (x)
D. Yield (%)
13.9
2.6
9.2
1.1
25.4
2.5
13.0
1.1
19.6
2.3
10.6
1.1
14.6
2.0
8.2
1.1
174.9
44.9
25.6
56.6
12.4
298.9
20.9
13.3
157.8
30.6
14.0
31.0
-45.2
318.6
10.1
6.8
179.6
36.8
18.2
40.2
29.5
348.3
12.1
8.4
208.2
46.4
24.4
54.1
34.6
391.9
14.6
10.4
We expect Lupin's (LPC) 4QFY18 revenue to decline ~6% YoY to
IN39.8b, mainly due to a decline in the US business by ~26% YoY
to INR14b.
India business is expected to exhibit robust growth of ~27% YoY
to INR11.1b, while Japan sales are expected to improve 17.7%
YoY to INR5.4b in 4QFY18, aided by currency tailwinds.
EBITDA is estimated to decline ~32% YoY to INR7.5b, as margins
are expected to come down by ~710bp to 18.9%.
Reported PAT is likely to decline 45% YoY to IN3.3b due to
decrease in EBITDA margin.
LPC has invested ~INR60b toward R&D over FY16-18E (much
higher than what it invested in a decade prior to that). GMP
compliance is key to monetize this investment. Although the
stock faces near-term pressure, key approvals in the US and
resolution of the WL status (expected in 12 months) will help
create value in 12-18 months. We maintain Buy with a TP of
INR940 @ 20x 1HFY20E PER.
Outlook on US business for FY19E and ANDA launches.
Outlook on future ANDA launches and Gavis integration.
Update on warning letter for Goa and Indore facility.
Outlook on inorganic growth initiatives.
Key issues to watch out
Quarterly Performance
Y/E March
Net Sales
YoY Change (%)
Total Expenditure
EBITDA
Margins (%)
Depreciation
Interest
Other Income
PBT
Tax
Rate (%)
Minority Interest
Reported PAT
Recurring PAT
YoY Change (%)
Margins (%)
1Q
44,677
41.6
31,596
13,080
29.3
2,027
320
826
11,560
2,734
23.7
6
8,819
8,820
55.1
19.7
FY17
2Q
3Q
42,905 44,828
28.9
26.1
32,624 32,670
10,281 12,158
24.0
27.1
2,112
2,309
263
459
271
1,036
8,177 10,426
1,589
4,095
19.4
39.3
8
24
6,580
6,307
6,622
6,331
58.0
19.5
15.4
14.1
4Q
42,533
2.0
31,481
11,052
26.0
2,674
406
453
8,425
1,367
16.2
-16
7,074
6,069
-18.9
14.3
1Q
38,696
-13.4
31,012
7,684
19.9
2,605
439
320
4,959
1,368
27.6
-12
3,603
3,581
-59.4
9.3
FY18E
2Q
3Q
39,520
39,756
-7.9
-11.3
30,989
32,873
8,531
6,883
21.6
17.3
2,722
2,804
479
540
740
284
6,070
3,824
1,541
1,608
25.4
42.0
19
5
4,511
2,211
4,550
2,577
-30.8
-59.3
11.5
6.5
4QE
39,826
-6.4
32,311
7,515
18.9
2,796
526
306
4,499
1,096
24.4
74
3,330
3,330
-45.1
8.4
(INR Million)
FY17
174,943
23.1
130,012
44,931
25.7
9,122
1,525
1,065
35,349
9,785
27.7
72
25,492
25,492
12.3
14.6
FY18E
157,798
-9.8
127,185
30,613
19.4
10,926
1,984
1,650
19,352
5,612
29.0
85
13,655
13,655
-46.4
8.7
15 May 2018
20

March 2018 Results Preview | Sector: Oil & Gas
MRPL
Bloomberg
Equity Shares (m)
M. Cap. (INR b)/(USD b)
52-Week Range (INR)
1,6,12 Rel Perf. (%)
MRPL IN
1752.7
196 / 3
146 / 106
-3 / -18 / -8
CMP: INR112
TP: INR119 (+7%)
Neutral
Financial snapshot (INR b)
y/e march
2017 2018E 2019E 2020E
Sales
EBITDA
Adj. PAT
Adj. EPS (INR)
EPS Gr. (%)
BV/Sh.(INR)
RoE (%)
RoCE (%)
Payout (%)
Valuation
P/E (x)
P/BV (x)
EV/EBITDA (x)
Div. Yield (%)
7.6
1.9
5.1
5.4
9.5
1.7
5.3
2.1
9.8
1.5
5.0
2.0
9.0
1.3
4.4
2.2
432.1 475.1 518.8 532.4
47.1
25.9
14.8
57.5
31.4
19.6
34.7
39.9
20.5
11.7
66.4
18.9
13.7
23.4
39.2
20.0
11.4
(2.5)
75.2
16.1
13.0
23.4
40.2
21.7
12.4
8.3
84.7
15.5
13.2
23.4
95.1 (20.7)
Reuters Singapore’s GRM is up +9% YoY (-3% QoQ) at USD7.0/bbl.
We model MRPL’s GRM at USD5.2/bbl (v/s USD6.8/bbl in 3QFY18
and USD8.1/bbl in 4QFY17).
We expect refinery throughput at 4.1mmt v/s 4.5mmt in 3QFY18
and 4.2mmt in 4QFY17.
We expect MRPL to report EBITDA of INR7.5b (v/s INR17.5b in
3QFY18). We estimate adjusted PAT at INR3.5b (v/s INR9.7b in
3QFY18).
For MRPL, we model GRM of USD6.4/bbl in FY19/20. The stock
trades at 9x FY20E EPS of INR12.4 and EV of 4.4x FY19E EBITDA.
Maintain Neutral.
Key issues to watch for
GRM
Forex fluctuations
Inventory changes
Standalone - Quarterly Earning Model
Y/E March
Net Sales
YoY Change (%)
EBITDA
Margins (%)
Depreciation
Interest
Other Income
PBT before EO expense
Extra-Ord expense
PBT
Tax
Rate (%)
Reported PAT
Adj PAT
YoY Change (%)
Margins (%)
Key Assumptions
Refining throughput (mmt)
Core GRM (USD/bbl)
E: MOSL Estimates
1Q
84,288
-25.5
12,206
14.5
1,703
1,459
2,295
11,340
0
11,340
4,155
37
7,185
7,185
36.0
8.5
3.7
5.3
FY17
2Q
3Q
4Q
1Q
99,690 114,753 133,349 102,624
-2.5
30.1
43.5
21.8
7,855 11,476 15,540
5,827
7.9
10.0
11.7
5.7
1,681
1,702
1,703
1,637
1,115
1,395
1,219
1,074
926
636
375
204
5,984
9,015 12,993
3,320
0
0 -15,973
0
5,984
9,015 28,966
3,320
1,826
3,355
9,542
980
31
37
33
30
4,159
5,660 19,424
2,340
4,159
5,660
8,713
2,340
-146.5
91.8
-35.5
-67.4
4.2
4.9
6.5
2.3
4.0
5.5
4.4
5.1
4.2
8.1
4.0
7.1
FY18E
2Q
3Q
4QE
90,965 141,020 140,458 432,079 475,068
-8.8
22.9
5.3
9.0
9.9
9,082 17,495
7,495 47,076 39,900
10.0
12.4
5.3
10.9
8.4
1,701
1,720
1,767
6,788
6,825
1,053
1,159
1,135
5,188
4,422
828
202
593
4,232
1,827
7,156 14,819
5,185 39,332 30,480
259
0
0 -15,973
259
6,898 14,819
5,185 55,305 30,221
2,118
5,110
1,728 18,877
9,936
31
34
33
34
33
4,780
9,709
3,457 36,428 20,285
4,959
9,709
3,457 25,907 20,459
19.2
71.5
-60.3
98.3
-21.0
5.5
6.9
2.5
6.0
4.3
3.5
5.3
4.5
6.8
4.1
5.2
16.3
6.0
16.1
6.1
(INR Million)
FY17
FY18E
15 May 2018
21

March 2018 Results Preview | Sector: Agri
PI Industries
Bloomberg
Equity Shares (m)
M. Cap. (INR b)/(USD b)
52-Week Range (INR)
1,6,12 Rel Perf. (%)
PI IN
136.6
123 / 2
1035 / 674
4 / 15 / -3
CMP: INR903
TP: INR1061 (+18%)
Buy
We expect revenue to grow 5.6% YoY to INR6,392m, aided by
growth of 7% in agri-input business and 5% in CSM business.
We estimate 110bp margin contraction to 24.3%, and expect
EBITDA to remain flat at INR1,553m.
We estimate adjusted PAT at INR1,156m, as against INR1,352m in
4QFY17. Buy.
Financial Snapshot (INR Billion)
Y/E March
2017 2018E 2019E 2020E
Sales
EBITDA
NP
EPS (INR)
EPS Gr. (%)
BV/Sh. (INR)
RoE (%)
RoCE (%)
Valuations
P/E (x)
P/BV (x)
EV/EBITDA (x)
EV/Sales (x)
27.0
7.6
21.0
5.1
30.2
6.4
20.1
4.8
23.7
5.3
15.9
4.2
20.4
4.3
13.3
3.5
22.8
5.5
4.6
33.4
46.4
32.8
31.0
23.2
5.6
4.1
29.9
-10.5
23.0
22.6
26.5
6.9
5.2
38.1
27.3
24.3
24.3
30.4
8.0
6.1
44.2
16.2
23.3
29.5
118.3 141.4 171.6 207.9
Key things to watch for
CSM growth and order book.
New launches and tie-ups.
Standalone - Quarterly Earning Model
Y/E March
Net Sales
YoY Change (%)
Total Expenditure
EBITDA
Margins (%)
Depreciation
Interest
Other Income
PBT before EO expense
Extra-Ord expense
PBT
Tax
Rate (%)
Reported PAT
Adj PAT
YoY Change (%)
Margins (%)
E: MOSL Estimates
1Q
6,834
15.4
4,734
2,100
30.7
178
16
113
2,019
0
2,019
306
15.2
1,713
1,713
99.5
25.1
FY17
2Q
3Q
5,719
4,878
20.0
-4.5
4,161
3,845
1,558
1,033
27.2
21.2
181
183
13
12
134
133
1,497
972
0
0
1,497
972
205
33
13.7
3.4
1,293
939
1,293
939
126.8
32.6
22.6
19.3
4Q
6,056
3.6
4,519
1,537
25.4
185
31
-21
1,299
0
1,299
-53
-4.0
1,352
1,352
40.8
22.3
1Q
5,848
-14.4
4,227
1,621
27.7
197
14
126
1,535
0
1,535
218
14.2
1,318
1,318
-23.1
22.5
FY18E
2Q
5,611
-1.9
4,389
1,222
21.8
205
12
123
1,127
0
1,127
324
28.7
803
803
-37.8
14.3
FY17
3Q
5,377
10.2
4,330
1,048
19.5
211
14
160
982
0
982
177
18.0
806
806
-14.2
15.0
4QE
6,392
5.6
4,839
1,553
24.3
220
12
124
1,445
0
1,445
289
20.0
1,156
1,156
-14.5
18.1
23,487
8.5
17,259
6,228
26.5
727
72
358
5,788
0
5,788
491
8.5
5,296
5,296
71.0
22.5
FY18E
23,228
-1.1
17,785
5,443
23.4
834
52
532
5,090
0
5,090
1,007
19.8
4,083
4,083
-22.9
17.6
15 May 2018
22

March 2018 Results Preview | Sector: Financials
Punjab National Bank
Bloomberg
Equity Shares (m)
M. Cap. (INR b)/(USD b)
52-Week Range (INR)
1,6,12 Rel Perf. (%)
PNB IN
2765.4
265 / 4
232 / 91
-3 / -32 / -48
CMP: INR96
TP: INR160 (+67%)
Buy
Financial Snapshot (INR B)
Y/E March
2017 2018E 2019E 2020E
NII
149.9 159.1 201.7 232.6
OP
145.7 139.1 164.6 188.7
NP
13.2 -13.9
0.1
39.7
NIM (%)
2.3
2.2
2.4
2.5
EPS (INR)
6.2
-5.7
0.0
14.3
EPS Gr. (%)
NM
NM
NM
NM
BV/Sh. (INR)
178
169
167
180
ABV/Sh. (INR)
71
88
112
137
RoE (%)
3.6
-3.0
0.0
7.7
RoA (%)
0.2
-0.2
0.0
0.4
Payout (%)
0.0
NM
NM
12.5
Valuations
P/E(X)
15.4
NM
NM
6.7
P/BV (X)
0.5
0.6
0.6
0.5
P/ABV (X)
1.35
1.09
0.86
0.70
Div. Yield (%)
0.0
1.7
1.9
1.9
We expect loan growth to pick up (+15% YoY/+7% QoQ). Deposits
should grow 8% YoY, reflecting some stickiness in CASA, post
inflows after demonetization.
NII is likely to grow 1.6% QoQ (and 10% YoY) with uptick in loan
book growth and improvement in margins.
Overall non-interest income is expected to decline by 35% YoY, as
fee income growth should be partly offset by moderation in
treasury gains.
Stress addition is likely to increase significantly on account of
fraud reported (16.3% slippages). We expect credit cost to be
~550bp.
Resolutions in key accounts and the fraud reported remains a key
trigger. The stock trades at 0.6x FY19E BV.
Maintain Buy.
Key issues to watch for
Outlook on asset quality, as net stressed loans remain one of the
highest in the industry.
Resolution of the ongoing fraud and its impact.
Trend in loan growth and fee income.
NIMs and CASA performance.
INR m
Quarterly Performance
Y/E March
Net Interest Income
% Change (YoY)
Other Income
Total Income
Operating Expenses
Operating Profit
% Change (YoY)
Other Provisions
Profit before Tax
Tax
Net Profit
% Change (YoY)
Operating Parameters
Deposits (INR b)
Loans (INR b)
Deposit Growth (%)
Loan Growth (%)
Asset Quality
Gross NPA (INR B)
Net NPA (INR B)
Gross NPA (%)
Net NPA (%)
PCR (%)
1Q
36,990
-9.8
23,551
60,541
27,794
32,746
4.6
27,384
5,362
2,299
3,064
-57.5
5,540
3,916
7.0
2.8
567
357
13.8
9.2
36.9
FY17
2Q
38,799
-10.2
23,879
62,678
29,557
33,120
12.7
25,338
7,783
2,289
5,494
-11.5
5,749
3,937
6.5
3.4
565
357
13.6
9.1
36.7
3Q
37,308
-9.4
21,398
58,706
30,897
27,809
-4.7
25,622
2,187
116
2,072
306.2
6,122
3,857
11.6
-1.8
556
350
13.7
9.1
37.1
4Q
36,835
33.1
31,028
67,863
5,545
62,318
93.1
57,535
4,783
2,164
2,619
NM
6,217
4,195
12.4
1.7
554
327
12.5
7.8
40.9
1Q
38,551
4.2
23,318
61,869
29,696
32,173
-1.8
26,087
6,086
2,652
3,434
12.1
6,256
3,997
12.9
2.1
577
346
13.7
8.7
40.1
FY18E
2Q
40,152
3.5
19,060
59,212
26,421
32,791
-1.0
24,408
8,383
2,777
5,606
2.0
6,362
4,103
10.7
4.2
576
346
13.3
8.4
40.0
FY17
3Q
39,887
6.9
30,820
70,707
28,255
42,452
52.7
44,667
-2,215
-4,516
2,301
11.1
6,480
4,521
5.9
17.2
575
341
12.1
7.6
40.8
4QE
40,506
10.0
20,025
60,531
28,831
31,700
-49.1
64,091
-32,391
-7,156
-25,235
-1,063.6
6,745
4,833
8.5
15.2
693
436
13.6
9.0
37.2
1,49,932
-2.1
89,514
2,39,445
93,794
1,45,652
19.2
1,25,536
20,115
6,867
13,248
NM
6,217
4,195
12.4
1.7
554
327
12.5
7.8
40.9
FY18E
1,59,096
6.1
93,223
2,52,319
1,13,203
1,39,116
-4.5
1,59,253
-20,137
-6,242
-13,895
-204.9
6,745
4,833
8.5
15.2
693
436
13.6
9.0
37.2
15 May 2018
23

In conversation
1. MPHASIS : Still have a strong partnership with blackstone after
the sale; Nitin Rakesh, ED and CEO
It was an 8% stake sale, so Blackstone holding now about 52% odd.
The idea was to create more liquidity in the stock and Blackstone still retains
controlling position. From that perspective nothing much changes from
company’s point of view. Still have a strong partnership.
Blackstone have clearly said that they don’t intend to sell anymore because their
global positioning always has to have controlling positions.
2. CANARA BANK : Expect loan growth of 10-12%, retail growth
of 20-22% this year; Rakesh Sharma, MD and CEO
Rs 8,181 crore of slippages came in from Reserve Bank of India’s instructions.
Agricultural slippages at INR 890 crores.
Bank’s efforts are that by September gross non-performing asset (NPA) should
come down around 9.5 percent and net NPA below 5.5 percent.
28 cases of National Company Law Tribunal (NCLT) exposures are under
resolution process.
Bank’s target for overall growth in the current year will be 10-12 percent but
retail will grow by 20-25 percent.
3. Graphite India maintains strong and positive outlook for first
quarter; K K Bangur, Chairman
Margins would expand, prices are better, volumes will be more and capacity
utilisation will improve. So maintain a strong and positive outlook for Q1, as well
as quarters to come.
Realisation was lower in the fourth quarter because of legacy orders and in
FY18, around 70% of the orders were at legacy prices.
Legacy orders are likely to be in low single-digit of the total sales in FY19.
The graphite prices and demand is expected to remain robust going forward as
well. The spot prices currently are at $17,000-23,000 per tonne.
Needle coke availability is low because of its divergence into lithium batteries
but the company has been able to secure the supply to run capacity to the
optimum.
4. SOUTH INDIAN BANK : Revised regulatory guidelines impacted
asset quality of the bank; VG Mathew, Managing Director and
Chief Executive Officer
Revised regulatory guidelines impacted the asset quality of the bank.
Bank had recoveries of Rs 409 crore including sale to asset reconstruction
companies (ARCs) and therefore, bank had a closing balance of Rs 1,980 crore.
The loan growth has been 17%. Bank had projected 18% but have been able to
achieve 17% because of some recent selloff and also some significant pre-
payment that bank has been able to collect in one of the accounts in the
corporate book, which has come down. Otherwise, well on target of 18%.
15 May 2018
24

From the think tank
1. India, the new battlefield for giant retailers
The great global retail battle has now truly arrived in India. Walmart closed a deal
last week to buy Flipkart for $16 billion. Rival Amazon was also interested but
perhaps lost out because it could have run into trouble with Indian competition
regulations. Amazon promptly announced after the Flipkart sale that it would be
pumping an additional Rs2,600 crore into its India operations. The past few years
have seen the boundary between traditional retail and online commerce
dissipate. Companies have tried to provide consumers with an integrated
experience. Walmart made the first move when it paid $3.3 billion for start-up
Jet.com. Amazon followed with a $13.7 billion deal to buy Whole Foods Market, a
chain of brick-and-mortar stores. The emerging India battle should be seen in this
context. It is significant that Walmart has made a big bet on an online retailer like
Flipkart. Corporate strategists are torn into two camps over an existential
question. Who is more likely to succeed—the traditional retailer that has moved
online or the online retailer that has bought physical stores?
2. What India can learn from Mexico’s experience
Benito Juárez International Airport in Mexico City is an airport that shows signs
of wear and tear. It serves as the gateway to most who fly into Mexico. In 2017,
about 44 million passengers used the terminal, making it the busiest in Latin
America (it would rank about 15th on Asia’s list, behind Mumbai and Delhi). A
second airport, about 10 miles further from the city, was commissioned by
incumbent President Enrique Peña Nieto (EPN). It is slated for completion in
2022 and will join a slate of other infrastructure projects—in roads, rail, ports
and logistics— initiated during EPN’s six-year term that ends this year (he is not
permitted another term under Mexico’s constitution). Under EPN, Mexico has
been a front-runner in reforms, according to the Organisation for Economic Co-
operation and Development (OECD). Reform action was led by the Pacto por
Mexico, a historic agreement between the three main parties to restore high
growth after years of tepid growth. The scope and speed of reform have been
remarkable and have in particular targeted Mexico’s oligopolistic sectors—
telecommunications, electricity and oil. All three have been substantially
deregulated and the regulatory framework for private sector participation has
been established.
3. How to improve agricultural productivity
Global attention has been devoted to water scarcity and its effect on Indian
farmers. However, new analysis from Indian researchers suggests that far more
good could come if irrigation were combined with seed improvement. Tata Trusts
and Copenhagen Consensus have commissioned new research by noted experts
from India and around the world, looking at measures that would help Indian
states respond to major challenges and improve their competitiveness, economic
performance, and the well-being and prosperity of citizens. The new research
focuses on establishing how much different policies would cost, and what they
would achieve overall in economic, environmental and societal benefits. Now, two
new research papers add to the volume of evidence on how to boost agricultural
performance. The first of these is by Dinesh Kumar, executive director of the
15 May 2018
25

Institute for Resource Analysis and Policy (Irap), Hyderabad. It examines policies
that would reduce the effects of water scarcity in Rajasthan and Andhra Pradesh.
4. Distressed asset investments in India
The distressed asset investment landscape in India has come of age and the time
is ripe for discerning investors to step in and pick “value” assets. Over the last
two years, there has been a remarkable change in the resolution process for
non-performing loans (NPLs) on banks’ balance sheets. While India has had a
fair share of stressed assets at regular intervals, investors have stayed away
from the space in the absence of robust legal, regulatory and resolution
frameworks. Lack of creditor-friendly laws have allowed promoters to exploit
the system and banks have continued “evergreening” loans with lax oversight.
The Insolvency and Bankruptcy Code (IBC) changed the game. It has given
stressed asset resolutions a legal structure, well-defined processes,
responsibilities and timelines. The initial cases before the National Company
Law Tribunal (NCLT) indicate that the authorities are being proactive in ironing
out new challenges. While global entities are waiting to see how the new
frameworks play out, domestic ones have already started working actively in the
space to acquire assets at discounted prices.
International
5. A new era of nuclear uncertainty
With the decision to withdraw from the Iran nuclear agreement – formally
known as the Joint Comprehensive Plan of Action (JCPOA) – US President Donald
Trump’s administration has demonstrated, yet again, that it is determined to
destroy major global structures and agreements. The decision will be a massive
blow to the 2015 deal, putting the entire world at risk. The JCPOA – the result of
years of difficult negotiations – was agreed by seven countries and the European
Union, and unanimously endorsed by the United Nations Security Council. Yet
Trump has decided unilaterally to impose “the highest level of economic
sanction” on Iran and on “any nation that helps Iran in its quest for nuclear
weapons.” Now, companies and banks from countries that have lived up to their
commitments under the JCPOA stand to suffer considerably, as a result of their
legitimate business ties with Iran. In other words, the country that is breaking its
promises has decided to punish those that have kept theirs.
15 May 2018
26

Click excel icon
for detailed
valuation guide
Valuation snapshot
Company
Automobiles
Amara Raja
Ashok Ley.
Bajaj Auto
Bharat Forge
Bosch
CEAT
Eicher Mot.
Endurance Tech.
Escorts
Exide Ind
Hero Moto
M&M
Mahindra CIE
Maruti Suzuki
Motherson Sumi
Tata Motors
TVS Motor
Aggregate
Banks - Private
Axis Bank
DCB Bank
Equitas Hold.
Federal Bank
HDFC Bank
ICICI Bank
IDFC Bank
IndusInd
J&K Bank
Kotak Mah. Bk
RBL Bank
South Indian
Yes Bank
Aggregate
Banks - PSU
BOB
BOI
Canara
Indian Bk
PNB
SBI
Union Bk
Aggregate
NBFCs
Aditya Birla Cap
Bajaj Fin.
Capital First
Cholaman.Inv.&Fn
Dewan Hsg.
GRUH Fin.
HDFC
HDFC Stand. Life
Indiabulls Hsg
L&T Fin Holdings
LIC Hsg Fin
Reco
Buy
Buy
Buy
Buy
Neutral
Buy
Buy
Buy
Sell
Buy
Neutral
Buy
Buy
Buy
Buy
Buy
Neutral
CMP TP % Upside
EPS (INR)
EPS Gr. YoY (%)
P/E (x)
P/B (x)
ROE (%)
(INR) (INR) Downside FY18E FY19E FY20E FY18E FY19E FY20E FY18E FY19E FY18E FY19E FY18E FY19E
865 1000
155 179
2835 3550
733 869
18199 19096
1430 1845
30472 34714
1184 1531
942 826
259 301
3649 4052
850 914
240 274
8715 10468
337 437
324 565
620 709
16
15
25
19
5
29
14
29
-12
16
11
8
14
20
30
74
14
28.3
5.4
147.9
20.0
459.1
64.0
799.6
27.9
39.1
8.2
185.1
39.7
9.6
266.7
8.1
24.8
14.1
34.0 40.0 0.9
7.2
9.2 28.8
167.8 197.2 4.8
26.4 34.8 52.8
582.9 694.4 -3.0
84.9 115.3 -31.5
1,046.3 1,340.9 27.0
38.2 51.0 18.8
49.5 59.0 103.5
10.1 12.8 0.4
201.2 229.1 9.5
46.9 51.2 45.1
13.7 16.6 107.8
349.9 444.8 7.3
12.5 17.5 5.0
57.0 65.7 25.2
22.4 32.4 20.4
17.0
19.4
9.7
7.5
5.8
79.3
17.8
3.2
83.0
10.0
40.5
22.1
4.1
24.3
35.8
11.5
11.9
8.2
94.5
24.1
3.8
104.4
14.4
50.1
29.5
5.3
32.1
-92.8
13.8
-82.3
-1.3
19.4
-31.0
0.3
25.2
LP
21.3
27.3
-22.9
26.3
4.0
20.3
33.1
13.5
32.1
27.0
32.8
30.9
37.0
26.5
23.5
8.6
18.0
43.1
31.2
54.7
129.8
58.8
47.6
#####
22.4
710.5
21.3
16.9
68.7
7.2
37.9
13.5
24.5
46.1
115.7
31.7
45.1
17.6
27.1
17.5
31.7
19.1
35.8
28.2
33.5
19.3
26.1
13.9
9.3
20.5
27.1
39.6
15.3
44.1
20.6
84.1
17.9
58.1
42.4
19.3
35.2
19.2
25.8
43.6
23.6
33.6
28.9
32.3
33.0
30.6
28.5
19.2
36.7
39.6
22.4
38.1
42.4
24.1
31.6
19.7
21.4
24.9
32.7
41.7
13.1
43.8
25.9
497.0
23.7
179.1
18.9
29.8
29.4
14.0
31.8
6.1
39.0
34.1
13.8
18.7
32.5
41.9
NM
NA
12.0
NM
88.6
NM
0.0
39.9
41.6
16.8
25.2
16.7
69.5
46.0
97.9
13.5
26.4
12.7
25.4
21.4
16.9
27.8
31.2
16.8
29.1
31.0
19.0
25.6
18.1
18.1
17.4
24.9
26.9
5.7
27.6
17.5
28.4
19.3
22.1
15.5
25.5
17.4
13.1
23.1
5.4
31.3
23.3
6.4
14.2
22.4
16.0
15.7
30.1
8.4
2,640
13.6
NM
14.7
28.2
30.2
12.9
21.0
12.1
59.7
39.6
81.3
11.2
19.2
11.1
4.9
6.5
4.4
7.1
5.8
2.2
11.8
8.1
3.9
4.1
6.2
3.5
2.4
6.3
7.5
1.6
10.1
4.5
2.2
2.3
2.5
1.4
4.9
1.9
0.9
4.9
0.6
4.8
3.2
1.0
3.1
3.3
0.9
0.5
0.6
0.9
0.5
1.0
0.4
0.8
4.3
5.4
4.0
5.9
5.2
2.0
8.9
6.7
3.3
3.7
5.5
3.2
2.1
5.4
6.3
1.2
7.9
3.8
2.0
2.0
2.3
1.3
3.8
1.8
0.9
4.2
0.5
4.4
3.0
0.9
2.6
2.8
17.3
24.3
23.9
20.9
15.2
10.3
35.2
20.8
18.3
12.9
33.8
14.6
10.4
18.5
19.2
13.2
25.3
17.4
0.5
10.9
1.4
8.3
17.9
6.7
6.8
16.5
9.1
10.9
11.6
6.9
17.7
10.2
18.0
27.6
24.6
23.3
17.5
12.5
34.9
23.8
18.7
14.4
32.1
14.8
13.1
21.4
25.4
24.3
32.0
21.6
7.4
11.1
10.7
9.0
16.9
10.8
6.9
19.6
9.9
12.0
13.3
13.7
19.9
12.7
Buy
Neutral
Buy
Buy
Buy
Buy
Neutral
Buy
Buy
Buy
Buy
Buy
Buy
552
188
166
90
2021
310
42
1914
54
1269
515
26
345
600
198
185
127
2400
380
65
2150
100
1400
650
38
444
9
5
12
42
19
23
54
12
85
10
26
44
29
1.1
8.0
0.9
4.8
67.8
10.6
3.0
60.2
8.8
32.5
15.1
1.9
18.4
Buy
Neutral
Neutral
Buy
Buy
Buy
Neutral
143
99
250
314
89
253
88
185
112
266
371
160
362
97
30
13
6
18
79
43
10
3.4
-18.8
-63.5
26.2
-5.7
2.9
-56.5
8.9
6.3
8.3
37.3
0.0
18.7
-1.5
15.7 -43.1 161.5 75.6
12.1 Loss LP 91.8
39.9
PL
LP 380.7
45.6 -10.4 42.5 22.1
14.3
PL
LP 42,272
34.0 861.1 553.8 81.6
5.7
PL Loss LP
PL
LP 106.0
42.1
34.2
27.5
19.1
22.8
20.4
18.9
25.8
20.9
49.3
18.7
0.9 2.0 5.0
0.5 -7.7 3.0
0.6 NA 1.8
0.8 8.3 11.0
0.5 -3.0 0.0
1.0 -0.3 5.7
0.4 -23.8 -0.7
0.8 -1.2 5.2
Buy
Buy
Buy
Buy
Buy
Neutral
Buy
Buy
Buy
Buy
Neutral
150
1861
574
1571
625
690
1930
540
1217
179
501
215
2330
960
1930
765
600
2225
475
1650
240
610
44
25
67
23
22
-13
15
-12
36
34
22
3.8
5.3
7.5
NA 41.5
44.8 61.7 82.8 39.8 37.8
34.2 44.6 56.8 38.9 30.2
62.3 75.0 89.3 35.5 20.4
37.4 51.7 63.5 26.2 38.4
9.9 11.6 13.9 21.9 16.6
42.0 48.7 57.9 5.3 16.1
5.5
6.6
8.4 23.5 20.4
90.2 108.8 131.5 31.5 20.6
6.8
9.3
13.9 29.5 37.4
39.4 45.0 53.5 3.0 14.3
3.8 3.0 12.4 12.1
6.5 5.5 20.2 19.9
2.2 1.9 13.7 15.6
4.8 4.0 20.6 20.7
2.3 2.0 14.1 17.4
20.4 16.9 32.6 31.0
5.2 4.5 18.4 17.5
3.5 2.9 21.7 21.7
4.0 3.5 30.7 33.2
2.9 2.6 13.4 14.1
2.1 1.8 17.0 17.2
15 May 2018
27

Click excel icon
for detailed
valuation guide
CMP
(INR)
610
493
431
1272
590
2285
1445
TP % Upside
EPS (INR)
(INR) Downside FY18E FY19E FY20E
750
23
24.4 31.1 38.9
600
22
14.5 20.7 26.5
475
10
44.0 44.7 49.8
1750
38
49.9 65.7 87.3
740
25
32.9 39.0 46.0
2800
23
100.8 145.9 175.9
1950
35
69.1 118.2 141.5
Valuation snapshot
Company
MAS Financial
M&M Fin.
Muthoot Fin
PNB Housing
Repco Home
Shriram City Union
Shriram Trans.
Aggregate
Capital Goods
ABB
Bharat Elec.
BHEL
Blue Star
CG Cons. Elec.
CG Power & Indu.
Cummins
Engineers India
GE T&D
Havells
K E C Intl
L&T
Siemens
Solar Ind
Thermax
Va Tech Wab.
Voltas
Aggregate
Cement
Ambuja Cem.
ACC
Birla Corp.
Dalmia Bharat
Grasim Inds.
India Cem
JK Lakshmi Ce
Ramco Cem
Orient Cem
Prism Johnson
Sagar Cements
Sanghi Inds.
Shree Cem
Ultratech
Aggregate
Consumer
Asian Paints
Britannia
Colgate
Dabur
Emami
Future Consumer
Godrej Cons.
GSK Cons.
HUL
ITC
Jyothy Lab
Reco
Buy
Buy
Neutral
Buy
Buy
Buy
Buy
EPS Gr. YoY (%)
P/E (x)
P/B (x)
ROE (%)
FY18E FY19E FY20E FY18E FY19E FY18E FY19E FY18E FY19E
62.2 27.5 25.2 25.0 19.6 3.7 3.3 21.3 17.8
104.9 42.9 27.9 34.0 23.8 3.3 3.0 10.5 13.1
48.9 1.6 11.4
9.8
9.7
2.2 1.9 24.5 20.9
57.7 31.8 32.9 25.5 19.4 3.4 3.0 14.3 16.5
13.0 18.5 18.1 17.9 15.1 2.8 2.4 16.7 16.9
19.5 44.8 20.6 22.7 15.7 2.8 2.4 12.7 16.3
24.7 71.0 19.8 20.9 12.2 2.6 2.2 13.1 19.5
26.9 27.3 24.5 32.0 25.1 4.6 4.0 14.5 15.8
17.7
7.6
19.4
26.9
18.4
58.8
18.6
19.8
14.2
19.3
28.3
20.0
18.8
26.1
23.9
9.8
13.9
18.7
31.9
31.0
19.2
41.3
14.2
41.8
40.5
27.6
62.2
32.7
39.7
32.5
35.1
41.3
29.4
62.9
19.2
24.6
46.3
46.1
69.5
33.2
24.2
37.0
48.4
25.2
28.4
51.6
43.7
41.9
13.9
33.1
32.0
36.1
30.5
95.1
52.9
23.1
46.9
67.6
34.5
57.5
46.0
37.8
21.6
41.5
48.6
40.0
61.4
64.8
46.2
47.6
43.5
NM
51.2
35.3
62.8
31.8
44.4
45.7
17.3
21.5
31.2
36.3
42.5
24.6
22.1
33.7
38.0
21.6
24.0
37.9
35.3
33.4
13.2
28.0
26.6
26.8
23.8
16.7
38.0
11.2
20.5
25.6
28.0
23.1
22.4
18.8
11.6
31.9
33.8
25.3
50.7
51.9
39.2
41.1
35.7
187.3
44.6
31.3
53.3
28.0
34.3
7.3 6.6 11.6 14.3
3.2 2.9 16.6 16.7
0.9 0.9 3.6 4.0
9.2 8.5 20.4 28.3
20.1 16.5 50.2 49.9
1.2 1.2 1.7 2.7
5.3 4.9 16.5 20.7
3.5 3.2 13.9 14.1
8.1 7.0 23.5 22.3
9.1 8.0 18.7 21.0
5.5 4.6 21.7 21.1
3.5 3.2 13.0 14.0
4.7 4.4 9.1 11.5
8.9 7.4 21.9 22.9
4.8 4.3 11.9 13.6
2.2 2.0 17.1 16.0
5.3 4.6 16.9 17.6
3.5 3.2 10.9 12.2
2.2
3.0
1.7
4.5
1.5
0.8
3.2
4.7
2.5
5.3
2.4
1.7
6.3
4.3
3.2
14.8
20.1
22.5
11.4
11.9
9.4
11.8
7.1
48.1
6.9
6.5
2.0
2.9
1.5
4.1
1.4
0.8
2.9
4.1
2.3
4.4
2.1
1.5
5.4
3.9
2.9
13.6
17.3
21.1
10.4
10.5
9.0
9.2
6.3
47.3
6.4
6.3
6.1
10.1
1.7
8.9
6.9
1.7
4.8
14.3
4.4
11.9
6.5
9.7
16.3
9.3
8.0
25.3
33.9
49.9
25.9
29.2
-1.8
24.9
21.2
78.2
22.8
14.3
7.8
12.4
9.6
11.3
12.9
3.9
11.7
15.6
10.3
21.2
12.0
15.6
18.2
12.2
11.5
27.9
35.8
55.5
26.5
31.3
4.9
23.2
21.4
89.6
23.8
18.5
Sell
Buy
Sell
Neutral
Buy
Neutral
Buy
Buy
Neutral
Buy
Neutral
Buy
Neutral
Neutral
Buy
Buy
Neutral
1247
126
78
768
235
79
764
152
381
543
409
1380
1020
1065
1175
464
596
1060
196
80
875
305
90
1040
200
430
630
390
1690
1185
1100
1350
700
660
-15
56
3
13
30
14
36
31
13
16
-5
22
16
3
15
51
11
19.8
6.5
3.2
16.6
5.1
1.1
23.0
6.3
10.3
11.2
16.2
48.6
19.8
24.4
28.0
33.3
18.0
27.3
7.3
3.6
24.6
6.5
1.9
31.0
6.9
11.3
14.3
18.9
57.6
26.9
30.2
35.1
35.2
21.3
32.1 8.1 37.7
7.8
3.7 11.4
4.3 135.9 14.2
31.2 36.0 48.2
7.7
8.9 27.1
3.0 -72.2 63.3
36.8 -13.2 34.7
8.2 48.1 9.2
12.9 79.8 9.7
17.1 17.4 27.4
24.3 36.6 16.7
69.0 14.8 18.5
31.9 10.9 36.2
38.0 18.2 23.8
43.5 3.1 25.3
38.6 76.4 5.7
24.3 16.4 18.4
16.7 20.2
10.7
79.6
50.5
102.1
111.8
9.4
21.2
37.8
8.7
6.5
70.6
11.3
683.8
171.3
29.5
31.3
-74.0
34.0
-29.8
-48.5
-17.7
-11.9
LP
769.4
LP
59.3
1.1
-12.3
-6.9
34.9
28.1
470.3
39.1
105.6
129.3
163.8
23.4
148.6
105.1
101.0
86.0
30.3
43.8
58.5
Neutral
Neutral
Buy
Buy
Neutral
Neutral
Buy
Buy
Buy
Buy
Not Rated
Buy
Buy
Buy
218 255
1448 1747
706 1004
2748 3350
1100 1187
136 148
387 470
829 967
124 170
109 144
951
-
99 157
16135 19731
4095 4818
17
21
42
22
8
9
21
17
37
32
59
22
18
6.0
47.4
7.4
52.0
47.6
2.9
5.7
24.0
2.2
2.4
25.2
4.6
388.5
84.3
8.1
60.7
42.3
72.3
97.9
6.6
15.1
29.7
5.4
4.9
50.6
8.5
506.3
121.2
Neutral
Buy
Buy
Buy
Buy
Buy
Neutral
Neutral
Buy
Neutral
Neutral
1298
5459
1108
370
1055
56
1082
5873
1505
284
375
1280
6180
1420
435
1390
76
1155
6255
1805
275
405
-1
13
28
17
32
35
7
6
20
-3
8
21.1
84.2
24.0
7.8
24.3
-0.1
21.1
166.5
24.0
9.0
8.5
25.6 30.5 1.9 21.1 19.0
105.1 131.5 14.3 24.8 25.1
28.3 33.8 12.9 17.9 19.7
9.0
10.4 7.2 16.0 15.5
29.6 35.6 -8.5 21.9 20.4
0.3
1.1 Loss LP 276.5
24.3 28.1 11.7 14.9 15.9
187.8 215.6 6.6 12.8 14.8
28.3 33.3 22.1 17.9 17.8
10.2 11.4 6.6 13.7 12.4
10.9 13.6 -24.8 29.3 24.0
15 May 2018
28

Click excel icon
for detailed
valuation guide
CMP TP % Upside
EPS (INR)
Reco
(INR) (INR) Downside FY18E FY19E FY20E
Neutral
312 350
12
6.4
7.6
9.0
Neutral
9573 9535
0
140.0 189.3 209.0
Buy
23993 27490
15
297.1 415.7 549.8
Buy
1101 1115
1
17.6 20.6 23.7
Neutral
8920 9065
2
131.3 162.1 187.8
Not Rated 179
-
3.5
6.4
9.7
Buy
1101 1450
32
14.1 17.4 22.9
Neutral
3194 3510
10
32.6 56.9 78.5
Valuation snapshot
P/B (x)
ROE (%)
FY18E FY19E FY18E FY19E
15.8 13.8 34.0 35.8
27.0 24.0 40.3 50.2
32.2 25.7 39.9 44.6
14.1 12.2 24.2 24.5
35.8 30.2 57.0 59.7
2.5 2.3 4.9 8.5
11.0 9.5 14.9 16.2
16.8 12.5 17.2 22.3
13.3 11.9 26.8 28.7
4.0 3.5 22.5 19.8
4.7 4.0 16.4 19.5
4.6 3.9 26.0 20.4
3.0 2.5 24.2 21.7
7.3 6.7 7.2 11.5
4.9 4.1 21.6 22.8
3.3 2.9 12.4 13.3
5.6 5.0 16.0 20.0
2.6 2.3 9.0 13.9
1.2 1.2 1.2 2.2
2.7 2.3 16.4 15.3
1.7 1.5 13.2 13.9
12.5 15.5 19.7 27.2
3.3 3.0 10.5 13.0
3.2 2.6 18.9 21.5
3.4 2.9 11.9 17.8
2.4 2.2 10.1 12.1
5.5 5.1 16.1 16.8
3.5 2.9 11.0 17.4
1.6 1.4 4.6 12.1
3.0 2.8 8.5 13.2
4.7 4.2 17.6 19.9
3.5 3.1 12.2 14.6
2.7
1.5
3.9
3.5
2.3
1.6
3.6
1.8
3.2
2.5
1.3
3.3
3.1
2.0
1.5
3.4
1.6
2.9
2.2
14.6
23.6
13.5
12.4
10.8
9.4
6.6
9.1
6.9
14.1
16.2
13.7
12.4
13.7
13.4
10.7
12.7
Company
Marico
Nestle
Page Inds
Pidilite Ind.
P&G Hygiene
Prabhat Dairy
United Brew
United Spirits
Aggregate
Healthcare
Alembic Phar
Alkem Lab
Ajanta Pharma
Aurobindo
Biocon
Cadila
Cipla
Divis Lab
Dr Reddy’s
Fortis Health
Glenmark
Granules
GSK Pharma
IPCA Labs
Jubilant Life
Laurus Labs
Lupin
Sanofi India
Shilpa Medicare
Strides Shasun
Sun Pharma
Torrent Pharma
Aggregate
Infrastructure
Ashoka Buildcon
IRB Infra
KNR Constructions
Sadbhav Engineering
Aggregate
Logistics
Allcargo Logistics
Concor
Gateway Distriparks
Aggregate
Media
Dish TV
D B Corp
Den Net.
Ent.Network
Hathway Cable
Hind. Media
HT Media
Jagran Prak.
Music Broadcast
PVR
EPS Gr. YoY (%)
P/E (x)
FY18E FY19E FY20E FY18E FY19E
2.0 18.3 18.2 48.7 41.2
13.2 35.2 10.4 68.4 50.6
24.5 39.9 32.2 80.8 57.7
5.4 17.0 14.9 62.4 53.4
-1.2 23.4 15.8 67.9 55.0
-2.0 83.8 52.1 51.6 28.1
62.0 23.9 31.2 78.2 63.2
22.1 74.3 38.1 97.9 56.2
9.9 19.0 16.9 49.4 41.5
18.9
22.1
20.6
12.6
58.8
19.5
22.1
26.6
17.7
54.0
15.3
11.7
57.2
24.3
13.5
17.6
18.8
30.2
18.5
12.6
22.0
22.2
21.2
38.4
9.9
21.9
24.0
16.4
11.2
26.2
15.8
23.2
Neutral
Buy
Buy
Buy
Neutral
Buy
Neutral
Neutral
Neutral
Buy
Neutral
Buy
Neutral
Buy
Buy
Buy
Buy
Buy
Buy
Buy
Buy
Neutral
484
1979
1065
611
634
392
577
1171
2016
149
503
93
2436
711
844
480
754
4890
449
513
474
1362
555
2500
1560
820
600
555
600
1100
2575
185
550
175
2500
750
1110
586
940
5600
686
989
675
1400
15
26
46
34
-5
41
4
-6
28
24
9
89
3
6
32
22
25
15
53
93
42
3
24.8
65.4
53.0
43.8
6.2
16.0
21.6
32.9
67.1
1.5
30.6
6.3
38.3
21.4
45.6
15.8
31.0
141.7
13.3
14.1
13.2
48.0
25.6 30.5 15.0 3.1 19.1 19.5
89.5 110.6 -12.4 36.9 23.6 30.3
51.6 65.0 -7.5 -2.6 25.9 20.1
48.7 53.6 11.4 11.2 10.1 14.0
10.8 19.8 -39.2 73.9 83.3 102.2
20.1 23.3 12.7 25.5 15.9 24.5
26.2 32.0 35.7 21.3 22.3 26.8
44.0 52.7 -17.7 33.9 19.7 35.6
114.1 146.1 -7.6 70.0 28.0 30.0
2.8
7.3 -85.8 87.8 164.5 101.3
32.9 41.1 -22.2 7.7 24.7 16.5
7.9
11.0 -12.4 25.2 38.7 14.6
42.6 48.5 11.5 11.2 13.7 63.6
29.2 37.3 33.2 36.6 27.7 33.2
62.6 72.5 23.3 37.3 15.9 18.5
27.3 34.3 -10.9 72.1 25.8 30.3
40.2 54.1 -45.2 29.5 34.6 24.3
161.8 186.9 9.8 14.2 15.5 34.5
24.3 30.6 -5.0 82.4 25.9 33.8
40.8 55.7 -56.2 188.8 36.7 36.3
21.5 27.7 -49.6 63.3 28.8 36.0
61.3 78.5 -12.9 27.6 28.0 28.4
-20.0 34.8 25.7 28.6
7.0
26.0
14.0
16.0
8.3
26.5
18.2
17.4
LP 238.0 18.1
17.5 9.0
1.9
41.2 -17.3 30.2
27.1 14.9 8.6
129.7
10.8
18.1
27.6
18.4
15.5
39.9
26.8
34.9
Buy
Neutral
Buy
Buy
268
257
305
384
290
290
375
460
8
13
23
20
2.1
23.9
16.9
13.9
Buy
Buy
Buy
127 198
1399 1553
167 231
56
11
38
8.2
35.1
6.2
11.4
53.4
10.6
13.2
64.6
12.9
-16.5
12.5
-8.3
4.6
PL
-10.4
Loss
-37.2
Loss
-7.5
78.9
-5.3
29.9
29.9
38.6
52.1
69.8
50.8
LP
25.8
LP
113.8
LP
0.1
-20.8
30.5
62.3
42.4
16.3
21.0
21.8
20.3
109.9
20.1
5,545
86.9
161.9
10.2
10.4
21.5
31.4
34.7
Buy
Buy
Neutral
Buy
Buy
Neutral
Neutral
Buy
Buy
Buy
71
278
100
674
31
215
81
166
360
1413
101
420
90
820
47
237
92
215
469
1760
43
51
-10
22
53
10
14
30
30
25
-0.3
18.3
-2.9
7.2
-0.2
23.9
13.2
10.1
8.3
26.7
1.6
23.0
0.1
15.3
0.8
23.9
10.5
13.1
13.5
38.0
3.4
27.6
4.0
28.7
2.0
26.3
11.5
16.0
17.8
51.2
NM
44.1 16.9 12.2 -7.8 32.1
15.2 12.1 2.8 2.3 19.6 21.0
NM 1,411.1 2.3 2.3 -6.3 0.2
94.0 44.0 3.6 3.4 3.9 7.9
NM
40.5 2.2 2.1 -1.2 5.2
9.0
9.0
1.2 1.1 14.0 12.4
6.1
7.7
0.7 0.7 12.8 9.1
16.5 12.6 2.6 2.3 14.9 18.5
43.1 26.6 3.4 3.1 8.3 12.2
53.0 37.2 6.1 5.3 12.2 15.3
15 May 2018
29

Click excel icon
for detailed
valuation guide
CMP
(INR)
88
16
964
578
TP % Upside
EPS (INR)
(INR) Downside FY18E FY19E FY20E
130
47
2.5
5.8
7.9
27
64
-0.9
0.1
0.6
1200
24
27.7 35.0 40.6
690
19
14.5 16.5 19.7
Valuation snapshot
Company
Prime Focus
Siti Net.
Sun TV
Zee Ent.
Aggregate
Metals
Hindalco
Hind. Zinc
JSPL
JSW Steel
Nalco
NMDC
SAIL
Rain Industries
Vedanta
Tata Steel
Aggregate
Oil & Gas
Aegis Logistics
BPCL
GAIL
Gujarat Gas
Gujarat St. Pet.
HPCL
IOC
IGL
Mahanagar Gas
MRPL
Oil India
ONGC
PLNG
Reliance Ind.
Aggregate
Retail
Jubilant Food
PC Jeweller
Titan Co.
Aggregate
Technology
Cyient
HCL Tech.
Hexaware
Infosys
KPIT Tech
L&T Infotech
Mindtree
Mphasis
NIIT Tech
Persistent Sys
Tata Elxsi
TCS
Tech Mah
Wipro
Zensar Tech
Aggregate
Reco
Buy
Neutral
Buy
Buy
EPS Gr. YoY (%)
P/E (x)
P/B (x)
ROE (%)
FY18E FY19E FY20E FY18E FY19E FY18E FY19E FY18E FY19E
100.6 137.5 36.4 36.0 15.1 3.7 2.3 11.6 18.9
Loss LP 411.6 NM 130.2 3.2 3.1 -15.8 2.4
11.6 26.2 15.9 34.8 27.5 8.2 7.5 25.2 28.4
8.4 14.1 19.0 39.8 34.9 7.3 6.3 19.6 19.4
15.7 33.8 27.9 35.9 26.8 5.1 4.5 14.3 16.8
12.7
14.1
NM
15.3
17.3
8.4
NM
10.6
13.3
10.5
14.2
43.3
10.1
16.4
41.8
14.0
8.1
8.2
28.7
15.6
9.1
12.9
11.2
15.3
16.2
11.6
82.0
11.5
73.1
56.7
21.5
14.8
25.9
18.4
20.5
24.7
28.9
22.4
23.4
19.7
29.9
26.0
16.7
14.4
22.8
20.8
9.3
11.1
40.6
13.7
7.6
8.2
16.8
7.1
10.0
8.8
10.4
28.5
9.8
15.1
26.5
13.3
9.9
9.6
24.4
16.2
9.3
8.7
8.6
13.4
14.1
10.6
59.0
9.1
55.5
43.4
19.5
13.8
22.7
17.0
19.0
22.4
22.8
18.1
19.2
16.9
25.7
22.8
15.7
14.2
17.9
19.7
1.6
3.5
0.8
2.9
1.5
1.5
0.8
2.1
1.8
1.5
1.6
11.9
2.3
1.9
6.6
2.0
2.2
1.5
5.5
4.2
1.6
0.9
1.1
3.3
2.0
1.5
1.4
2.9
0.8
2.4
1.3
1.3
0.8
1.7
1.6
1.3
1.5
9.0
2.0
1.7
5.5
1.8
1.9
1.3
4.7
3.8
1.4
0.9
1.0
2.8
1.7
1.4
13.7
26.7
-2.7
20.9
8.4
18.2
-1.0
22.9
13.3
16.0
11.6
30.7
24.1
11.9
16.7
15.0
28.2
18.5
20.7
28.0
18.9
7.4
9.6
23.7
13.0
13.2
16.3
28.6
2.1
19.4
18.3
17.2
4.8
26.3
17.1
16.2
14.2
35.9
21.6
12.0
22.7
14.0
20.6
14.4
20.8
24.4
16.1
10.5
12.0
22.9
13.2
13.1
Buy
Neutral
Buy
Buy
Buy
Buy
Sell
Buy
Buy
Neutral
242
297
260
329
75
115
73
250
282
610
370
336
349
334
120
215
71
426
345
778
53
13
34
2
59
87
-2
70
22
28
19.0
21.1
-8.5
21.5
4.3
13.6
-0.9
23.7
21.3
58.2
26.1
26.8
6.4
24.0
9.9
14.0
4.3
35.2
28.3
69.4
29.2 122.3 37.0 12.0
30.6 7.2 26.8 14.2
10.4 Loss LP 62.3
23.7 45.3 11.5 -1.0
10.2 16.8 128.2 3.2
14.7 37.0 2.9
4.7
6.5 Loss LP 50.2
39.8 238.1 48.5 13.2
35.3 40.7 33.0 24.7
61.4 53.4 19.1 -11.5
67.8 36.0 10.8
12.3
46.5
24.6
41.6
13.9
37.8
21.7
12.5
54.6
12.4
28.1
23.5
18.8
74.9
74.2
-17.3
23.9
32.0
43.8
-2.9
-1.2
6.9
27.0
-20.7
-18.3
2.3
23.0
20.7
5.4
52.1
2.9
8.8
58.1
4.9
-17.8
-15.0
17.7
-3.6
-2.5
48.1
29.6
14.3
15.0
9.7
28.5
13.0
7.7
24.2
4.5
16.5
23.1
13.2
1.2
8.3
3.3
8.2
17.9
6.8
10.7
31.4
27.6
25.9
27.0
11.8
8.0
11.0
10.8
29.2
17.9
23.9
9.6
19.4
21.7
18.6
10.9
16.4
13.0
27.2
10.9
Buy
Buy
Sell
Buy
Neutral
Buy
Buy
Buy
Buy
Neutral
Buy
Buy
Buy
Buy
272 303
403 554
344 285
885 1122
177 191
320 536
169 261
270 416
874 1228
106 119
236 260
187 222
214 317
985 1150
12
37
-17
27
8
67
55
54
40
12
10
18
48
17
6.3
40.0
21.0
21.2
12.7
39.5
20.7
9.4
55.9
11.7
18.3
16.8
14.0
60.9
9.5
41.2
22.9
33.5
13.3
32.5
17.6
11.1
53.9
11.4
27.2
21.8
16.0
70.1
Neutral
Buy
Buy
2438 2450
178 520
921 1150
0
192
25
29.7
15.4
12.6
41.4
19.5
16.6
54.4 180.6 39.1
24.9 44.4 26.6
20.9 39.5 31.7
48.8 30.8
16.6 14.3 20.3 24.3
1.8 1.6 16.9 18.4
16.1 14.4 23.9 27.4
11.0 9.7 19.4 22.3
3.9
3.5
6.5
4.2
2.9
7.1
6.0
3.5
3.7
3.1
10.0
8.0
3.4
2.5
3.3
5.1
3.5
3.2
5.6
3.7
2.5
5.7
5.2
3.2
3.3
3.0
7.9
6.9
2.9
2.1
2.9
4.6
18.1
25.0
26.9
24.1
14.9
32.4
18.8
14.6
16.2
16.7
37.6
30.3
20.9
17.0
15.3
24.6
18.1
24.0
26.4
22.9
14.0
28.4
24.3
18.3
18.2
18.7
34.3
32.5
20.1
16.4
17.1
23.2
Neutral
Neutral
Sell
Buy
Neutral
Buy
Buy
Neutral
Neutral
Buy
Buy
Neutral
Buy
Neutral
Buy
822
926
429
1190
257
1638
993
985
1068
797
1157
3437
666
272
1200
800
1050
390
1330
250
1400
1000
960
1100
860
1400
3000
700
300
1400
-3
13
-9
12
-3
-15
1
-3
3
8
21
-13
5
10
17
38.2
62.6
16.6
64.8
12.5
66.3
34.4
44.0
45.6
40.4
38.7
132.1
39.8
18.9
52.8
42.2 47.1 24.8 10.3
66.9 72.2 4.5 6.9
18.9 21.0 21.2 14.2
70.1 77.7 3.1 8.3
13.5 17.5 5.1 7.8
73.3 86.3 19.5 10.5
43.5 53.9 38.0 26.7
54.6 59.8 13.2 23.9
55.7 66.6 19.8 22.3
47.0 57.2 7.2 16.4
45.0 53.4 37.7 16.2
150.5 166.9 -1.0 13.9
42.3 49.3 28.8 6.4
19.2 21.7 11.8 1.3
67.0 85.2 1.3 27.0
4.9 5.6
15 May 2018
30

Click excel icon
for detailed
valuation guide
Valuation snapshot
Company
Telecom
Bharti Airtel
Bharti Infratel
Idea Cellular
Tata Comm
Aggregate
Utiltites
Coal India
CESC
JSW Energy
NHPC
NTPC
Power Grid
Tata Power
Aggregate
Others
Arvind
Avenue Supermarts
BSE
Castrol India
Coromandel Intl
Delta Corp
Interglobe
Indo Count
Info Edge
Kaveri Seed
Manpasand
MCX
Navneet Education
Oberoi Realty
Phoenix Mills
Quess Corp
PI Inds.
Piramal Enterp.
SRF
S H Kelkar
Tata Chemicals
Team Lease Serv.
Trident
TTK Prestige
UPL
V-Guard
Reco
Buy
Neutral
Buy
Buy
CMP TP % Upside
EPS (INR)
EPS Gr. YoY (%)
P/E (x)
P/B (x)
ROE (%)
(INR) (INR) Downside FY18E FY19E FY20E FY18E FY19E FY20E FY18E FY19E FY18E FY19E FY18E FY19E
382
316
52
635
581
346
85
730
52
9
64
15
4.1
13.6
-9.6
3.5
1.9
13.7
-12.3
7.5
5.6 -63.3 -53.8 197.1 93.6
14.2 -8.1 0.4
3.6
23.2
-10.5 Loss Loss Loss
NM
21.1 -67.2 115.3 182.9 183.2
-98.8 PL
LP 3,037.6
16.5
9.5
16.1
7.0
9.3
6.0
22.7
11.1
36.5
32.0
20.9
4.0
18.4
41.4
34.1
16.6
27.1
17.0
34.6
16.6
17.6
-3.4
30.9
26.6
16.2
27.1
31.7
26.6
14.3
47.9
18.7
15.4
19.2
12.1
15.2
12.3
22.6
11.1
13.2
12.3
15.2
13.5
35.0
110.2
18.8
25.7
19.7
38.3
20.4
12.5
51.7
14.7
45.1
36.7
18.3
40.7
41.2
51.3
28.7
29.3
28.7
31.8
23.0
63.6
11.5
44.0
16.5
52.9
202.8 2.2 2.2 2.4 1.1
23.1 3.4 3.6 15.6 15.2
NM
0.8 1.0 -16.0 -21.9
85.1 36.2 25.4 9.4 35.1
-134 2.2 2.3 0.1 -1.7
10.2
10.3
16.4
9.1
11.3
10.1
12.8
10.4
28.8
83.6
17.2
26.4
19.0
30.8
16.9
10.7
46.0
12.4
28.5
26.9
14.4
10.9
32.1
34.3
22.6
20.9
21.2
26.0
17.6
46.2
8.7
34.4
15.6
39.8
7.2
1.2
1.0
1.0
1.4
1.9
1.4
2.0
6.7
1.1
1.0
0.9
1.3
1.7
1.1
1.8
47.4
10.3
4.6
8.6
10.6
16.6
10.7
14.7
65.8
11.1
6.1
10.3
11.6
17.7
9.7
17.5
Buy
Buy
Sell
Buy
Buy
Buy
Sell
270
1049
68
27
172
209
81
397
1440
61
36
214
287
77
47
37
-11
32
25
37
-5
17.8 26.4 30.8 19.2 48.4
85.6 102.0 111.7 65.0 19.2
3.0
4.2
4.8 -21.2 37.9
2.4
3.0
3.2 -17.2 22.2
13.0 15.2 16.6 5.0 16.9
16.9 20.7 21.9 21.3 22.1
5.3
6.3
7.8
3.5 18.7
11.7 29.0
12.2
12.9
43.5
7.0
22.7
5.8
58.3
6.3
23.4
34.2
8.8
21.2
7.7
13.5
15.8
22.8
29.9
83.1
77.4
7.9
33.7
43.3
5.3
137.8
44.2
4.5
14.8 20.3 -1.4 21.6
17.0 22.5 68.4 31.9
47.4 57.2 6.0 9.0
6.8
7.1
2.9 -2.8
23.5 27.9 38.8 3.7
7.2
10.2 89.8 24.5
70.2 94.1 35.1 20.4
7.4
8.7 -46.0 17.1
26.3 33.4 49.0 12.5
40.6 47.4 79.5 18.5
13.9 18.7 38.2 58.4
28.9 33.7 -14.6 36.5
9.8
11.5 4.7 27.4
50.3 48.6 21.4 271.7
20.3 26.6 44.2 28.4
34.1 43.1 130.7 49.6
38.1 44.2 -10.5 27.3
116.4 147.9 14.5 40.0
105.0 138.3 -9.9 35.6
9.7
12.2 9.1 22.4
44.0 50.3 0.0 30.5
59.6 88.1 11.6 37.5
7.0
8.3 -21.8 32.7
176.1 203.2 4.4 27.8
46.7 55.6 5.9 5.6
6.0
6.7 25.3 32.9
Neutral
Sell
Buy
Buy
Buy
Buy
Neutral
Neutral
Buy
Buy
Buy
Buy
Buy
Buy
Buy
Buy
Buy
Buy
Buy
Buy
Buy
Buy
Buy
Neutral
Buy
Neutral
427
1424
817
180
446
222
1188
79
1208
504
396
778
140
551
652
1169
859
2437
2221
252
773
2754
61
6067
728
237
460
900
1000
248
557
327
1318
95
1550
664
467
1050
195
654
737
1300
1061
3500
2351
318
940
2700
83
5281
945
167
8
-37
22
38
25
47
11
20
28
32
18
35
39
19
13
11
24
44
6
26
22
-2
37
-13
30
-30
2.9 2.7 8.6 9.8
19.0 16.4 18.9 21.1
1.4 1.2 7.6 6.8
17.4 16.3 69.1 63.8
4.2 3.7 22.1 20.6
3.7 3.4 12.3 11.5
6.5 6.1 41.3 37.0
1.6 1.4 13.9 14.1
6.8 6.1 13.7 14.0
3.6 3.2 23.4 27.1
3.7 3.4 7.2 12.3
2.9 2.7 7.9 10.4
4.2 3.6 24.2 26.9
3.1 2.5 7.8 25.1
3.5 2.8 9.6 9.6
6.5 5.2 22.3 21.7
6.1 5.0 23.0 24.3
2.2 2.0 8.9 10.2
3.7 3.2 13.3 16.3
4.1 3.7 13.4 14.9
2.1 2.0 11.3 11.5
10.3 8.5 17.7 20.1
1.0 1.0 9.2 11.4
7.5 6.7 18.0 20.7
4.0 3.3 26.9 23.3
12.9 10.3 26.9 28.8
15 May 2018
31

MOSL Universe stock performance
Company
Automobiles
Amara Raja
Ashok Ley.
Bajaj Auto
Bharat Forge
Bosch
CEAT
Eicher Mot.
Endurance Tech.
Escorts
Exide Ind
Hero Moto
M&M
Mahindra CIE
Maruti Suzuki
Motherson Sumi
Tata Motors
TVS Motor
Banks - Private
Axis Bank
DCB Bank
Equitas Hold.
Federal Bank
HDFC Bank
ICICI Bank
IDFC Bank
IndusInd
J&K Bank
Kotak Mah. Bk
RBL Bank
South Indian
Yes Bank
Banks - PSU
BOB
BOI
Canara
Indian Bk
PNB
SBI
Union Bk
NBFCs
Aditya Birla Cap
Bajaj Fin.
Capital First
Cholaman.Inv.&Fn
Dewan Hsg.
GRUH Fin.
HDFC
HDFC Stand. Life
Indiabulls Hsg
L&T Fin.Holdings
LIC Hsg Fin
M&M Fin.
Muthoot Fin
1 Day (%)
0.0
-4.2
0.6
1.1
-2.2
-0.7
-1.3
1.1
-0.4
-1.1
0.9
-2.2
0.1
-0.3
-0.7
-2.0
-0.8
-0.2
-1.0
0.3
-0.4
0.5
-0.4
-3.6
1.1
0.7
0.3
-0.5
3.5
-1.5
0.2
-0.6
1.4
-1.4
0.8
1.0
-0.2
-1.3
0.1
-2.6
-1.2
-0.1
-0.6
0.5
3.4
-2.0
0.3
0.0
-1.8
-1.1
1M (%)
6.5
3.7
1.6
-0.1
-7.1
-10.3
-2.8
-11.6
-0.5
7.4
-2.1
7.9
12.4
-4.6
-0.5
-9.1
-6.4
1.9
5.4
9.7
-9.1
4.8
7.5
-13.7
3.0
-9.5
10.5
2.8
5.4
11.4
-5.2
-10.7
-11.8
-2.3
-11.7
0.9
-10.7
-5.7
-3.0
-11.2
0.4
14.4
12.6
4.9
8.3
-9.3
7.6
-10.0
-0.6
0.2
12M (%)
-6.6
81.2
-5.5
31.3
-22.5
-12.1
4.5
46.6
45.7
5.7
3.2
24.5
-0.4
29.5
22.2
-24.7
20.1
9.9
-0.7
2.5
-21.9
30.5
14.9
-34.3
35.5
-35.6
33.1
-7.3
2.5
16.1
-23.5
-44.4
-31.8
-11.3
-47.1
-14.7
-49.6
Company
MAS Financial Serv.
PNB Housing
Repco Home
Shriram City Union
Shriram Trans.
Capital Goods
ABB
Bharat Elec.
BHEL
Blue Star
CG Cons. Elec.
CG Power & Inds Sol.
Cummins
Engineers India
GE T&D
Havells
K E C Intl
L&T
Siemens
Solar Ind
Thermax
Va Tech Wab.
Voltas
Cement
Ambuja Cem.
ACC
Birla Corp.
Dalmia Bharat
Grasim Inds.
India Cem
JK Lakshmi Ce
Ramco Cem
Orient Cem
Prism Johnson
Sagar Cements
Sanghi Inds.
Shree Cem
Ultratech
Consumer
Asian Paints
Britannia
Colgate
Dabur
Emami
Future Consumer
Godrej Cons.
GSK Cons.
HUL
ITC
Jyothy Lab
Marico
Nestle
Page Inds
Pidilite Ind.
1 Day (%)
-1.6
-2.2
0.9
-1.7
-2.8
-0.2
-1.9
-3.7
-2.2
0.4
1.0
-1.5
-1.0
-1.6
-0.6
1.8
-0.5
-1.6
0.0
0.6
-3.2
-3.3
0.1
-1.6
-3.1
-1.8
0.0
-0.8
-0.9
-0.8
-0.8
-1.4
0.3
-0.5
-0.7
0.8
0.7
-0.4
0.1
1.0
0.2
-1.9
0.3
-0.8
-0.1
0.2
3.0
0.6
0.7
-0.1
-0.3
1M (%)
0.7
-3.6
-3.7
2.4
-9.8
-2.1
-11.9
-11.8
-1.8
1.1
-0.9
4.2
-4.7
3.5
-0.5
-0.2
1.8
-5.4
-0.3
4.9
-9.2
-6.6
-8.3
-5.9
-7.5
-3.3
3.5
-7.2
-9.3
-0.3
-13.8
-5.1
4.4
-15.8
-4.8
5.5
11.7
4.9
0.9
8.6
-5.6
-5.0
0.7
-1.9
6.8
9.1
1.0
-1.3
10.1
-4.4
7.5
12M (%)
-4.4
-21.1
4.7
46.0
-19.3
-23.0
-31.8
15.1
-1.0
-13.1
-27.4
-8.2
5.3
6.1
75.7
19.0
-26.7
32.0
15.3
-29.6
37.2
-15.8
-13.7
-8.6
8.9
14.6
-35.2
-23.4
16.8
-23.6
-11.9
16.6
21.8
-18.2
-7.0
14.7
47.8
9.2
32.0
-3.8
74.9
13.4
11.2
53.6
3.7
2.3
-0.2
40.4
60.6
46.7
41.5
-24.5
47.4
46.2
65.1
24.6
15.6
36.2
-26.7
49.0
10.6
15 May 2018
32

MOSL Universe stock performance
Company
P&G Hygiene
Prabhat Dairy
United Brew
United Spirits
Healthcare
Alembic Phar
Alkem Lab
Ajanta Pharma
Aurobindo
Biocon
Cadila
Cipla
Divis Lab
Dr Reddy’s
Fortis Health
Glenmark
Granules
GSK Pharma
IPCA Labs
Jubilant Life
Lupin
Laurus Labs
Sanofi India
Shilpa Medicare
Strides Shasun
Sun Pharma
Torrent Pharma
Infrastructure
Ashoka Buildcon
IRB Infra.Devl.
KNR Construct.
Sadbhav Engg.
Logistics
Allcargo Logistics
Concor
Gateway Distriparks
Media
Dish TV
D B Corp
Den Net.
Ent.Network
Hathway Cab.
Hind. Media
HT Media
Jagran Prak.
Music Broadcast
PVR
Prime Focus
Siti Net.
Sun TV
Zee Ent.
Metals
Hindalco
Hind. Zinc
JSPL
1 Day (%)
-3.0
5.2
-1.0
-1.4
-1.0
-1.1
0.5
0.3
0.5
-0.1
0.6
-2.3
1.2
0.2
-2.5
-1.1
1.0
-1.6
-2.2
0.3
-1.6
-1.1
-2.3
-3.5
0.5
0.1
-0.9
-0.7
-1.0
2.9
-1.1
-0.6
-0.4
-1.7
0.1
-2.0
0.3
-3.9
-1.4
-2.4
-0.2
-1.5
-0.1
-1.1
-0.9
11.5
-2.6
-0.3
-0.6
1.6
1M (%)
-8.2
0.5
6.2
-8.2
-4.8
10.9
-22.0
-1.4
1.5
0.4
4.0
2.4
-3.4
-2.1
-13.5
-13.6
4.1
-3.5
4.6
-3.5
-4.0
-3.7
-5.5
-20.2
-7.6
2.9
1.1
-5.5
2.1
-4.2
-16.8
7.3
-5.7
-10.7
-11.4
-4.3
-2.9
-21.0
0.9
-4.4
-1.5
-6.6
7.4
-2.9
1.5
9.6
0.7
1.7
-5.5
3.5
12M (%)
12.0
49.4
32.7
47.0
-19.5
4.6
-33.8
-1.9
93.9
-19.4
1.8
87.0
-22.0
-28.6
-33.7
-35.3
0.7
29.1
8.8
-39.9
-13.7
16.4
-35.0
-49.4
-27.5
4.9
27.2
0.5
48.7
15.8
-31.0
18.2
-33.9
-27.8
-24.5
0.9
-13.9
-22.6
-23.4
-3.4
-14.2
5.2
-7.3
-18.6
-48.9
9.0
9.7
26.6
16.6
131.9
Company
JSW Steel
Nalco
NMDC
Rain Industries
SAIL
Vedanta
Tata Steel
Oil & Gas
Aegis Logistics
BPCL
GAIL
Gujarat Gas
Gujarat St. Pet.
HPCL
IOC
IGL
Mahanagar Gas
MRPL
Oil India
ONGC
PLNG
Reliance Ind.
Retail
Jubilant Food
PC Jeweller
Titan Co.
Technology
Cyient
HCL Tech.
Hexaware
Infosys
KPIT Tech
L&T Infotech
Mindtree
Mphasis
NIIT Tech
Persistent Sys
Tata Elxsi
TCS
Tech Mah
Wipro
Zensar Tech
Telecom
Bharti Airtel
Bharti Infratel
Idea Cellular
Tata Comm
Utiltites
Coal India
CESC
JSW Energy
NHPC Ltd
NTPC
Power Grid
Tata Power
1 Day (%)
1.6
-3.1
-1.2
-8.9
-1.0
-1.6
0.6
-2.5
0.9
0.5
5.1
-1.6
0.7
-0.4
1.1
0.4
0.1
0.5
0.1
-0.4
-0.4
-1.6
-11.6
-3.7
-6.5
-0.7
-2.9
0.7
-0.8
1.2
-1.5
0.1
1.1
-0.7
-2.3
-0.7
0.0
-0.1
-3.0
-1.1
-1.4
0.6
-0.2
-0.3
-0.9
-2.8
-1.4
2.5
0.9
0.0
1M (%)
6.6
-2.0
-7.3
-28.8
-5.0
-3.3
2.5
-3.5
-0.6
5.4
3.5
-4.3
-4.0
2.1
-8.5
-4.6
-3.1
7.7
2.7
-9.3
4.9
-2.1
-41.4
-6.5
27.1
-6.6
4.4
1.8
12.5
17.5
16.4
8.7
16.9
15.8
7.8
9.1
-0.5
-7.4
17.5
1.0
-7.0
-28.3
0.0
-5.5
1.8
-14.9
-0.7
0.4
5.8
-6.9
12M (%)
66.7
13.6
-8.8
139.0
20.4
19.4
48.2
41.4
-17.2
12.3
14.9
2.5
-10.0
-22.3
35.2
-11.1
-17.6
11.2
1.5
-1.7
45.8
147.4
-20.9
86.2
55.5
9.2
72.2
23.4
100.5
117.0
94.5
71.6
102.8
36.0
49.3
45.7
50.6
7.1
34.0
4.5
-15.6
-43.9
-5.5
-2.4
7.3
2.2
-11.7
8.2
1.4
-0.8
15 May 2018
33

MOSL Universe stock performance
Company
Others
Arvind
Avenue Super.
BSE
Castrol India
Coromandel Intl
Delta Corp
Interglobe
Indo Count
Info Edge
Kaveri Seed
Manpasand
MCX
Navneet Educat.
Oberoi Realty
Phoenix Mills
PI Inds.
Piramal Enterp.
Quess Corp
SRF
S H Kelkar
Tata Chemicals
Team Lease Serv.
Trident
UPL
V-Guard
1 Day (%)
-0.4
-2.1
-0.1
0.8
-0.8
-4.6
2.3
-2.5
-2.5
1.5
-1.5
1.8
-0.9
4.1
6.8
-1.1
0.0
-2.0
-1.2
0.9
-0.3
-3.2
-3.0
-0.9
-1.1
1M (%)
4.0
-3.0
-2.5
-12.6
-15.7
-17.1
-18.7
-17.4
-3.1
-5.9
-3.3
2.4
-9.7
8.5
12.4
1.2
-5.1
12.3
6.5
-0.2
6.6
24.7
-16.5
-2.8
0.1
12M (%)
7.9
89.5
-16.8
-17.7
11.9
31.8
8.7
-59.9
45.0
-7.5
7.1
-29.6
-15.7
39.8
55.6
2.7
-6.0
40.4
25.7
-19.0
23.0
144.8
-29.8
-11.7
14.8
15 May 2018
34

THEMATIC/STRATEGY RESEARCH GALLERY

REPORT GALLERY
RECENT INITIATING COVERAGE REPORTS
.
Rs

DIFFERENTIATED PRODUCT GALLERY

Explanation of Investment Rating
Investment Rating
BUY
SELL
NEUTRAL
UNDER REVIEW
NOT RATED
Expected return (over 12-month)
>=15%
< - 10%
> - 10 % to 15%
Rating may undergo a change
We have forward looking estimates for the stock but we refrain from assigning recommendation
*In case the recommendation given by the Research Analyst becomes inconsistent with the investment rating legend, the Research Analyst shall within 28 days of the inconsistency, take appropriate measures to make the recommendation consistent with the investment rating legend.
Disclosures:
The following Disclosures are being made in compliance with the SEBI Research Analyst Regulations 2014 (herein after referred to as the Regulations).
Motilal Oswal Securities Ltd. (MOSL) is a SEBI Registered Research Analyst having registration no. INH000000412. MOSL, the Research Entity (RE) as defined in the Regulations, is engaged in the business of providing Stock broking services,
Investment Advisory Services, Depository participant services & distribution of various financial products. MOSL is a subsidiary company of Motilal Oswal Financial Service Ltd. (MOFSL). MOFSL is a listed public company, the details in respect of
which are available on www.motilaloswal.com. MOSL is registered with the Securities & Exchange Board of India (SEBI) and is a registered Trading Member with National Stock Exchange of India Ltd. (NSE) and Bombay Stock Exchange Limited
(BSE), Multi Commodity Exchange of India Limited(MCX) and National Commodity & Derivatives Exchange Limited(NCDEX) for its stock broking activities & is Depository participant with Central Depository Services Limited (CDSL) & National
Securities Depository Limited (NSDL) and is member of Association of Mutual Funds of India (AMFI) for distribution of financial products and Insurance Regulatory & Development Authority of India (IRDA) as Corporate Agent for insurance products
.Details of associate entities of Motilal Oswal Securities Limited are available on the website at http://onlinereports.motilaloswal.com/Dormant/documents/Associate%20Details.pdf
MOSL, it’s associates, Research Analyst or their relative may have any financial interest in the subject company. MOSL and/or its associates and/or Research Analyst may have beneficial ownership of 1% or more securities in the subject company at
the end of the month immediately preceding the date of publication of the Research Report. MOSL and its associate company(ies), their directors and Research Analyst and their relatives may; (a) from time to time, have a long or short position in, act
as principal in, and buy or sell the securities or derivatives thereof of companies mentioned herein. (b) be engaged in any other transaction involving such securities and earn brokerage or other compensation or act as a market maker in the financial
instruments of the company(ies) discussed herein or act as an advisor or lender/borrower to such company(ies) or may have any other potential conflict of interests with respect to any recommendation and other related information and opinions.;
however the same shall have no bearing whatsoever on the specific recommendations made by the analyst(s), as the recommendations made by the analyst(s) are completely independent of the views of the associates of MOSL even though there
might exist an inherent conflict of interest in some of the stocks mentioned in the research report. Research Analyst may have served as director/officer, etc. in the subject company in the last 12 month period. MOSL and/or its associates may have
received any compensation from the subject company in the past 12 months.
In the last 12 months period ending on the last day of the month immediately preceding the date of publication of this research report, MOSL or any of its associates may have:
a)
managed or co-managed public offering of securities from subject company of this research report,
b)
received compensation for investment banking or merchant banking or brokerage services from subject company of this research report,
c)
received compensation for products or services other than investment banking or merchant banking or brokerage services from the subject company of this research report.
d)
Subject Company may have been a client of MOSL or its associates during twelve months preceding the date of distribution of the research report.
MOSL and it’s associates have not received any compensation or other benefits from the subject company or third party in connection with the research report. To enhance transparency, MOSL has incorporated a Disclosure of Interest Statement in
this document. This should, however, not be treated as endorsement of the views expressed in the report. MOSL and / or its affiliates do and seek to do business including investment banking with companies covered in its research reports. As a result,
the recipients of this report should be aware that MOSL may have a potential conflict of interest that may affect the objectivity of this report. Compensation of Research Analysts is not based on any specific merchant banking, investment banking or
brokerage service transactions.
Terms & Conditions:
This report has been prepared by MOSL and is meant for sole use by the recipient and not for circulation. The report and information contained herein is strictly confidential and may not be altered in any way, transmitted to, copied or distributed, in part
or in whole, to any other person or to the media or reproduced in any form, without prior written consent of MOSL. The report is based on the facts, figures and information that are considered true, correct, reliable and accurate. The intent of this report
is not recommendatory in nature. The information is obtained from publicly available media or other sources believed to be reliable. Such information has not been independently verified and no guaranty, representation of warranty, express or implied,
is made as to its accuracy, completeness or correctness. All such information and opinions are subject to change without notice. The report is prepared solely for informational purpose and does not constitute an offer document or solicitation of offer to
buy or sell or subscribe for securities or other financial instruments for the clients. Though disseminated to all the customers simultaneously, not all customers may receive this report at the same time. MOSL will not treat recipients as customers by
virtue of their receiving this report.
Analyst Certification
The views expressed in this research report accurately reflect the personal views of the analyst(s) about the subject securities or issues, and no part of the compensation of the research analyst(s) was, is, or will be directly or indirectly related to the
specific recommendations and views expressed by research analyst(s) in this report.
Disclosure of Interest Statement
Analyst ownership of the stock
Companies where there is interest
No
A graph of daily closing prices of securities is available at www.nseindia.com, www.bseindia.com. Research Analyst views on Subject Company may vary based on Fundamental research and Technical Research. Proprietary trading desk of MOSL or
its associates maintains arm’s length distance with Research Team as all the activities are segregated from MOSL research activity and therefore it can have an independent view with regards to subject company for which Research Team have
expressed their views.
Regional Disclosures (outside India)
This report is not directed or intended for distribution to or use by any person or entity resident in a state, country or any jurisdiction, where such distribution, publication, availability or use would be contrary to law, regulation or which would subject
MOSL & its group companies to registration or licensing requirements within such jurisdictions.
For Hong Kong:
This report is distributed in Hong Kong by Motilal Oswal capital Markets (Hong Kong) Private Limited, a licensed corporation (CE AYY-301) licensed and regulated by the Hong Kong Securities and Futures Commission (SFC) pursuant to the Securities
and Futures Ordinance (Chapter 571 of the Laws of Hong Kong) “SFO”. As per SEBI (Research Analyst Regulations) 2014 Motilal Oswal Securities (SEBI Reg No. INH000000412) has an agreement with Motilal Oswal capital Markets (Hong Kong)
Private Limited for distribution of research report in Hong Kong. This report is intended for distribution only to “Professional Investors” as defined in Part I of Schedule 1 to SFO. Any investment or investment activity to which this document relates is only
available to professional investor and will be engaged only with professional investors.” Nothing here is an offer or solicitation of these securities, products and services in any jurisdiction where their offer or sale is not qualified or exempt from
registration. The Indian Analyst(s) who compile this report is/are not located in Hong Kong & are not conducting Research Analysis in Hong Kong.
For U.S.
Motilal Oswal Securities Limited (MOSL) is not a registered broker - dealer under the U.S. Securities Exchange Act of 1934, as amended (the"1934 act") and under applicable state laws in the United States. In addition MOSL is not a registered
investment adviser under the U.S. Investment Advisers Act of 1940, as amended (the "Advisers Act" and together with the 1934 Act, the "Acts), and under applicable state laws in the United States. Accordingly, in the absence of specific exemption
under the Acts, any brokerage and investment services provided by MOSL, including the products and services described herein are not available to or intended for U.S. persons. This report is intended for distribution only to "Major Institutional
Investors" as defined by Rule 15a-6(b)(4) of the Exchange Act and interpretations thereof by SEC (henceforth referred to as "major institutional investors"). This document must not be acted on or relied on by persons who are not major institutional
investors. Any investment or investment activity to which this document relates is only available to major institutional investors and will be engaged in only with major institutional investors. In reliance on the exemption from registration provided by Rule
15a-6 of the U.S. Securities Exchange Act of 1934, as amended (the "Exchange Act") and interpretations thereof by the U.S. Securities and Exchange Commission ("SEC") in order to conduct business with Institutional Investors based in the U.S.,
MOSL has entered into a chaperoning agreement with a U.S. registered broker-dealer, Motilal Oswal Securities International Private Limited. ("MOSIPL"). Any business interaction pursuant to this report will have to be executed within the provisions of
this chaperoning agreement.
The Research Analysts contributing to the report may not be registered /qualified as research analyst with FINRA. Such research analyst may not be associated persons of the U.S. registered broker-dealer, MOSIPL, and therefore, may not be subject
to NASD rule 2711 and NYSE Rule 472 restrictions on communication with a subject company, public appearances and trading securities held by a research analyst account.
For Singapore
Motilal Oswal Capital Markets Singapore Pte Limited is acting as an exempt financial advisor under section 23(1)(f) of the Financial Advisers Act(FAA) read with regulation 17(1)(d) of the Financial Advisors Regulations and is a subsidiary of Motilal
Oswal Securities Limited in India. This research is distributed in Singapore by Motilal Oswal Capital Markets Singapore Pte Limited and it is only directed in Singapore to accredited investors, as defined in the Financial Advisers Regulations and the
Securities and Futures Act (Chapter 289), as amended from time to time. In respect of any matter arising from or in connection with the research you could contact the following representatives of Motilal Oswal Capital Markets Singapore Pte Limited:
Disclaimer:
The report and information contained herein is strictly confidential and meant solely for the selected recipient and may not be altered in any way, transmitted to, copied or distributed, in part or in whole, to any other person or to the media or reproduced
in any form, without prior written consent. This report and information herein is solely for informational purpose and may not be used or considered as an offer document or solicitation of offer to buy or sell or subscribe for securities or other financial
instruments. Nothing in this report constitutes investment, legal, accounting and tax advice or a representation that any investment or strategy is suitable or appropriate to your specific circumstances. The securities discussed and opinions expressed in
this report may not be suitable for all investors, who must make their own investment decisions, based on their own investment objectives, financial positions and needs of specific recipient. This may not be taken in substitution for the exercise of
independent judgment by any recipient. Each recipient of this document should make such investigations as it deems necessary to arrive at an independent evaluation of an investment in the securities of companies referred to in this document
(including the merits and risks involved), and should consult its own advisors to determine the merits and risks of such an investment. The investment discussed or views expressed may not be suitable for all investors. Certain transactions -including
those involving futures, options, another derivative products as well as non-investment grade securities - involve substantial risk and are not suitable for all investors. No representation or warranty, express or implied, is made as to the accuracy,
completeness or fairness of the information and opinions contained in this document. The Disclosures of Interest Statement incorporated in this document is provided solely to enhance the transparency and should not be treated as endorsement of the
views expressed in the report. This information is subject to change without any prior notice. The Company reserves the right to make modifications and alternations to this statement as may be required from time to time without any prior approval.
MOSL, its associates, their directors and the employees may from time to time, effect or have effected an own account transaction in, or deal as principal or agent in or for the securities mentioned in this document. They may perform or seek to perform
investment banking or other services for, or solicit investment banking or other business from, any company referred to in this report. Each of these entities functions as a separate, distinct and independent of each other. The recipient should take this
into account before interpreting the document. This report has been prepared on the basis of information that is already available in publicly accessible media or developed through analysis of MOSL. The views expressed are those of the analyst, and
the Company may or may not subscribe to all the views expressed therein. This document is being supplied to you solely for your information and may not be reproduced, redistributed or passed on, directly or indirectly, to any other person or
published, copied, in whole or in part, for any purpose. This report is not directed or intended for distribution to, or use by, any person or entity who is a citizen or resident of or located in any locality, state, country or other jurisdiction, where such
distribution, publication, availability or use would be contrary to law, regulation or which would subject MOSL to any registration or licensing requirement within such jurisdiction. The securities described herein may or may not be eligible for sale in all
jurisdictions or to certain category of investors. Persons in whose possession this document may come are required to inform themselves of and to observe such restriction. Neither the Firm, not its directors, employees, agents or representatives shall
be liable for any damages whether direct or indirect, incidental, special or consequential including lost revenue or lost profits that may arise from or in connection with the use of the information. The person accessing this information specifically agrees
to exempt MOSL or any of its affiliates or employees from, any and all responsibility/liability arising from such misuse and agrees not to hold MOSL or any of its affiliates or employees responsible for any such misuse and further agrees to hold MOSL
or any of its affiliates or employees free and harmless from all losses, costs, damages, expenses that may be suffered by the person accessing this information due to any errors and delays.
Registered Office Address: Motilal Oswal Tower, Rahimtullah Sayani Road, Opposite Parel ST Depot, Prabhadevi, Mumbai-400025; Tel No.: 022-3980 4263; www.motilaloswal.com. Correspondence Address: Palm Spring Centre, 2nd Floor, Palm
Court Complex, New Link Road, Malad (West), Mumbai- 400 064. Tel No: 022 3080 1000. Compliance Officer: Neeraj Agarwal, Email Id:
na@motilaloswal.com,
Contact No.:022-38281085.
Registration details of group entities.: MOSL: SEBI Registration: INZ000158836 (BSE/NSE/MCX/NCDEX); CDSL: IN-DP-16-2015; NSDL: IN-DP-NSDL-152-2000; Research Analyst: INH000000412. AMFI: ARN 17397. Investment Adviser:
INA000007100.IRDA Corporate Agent-CA0541. Motilal Oswal Asset Management Company Ltd. (MOAMC): PMS (Registration No.: INP000000670) offers PMS and Mutual Funds products. Motilal Oswal Wealth Management Ltd. (MOWML): PMS
(Registration No.: INP000004409) offers wealth management solutions. *Motilal Oswal Securities Ltd. is a distributor of Mutual Funds, PMS, Fixed Deposit, Bond, NCDs, Insurance and IPO products. * Motilal Oswal Commodities Broker Pvt. Ltd. offers
Commodities Products. * Motilal Oswal Real Estate Investment Advisors II Pvt. Ltd. offers Real Estate products. * Motilal Oswal Private Equity Investment Advisors Pvt. Ltd. offers Private Equity products
13 December 2016
36