18 May 2018
Market snapshot
Equities - India
Close
Chg .%
Sensex
35,149
-0.7
Nifty-50
10,683
-0.5
Nifty-M 100
19,153
0.4
Equities-Global
Close
Chg .%
S&P 500
2,720
-0.1
Nasdaq
7,382
-0.2
FTSE 100
7,788
0.7
DAX
13,115
0.9
Hang Seng
12,278
-1.3
Nikkei 225
22,838
0.5
Commodities
Close
Chg .%
Brent (US$/Bbl)
79
0.5
Gold ($/OZ)
1,291
0.0
Cu (US$/MT)
6,857
0.9
Almn (US$/MT)
2,303
-1.4
Currency
Close
Chg .%
USD/INR
67.7
-0.1
USD/EUR
1.2
-0.1
USD/JPY
110.8
0.3
YIELD (%)
Close
1MChg
10 Yrs G-Sec
7.9
-0.02
10 Yrs AAA Corp
8.6
-0.02
Flows (USD b)
17-May
MTD
FIIs
-0.1
-0.6
DIIs
0.1
1.1
Volumes (INRb)
17-May
MTD*
Cash
343
341
F&O
14,328
7,840
Note: YTD is calendar year, *Avg
YTD.%
3.2
1.4
-9.4
YTD.%
1.7
6.9
1.3
1.5
4.9
0.3
YTD.%
18.0
-0.9
-4.9
2.1
YTD.%
6.0
-1.7
-1.7
YTDchg
0.6
0.7
YTD
0.7
6.2
YTD*
371
8,013
Today’s top research idea
Eicher Motors: All set for next leg of growth
Driven by high-potential, under represented BIMARU states
We see high growth potential in key motorcycling markets like BIMARU (Bihar,
MP, Rajasthan and UP). These under-penetrated 2W markets offer higher
scope for aspirational products like RE. RE's market share in these states is
currently 3-4% (v/s 6% for pan-India).
Our state-wise demand model indicates 20% CAGR in domestic volumes over
FY18-20. However, considering capacity constraints we model ~16% volume
CAGR.
RE is focused on creating a mark in developing markets like LatAm and South
East Asia. We believe that export markets can be a meaningful contributor to
volumes in five years, but ramp-up would be back-ended.
We expect EPS to grow 30% CAGR over FY18-20E.
Buy
with TP of INR35,572
(FY20E).
Research covered
Cos/Sector
India Strategy
Eicher Motors
Bajaj Finance
Britannia Inds
Voltas
Muthoot Finance
Quess Corp
SRF
Escorts
TeamLease Services
Results Expectation
Key Highlights
Contrarian Investing: Consensus Upgrade Analysis
All set for next leg of growth…
Growth outlook positive, improving asset quality
Robust volume and margin outlook; Maintain Buy
Results impacted by below-expected UCP performance
PAT misses estimate as growth remains tepid
Robust growth in Staffing leads to revenue beat; In-line margins
Strong beat on all fronts
Healthy progress across segments, upgrade to Neutral
Margin story playing out better than expectations
AMRJ | AL | BJAUT | DBEL | STR | TMX
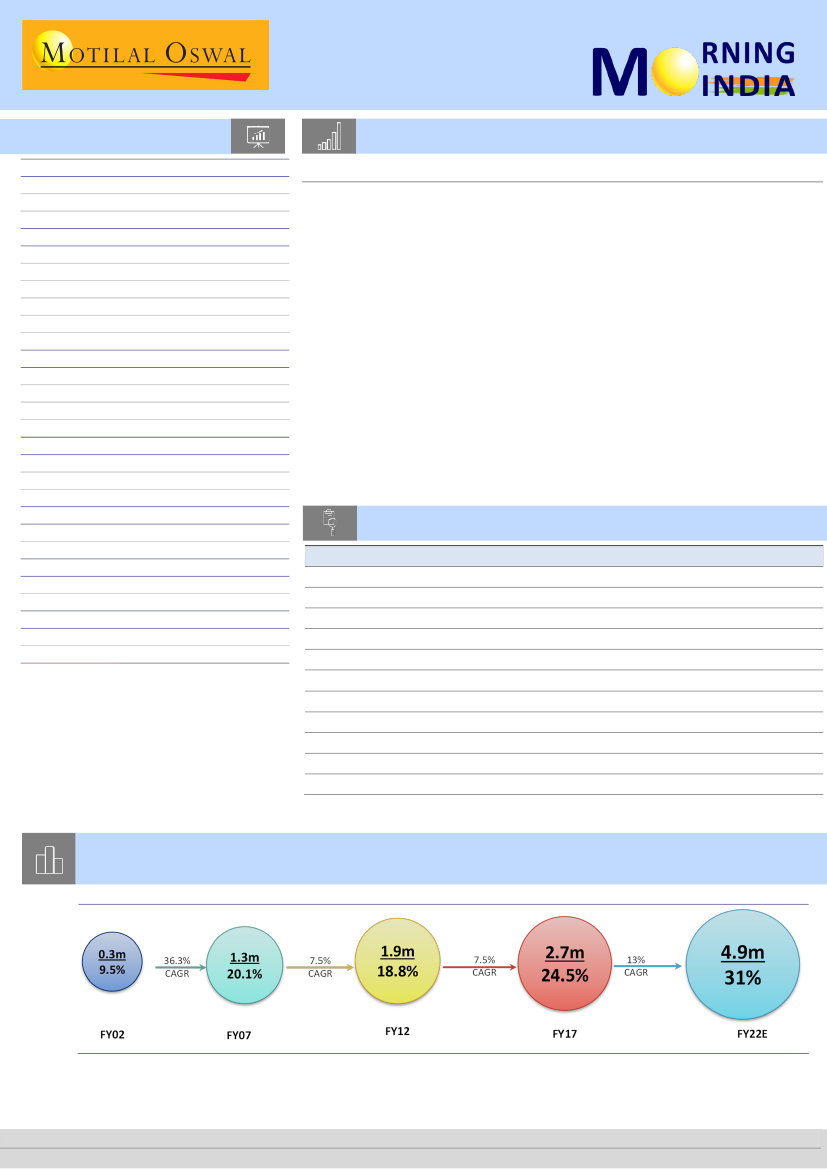
Chart of the Day: Eicher Motors – All set for next leg of growth; driven by high-potential,
under represented BIMARU states
Share of Premium (>150cc) motorcycles to expand to ~31% of motorcycles by FY22E
Note: % in circle represents share of premium segment in motorcycle
Source: MOSL
Research Team (Gautam.Duggad@MotilalOswal.com)
Motilal Oswal research is available on www.motilaloswal.com/Institutional-Equities, Bloomberg, Thomson Reuters, Factset and S&P Capital.
Investors are advised to refer through important disclosures made at the last page of the Research Report.

In the news today
Kindly click on textbox for the detailed news link
1
Oil hits $80, highest since Nov
2014, on Iran concerns
Oil prices hit $80 a barrel on
Thursday for the first time since
November 2014 on concerns that
Iranian exports could fall because
of renewed U.S. sanctions,
reducing supply in an already
tightening market…
2
Bhushan promoters in last-ditch effort to halt takeover by Tata
Steel
Tata Steel Ltd is facing a last-ditch attempt by the promoters of debt-
ridden Bhushan Steel Ltd to prevent it from taking control of the company
that it won in a bankruptcy auction. This, after fighting off previous hurdles
posed by rivals, operational creditors, and Bhushan Steel’s employees…
3
Numetal makes Rs 37,000 crore
bid for Essar Steel in round 2
VTB-led Numetal, a prominent
bidder for Essar Steel, has
disclosed that they have made a
bid of Rs 37,000 crore in the
second round of bidding for the
bankrupt steel company while
pleading that the court should
order the lenders to scrap the first
round.…
4
The government may have to fork
out more funds for public-sector
banks (PSBs) in the current fiscal
than estimated earlier as part of
its unprecedented Rs 2.1-lakh-
crore capital infusion plan over
two years, as massive provisioning
requirements to cover for bad
assets have taken a ...
Meeting with stressed PSBs:
Govt may have to cough up
more capital in FY19
5
Sebi further extends deadline
for new FPI limits monitoring
system
Markets regulator Sebi today
further extended the deadline till
June 1 for putting in place a new
system for depositories to
monitor the foreign investment
limits in listed Indian companies.
Securities and Exchange Board of
India (Sebi) has extended the last
day for the second time after
taking into consideration
representations from various
quarters…
6
Thermal plants resume coal
imports amid domestic
shortages
State-run thermal power plants
in coastal states have begun
buying overseas coal due to
domestic coal shortages,
government and utility officials
said, in a setback for the
country's long-term plans to
eliminate imports…
7
Volkswagen India, a subsidiary of
Europe’s largest carmaker, is
expected to post its first-ever
decline in output (production) in
seven years as falling demand in
the South American market is
calling for lower shipments to
Mexico…
First in 7 years, Volkswagen
India output set to fall as
exports weaken
18 May 2018
2

17 May 2018
India Strategy
Please refer our report
Dated 23 June 2017
Contrarian Investing: Consensus Upgrade Analysis
Stocks with ratings upgrade beyond a threshold deliver spectacular returns
Contrarian Investing is a time-tested investment tool, which involves buying/selling
stocks against the prevailing sentiment of the crowd or the market. In our thematic
report,
Contrarian Investing,
dated 22 June 2017, we had covered two major
themes based on consensus ratings (stock popularity) and valuation multiples, and
had demonstrated the success of contrarian investing in India. In the sequel,
Contrarian Investing: Digging Deeper,
we extended our work on valuation multiples
by providing evidence that out-of-favor low P/CF stocks had outperformed in-favor
high P/CF stocks over the last decade and that margin of outperformance was higher
on trailing multiple than on forward multiple.
Contrarian investing focuses on buying stocks dumped into the bargain basement.
Some of the contrarian strategies highlighted in our notes are:
1. Buying neutral-to-moderately-popular stocks (popularity based on consensus
ratings)
2. Buying stocks with low relative valuation multiples (P/E, P/B, P/CF)
3. Buying stocks with consensus upgrade from “net sell to net buy”
In this note, we further analyze the last theme of Consensus Upgrade. We highlight
that a simple strategy of investing in stocks wherein analyst consensus has changed
from “net sell to net buy” can deliver returns of 22.4% over the next one year.
We
address the general case of consensus upgrade and how stock prices react when a
stock is upgraded.
A strategy of investing in stocks that have been upgraded (threshold of 0.7), with a
one-year holding period, has delivered phenomenal returns of 34% over 2006-18.
Consensus rating and consensus upgrade
Bloomberg collects analyst recommendations on each stock and assigns a consensus
rating based on these recommendations. We have set a benchmark of increase of at
least 0.7 in consensus ratings to be a case of upgrade, therefore focusing only on
significant upgrades.
Performance of Consensus Upgrade stocks
Our analysis of BSE-100 constituents’ consensus rating data over 2006-18 (till date)
suggests that a strategy of investing in stocks that have been upgraded by at least
0.7, with a holding period of one year, has delivered phenomenal returns of 34%
over 2006-18.
A stock is upgraded when some of the analyst ratings change from ‘sell’ to
‘hold/buy’ or from ‘hold’ to ‘buy’. Earnings surprise, improvement in news flow and
stock correction leading to attractive valuations can be some of the factors
contributing to a stock’s upgrade on the street.
We found this strategy to be effective across the entire time horizon. The lowest
returns delivered by the strategy across the time period were (-8%) in 2012 and
4.3% in 2008.
18 May 2018
3

Hit ratio and evidence from India
Our analysis focuses on BSE100 current and past constituents over the last decade.
Among consensus upgrade stocks, roughly 55% have outperformed the market, but
as evident in 34% return annually, the margin of outperformance is significantly
higher for winners. In YTD CY18, we did not find a single BSE100 stock that satisfies
our criterion of upgrade (change in consensus rating score by at least 0.7).
Roughly 55% stocks in Consensus Upgrades outperform the market, but the margin of outperformance is significantly higher for
winners
Year
2006
2007
2008
2009
2010
2011
2012
2013
2014
2015
2016
2017
Companies from
"Consensus Upgrade"
List outperforming Nifty
13
11
19
17
11
7
4
8
8
12
5
6
"Consensus
Upgrades"
in an year
32
16
23
28
21
13
15
9
18
17
14
12
Overall
% of Companies
outperforming
market
41
69
83
61
52
54
27
89
44
71
36
50
55
Key Upgrades
Castrol
Apollo Tyres, KotaK Mahindra Bank
Eicher Motors
IndusInd Bank
Titan
Nestle
United Spirits
Ranbaxy
Ashok Leyland
NIIT
Monsanto
Jindal Steel and Power
Source: MOSL, Bloomberg
18 May 2018
4

Eicher Motors
BSE SENSEX
35,149
S&P CNX
10,683
17 May 2018
Update
| Sector:
Automobiles
CMP: INR30,550
TP:INR35,572(+16%)
Buy
All set for next leg of growth…
…driven by high-potential, under represented BIMARU states
Stock Info
Bloomberg
Equity Shares (m)
52-Week Range (INR)
1, 6, 12 Rel. Per (%)
M.Cap. (INR b)
M.Cap. (USD b)
Avg Val, INRm
Free float (%)
EIM IN
27
33484 / 26000
-7/-7/-13
832.7
12.3
1427.0
49.5
Financials Snapshot (INR b)
2018 2019E 2020E
Y/E Mar
Net Sales
89.6 107.7 129.4
EBITDA
28.1
35.1
43.8
PAT
21.8
28.6
36.7
EPS (INR)
799.6 1,050.3 1,347.1
Gr. (%)
27.0
31.3
28.3
BV/Sh (INR)
2,579 3,424 4,538
RoE (%)
35.2
35.0
33.8
RoCE (%)
30.1
30.3
30.6
P/E (x)
38.2
29.1
22.7
P/BV (x)
11.8
8.9
6.7
Shareholding pattern (%)
As On
Mar-18 Dec-17 Mar-17
Promoter
50.5
50.5
50.6
DII
5.9
5.5
4.0
FII
31.0
32.1
32.5
Others
12.6
11.8
12.9
FII Includes depository receipts
Stock Performance (1-year)
Eicher Motors
Sensex - Rebased
37,000
34,000
31,000
28,000
25,000
High-potential markets like BIMARU under-represented:
We see high growth
potential in key motorcycling markets like BIMARU (Bihar, MP, Rajasthan and
UP). These under-penetrated 2W markets not just offer higher scope for
motorcycles but also for aspirational products like RE. RE’s market share in
these states is currently 3-4% (v/s 6% for pan-India). With network expansion
focused on these high potential tier-2 markets, we expect these states to
continue to grow strongly at 36% CAGR over FY18-20, contributing ~24% to RE’s
domestic volume. We expect UP to become the largest market for RE by FY20
(5th largest in FY17).
State-wise demand model suggests 20% CAGR:
Assuming no capacity
constraints, based on our state-wise demand model, we see potential of 20%
CAGR in domestic volumes over FY18-20. However, assuming 2nd phase of 3rd
plant comes on-stream from April 2019, we model ~16% volume CAGR.
Demand moderation in select key states due to systemic pressures:
In key
states like Maharashtra, Karnataka and Tamil Nadu, there are signs of demand
moderation. While Tamil Nadu witnessed decline for the first time in 3QFY18,
volumes in Maharashtra and Karnataka have been declining since 4QFY17and
2QFY18 respectively, primarily impacted by systemic factors like (a) weakness in
IT sector impacting demand in Pune and Bangalore, (b) increase in road tax in
Karnataka and Maharashtra, and (c) high penetration in key cities (15-25% of
motorcycles v/s 6% pan-India).
Export market a huge opportunity, but ramp-up to be gradual:
RE is focused on
creating a mark in developing markets like LatAm and South East Asia. By
appealing to these markets as a step-up aspirational product with an accessible
cost of ownership vis-à-vis competitors, it is expanding its exclusive dealership
outlets. Its new launches, the 650cc twins would further help establish its
presence in these markets. We believe that export markets can be a meaningful
contributor to volumes in five years, but ramp-up would be back-ended.
VECV volumes to clock 14% CAGR over FY18-20:
We expect VECV to benefit
from strong tailwinds in the domestic CV industry, with volumes growing at 14%
CAGR over FY18-20. Further, with signs of discount levels reducing and
expansion of dealership network, VECV would regain lost market share in the
LMD and HD segment.
Valuation and view:
We expect RE volumes to grow at 16% CAGR over FY18-20.
We believe the next leg of growth would be driven by (a) strong volume growth
in relatively under-penetrated markets, (b) expansion of dealership network in
these under-penetrated markets, providing better brand accessibility, (c) timely
production ramp-up to meet demand, and (d) ramp-up in exports led by new
launches and expansion of exclusive outlets in target markets. We maintain our
multiples (P/E of 27.5x for RE and EV/EBITDA of 10x for VECV). We reiterate our
Buy rating on the stock, with an SOTP-based TP of INR35,572 (FY20E).
18 May 2018
5

Share of Premium (>150cc) motorcycles to expand to ~31% of motorcycles by FY22E
Note: % in circle represents share of premium segment in motorcycle
Source: MOSL
Segment leaders generally enjoy disproportionate
market share
82.7
59.0
28.8
13.0
47.8
57.6
42.6
16.2
31.2 27.2
RE to gain further market share in premium segment
RE market share within premium motorcycles
22.2
15.5
24.0
27.0
26.9
27.4
28.0
28.7
Economy
Exec. 100cc
Exec. 125cc
Scooters
Premium
Source: SIAM, MOSL
Source: SIAM, MOSL
High potential to grow in BIMARU and other eastern states, where RE has low market share
6%
3%
4%
4%
2%
3%
3%
MP
Rajasthan
Bihar
UP
Jharkhand
Orissa
RE's
market
share in
India
Source: SIAM, MOSL
SOTP based target price
INR Mn
Royal Enfield
PE (x)
PAT (ex VECV div)
Equity Value
PE based
VECV (@ 54.4% Economic interest)
EBITDA
EV
@ 10x EV/EBITDA
Net Debt
Equity Value
Total Equity Value
Target Price (INR/Sh)
Upside (%)
FY19E
27.5
24,899
684,720
6,722
67,224
-6,176
73,400
758,120
27,811
(10)
FY20E
27.5
31,941
878,366
8,332
83,315
-8,013
91,328
969,695
35,572
16
FY21E
27.5
39,396
1,083,378
9,758
97,579
-10,849
108,427
1,191,806
43,720
20
Source: MOSL
18 May 2018
6

17 May 2018
4QFY18 Results Update | Sector: Financials
Bajaj Finance
Buy
BSE SENSEX
35,149
Bloomberg
Equity Shares (m)
M.Cap.(INR b)/(USD b)
52-Week Range (INR)
1, 6, 12 Rel. Per (%)
Avg Val, (INR m)
Free float (%)
S&P CNX
10,683
BAF IN
Growth outlook positive, improving asset quality
575.2
Bajaj Finance’s (BAF) 4QFY18 PAT rose 61% YoY to INR7.2b (12% beat),
1,136/17.4
driven by 40% YoY AUM growth and lower-than-expected credit cost.
2089 / 1190
4/10/42
SME (31% of AUM) grew at a healthy 19% YoY, contributing ~30% of
1821.0
incremental AUM growth sequentially. Management expects SME book
44.7
to grow smartly in FY19. Consumer (+44% YoY), Commercial (+57% YoY)
CMP: INR2,067
TP: INR2,450 (+19%)
Financials & Valuations (INR b)
Y/E March
2018 2019E
NII
PPP
PAT
EPS (INR)
EPS Gr. (%)
BV/Sh. (INR)
RoA on AUM (%)
RoE (%)
Payout (%)
Valuations
P/E (x)
P/BV (x)
Div. Yield (%)
78.1
51.4
26.7
46.5
45.6
283
3.6
20.7
10.1
44.5
7.3
0.2
105.6
70.6
35.8
62.3
33.9
338
3.6
20.1
10.0
33.2
6.1
0.3
2020E
137.9
93.7
47.8
83.1
33.4
411
3.6
22.2
10.0
24.9
5.0
0.4
and Rural (+100% YoY) traction remains strong, with growth across
product lines.
Tie-up with RBL is showing strong traction – it has already issued 0.4m
cards and the target is to end with 1m cards by end-CY18.
Mr Atul Jain will be heading the housing finance subsidiary. Management
indicated that mortgage will be ~35% of balance sheet in 2-3 years. BAF
also indicated to infuse another INR10b in Dec-2018 into the housing
finance subsidiary.
Asset quality improved 20bp QoQ, with a GNPA ratio of 1.48%.
In 2W
lending, the 0dpd+ portfolio improved sequentially from 12.2% to
10.6%. Similarly, in the LAP portfolio, 0dpd+ dues improved ~100bp to
0.79%.
Valuation and view:
BAF, within the consumer financing business, has
demonstrated its ability to cross-sell, as is evident from strong growth in
the personal loans portfolio over the past three years. Its focus on the
SME and commercial lending segments may depress margins and RoE,
but will keep growth strong. We largely maintain estimates for FY19/20
to accommodate slightly lower AUM growth. Our target price stands at
INR2,450 (30x Mar’20E EPS; implied 6x Mar’20E BV).
Maintain
Buy.
FY17
2Q
BAF: Quarterly Performance
Y/E March
1Q
Revenue from operations
YoY Growth (%)
Interes t expens es
Net Income
YoY Growth (%)
Other i ncome
Total Income
Opera ti ng Expens es
Operating Profit
YoY Growth (%)
Provi s i ons a nd Cont.
Profit before Tax
Ta x Provi s i ons
Net Profit
YoY Growth (%)
Loa n Growth (%)
Borrowi ngs Growth (%)
Cos t to Income Ra ti o (%)
Ta x Ra te (%)
E: MOSL Es ti ma tes
22,864
38.9
8,833
14,031
44.8
147
14,178
5,865
8,312
58.1
1,797
6,515
2,275
4,240
53.8
39.5
40.5
41.4
34.9
(INR Million)
3Q
26,930
30.6
9,802
17,128
30.5
109
17,237
6,939
10,297
33.5
1,797
8,500
2,943
5,557
36.0
32.6
30.2
40.3
34.6
4Q
26,650
39.1
9,837
16,813
51.4
79
16,892
7,099
9,794
51.7
2,897
6,897
2,406
4,492
42.6
36.1
33.0
42.0
34.9
FY18
1Q
31,123
36.1
10,780
20,344
45.0
140
20,484
8,413
12,071
45.2
2,817
9,254
3,234
6,020
42.0
38.9
33.4
41.1
34.9
FY17
2Q
30,862
32.1
11,438
19,425
40.8
161
19,586
8,752
10,833
36.8
2,278
8,555
2,986
5,569
36.6
37.8
22.6
44.7
34.9
3Q
35,406
31.5
11,709
23,698
38.4
27
23,724
9,494
14,230
38.2
2,468
11,762
4,094
7,668
38.0
35.4
30.0
40.0
34.8
4Q
35,348
32.6
11,921
23,426
39.3
225
23,651
9,920
13,731
40.2
2,739
10,992
3,783
7,210
60.5
39.6
25.0
41.9
34.4
92,723
34.4
38,034
54,690
37.6
260
54,949
25,642
29,047
40.0
8,182
20,865
9,810
18,366
43.6
32.9
33.0
46.9
35.1
125,233
35.1
46,343
78,890
44.2
1
78,891
36,902
41,988
44.5
10,452
31,536
14,221
26,742
45.6
40.7
30.9
46.8
35.1
FY18E
23,355
39.0
9,562
13,793
40.0
56
13,849
5,932
7,917
40.2
1,654
6,263
2,185
4,078
45.9
37.8
43.4
42.8
34.9
18 May 2018
7

Britannia Industries
BSE SENSEX
35,149
Bloomberg
Equity Shares (m)
M.Cap.(INRb)/(USDb)
52-Week Range (INR)
1, 6, 12 Rel. Per (%)
Avg Val, INRm/ Vol m
Free float (%)
S&P CNX
10,683
BRIT IN
120.0
656.3 / 10.2
5622 / 3372
0/10/35
715.0
49.3
17 May 2018
4QFY18 Results Update | Sector: Consumer
CMP: INR5,469
TP: INR6,400(+17%)
Robust volume and margin outlook; Maintain Buy
Buy
Financials & Valuations (INR b)
2018 2019E 2020E
Y/E Mar
98.3 117.8 139.8
Net Sales
14.2
18.6
23.0
EBITDA
10.0
12.9
16.0
PAT
83.6 107.4 133.2
EPS (INR)
13.5
28.4
24.0
Gr. (%)
283.7 321.2 346.1
BV/Sh (INR)
32.9
35.5
39.9
RoE (%)
28.0
30.5
34.7
RoCE (%)
65.4
50.9
41.1
P/E (x)
45.6
34.6
28.0
EV/EBITDA (x)
Estimate change
TP change
Rating change
BRIT reported 13.1% consol. sales growth to INR25.4b
(est. of INR25.8b) in
4QFY18. We expect base business volume growth to have come in at ~11%
(press release states double-digit volume growth; our estimate was 12%).
Consol. gross margin expanded 50bp YoY
(in-line) to 38.5%. EBITDA margin
expanded 190bp YoY to 15.6% (est. of 15.4%). Apart from gross margin
improvement, there was a decrease in other expenses (-170bp YoY to 18.6%)
while staff cost to sales rose 30bp YoY to 4.3%. Cons. EBITDA, thus, grew at a
healthy 28.9% YoY (est. of +29.3%) to INR4.0b (est. of INR4.0b). PAT growth
was a healthy 25.2% YoY (to INR2.64b v/s est. of INR2.7b).
FY18 performance:
Sales, EBITDA and PAT grew 9.8%, 20.4% and 13.5%
growth, respectively.
Concall highlights:
(1)
Inter corporate deposit to group companies was INR3.5b
in FY18 v/s INR4.5b in FY17.
(2)
INR2.25b cost savings in FY18 (4.5x that of
FY14); targeting savings of ~INR2.4b in FY19.
(3)
Direct reach stands at 1.9m
outlets. Total reach is ~5m outlets.
Valuation view:
We are enthused with the consistent healthy performance,
and believe that the ongoing revival in biscuits category demand is reducing
the hurdle rate for BRIT. Rapidly expanding distribution, continuing
investments in R&D and significant expansion of its own manufacturing
indicate the immense confidence that management has on the growth
prospects. The opportunity beyond biscuits is also big. Continuing
premiumization, significant incremental cost savings and a favorable
commodity cost outlook indicate the bright prospects for further EBITDA
margin expansion. We maintain
Buy
with a TP of INR6,400 (48x Mar’20 EPS, at
a 15% premium to three-year average due to improving visibility on both
volume recovery and margin growth).
FY17
2Q
3Q
10.0
2.0
23,612 22,648
11.0
5.6
14,902 14,190
8,709
8,458
36.9
37.3
5,578
5,487
23.6
24.2
20,481 19,678
3,131
2,970
13.3
13.1
2.0
0.9
289
303
15
11
670
544
3,496
3,201
1,156
997
33.1
31.1
2,340
2,204
5.8
4.6
4Q
2.0
22,444
5.2
13,915
8,528
38.0
5,448
24.3
19,363
3,081
13.7
6.1
322
13
335
3,081
973
31.6
2,108
5.9
1Q
2.0
22,248
5.6
13,873
8,375
37.6
5,479
24.6
19,352
2,896
13.0
2.8
332
13
741
3,293
1,133
34.4
2,160
-1.5
FY18
2Q
3Q
5.0
11.0
25,365 25,583
7.4
13.0
15,840 15,745
9,525
9,838
37.6
38.5
5,836
5,946
23.0
23.2
21,676 21,691
3,689
3,892
14.5
15.2
17.8
31.0
336
329
14
26
596
451
3,934
3,989
1,326
1,354
33.7
33.9
2,609
2,635
11.5
19.6
4Q
11.0
25,375
13.1
15,613
9,762
38.5
5,791
22.8
21,404
3,971
15.6
28.9
424
24
444
3,968
1,330
33.5
2,638
25.2
FY17
6.0
89,766
7.5
55,887
33,879
37.7
21,880
24.4
77,767
11,999
13.4
-4.1
1,193
55
2,288
13,040
4,197
32.2
8,843
7.3
FY18
7.3
98,572
9.8
61,071
37,501
38.0
23,052
23.4
84,123
14,448
14.7
20.4
1,421
76
2,232
15,184
5,142
33.9
10,041
13.5
FY18 Variance
4QE
(%)
12.0
25,799
(1.6)
14.9
15,849
9,950
(1.9)
38.6
5,967
23.1
21,816
3,983
(0.3)
15.4
29.3
402
2
518
4,097
(3.2)
1,394
34.0
2,703
(2.4)
28.3
Quarterly Performance
Y/E March
Base business volume growth (%)
Net Sales
YoY Cha nge (%)
COGS
Gross Profit
Ma rgi ns (%)
Other Opera ti ng Exp
% of Sa l es
Tota l Exp
EBITDA
Ma rgi ns (%)
YoY Growth (%)
Depreci a ti on
Interes t
Other Income
PBT
Ta x
Ra te (%)
Adjusted PAT
YoY Cha nge (%)
1Q
10.0
21,063
8.5
12,879
8,184
38.9
5,367
25.5
18,246
2,817
13.4
3.5
279
15
739
3,263
1,071
32.8
2,192
13.2
(INR Million)
E: MOSL Estimates
18 May 2018
8

17 May 2018
4QFY18 Results Update | Sector: Capital Goods
Voltas
Neutral
BSE SENSEX
35,149
Bloomberg
Equity Shares (m)
M.Cap.(INRb)/(USDb)
52-Week Range (INR)
1, 6, 12 Rel. Per (%)
Avg Val, INRm
Free float (%)
S&P CNX
10,683
VOLT IN
Results impacted by below-expected UCP performance
331
Results below expectations:
Sales were muted YoY at INR20.2b (our estimate:
153.6 / 2.3
INR23.6b). EBITDA rose 14% YoY to INR2.5b (our estimate: INR2.9b), with the
675 / 404
margin of 12.4% (+150bp YoY) coming in line with our est. of 12.4% PAT stood at
-12/-10/21
INR1.9b (-3.1% YoY) v/s our estimate of INR2.1b. For FY18, sales stood at INR64.0b
858.0
(+6% YoY), EBIDTA at INR6.6b (+14.4% YoY) and PAT at INR5.7b (+12% YoY).
69.7
CMP: INR583
TP: INR620(+6%)
Financials & Valuations (INR b)
2018 2019E
Y/E Mar
Net Sales
64.0
75.2
EBITDA
6.6
8.2
PAT
5.7
6.7
EPS (INR)
17.3
20.4
Gr. (%)
11.9
17.9
BV/Sh (INR)
118.0
132.9
RoE (%)
15.9
16.3
RoCE (%)
15.3
15.8
P/E (x)
34.4
29.1
P/BV (x)
5.0
4.5
2020E
83.6
9.0
7.5
22.7
11.2
149.5
16.1
15.6
26.2
4.0
Estimate change
TP change
Rating change
Quarterly Performance (Consolidated)
Y/E March
Sales
Change (%)
EBITDA
Change (%)
As of % Sales
Depreciation
Interest
Other Income
Extra-ordinary Items
PBT
Tax
Effective Tax Rate (%)
Reported PAT
Change (%)
Adj PAT
Change (%)
UCP sales decline 2% YoY, EBIT margin at 17.2%:
Room air conditioner sales
declined 2% YoY (+6-7% YoY on LTL basis) v/s our estimate of 15% growth. This can
be ascribed to pre-buying by dealers in 3QFY18 prior to the implementation of the
new energy ratings for ACs from Jan’18. Market share stood at 22.1% (+70bp YoY
and -160bp QoQ). Margin stood at 17.2% in 4QFY18 (down 60bp YoY on LTL basis
based on our calculation).
EMP revenue up 5% YoY; margin at 7.6%:
Sales of INR8.7b (+5% YoY) were below
our estimate of INR9.3b; however, margin expanded 190bp YoY to 7.6% (est.: 5.9%)
due to the focus on profitable orders and good execution in domestic/overseas jobs.
Orders stood at INR12.3b (+23% YoY), with the order book at INR50.6b.
Key concall highlights:
A) Inverter room AC sales share is increasing, with 20%
growth in 3QFY18 and 30% in 4QFY18; commands a market share of 40%. B) VOLT
had YTD market share of 22.1% (+70bp YoY) at multi-brand outlets (23.7% in
3QFY18). Its secondary sales grew 14.5% in FY18, while industry grew by 11%. C) Air
coolers sales rose 38% to 2,07,000 units in FY18 from 170,000 units in FY17.
Maintain Neutral; TP at INR620.
Despite intense competitive pressures in the room
AC segment, VOLT has been able to maintain its market leadership position without
sacrificing margins. We would watch out for the company’s (a) positioning on
inverters – successful transition and leadership sustainability would make us turn
positive on the stock and b) launch of washing machines and refrigerators in
2HFY19. Moreover, the projects business has also stabilized, with a) margins
recovering to 5-6% and b) a revival in the domestic projects business. We cut our
estimates by 4/7% for FY19/20 to factor in lower sales and margin in the UCP
segment. We maintain our
Neutral
rating on the stock with a target price of INR620
(valuing UCP business at 35x its FY20 earnings, engineering product services at 15x
its FY20 earnings and EMP business at 15x its FY20 earnings).
INR Million)
FY17
FY18
1Q
2Q
3Q
19,446 10,367 13,747
5.1
7.2
16.5
2,123
857
1,186
6.4
24.8
33.3
10.9
8.3
8.6
61
61
61
35
22
19
550
512
170
-20
0
0
2,596 1,287 1,277
727
343
301
28.0
26.6
23.6
1,879
954
1,004
17.7
22.0
23.2
1,859
954
1,004
17.1
22.0
23.2
4Q
20,484
0.7
2,532
14.1
12.4
61
43
438
14
2,852
900
31.6
1,927
-3.9
1,940
-3.1
FY17
FY18
60,328 64,044
5.5
6.2
5,791 6,626
33.8
14.4
9.6
10.3
245
244
160
119
1,998 1,741
11
6
7,395 8,011
2,089 2,270
28.2
28.3
5,114 5,724
38.8
11.9
5,103 5,718
42.6
12.0
FY17
Var.
4QE Vs Est
23,560 -13%
15.8
2,926 -13%
31.9
12.4
67
34
352
-
3,177 -10%
1,041
32.8
2,138 -10%
6.6
2,138
-9%
6.7
1Q
2Q
3Q
4Q
18,500 9,672 11,805 20,351
18.7
-7.0
-6.7
9.7
1,995
687
890
2,219
52.0
6.4
58.0
22.7
10.8
7.1
7.5
10.9
66
63
60
56
48
33
22
58
357
658
597
386
-9
0
0
-2
2,248 1,249 1,405 2,493
651
421
437
496
28.9
33.7
31.1
19.9
1,597
782
815
2,005
55.7
20.9
42.2
22.1
1,587
782
815
2,003
54.8
20.9
47.9
45.7
18 May 2018
9

Muthoot Finance
BSE SENSEX
35,149
Bloomberg
Equity Shares (m)
M.Cap. (INR b) / (USD b)
52-Week Range (INR)
1, 6, 12 Rel. Per (%)
12M Avg Val (INR m)
Free float (%)
Financials & Valuations (INR b)
Y/E Mar
NII
PPP
PAT
EPS (INR)
BV/Sh.(INR)
RoA on AUM%
RoE (%)
Div. Yld. (%)
P/E (x)
P/BV (x)
2018
41.3
30.0
17.2
43.0
194.0
6.2
24.1
2.4
9.8
2.2
2019E
41.8
29.5
17.9
44.8
225.2
6.0
21.4
2.7
9.4
1.9
2020E
45.8
32.2
19.6
48.9
259.3
5.9
20.2
2.9
8.6
1.6
17 May 2018
4QFY18 Results Update | Sector: Financials
S&P CNX
10,683
MUTH IN
PAT misses estimate as growth remains tepid; asset quality deteriorates
400.0
Muthoot Finance’s (MUTH) 4QFY18 PAT grew 40% YoY to INR4.5b (8% miss),
168/2.5
driven by high opex and credit costs. AUM grew 3% QoQ/7% YoY to INR291b.
526 / 360
-9/-15/-10
NII declined 7% YoY, driven by 110bp YoY contraction in margins. Yields came
357.0
in at 22% in the quarter. MUTH has grown its collections team as a strategy to
26.4
focus more on repayments/renewals by customers rather than auctions.
CMP: INR414
TP: INR470 (+14%)
Neutral
Cost of funds declined 10bp QoQ to 8.5% – we believe cost of funds has
bottomed out now, and should stay put or even rise, going forward.
Borrowings remained largely unchanged sequentially at INR213b.
Sequentially, the share of term loans declined from 57% to 53%, while that
of CPs increased from 7% to 13%.
Increase in opex (+9% YoY) from run-rate levels (INR3-3.1b for previous
seven quarters) was due to a) roping in a brand ambassador (Amitabh
Bacchan), b) strengthening collections team and c) sponsoring an IPL team.
With 9% YoY opex growth, the C/I ratio came in at 32% v/s 29% in 3QFY18.
Asset quality deteriorated sharply – GNPLs were up 28% QoQ to INR15.9b.
Note that GNPLs have gone up 4x from 4QFY17, as the company now prefers
overdue collections/renewals by customers rather than auctions. The
increase in GNPLs is in line with management guidance of an INR5b-6b rise
post migration to 90dpd in 4QFY18.
Valuation and view:
Since demonetization, growth has been elusive for gold
financiers. We believe growth will remain modest over the medium term.
Asset quality, too, has witnessed some stress over the past two quarters. We
largely maintain our FY19/20 estimates to factor in tepid growth. Maintain
Neutral
with a target price of INR470 (1.6x FY20E BV).
FY17
2Q
3Q
13,497 13,225
320
184
13,817 13,409
21.6
17.8
45
56
13,862 13,464
21.6
18.0
5,937
5,970
7,925
7,494
3,130
3,000
4,795
4,495
69.5
51.2
171
39
4,624
4,456
1,657
1,545
2,967
2,911
70.0
55.9
FY18
2Q
3Q
16,385 15,227
264
310
16,649 15,537
20.5
15.9
50
130
16,699 15,667
20.5
16.4
4,889
4,689
11,810 10,978
3,114
3,212
8,696
7,766
81.4
72.8
1,170
564
7,526
7,202
2,985
2,565
4,542
4,636
53.1
59.3
(INR Million)
FY17
FY18E
4Q
15,223
287
15,510
-9.3
571
16,080
-6.1
4,495
11,585
3,664
7,921
-4.8
596
7,324
2,810
4,514
40.3
56,395
891
57,286
17.8
181
57,467
17.9
22,938
34,529
12,503
22,026
48.9
2,816
19,211
7,411
11,799
45.7
60,593
1,025
61,618
7.6
814
62,432
8.6
19,399
43,033
13,066
29,967
36.1
2,397
27,572
10,368
17,204
45.8
Quarterly Performance
Y/E March
Income from operations
Other operating income
Total Operating income
YoY Growth (%)
Other income
Total Income
YoY Growth (%)
Interest Expenses
Net Income
Operating Expenses
Operating Profit
YoY Growth (%)
Provisions
Profit before Tax
Tax Provisions
Net Profit
YoY Growth (%)
E: MOSL Estimates
1Q
12,712
252
12,964
13.7
44
13,008
13.8
5,571
7,437
3,025
4,413
50.1
176
4,237
1,534
2,703
47.6
4Q
16,962
135
17,096
18.2
36
17,132
18.0
5,460
11,672
3,349
8,323
37.6
2,430
5,893
2,675
3,218
21.3
1Q
13,758
165
13,923
7.4
63
13,986
7.5
5,326
8,660
3,075
5,585
26.6
66
5,518
2,007
3,511
29.9
18 May 2018
10

RESULTS
FLASH
BSE SENSEX
35,149
S&P CNX
10,683
17
14 May 2018
Results Flash |Flash | Sector: Others
Results Sector: Capital Goods
Quess Corp
Blue star
Buy
CMP: INR1,177
TP: INR1,300(+10%)
Conference Call Details
Date:
18 May 2018
Time:
15:00 IST
Dial-in details:
+91-22-6280 1145
th
Robust growth in Staffing leads to revenue beat; In-line margins
Robust growth in People & Services
Revenue growth of 53% YoY to INR18.9b was above our estimate of INR18.2b
(+47% YoY).
The People & Services (P&S) business grew by 38% YoY, a steep acceleration
from 25% YoY growth achieved last quarter – steadily increasing from the low
of 6% YoY growth struck in 4QFY17.
Global Technology Solutions (GTS) grew by 74% YoY, led by the integration of
Comtel and Tata Business Support Services. Integrated Facility Management
(IFM) grew by 28% YoY, mostly organic. Industrials grew by 128% YoY with
incremental revenue from Vedang Cellular and from the Smart City
implementation in Ahmedabad.
The quarter also included revenue from Monster, which is now classified in a
new segment – Internet. It is currently 1% of total revenue.
Financials & Valuations (INR b)
2018 2019E
Y/E Mar
Net Sales
61.7
81.3
EBITDA
3.5
5.4
NP
3.2
5.0
EPS (INR)
23.1
34.3
EPS Gr. (%)
133.6
48.7
BV/Sh. (INR)
180.5
225.5
RoE (%)
22.5
21.8
RoCE (%)
20.0
19.5
Payout (%)
0.0
0.0
Div. Yield
0.0
0.0
2020E
96.9
6.7
6.4
43.4
26.5
281.5
22.1
Margins largely in-line
20.5
EBITDA margin at 5.8% (+10bp YoY) was 10bp below our estimate. The
0.0
contraction in P&S and GTS was offset by expansion in IFM and Industrials.
0.0
PAT at INR758m grew by 127% YoY, below our estimate of 144% YoY, primarily
because of higher amortization related to customer related intangible asssets
from acquisitions.
Valuation and view:
We will revisit our estimates post the earnings call. Based on
current estimates, it trades at 35/27x FY19/20E EPS. Maintain
Buy.
Quarterly Performance (Consolidated)
Y/E March
Net Sales
YoY Cha nge (%)
Tota l Expendi ture
EBITDA
Ma rgi ns (%)
Depreci a ti on
Interes t
Other Income
PBT before EO expense
Extra -Ord expens e
PBT
Ta x
Ra te (%)
MI & P/L of As s o. Cos .
Reported PAT
Adj PAT
YoY Cha nge (%)
Ma rgi ns (%)
1Q
9,910
35.7
9,382
528
5.3
60
92
7
382
0
382
135
35.4
0
247
247
37.1
2.5
FY17
2Q
3Q
10,177 10,668
26.9
17.7
9,626 10,071
551
597
5.4
5.6
69
72
98
123
57
60
441
462
0
0
441
462
140
130
31.7
28.1
0
-4
301
337
301
337
65.9
95.2
3.0
3.2
4Q
1Q
12,395 12,973
24.4
30.9
11,692 12,221
703
752
5.7
5.8
131
75
166
164
30
35
437
548
0
0
437
548
100
151
22.8
27.6
3
10
333
387
333
387
-4.7
56.7
2.7
3.0
FY18
2Q
3Q
13,953 15,840
37.1
48.5
13,164 14,930
789
909
5.7
5.7
83
183
155
177
168
126
719
675
0
0
719
675
-764
74
-106.3
11.0
2
-9
1,481
610
1,481
610
391.6
81.2
10.6
3.9
FY17
4Q
18,908
52.5
17,814
1,093
5.8
285
252
240
797
0
797
31
3.9
8
758
758
127.2
4.0
43,149
25.6
40,770
2,379
5.5
333
479
154
1,722
0
1,722
504
29.3
-1
1,218
1,218
37.8
2.8
FY18
61,673
42.9
58,129
3,544
5.7
626
747
569
2,739
0
2,739
-507
-18.5
12
3,235
3,235
165.5
5.2
Est.
4Q Var. (% / bp)
18,203
3.9
46.9
569
17,129
4.0
1,074
1.8
5.9
-12
125
127.8
175
43.7
130
84.5
904
-11.8
0
904
-11.8
0
0.0
390
3
901
-15.9
901
-15.9
144.1
-1,698
4.9
-94
18 May 2018
11

RESULTS
FLASH
BSE SENSEX
35,149
S&P CNX
10,683
17
14 May 2018
Results Flash |Flash | Sector: Others
Results Sector: Capital Goods
Blue star
SRF
Buy
CMP: INR2,232
Strong beat on all fronts
TP: INR2,351
Conference Call Details
Date:
18 May 2018
Time:
2:00pm IST
Dial-in details:
+91-22 6280 1148
th
Financials & Valuations (INR b)
2018
2019E
Y/E Mar
Sales
55.9
64.8
EBITDA
9.5
12.0
NP
4.6
6.1
Adj EPS (INR)
80.4
105.0
EPS Gr. (%)
-10.3
30.6
BV/Sh (INR)
605.0
686.8
RoE (%)
13.7
16.3
RoCE (%)
10.3
11.9
Valuations
P/E (x)
P/BV (x)
EV/EBITDA (x)
2020E
74.4
14.5
8.1
138.3
31.7
801.9
18.6
14.4
27.8
3.7
15.7
21.3
3.2
12.3
16.1
2.8
9.8
Revenue grew 21.6% YoY to INR16,123m (est. of INR14,385m) in 4QFY18, led
by strong growth of 39.4% YoY in the packaging film business, followed by
chemicals & polymers business (+10.9% YoY). However, technical textiles
business witnessed de-growth of 1.5% YoY.
EBITDA margin contracted 40bp YoY to 17.3% (est. of 16.1%) due to a rise of
330bp in raw material cost to 55% (est. of 53.4%), offset by a decline of 140bp
in employee cost to 7.7% of net sales (est. of 10%) and of 100bp in other
expenses to 19.9% of net sales (est. of 20.5%).
Margin expanded by 350bp YoY to 13.6% in technical textile, by 90bp YoY to
17.5% in chemicals and polymers, and by 380bp YoY to 13.7% in packaging film.
Packaging film margin is expected to have been aided by inventory gain.
EBITDA grew 19% YoY to INR2,790m (est. of INR2,316m).
Adj. PAT declined 4% YoY to INR1,239m (est. of INR1,018m) in 4QFY18, as the
tax rate was recorded higher at 24.2% v/s 21.4% in 4QFY17 and interest cost
came in lower at INR425m v/s INR228m in 4QFY17.
For FY18, revenue grew 16% to INR55,890m, while the margin contracted
370bp to 17%. EBITDA declined 4.5% to INR9,526m. Consequently, adj. PAT fell
10% YoY to INR4,617m.
Valuation view:
Based on our estimates, at CMP of INR2,232, the stock trades at
21x/16x FY19/20E EPS. Currently, we have a
Buy
rating on the stock.
18 May 2018
12

17 May 2018
4QFY18 Results Update | Sector: Automobiles
Escorts
Neutral
BSE SENSEX
35,149
Bloomberg
Equity Shares (m)
M.Cap.(INRb)/(USDb)
52-Week Range (INR)
1, 6, 12 Rel. Per (%)
Avg Val, INRm
Free float (%)
S&P CNX
10,683
ESC IN
123
99.7 / 1.5
1019 / 545
-5/32/31
1180.0
60.0
CMP: INR951
TP: INR982(+3%)
Healthy progress across segments, upgrade to Neutral
Financials & Valuations (INR b)
Y/E Mar
2018 2019E
Net Sales
50.6
58.5
EBITDA
5.5
7.0
PAT
3.5
4.7
EPS (INR)
39.5
52.4
Gr. (%)
88.0
32.5
BV/Sh (INR)
249.2
293.3
RoE (%)
18.3
19.3
RoCE (%)
19.2
20.1
P/E (x)
24.1
18.2
P/BV (x)
3.8
3.2
Estimate change
TP change
Rating change
Revenue, EBITDA, PAT in-line:
ESC’s revenue increased 40.5% YoY (+19.2%
QoQ) to INR14.4b (in-line). Tractor, construction equipment and railway
businesses grew strongly by 36.4%, 44.5% and 14.2%, respectively, led by
healthy volume growth. EBITDA margin was flat QoQ at 12.1% (est. of
11.6%), as the benefit of lower staff cost (-110bp QoQ) was partially offset
by higher RM cost (+90bp QoQ). Higher other income of INR226m (est. of
INR90m) led to adj. PAT growth of 134% YoY to INR1.1b (in-line).
2020E
66.9
FY18:
Revenue/ EBITDA/ PAT grew by 21.5%/ 72.1%/76.3%.
8.6
Earnings call highlights:
a) Domestic tractor industry to grow 9-11% in FY19,
5.8
and ESC to outperform led by new product launches. b) Tractor market
65.5
share for FY18 at 11% (+20bp), with 15.3% share in strong market and 5.7%
25.0
share in opportunity market. c) Expect growth of ~16-18% in CE business
350.5
and ~18-20% in railway business. d) RM inflation over last 15 months at ~4%,
20.3
of which ~3% has been passed on. e) Took price hike of 0.8% in Apr-18. f)
29.4
14.5
Expect ~100bp margin improvement in FY19, led by operating leverage and
2.7
cost control. g) Targets tractor exports growth of 50% in FY19.
Valuation view:
We upgrade ESC to
Neutral,
given the strong outlook across
businesses and with efforts of cost rationalization starting to bear fruit.
Market share gains in the core tractor business and sound capital allocation
are expected to result in RoE improvement of 3% to 20.3% by FY20. We
upgrade our earnings estimate by 6%/11% for FY19/20, factoring in healthy
volume growth across segments and ~200bp EBITDA margin expansion to
12.8% in FY20, leading to earning CAGR of ~29% over FY18-20. We upgrade
the target multiple to 15x (earlier 14x) to reflect the improvement across
businesses. However, in our view, valuations largely capture the expected
positives. We value the stock on 15x FY20E EPS to arrive at a TP of INR982.
18 May 2018
13

TeamLease Services
BSE SENSEX
35,149
Bloomberg
Equity Shares (m)
M.Cap.(INRb)/(USDb)
52-Week Range (INR)
1, 6, 12 Rel. Per (%)
Avg Val, INRm
Free float (%)
S&P CNX
10,683
TEAM IN
Margin story playing out better than expectations…
17
…overshadowing the slight revenue miss
47.3 / 0.7
3219 / 1105
Continued pick-up in General Staffing:
Revenue for TeamLease (TEAM)
grew 20% YoY (est. of 27% YoY) to INR9.8b. The miss stemmed out of
31/53/133
57.0
General Staffing (13% YoY), which saw some weakness in FY18, although the
56.9
trajectory is already looking upward (8% YoY growth in 3QFY18).
17 May 2018
4QFY18 Results Update | Sector: Others
CMP: INR2,885
TP: INR3,400(+18%)
Buy
Financials & Valuations (INR b)
2018 2019E
Y/E Mar
36.2
45.4
Net Sales
0.7
1.1
EBITDA
0.7
1.2
PAT
43.0
67.6
EPS (INR)
28.0
57.1
Gr. (%)
265.9
333.6
BV/Sh (INR)
17.6
22.6
RoE (%)
17.9
22.4
RoCE (%)
67.3
42.8
P/E (x)
10.9
8.7
P/BV (x)
2020E
56.3
1.5
1.7
98.6
45.8
432.2
25.8
25.5
29.4
6.7
Estimate change
TP change
Rating change
Performance in the other segments remained strong (210% YoY in
Specialized Staffing and 67% in Other HR Services).
Solid margins performance:
EBITDA margin of 2.1% (adjusted for one-off
provision write-back) expanded 60bp YoY, led by (i) expansion of 20bp in
General Staffing and (ii) higher proportion of revenue from Specialized
Staffing (7% in 4QFY18 v/s 3% in 4QFY17). Improvement was seen on both
the key determinants of margins – 8% increase in realization and an increase
in Associate/Core Employee ratio to 220 in 4QFY18 (from 203 last year). PAT
of INR212m declined 36% YoY, in line with our estimate, as the revenue and
other income miss was offset by the margin beat.
Soft year, strong outlook:
At 19% revenue growth, FY18 was soft relative to
historical CAGR of 25%. However, 70bp margin expansion kept the upward
trajectory on track, leading to growth of 86% YoY. PAT growth stood at 28%
YoY. Although organic revenue growth trajectory took a dent in FY18,
growth is expected to swing back to normal in FY19, while the backdrop of
under-penetration and formalization remains intact.
Valuation view:
We value TEAM using DCF to arrive at a price target of
INR3,400 (implied target PE of 34x on FY20 EPS); our price target has
increased by 25%, led by a solid margins performance, which has further
cemented our expectations. Consequently, we raise our FY19/20 EPS
estimate by 8/13%. At 42/30x FY19/20E earnings, valuations are rich, and
our CAGR estimate stands at 25/47/51% over FY18-20. Sustained superiority
of financial performance because of industry trends, business model and
operational excellence continues to strengthen our long-term view.
Buy.
(INR m)
Est. Var. (%
4QFY18
/ bp)
10,336
-5.4
26.5
10,136
-5.8
200
13.7
1.9
43
-35.7
11
1.2
224
-94.7
612
-67.3
0
na
0.0
0
217
-2.2
-34.6
2.1
189,741
-4.4
Consol. - Quarterly Earning
Y/E March
Net Sales
YoY Change (%)
Total Expenditure
EBITDA
Margins (%)
Depreciation
Interest
Other Income
PBT
Tax
Rate (%)
MI & P/L of Asso. Cos.
Adj PAT
YoY Change (%)
Margins (%)
Headcount
1Q
6,875
21.4
6,824
51
0.7
10
2
61
100
36
36.3
0
63
28.2
0.9
127,868
FY17
FY18
FY17
FY18
2Q
3Q
4Q
1Q
2Q
3Q
4Q
7,223 8,144 8,170 8,530 8,756 9,181 9,775 30,413 36,241
12.3
29.1
23.0
24.1
21.2
12.7
19.6
21.4
19.2
7,150 8,020 8,048 8,399 8,605 9,002 9,547 30,043 35,553
73
124
123
130
151
179
227
370
688
1.0
1.5
1.5
1.5
1.7
1.9
2.3
1.2
1.9
12
18
21
20
20
24
28
61
92
3
3
3
2
3
8
11
11
25
71
37
47
58
44
42
12
217
157
129
140
146
166
173
189
200
515
729
41
48
-186
2
-3
5
-15
-61
-10
31.6
34.3 -127.3
1.3
-1.5
2.5
-7.4
-11.8
-1.4
0
0
0
0
0
0
-3
0
-3
88
92
332
164
176
184
212
576
736
53.9
85.8 261.6 158.5
99.5
99.9
-36.0 132.0
27.8
1.2
1.1
4.1
1.9
2.0
2.0
2.2
1.9
2.0
134,287 144,634 151,153 159,261 162,090 177,283 181,323 151,153 181,323
18 May 2018
14

March 2018 Results Preview | Sector: Automobiles
Amara Raja Batteries
Bloomberg
Equity Shares (m)
M. Cap. (INR b)/(USD b)
52-Week Range (INR)
1,6,12 Rel Perf. (%)
AMRJ IN
170.8
139 / 2
955 / 665
2 / 9 / -22
CMP: INR811
TP: INR1000 (+23%)
Buy
Financial Snapshot (INR b)
Y/E March
2017 2018E 2019E 2020E
Sales
EBITDA
NP
EPS (INR)
EPS Gr. (%)
BV/Sh. (INR)
RoE (%)
RoCE (%)
Valuations
P/E (x)
P/BV (x)
EV/EBITDA (x)
EV/Sales (x)
29.0
5.3
16.2
2.6
28.7
4.6
15.0
2.3
23.9
4.0
12.2
1.9
20.3
3.4
10.2
1.6
53.2
8.5
4.8
28
-2.7
152
20.3
19.4
59.9
9.1
4.8
28.3
0.9
175
17.3
16.5
69.2
10.9
5.8
34.0
20.3
203
18.0
17.1
79.4
12.6
6.8
40.0
17.6
235
18.3
17.3
We expect AMRJ’s revenue to grow 12.4% YoY (-3% QoQ) to
INR15.1b, driven by strong growth in Automotive OEM &
replacement segment.
Spot LME lead prices increased marginally by 0.5% QoQ, but 6%
YoY in 4QFY18.
EBITDA margin is likely to expand 170bp YoY (-20bp QoQ) to
15.4%.
We expect PAT to increase 22% YoY to INR1.2b.
We maintain our FY19E and FY20E EPS estimates at INR34 and
INR40, respectively.
The stock trades at 23.9x FY19E and 20.3x FY20E EPS; Maintain
Buy.
Key issues to watch
Update on demand environment for OEMs, auto replacement
and industrial battery segments.
Update on entry into new segments like e-rickshaw, solar and
motive power.
Outlook for raw material cost trend, recent pricing action.
Update on recent capacity expansion plans across product
segments.
Update on progress made on product development in lithium
ion battery space and plans thereof.
Quarterly Performance
Y/E March (INR m)
Net Sales
YoY Change (%)
RM Cost (% of sales)
Staff Cost (% of sales)
Other Exp (% of sales)
EBITDA
Margins (%)
Depreciation
Interest
Other Income
PBT
Rate (%)
Adj PAT
YoY Change (%)
E: MOSL Estimates
1Q
13,081
15.0
65.7
5.0
11.9
2,273
17.4
441
14
90
1,908
31.5
1,307
8.0
FY17
2Q
3Q
13,331
13,269
15.8
9.5
63.9
65.0
5.2
5.5
13.7
14.1
2,297
2,040
17.2
15.4
457
469
15
14
120
133
1,945
1,689
29.9
33.5
1,363
1,123
10.4
-17.9
4Q
13,445
17.4
68.0
5.2
13.0
1,844
13.7
499
15
151
1,480
33.0
992
-9.1
1Q
14,975
14.5
70.0
5.4
11.7
1,929
12.9
544
14
137
1,508
33.7
999
-23.6
FY18
2Q
14,275
7.1
66.0
5.2
12.1
2,381
16.7
584
13
122
1,907
33.3
1,272
-6.7
FY17
3Q
15,535
17.1
66.9
4.9
12.0
2,416
15.6
587
11
168
1,985
32.3
1,345
19.7
4QE
15,109
12.4
66.7
5.1
12.8
2,327
15.4
656
14
148
1,806
32.9
1,212
22.2
53,172
15.1
65.6
4.7
13.9
8,499
16.0
1,912
58
492
7,022
31.9
4,785
-2.7
FY18E
59,893
12.6
67.4
4.2
11.6
9,052
15.1
2,371
51
575
7,205
33.0
4,828
0.9
18 May 2018
15

March 2018 Results Preview | Sector: Automobiles
Ashok Leyland
Bloomberg
Equity Shares (m)
M. Cap. (INR b)/(USD b)
52-Week Range (INR)
1,6,12 Rel Perf. (%)
AL IN
2926.5
432 / 7
152 / 81
7 / 15 / 64
CMP: INR148
TP: INR179 (+21 %)
Buy
Financial Snapshot (INR b)
Y/E March
2017 2018E 2019E 2020E
Sales
EBITDA
NP
Adj. EPS (INR)
EPS Gr. (%)
BV/Sh. (INR)
RoE (%)
RoCE (%)
Valuations
P/E (x)
P/BV (x)
EV/EBITDA (x)
Div. Yield (%)
35.0
7.1
19.4
1.1
27.2
6.2
14.7
1.4
20.4
5.2
11.2
1.5
16.0
4.3
8.8
1.7
200.2 260.4 308.0 360.6
22.0
12.4
4.2
0.2
20.9
21.4
21.8
28.4
15.9
5.4
28.8
23.9
24.3
20.3
35.6
21.2
7.2
33.1
28.5
27.6
23.3
42.8
26.9
9.2
27.1
34.7
29.2
25.2
In 4QFY18, volumes increased 23% YoY (+26% QoQ), as M&HCV
and LCV sales increased 15% YoY and 59% YoY, respectively, led
by continued strong demand supported by overloading ban.
We expect realization to increase by 5.9% YoY (-3.6% QoQ), led by
BS-4 related price hikes, lower discounts on QoQ basis and mix
impact.
Net revenue is likely to grow 30.6% YoY (+21.5% QoQ) to
INR86.4b, led by volume and realization growth.
EBITDA margin is likely to expand 210bp YoY (+200bp QoQ) to
13.1% led by operating leverage.
EBITDA should increase 55% YoY (44% QoQ) to INR11.3b.
PAT should increase 62.7% YoY (+54.8% QoQ) to INR7.0b.
We revised EPS estimates of FY19/FY20 by 16.4%/19.4% to factor
for higher volumes (6%/9% in FY19/FY20) and better operating
performance. The stock trades at EV/EBITDA of 11.2x FY19E and
8.8x FY20E EBITDA. Maintain
Buy.
Key issues to watch
Update on CV demand and discount trends.
Update on LCVs, exports and defence business.
RM cost guidance and price hikes to mitigate the same.
Capex and investment guidance for FY19.
Quarterly Performance
1Q
31,165
10.7
1,367
-0.9
42,588
9.7
68.7
8.4
11.6
4,820
11.3
385
338
4,154
0
4,154
30.0
2,908
130.0
FY17
2Q
3Q
33,441
32,838
-10.5
6.2
1,382
1,470
4.0
10.5
46,224
48,283
-6.9
17.4
67.8
65.1
8.0
8.2
12.6
10.8
5,365
4,541
11.6
9.4
316
258
339
453
4,146
2,395
0
0
4,146
2,395
29.0
32.5
2,944
1,617
14.5
-25.6
4Q
47,622
8.5
1,390
2.1
66,179
10.8
71.9
6.2
10.8
7,299
11.0
404
423
6,114
3,508
2,605
-
4,279
-16.5
1Q
28,484
-8.6
1,488
8.9
42,378
-0.5
69.4
10.3
13.0
3,061
7.2
384
366
1,730
126
1,605
30.7
1,199
-58.7
FY18
2Q
3Q
40,985
46,627
22.6
42.0
1,475
1,526
6.7
3.8
60,469
71,132
30.8
47.3
71.3
71.4
8.1
6.9
10.4
10.6
6,118
7,884
10.1
11.1
557
380
410
335
4,826
6,576
0
0
4,826
6,576
30.7
31.6
3,342
4,497
13.5
178.1
FY17
4QE
58,735
23.3
1,471
5.9
86,412
30.6
70.6
5.9
10.3
11,329
13.1
380
356
9,948
0
9,948
31.2
6,963
62.7
145,066
3.4
1,380
2.3
200,187
5.7
69.7
7.6
11.6
22,025
11.0
1,363
1,554
16,809
3,508
13,301
8.0
12,360
2.6
FY18E
174,831
20.5
1,489
7.9
260,390
30.1
70.8
7.4
10.8
28,392
10.9
1,700
1,467
23,081
126
22,955
31.2
15,880
28.5
Total Volumes (nos)
Growth %
Realizations (INR '000)
% change
Net operating revenues
Change (%)
RM/sales %
Staff/sales %
Other exp/sales %
EBITDA
EBITDA Margin (%)
Other Income
Interest
PBT before EO Item
EO Exp/(Inc)
PBT
Effective Tax Rate (%)
Adj. PAT
Change (%)
E: MOSL Estimates
18 May 2018
16

March 2018 Results Preview | Sector: Automobiles
Bajaj Auto
Bloomberg
Equity Shares (m)
M. Cap. (INR b)/(USD b)
52-Week Range (INR)
1,6,12 Rel Perf. (%)
BJAUT IN
289.4
808 / 12
3473 / 2695
-6 / -18 / -11
CMP: INR2,791 TP: INR3,550 (+27%)
Buy
Financial Snapshot (INR b)
Y/E MAR
2017 2018E 2019E 2020E
Sales
EBITDA
NP
Adj. EPS (INR)
EPS Gr. (%)
BV/Sh. (INR)
RoE (%)
RoCE (%)
Payout (%)
Valuations
P/E (x)
P/BV (x)
EV/EBITDA (x)
Div. Yield (%)
19.8
4.7
14.9
2.0
18.9
4.3
13.8
2.3
16.6
3.9
12.0
2.7
14.2
3.5
9.8
3.0
218
44.2
40.8
141
-1.7
589
26.9
24.6
46.9
251
47.4
42.8
148
4.8
649
23.9
21.6
52.8
275
53.2
48.6
168
13.5
717
24.6
22.5
53.7
310
62.9
57.1
197
17.5
802
26.0
33.0
51.8
Overall volume increased by 32.7% YoY (-4.4% QoQ) to ~1,045k
units due to ~34% YoY increase in domestic volume, while export
volumes increased by ~31% YoY. Volume growth was led by 3Ws,
as domestic 3Wvolumes increased by 144% YoY, while 3W
exports grew by 83% YoY.
We expect realization to grow by 2.5% YoY (flat QoQ) led by
improvement in product mix and price hikes. Consequently, net
revenues are expected to increase by 36% YoY (5% QoQ).
We expect EBITDA margin to expand by ~60bp YoY (-20bp QoQ)
to 19.1%, as margin was impacted by BS-IV related provisioning in
4QFY17.
We expect PAT to grow by 22% YoY (2.7% QoQ) to INR9.8b.
We have cut our EBITDA margin estimate by 80bp/30bp in
FY19/FY20, resulting in EPS declining by 4.2%/2.8% for
FY19E/FY20E.
The stock trades at 16.6x FY19E and 14.2x FY20E EPS; maintain
Buy.
Key issues to watch
Update on demand of new launches.
Export demand outlook and pricing in key currency market.
Comments on 3W demand recovery in domestic market.
Update on EV strategy.
Quarterly Performance
Volumes ('000 units)
Growth YoY (%)
Realization (INR/unit)
Growth YoY (%)
Net Sales
Change (%)
RM/Sales %
Staff cost/Sales %
Oth. Exp./Sales %
EBITDA
EBITDA Margins (%)
Other Income
Interest
Depreciation
PBT
Tax
Effective Tax Rate (%)
Adj. PAT
Change (%)
E: MOSL Estimates
1Q
995
-1.8
57,784
4.5
57,480
2.7
67.2
4.7
7.7
11,763
20.5
2,671
2
775
13,657
3,873
28.4
9,784
2.2
FY17
2Q
1,032
-2.3
58,676
2.0
60,545
-0.4
67.0
4.3
7.4
12,961
21.4
3,420
7
770
15,605
4,378
28.1
11,228
6.7
3Q
852
-10.5
59,495
2.0
50,669
-8.7
66.8
4.8
7.9
10,439
20.6
3,193
3
772
12,858
3,612
28.1
9,246
(4.7)
4Q
788
-9.7
62,171
1.2
48,973
-8.6
67.8
4.6
9.2
9,060
18.5
2,936
2
757
11,236
3,218
28.6
8,018
(15.5)
1Q
888
-10.7
61,258
6.0
54,424
-5.3
70.0
5.0
7.8
9,384
17.2
4,573
2
753
12,881
3,642
28.3
9,469
(3.2)
FY18
2Q
1,072
3.8
61,408
4.7
65,799
8.7
69.1
4.0
7.2
12,984
19.7
2,964
5
770
15,174
4,055
26.7
11,119
(1.0)
FY17
3Q
1,001
17.6
63,600
6.9
63,693
25.7
68.4
4.2
8.3
12,315
19.3
2,269
3
747
13,833
4,309
31.1
9,524
3.0
(INR m)
FY18E
4QE
1,045
3,666
4,007
32.7
(5.8)
9.3
63,725
59,419 62,527
2.5
2.4
5.2
66,617 217,827 250,533
36.0
(3.6)
15.0
68.7
67.1
69.2
4.0
4.6
4.3
8.4
8.0
7.9
12,736
44,384 46,874
19.1
20.4
18.7
2,168
12,220 11,974
0
14
10
794
3,073
3,063
14,110
53,516 55,775
4,326
15,081 16,333
30.7
28.2
29.3
9,784
38,436 39,987
22.0
(2.2)
4.0
18 May 2018
17

March 2018 Results Preview | Sector: Cement
Dalmia Cement
Bloomberg
Equity Shares (m)
M. Cap. (INR b)/(USD b)
52-Week Range (INR)
1,6,12 Rel Perf. (%)
DBEL IN
88.8
255 / 4
3349 / 1965
7 / 0 / 34
CMP: INR2,867 TP: INR3,350(+17%)
Buy
Financial Snapshot (INR Billion)
Y/E March
2017 2018E 2019E 2020E
Sales
EBITDA
NP
Adj. EPS(INR)
EPS Gr. (%)
BV/Sh (INR)
RoE (%)
RoCE (%)
Payout (%)
Valuation
P/E (x)
P/BV (x)
EV/EBITDA (x)
EV/Ton (USD)
74.0
5.1
17.5
176
55.2
4.7
16.1
184
39.3
4.2
13.8
180
28.1
3.7
11.6
174
74.0
19.0
3.4
38.8
81.2
558
7.2
7.3
6.0
85.1
19.6
4.6
52.0
34.0
608
8.9
8.0
4.5
96.7 109.4
22.2
6.5
40.3
677
11.3
9.4
4.8
25.7
9.1
40.1
775
14.1
11.0
4.5
72.9 102.2
4QFY18 cement volumes are estimated to increase ~14% YoY to
5.17mt, led by growth in the South and the East. Realizations are
estimated to decline ~2.6% QoQ to INR4,907/ton, led by weaker
prices in the South, partially offset by healthy prices in the East.
We estimate cement EBITDA/ton at INR989 (-INR106/ton QoQ)
due to decline in realization. EBITDA margin is expected to decline
5.1pp YoY and 1.6pp QoQ to 20.2%.
EBITDA is estimated to decrease 7% YoY to INR5.12b, translating
into adjusted PAT decline of 3% YoY to INR1.7b.
The stock trades at a P/E of 39.3x (FY19E) and 28.1x (FY20E),
EV/EBITDA of 13.9x (FY19E) and 11.6x (FY20E), and EV/ton of
USD180 (FY19E) and USD174 (FY20E). Maintain Buy.
Key issues to watch out for
Volume growth recovery and outlook.
Cement pricing outlook and sustainability.
Update on restructuring timelines.
Quarterly Performance (Consolidated)
Y/E March
Sales Dispatches (m ton)
YoY Change (%)
Realization (INR/ton)
YoY Change (%)
QoQ Change (%)
Net Sales
YoY Change (%)
EBITDA
Margins (%)
Depreciation
Interest
Other Income
PBT before EO Expense
Extra-Ord expense
PBT after EO Expense
Tax
Rate (%)
Reported PAT (pre minority)
Minority + associate
PAT Adj for EO items
YoY Change (%)
E:MOSL Estimates
1Q
3.76
21.7
4,727
-8.7
-3.0
17,775
11.1
5,084
28.6
1,338
2,412
766
2,100
0
2,100
911
43.4
1,189
250
940
78.3
FY17
2Q
3.42
20.0
5,010
0.6
6.0
17,134
20.8
4,207
24.6
1,587
2,291
796
1,125
0
1,125
662
58.9
463
152
311
149.8
3Q
3.56
20.3
4,837
-3.2
-3.5
17,219
16.4
4,147
24.1
1,887
2,105
676
831
8
823
273
33.2
550
151
405
35.2
4Q
4.55
17.3
4,802
-1.4
-0.7
21,850
15.6
5,517
25.2
1,509
1,998
715
2,724
-139
2,863
704
24.6
2,159
319
1,736
83.2
1Q
3.99
6.1
5,129
8.5
6.8
20,466
15.1
5,566
27.2
1,532
2,117
700
2,617
-267
2,885
889
30.8
1,996
357
1,454
54.7
FY18
2Q
3.64
6.4
5,038
0.5
-1.8
18,337
7.0
4,408
24.0
1,653
1,974
922
1,703
33
1,669
556
33.3
1,113
193
942
202.9
(INR Million)
FY17
FY18E
3Q
4.15
16.6
5,037
4.2
0.0
20,905
21.4
4,546
21.7
1,776
1,419
507
1,858
-299
2,157
698
32.3
1,460
279
971
139.9
4QE
5.17
13.7
4,907
2.2
-2.6
25,386
16.2
5,118
20.2
1,721
1,461
571
2,507
0
2,507
629
25.1
1,878
196
1,683
-3.1
15.29
19.5
4,843
-3.3
74,044
15.5
19,019
25.7
6,027
8,900
2,988
7,080
-131
7,210
2,892
40.1
4,318
870
3,370
574.3
16.95
10.9
5,019
3.6
85,093
14.9
19,638
23.1
6,682
6,971
2,700
8,685
-533
9,218
2,771
30.1
6,446
1,024
5,050
49.9
18 May 2018
18

March 2018 Results Preview | Sector: Healthcare
Strides Shasun
Bloomberg
Equity Shares (m)
M. Cap. (INR b)/(USD b)
52-Week Range (INR)
1,6,12 Rel Perf. (%)
STR IN
89.4
63 / 1
1148 / 641
1 / -23 / -49
CMP: INR704
TP:INR989(+40%)
Buy
Financial Snapshot (INR Billion)
y/e march
2017 2018E 2019E 2020E
Sales
EBITDA
NP
EPS (INR)
EPS Gro. (%)
BV/Sh. (INR)
RoE (%)
RoCE (%)
Valuations
P/E (x)
P/BV (x)
EV/EBITDA (x)
EV/Sales (x)
D. Yield (%)
21.9
2.3
15.1
2.8
0.0
50.1
2.2
22.2
3.1
0.0
17.3
2.0
13.0
2.6
0.0
12.7
1.7
10.4
2.1
0.0
34.8
6.4
2.9
32.3
77.6
303.1
10.8
8.3
29.5
4.1
1.3
14.1
-56.2
315.4
4.6
5.1
34.4
6.8
3.6
40.8
188.8
356.2
12.1
8.8
39.9
8.1
5.0
55.7
36.7
411.9
14.5
10.2
We expect sales of INR7.9b for 4QFY18. The YoY numbers are not
comparable, as 4QFY17 includes API and domestic formulation
sales. API business, which was hived off to Solara, is shown as
discontinued operations. Domestic formulation business was sold
to Eris Life Sciences in November 2017.
We expect marginal improvement on a QoQ basis.
We expect EBITDA margin to rise by 100bp QoQ, largely due to
new launches in the US market.
Accordingly, PAT is expected to rise by 49% QoQ to INR598m for
4QFY18.
The stock trades at 17.3x FY19E EPS. We maintain Buy, with a
target price of INR989 (SOTP basis).
Key issues to watch out
Pace of ANDA filings and outlook on niche approvals.
Outlook on margin improvement in Australia business.
Quarterly Performance
Y/E March
Net Sales
YoY Change (%)
Total Expenditure
EBITDA
Margins (%)
Depreciation
Interest
Other Income
PBT before EO expense
Extra-Ord expense
PBT
Tax
Rate (%)
Minority Interest & P/Lof Asso. Cos.
Reported PAT from Continuing Ops.
Adj. PAT from Continuing Ops.
YoY Change (%)
Margins (%)
1Q
7,895
28.8
6,573
1,323
16.8
424
559
208
547
60
487
88
18.1
65
334
383
260.9
4.9
FY17
2Q
9,535
33.3
8,101
1,434
15.0
468
617
658
1,008
0
1,008
152
15.1
114
741
741
106.9
7.8
3Q
7,298
-15.9
5,882
1,416
19.4
309
441
222
888
115
773
235
30.4
1
537
617
4.7
8.4
4Q
8,884
-3.9
7,315
1,569
17.7
529
592
731
1,179
17
1,162
175
15.0
-7
994
1,009
471
11.4
1Q
6,579
-16.7
5,950
629
9.6
356
524
345
93
34
60
10
15.9
31
20
48
-87.5
0.7
FY18
2Q
7,695
-19.3
6,698
997
13.0
384
486
222
350
123
227
33
14.4
53
142
246
-66.7
3.2
3Q
7,490
-19.8
6,262
1,228
16.4
391
498
157
497
63
433
-2
-0.4
32
403
466
-24.4
6.2
4QE
7,850
-11.6
6,476
1,374
17.5
400
450
160
684
0
684
85
12.5
0
598
598
-41
7.6
(INR Million)
FY17
34,834
11.6
28,406
6,428
18.5
1,872
2,269
1,686
3,973
1,006
2,967
470
15.8
458
2,039
2,886
136.9
8.3
FY18E
29,620
-15.0
25,389
4,230
14.3
1,536
1,952
884
1,627
219
1,408
121
8.6
117
1,204
1,371
-52.5
4.6
18 May 2018
19

March 2018 Results Preview | Sector: Capital Goods
Thermax
Bloomberg
Equity Shares (m)
M. Cap. (INR b)/(USD b)
52-Week Range (INR)
1,6,12 Rel Perf. (%)
TMX IN
112.6
128 / 2
1375 / 835
-4 / 16 / 5
CMP: INR1,136 TP: INR1,350 (+19%)
Buy
Financial Snapshot (INR b)
Y/E March
2017 2018E 2019E 2020E
Net Sales
EBITDA
Adj. PAT
EPS (INR)
EPS Gr. (%)
BV/Sh. (INR)
RoE (%)
RoCE (%)
Payout (%)
Valuations
P/E (X)
P/BV (X)
EV/EBITDA (X)
Div Yield (%)
41.8
5.0
29.3
0.5
40.5
4.6
26.3
0.6
32.3
4.2
20.4
0.6
26.1
3.7
16.1
0.7
44.8
4.3
3.1
27.2
8.5
225.4
12.6
11.3
30.3
49.6
4.8
3.2
28.0
3.1
11.9
12.1
23.5
57.2
6.1
4.0
35.1
25.3
13.6
13.5
20.7
71.0
7.7
4.9
43.5
23.9
15.0
14.8
18.3
During the quarter, Thermax bagged an INR5b order from a
fertilizer company for three natural gas-based co-generation
plants of 20MW each.
Revenue is likely to grow 24% YoY, supported by execution pick-
up in the energy segment (+30% YoY) and an improvement in
orders available for execution. Operating margin is expected to
improve by 50bp to 12%.
Ordering activity remains muted in a weak macro environment.
We believe ordering activity has remained at the base level, with
Thermax announcing a single project worth INR5b. Maintain
Buy.
245.7 272.3 306.5
Key issues to watch
Demand environment in domestic and overseas markets.
Sustainability of margins in the chemical (17.3%) and
environment (8.1%) segments.
Thermax Consolidated
Y/E March
Sales
Change (%)
EBITDA
Change (%)
As of % Sales
Depreciation
Interest
Other Income
PBT
Tax
Effective Tax Rate (%)
Reported PAT
Change (%)
Adj PAT
Change (%)
1Q
9,791
-20.4
804
-21.2
8.2
194
32
231
809
277
34.3
532
(26.4)
490
(10.4)
FY17
2Q
3Q
10,703
9,440
-15.4
-22.6
919
875
-16.8
3.6
8.6
9.3
199
197
24
17
361
252
1,057
913
350
335
33.1
36.7
708
578
(4.8)
(5.5)
783
536
32.4
(1.2)
4Q
14,905
-0.2
1,732
30.9
11.6
229
25
297
1,775
598
33.7
1,177
1.9
615
(46.2)
1Q
8,718
-11.0
721
-10.3
8.3
189
16
241
757
284
37.5
473
(11.1)
406
(17.0)
FY18E
2Q
3Q
10,331 11,170
-3.5
18.3
952
955
3.6
9.1
9.2
8.5
189
208
51
25
236
238
947
961
370
378
39.0
39.3
578
583
(18.3)
0.9
568
586
(27.4)
9.3
FY17
4QE
18,412
23.5
2,220
28.2
12.1
194
8
361
2,379
784
33.0
1,594
35.5
1,598
159.8
44,831
-18.5
4,330
-3.4
9.7
819
97
1,141
4,554
1,560
34.3
2,230
(20.6)
3,063
8.5
FY18E
49,641
4,848
12.0
9.8
779
100
1,076
5,044
1,816
36.0
3,158
41.6
3,158
3.1
18 May 2018
20

In conversation
1. TATA STEEL : Bhushan steel would remain a listed subsidiary
post deal; T V Narendran, Managing Director and Chief Executive
Officer
Bhushan Steel will continue to be a listed subsidiary of Bamnipal Steel, which is
a special purpose vehicle (SPV) that company has setup. Bamnipal Steel will be
100% owned subsidiary of company and Bamnipal Steel will invest in Bhushan
Steel.
The company was ready to move on closure as soon as possible if the final
clearance came in from NCLAT.
Bhushan Steel's current capacity utilisation at between 3-3.5 million tonnes.
Problem more on the iron and steel making side of the business. Company plans
to remove bottlenecks to get upstream facilities to a capacity of 5-5.5 million
tonnes.
About half of company's Rs 35,200 offer for Bhushan steel would be financed by
internal cash reserves while the remaining will be borrowed to fund the deal.
The debt would be accounted for on the Balance Sheet of Bhushan Steel.
Company’s current cash reserves at roughly Rs 27,000 crore.
2. NESTLE INDIA: Find urban play more exciting than rural;
Suresh Narayanan, Chairman
The company is betting big on youth oriented product this fiscal.
India is a strong consumption economy and the earnings declared by most of
the consumption companies prove that fact.
Across the board, consumption is taking place either because of urbanisation or
because of improvements in income or because of participation of greater
number of women in workforce etc. This is likely to continue for some more
time.
3. DHFL: Expect to see 20% growth in fy19 loan disbursal; Kapil
Wadhawan, Chairman and Managing Director
Company has launched Rs 12,000 crore non-convertible debentures (NCD) issue.
Proceeds will be used to support growth in the affordable housing segment.
The base issue size will be Rs 3,000 crore with a right to retain an over
subscription of Rs 9,000 crore. So, the total issue size in this tranche would be
about Rs 12,000 crore.
Will look to borrow close to Rs 50,000 crore in FY19 for lending activities. 75% or
rather 100% of the money proceeds will be deployed towards affordable
housing segment.
Expect to see 20% growth in FY19 loan disbursal.
18 May 2018
21

From the think tank
1. India in a summer of emerging market stress
Emerging market economies have been feeling some extra heat this month.
Argentina and Turkey have been the worst hit. Their currencies have been
hammered as the dollar has rallied on expectations that US interest rates will rise
more sharply than earlier expected. The yield curve in that country has steepened
as fears of higher inflation have become more widespread. What about India? The
past few weeks show that investors are more worried about emerging market
economies that have worries about inflation, fiscal balance and external funding.
India is not in the danger zone by any stretch of the imagination, especially when
compared to its fragile position in July 2013. Yet, the warning signals should not
be ignored. The Indian rupee, the Indonesian rupiah and the Philippine peso have
been among the worst-performing currencies in the Asian region. Bonds in these
three markets have also faced selling pressure. The rupee this week slumped past
68 to a US dollar for the first time since January 2017. The yield on the benchmark
10-year Indian government bond hit a three-year high on Tuesday.
2. Runaway growth, not enough runways
First, the good news for India’s aviation industry: passenger volumes have
almost doubled in four years and are growing at the fastest pace in the world.
The bad news? India’s airport infrastructure is jammed to capacity and
struggling to keep pace with the rush of passengers and planes. One passenger
on a recent 60-minute flight from Amritsar to Delhi found that even at 11 p.m.,
the plane had to circle overhead for an extra 30 minutes before getting landing
clearance. Such stories now are becoming commonplace because the Delhi and
Mumbai skies are congested from early morning to late night. And the
situation’s about to get worse. India's top airlines have placed orders for over
1,000 planes in the coming decade. Many will arrive this fiscal year. Satyan
Nayar, Secretary General of the Association of Private Operators (APAO), says he
expects Indian carriers to induct 125 planes in fiscal 2019 “to capitalise on
strong domestic air passenger growth,” adding to the 500 planes already plying
the skies for scheduled airlines.
3. How can we maximize hyperloop's benefits?
In the first part of this series, we described the emergence of a Mumbai-Pune
megalopolis on the assumption that there will be no change in Mumbai’s extant
geophysical, infrastructural and regulatory constraints. In this part, we relax that
assumption, describe how a Hyperloop line might force infrastructural and
regulatory innovations in Mumbai, and examine the role of policy in shaping the
emergent megalopolis. Unlike other financial capitals of the world, Mumbai is not
a “skyscraper city” because floor space index (FSI) regulations severely restrict
vertical growth. These regulations, first formulated in 1964, were designed to
decongest certain areas, but they have failed to deliver on that promise. Instead,
with time, the regulations have only regressed, becoming, on the one hand,
mostly uniform across the city (instead of being progressively differentiated to
accommodate more building density in “downtown” areas and along
transportation corridors), and, on the other, even more restrictive than before.
18 May 2018
22

4. The Chinese conundrum: India’s road ahead
Indian Prime Minister Narendra Modi’s ‘Informal Summit’ with the Chinese
President Xi Jinping in Wuhan stoked a lot of attention among the
commentators in both the countries. While some have hailed this as a major
icebreaker post the Doklam standoff, others have urged a more guarded
approach to Chinese overtures. Also, the latest round of the Regional
Comprehensive Economic Partnership (RCEP) negotiations was held in Singapore
in the first week of May. The RCEP is a proposed free trade agreement (FTA)
between the 10 ASEAN countries and their six FTA partners—Australia, China,
India, Japan, South Korea and New Zealand. It accounts for 25% of global GDP,
30% of global trade, 26% of FDI flows and 45% of the world’s population. From
India’s point of view, the RCEP is critical, more so because China is part of the
trade bloc. The RCEP countries account for almost 27% of India’s total trade.
Exports to the RCEP account for about 15% of India’s total exports and imports
from the RCEP comprise 35% of India’s total imports. India runs a trade deficit
with the ASEAN as well as the partner countries of the RCEP
International
5. The debt shackles return
Global growth is accelerating. But before we break out the champagne, we
should acknowledge the long-term risks to sustained expansion posed by rising
private and public debt. Market analysts view the uptick in private lending in
most emerging and some developed economies as a sign of higher demand and
a precursor of faster growth. But, while this is true in the short run, the
relentless rise of overall debt remains among the most serious problems
burdening the global economy. Despite years of deleveraging after the 2008
global financial crisis, debt remains very high – and yet we have now returned to
an expansionary credit cycle. According to the Bank for International
Settlements, total non-financial private and public debt amounts to almost
245% of global GDP, having risen from 210% before the financial crisis and
around 190% at the end of 2001.
18 May 2018
23

Click excel icon
for detailed
valuation guide
Valuation snapshot
Company
Automobiles
Amara Raja
Ashok Ley.
Bajaj Auto
Bharat Forge
Bosch
CEAT
Eicher Mot.
Endurance Tech.
Escorts
Exide Ind
Hero Moto
M&M
Mahindra CIE
Maruti Suzuki
Motherson Sumi
Tata Motors
TVS Motor
Aggregate
Banks - Private
Axis Bank
DCB Bank
Equitas Hold.
Federal Bank
HDFC Bank
ICICI Bank
IDFC Bank
IndusInd
J&K Bank
Kotak Mah. Bk
RBL Bank
South Indian
Yes Bank
Aggregate
Banks - PSU
BOB
BOI
Canara
Indian Bk
PNB
SBI
Union Bk
Aggregate
NBFCs
Aditya Birla Cap
Bajaj Fin.
Capital First
Cholaman.Inv.&Fn
Dewan Hsg.
GRUH Fin.
HDFC
HDFC Stand. Life
Indiabulls Hsg
L&T Fin Holdings
LIC Hsg Fin
Reco
Buy
Buy
Buy
Buy
Neutral
Buy
Buy
Buy
Neutral
Buy
Neutral
Buy
Buy
Buy
Buy
Buy
Neutral
CMP TP % Upside
EPS (INR)
EPS Gr. YoY (%)
P/E (x)
P/B (x)
ROE (%)
(INR) (INR) Downside FY18E FY19E FY20E FY18E FY19E FY20E FY18E FY19E FY18E FY19E FY18E FY19E
869 1000
154 179
2819 3550
726 869
17939 19096
1395 1845
30495 35572
1203 1530
951
982
258 301
3554 4052
850 914
239 274
8710 10468
331 437
315 565
591 635
15
16
26
20
6
32
17
27
3
16
14
8
15
20
32
79
8
28.3
5.4
147.9
20.0
459.1
64.0
799.6
29.1
39.1
8.2
185.1
39.7
9.6
266.7
8.1
24.8
13.9
34.0 40.0
7.2
9.2
167.8 197.2
26.4 34.8
582.9 694.4
84.9 115.3
1,050.3 1,347.1
38.4 51.0
49.5 59.0
10.1 12.8
201.2 229.1
46.9 51.2
13.7 16.6
349.9 444.8
12.5 17.5
57.0 65.7
19.7 28.8
0.9
28.8
4.8
52.8
-3.0
-31.5
27.0
23.8
103.5
0.4
9.5
45.1
107.8
7.3
5.0
25.2
18.7
17.0
-92.8
13.8
-82.3
-1.3
19.4
-31.0
0.3
25.2
LP
21.3
27.3
-25.5
26.3
4.0
20.3
33.1
13.5
32.1
27.0
32.8
31.3
32.0
26.5
23.5
8.6
18.0
43.1
31.2
54.7
129.8
41.5
47.3
1,648
22.4
710.5
21.3
16.9
68.7
7.2
37.9
13.5
24.5
46.1
77.8
31.7
44.7
17.6
27.1
17.5
31.7
19.1
35.8
28.3
32.9
19.3
26.1
13.9
9.3
20.5
27.1
39.6
15.3
46.1
20.6
30.8
28.4
19.1
36.4
39.1
21.8
38.1
41.4
24.3
31.5
19.2
21.4
24.9
32.7
40.9
12.7
42.4
25.4
25.6
21.3
16.8
27.5
30.8
16.4
29.0
31.3
19.2
25.5
17.7
18.1
17.4
24.9
26.4
5.5
29.9
17.2
27.8
19.4
22.7
14.3
25.6
16.6
13.1
23.0
5.2
31.3
23.2
8.0
14.2
22.4
14.6
15.1
28.7
8.1
NM
13.0
NM
16.6
27.8
33.5
12.9
21.4
12.0
58.1
38.5
74.4
10.9
19.0
11.0
5.0
6.5
4.3
7.0
5.7
2.2
11.8
7.8
3.9
4.1
6.0
3.5
2.4
6.3
7.4
1.5
9.7
4.4
2.2
2.3
2.5
1.3
4.9
1.8
0.9
4.9
0.5
4.8
3.2
0.9
3.1
3.3
0.8
0.5
0.5
0.9
0.5
1.0
0.4
0.8
4.3
5.4
3.9
5.9
5.1
1.9
8.9
6.5
3.3
3.7
5.4
3.1
2.1
5.4
6.2
1.2
7.8
3.7
2.0
2.0
2.3
1.2
3.8
1.7
0.9
4.2
0.5
4.4
3.0
0.9
2.6
2.8
17.3
24.3
23.9
20.9
15.2
10.3
35.2
21.0
18.3
12.9
33.8
14.6
10.4
18.5
19.2
13.2
25.1
17.4
0.5
10.9
1.4
8.3
17.9
6.7
6.8
16.5
9.1
10.9
11.6
6.6
17.7
10.2
18.0
27.6
24.6
23.3
17.5
12.5
35.0
22.6
18.7
14.4
32.1
14.8
13.1
21.4
25.4
24.3
29.0
21.5
7.4
11.1
10.7
9.0
16.9
10.8
6.9
19.6
9.9
12.0
13.3
11.0
19.9
12.6
Buy
Neutral
Buy
Buy
Buy
Buy
Neutral
Buy
Buy
Buy
Buy
Buy
Buy
540
189
170
83
2027
296
42
1913
52
1269
513
26
345
600
198
185
127
2400
380
65
2150
100
1400
650
34
444
11
5
9
54
18
28
54
12
93
10
27
29
29
1.1
8.0
0.9
4.8
67.8
10.6
3.0
60.2
8.8
32.5
15.1
1.9
18.4
19.4
9.7
7.5
5.8
79.3
17.8
3.2
83.0
10.0
40.5
22.1
3.3
24.3
35.8
11.5
11.9
8.2
94.5
24.1
3.8
104.4
14.4
50.1
29.5
4.6
32.1
84.1 485.5
17.9 23.8
58.1 184.0
42.4 17.4
19.3 29.9
35.2 28.0
19.2 14.0
25.8 31.8
43.6 5.9
23.6 39.0
33.6 33.9
38.8 14.2
32.3 18.7
33.1 32.5
75.6 38.2
91.8 NM
378.2 NM
22.1 11.5
LP
NM
81.6 85.1
LP
NM
126.8 0.0
42.1
34.2
27.5
19.1
22.8
20.4
18.9
25.8
20.9
49.3
18.7
39.3
46.2
16.8
25.8
16.5
67.7
44.7
89.6
13.1
26.2
12.5
Buy
Neutral
Neutral
Buy
Neutral
Buy
Neutral
130
96
240
302
76
243
85
185
112
266
371
85
362
97
42
17
11
23
11
49
14
3.4
-18.8
-63.5
26.2
-50.3
2.9
-56.5
8.9
6.3
8.3
37.3
-9.6
18.7
-1.5
15.7 -43.1 161.5
12.1 Loss LP
39.9
PL
LP
45.6 -10.4 42.5
8.0
PL Loss
34.0 861.1 553.8
5.7
PL Loss
PL
LP
0.8 2.0 5.0
0.5 -7.7 3.0
0.6 -12.2 1.8
0.8 8.3 11.0
0.6 -29.6 -6.8
0.9 -0.3 5.7
0.4 -23.8 -0.7
0.8 -4.8 4.6
Buy
Buy
Buy
Buy
Buy
Neutral
Buy
Buy
Buy
Buy
Neutral
148
2067
574
1605
618
671
1875
495
1182
177
494
215
2450
960
1930
765
600
2225
475
1650
240
610
46
19
67
20
24
-11
19
-4
40
35
23
3.8
5.3
7.5
NA 41.5
44.8 61.7 82.8 39.8 37.8
34.2 44.6 56.8 38.9 30.2
62.3 75.0 89.3 35.5 20.4
37.4 51.7 63.5 26.2 38.4
9.9 11.6 13.9 21.9 16.6
42.0 48.7 57.9 5.3 16.1
5.5
6.6
8.4 23.5 20.4
90.2 108.8 131.5 31.5 20.6
6.8
9.3
13.9 29.5 37.4
39.4 45.0 53.5 3.0 14.3
3.8 3.0 12.4 12.1
7.3 6.1 20.2 19.9
2.2 1.9 13.7 15.6
4.9 4.0 20.6 20.7
2.2 1.9 14.1 17.4
19.9 16.5 32.6 31.0
5.0 4.4 18.4 17.5
3.2 2.7 21.7 21.7
3.9 3.3 30.7 33.2
2.9 2.5 13.4 14.1
2.0 1.8 17.0 17.2
18 May 2018
24

Click excel icon
for detailed
valuation guide
CMP
(INR)
601
470
414
1270
590
2197
1445
TP % Upside
EPS (INR)
(INR) Downside FY18E FY19E FY20E
750
25
24.4 31.1 38.9
600
28
14.5 20.7 26.5
470
14
43.0 44.8 48.9
1750
38
49.9 65.7 87.3
740
25
32.9 39.0 46.0
2800
27
100.8 145.9 175.9
1950
35
69.1 118.2 141.5
EPS Gr. YoY (%)
FY18E FY19E FY20E
62.2 27.5 25.2
104.9 42.9 27.9
45.6 4.1 9.2
57.7 31.8 32.9
13.0 18.5 18.1
19.5 44.8 20.6
24.7 71.0 19.8
26.7 27.5 24.4
Valuation snapshot
P/E (x)
P/B (x)
ROE (%)
FY18E FY19E FY18E FY19E FY18E FY19E
24.6
19.3 3.7 3.2 21.3 17.8
32.4
22.7 3.1 2.8 10.5 13.1
9.6
9.2
2.1 1.8 24.1 21.4
25.5
19.3 3.4 3.0 14.3 16.5
17.9
15.1 2.8 2.4 16.7 16.9
21.8
15.1 2.6 2.3 12.7 16.3
20.9
12.2 2.6 2.2 13.1 19.5
31.5 24.7 4.6 3.9 14.5 15.9
62.0
19.2
25.2
50.3
47.7
67.4
32.4
23.2
36.7
48.1
21.7
28.1
53.0
45.8
42.2
13.7
32.4
31.3
36.0
29.5
36.7
52.9
22.8
46.2
65.7
34.9
57.4
45.0
36.6
22.3
42.2
46.9
39.0
62.0
64.9
49.0
47.8
42.8
NM
51.3
35.7
64.1
30.3
57.1
45.0
17.2
22.0
34.3
39.9
41.2
24.1
21.3
33.5
37.7
19.9
23.7
38.9
38.6
33.7
12.9
27.4
26.2
26.7
23.1
18.1
38.0
11.1
20.1
24.9
28.3
23.1
22.0
18.2
12.0
32.4
32.6
24.9
51.1
52.0
41.6
41.2
35.2
192.3
44.6
31.6
54.2
27.9
43.0
7.2 6.5 11.6 14.3
3.2 2.9 16.6 16.7
0.9 0.9 3.6 4.0
8.7 7.8 18.1 24.0
19.6 15.6 48.7 43.5
1.1 1.1 1.7 2.7
5.2 4.8 16.5 20.7
3.3 3.1 13.9 14.1
8.0 7.0 23.5 22.3
9.0 7.9 18.7 21.0
5.0 4.1 23.1 20.8
3.5 3.2 13.0 14.0
4.8 4.5 9.1 11.5
9.3 7.8 21.9 22.0
4.8 4.3 11.9 13.6
2.2 1.9 17.1 16.0
5.2 4.5 16.9 17.6
3.4 3.2 11.0 12.1
2.1
2.9
1.7
4.5
1.5
0.8
3.1
4.7
2.5
5.1
2.3
1.8
6.4
4.2
3.2
14.9
20.1
23.8
11.5
11.7
9.7
11.8
7.2
48.0
6.6
7.5
2.0
2.8
1.6
4.1
1.3
0.8
2.8
4.1
2.3
4.3
2.1
1.5
5.5
3.8
2.9
13.7
17.3
22.4
10.4
10.3
9.2
9.2
6.4
44.7
6.2
7.2
6.1
10.1
4.6
8.9
6.9
1.7
4.8
14.3
4.4
11.9
6.5
9.7
16.3
9.3
8.1
25.3
33.9
49.9
25.9
29.2
-1.8
24.9
21.2
78.1
22.3
13.4
7.8
12.4
8.9
11.3
12.9
3.9
11.7
15.6
10.3
21.2
12.0
15.6
18.2
12.2
11.5
27.9
35.8
55.5
26.5
31.3
4.9
23.2
21.4
85.5
23.0
17.1
Company
MAS Financial
M&M Fin.
Muthoot Fin
PNB Housing
Repco Home
Shriram City Union
Shriram Trans.
Aggregate
Capital Goods
ABB
Bharat Elec.
BHEL
Blue Star
CG Cons. Elec.
CG Power & Indu.
Cummins
Engineers India
GE T&D
Havells
K E C Intl
L&T
Siemens
Solar Ind
Thermax
Va Tech Wab.
Voltas
Aggregate
Cement
Ambuja Cem.
ACC
Birla Corp.
Dalmia Bharat
Grasim Inds.
India Cem
JK Lakshmi Ce
Ramco Cem
Orient Cem
Prism Johnson
Sagar Cements
Sanghi Inds.
Shree Cem
Ultratech
Aggregate
Consumer
Asian Paints
Britannia
Colgate
Dabur
Emami
Future Consumer
Godrej Cons.
GSK Cons.
HUL
ITC
Jyothy Lab
Reco
Buy
Buy
Neutral
Buy
Buy
Buy
Buy
Sell
Buy
Sell
Neutral
Buy
Neutral
Buy
Buy
Neutral
Buy
Neutral
Buy
Neutral
Neutral
Buy
Buy
Neutral
1229
125
79
758
247
77
746
146
378
540
389
1364
1047
1116
1184
455
584
1060
196
80
860
270
90
1040
200
430
630
410
1690
1185
1100
1350
700
620
-14
56
1
13
10
17
39
37
14
17
5
24
13
-1
14
54
6
19.8
6.5
3.2
15.1
5.2
1.1
23.0
6.3
10.3
11.2
17.9
48.6
19.8
24.4
28.0
33.3
18.0
27.3
7.3
3.6
22.1
6.2
1.9
31.0
6.9
11.3
14.3
19.6
57.6
26.9
28.9
35.1
35.2
21.3
32.1 8.1 37.7 17.7
7.8
3.7 11.4 7.6
4.3 135.9 14.2 19.4
29.6 17.0 46.8 33.8
7.5 14.3 19.5 22.0
3.0 -72.2 63.3 58.8
36.8 -13.2 34.7 18.6
8.2 48.1 9.2 19.8
12.9 79.8 9.7 14.2
17.1 17.4 27.4 19.3
25.5 51.1 9.2 30.6
69.0 14.8 18.5 20.0
31.9 10.9 36.2 18.8
36.8 18.2 18.6 27.4
43.5 3.1 25.3 23.9
38.6 76.4 5.7 9.8
24.3 16.4 18.4 13.9
16.9 19.7 19.0
10.7
79.6
50.6
102.1
111.8
9.4
21.2
37.8
8.7
6.5
70.6
11.3
683.8
171.3
29.5
31.3
-30.5
34.0
-29.8
-48.5
-17.7
-11.9
LP
769.4
LP
59.3
1.1
-12.3
-6.0
34.9
28.1
102.8
39.1
105.6
129.3
163.8
23.4
148.6
105.1
101.0
86.0
30.3
43.8
56.8
31.9
31.0
26.0
41.3
14.2
41.8
40.5
27.6
62.2
32.7
39.7
32.5
35.1
41.3
29.5
Neutral
Neutral
Buy
Buy
Neutral
Neutral
Buy
Buy
Buy
Buy
Not Rated
Buy
Buy
Buy
217 255
1400 1747
728 1020
2747 3350
1084 1187
134 148
376 441
838 967
124 170
107 144
922
-
102 157
16384 19731
3954 4818
18
25
40
22
9
11
17
15
37
35
54
20
22
6.0
47.4
19.8
52.0
47.6
2.9
5.7
24.0
2.2
2.4
25.2
4.6
388.5
84.3
8.1
60.7
40.2
72.3
97.9
6.6
15.1
29.7
5.4
4.9
50.6
8.5
506.3
121.2
Neutral
Buy
Buy
Buy
Buy
Buy
Neutral
Neutral
Buy
Neutral
Neutral
1310
5469
1175
371
1039
58
1082
5942
1569
279
470
1280
6400
1420
435
1390
76
1155
6255
1805
295
425
-2
17
21
17
34
31
7
5
15
6
-10
21.1
84.2
24.0
7.8
24.3
-0.1
21.1
166.5
24.5
9.2
8.2
25.6 30.5 1.9 21.1 19.0
105.1 131.5 14.3 24.8 25.1
28.3 33.8 12.9 17.9 19.7
9.0
10.4 7.2 16.0 15.5
29.6 35.6 -8.5 21.9 20.4
0.3
1.1 Loss LP 276.5
24.3 28.1 11.7 14.9 15.9
187.8 215.6 6.6 12.8 14.8
29.0 35.4 24.7 18.3 22.3
10.0 11.3 9.5 8.8 13.4
10.9 13.0 -26.7 32.7 19.4
18 May 2018
25

Click excel icon
for detailed
valuation guide
CMP TP % Upside
EPS (INR)
Reco
(INR) (INR) Downside FY18E FY19E FY20E
Neutral
321 350
9
6.4
7.6
9.0
Neutral
9695 9535
-2
140.0 189.3 209.0
Buy
23510 27490
17
297.1 415.7 549.8
Buy
1073 1115
4
17.6 20.6 23.7
Neutral
9243 9065
-2
131.3 162.1 187.8
Not Rated 182
-
3.5
6.4
9.7
Buy
1121 1450
29
14.1 17.4 22.9
Neutral
3209 3510
9
32.6 56.9 78.5
EPS Gr. YoY (%)
FY18E FY19E FY20E
2.0 18.3 18.2
13.2 35.2 10.4
24.5 39.9 32.2
5.4 17.0 14.9
-1.2 23.4 15.8
-2.0 83.8 52.1
62.0 23.9 31.2
22.1 74.3 38.1
10.1 18.8 18.1
Valuation snapshot
P/E (x)
FY18E FY19E
50.1
42.3
69.2
51.2
79.1
56.5
60.9
52.0
70.4
57.0
52.3
28.4
79.7
64.3
98.3
56.4
50.3 42.4
18.9
22.4
20.4
12.2
59.3
19.3
21.1
26.5
17.3
55.0
15.9
13.0
56.4
24.0
12.9
17.0
21.1
30.4
18.0
12.3
22.3
22.3
21.3
38.2
9.7
21.7
23.8
16.3
11.7
26.0
17.4
23.1
P/B (x)
ROE (%)
FY18E FY19E FY18E FY19E
16.3 14.2 34.0 35.8
27.3 24.3 40.3 50.2
31.5 25.2 39.9 44.6
13.7 11.9 24.2 24.5
37.1 31.3 57.0 59.7
2.5 2.3 4.9 8.5
11.2 9.7 14.9 16.2
16.9 12.6 17.2 22.3
13.3 12.0 26.4 28.4
4.0 3.5 19.6 19.4
4.7 4.1 16.4 19.5
4.6 3.8 26.0 20.4
3.0 2.4 24.2 21.7
7.4 6.8 7.2 11.5
4.8 4.0 21.6 22.8
3.2 2.8 12.4 13.3
5.6 5.0 16.0 20.0
2.6 2.3 9.0 13.9
1.2 1.2 1.2 2.2
2.8 2.4 16.4 15.3
1.9 1.7 13.2 13.9
12.3 15.3 19.7 27.2
3.3 2.9 10.5 13.0
3.1 2.5 18.9 21.5
3.3 2.8 11.9 17.8
2.6 2.4 15.8 11.8
5.6 5.1 16.1 16.8
3.4 2.9 11.0 17.4
1.6 1.4 4.6 12.1
3.1 2.8 8.5 13.2
4.7 4.2 17.6 19.9
3.5 3.1 12.7 14.6
2.7
1.4
3.8
3.5
2.3
1.7
3.6
1.8
3.2
2.5
1.3
3.3
3.1
2.0
1.5
3.4
1.7
2.9
2.2
14.6
23.6
13.5
12.4
10.8
9.4
5.0
9.0
6.9
14.1
16.2
13.7
12.4
13.7
13.4
10.1
12.7
Company
Marico
Nestle
Page Inds
Pidilite Ind.
P&G Hygiene
Prabhat Dairy
United Brew
United Spirits
Aggregate
Healthcare
Alembic Phar
Alkem Lab
Ajanta Pharma
Aurobindo
Biocon
Cadila
Cipla
Divis Lab
Dr Reddy’s
Fortis Health
Glenmark
Granules
GSK Pharma
IPCA Labs
Jubilant Life
Laurus Labs
Lupin
Sanofi India
Shilpa Medicare
Strides Shasun
Sun Pharma
Torrent Pharma
Aggregate
Infrastructure
Ashoka Buildcon
IRB Infra
KNR Constructions
Sadbhav Engineering
Aggregate
Logistics
Allcargo Logistics
Concor
Gateway Distriparks
Aggregate
Media
Dish TV
D B Corp
Den Net.
Ent.Network
Hathway Cable
Hind. Media
HT Media
Jagran Prak.
Music Broadcast
PVR
Neutral
Buy
Buy
Buy
Neutral
Buy
Neutral
Neutral
Neutral
Buy
Neutral
Buy
Neutral
Buy
Buy
Buy
Buy
Buy
Buy
Buy
Buy
Neutral
476
2007
1054
595
640
387
553
1167
1980
152
524
103
2402
700
809
463
763
4927
436
503
480
1367
500
2500
1560
820
600
555
600
1100
2575
185
550
175
2500
750
1110
586
865
5600
686
989
675
1400
5
25
48
38
-6
43
8
-6
30
22
5
70
4
7
37
27
13
14
57
97
41
2
21.9
65.4
53.0
43.8
6.2
16.0
21.6
32.9
67.1
1.5
30.6
6.3
38.3
21.4
45.6
15.8
46.8
141.7
13.3
14.1
13.2
48.0
25.2 28.2 2.5 14.9 12.0 21.7
89.5 110.6 -12.4 36.9 23.6 30.7
51.6 65.0 -7.5 -2.6 25.9 19.9
48.7 53.6 11.4 11.2 10.1 13.6
10.8 19.8 -39.2 73.9 83.3 103.1
20.1 23.3 12.7 25.5 15.9 24.2
26.2 32.0 35.7 21.3 22.3 25.6
44.0 52.7 -17.7 33.9 19.7 35.5
114.1 146.1 -7.6 70.0 28.0 29.5
2.8
7.3 -85.8 87.8 164.5 103.2
32.9 41.1 -22.2 7.7 24.7 17.2
7.9
11.0 -12.4 25.2 38.7 16.3
42.6 48.5 11.5 11.2 13.7 62.7
29.2 37.3 33.2 36.6 27.7 32.7
62.6 72.5 23.3 37.3 15.9 17.8
27.3 34.3 -10.9 72.1 25.8 29.2
36.2 48.0 -17.4 -22.5 32.5 16.3
161.8 186.9 9.8 14.2 15.5 34.8
24.3 30.6 -5.0 82.4 25.9 32.8
40.8 55.7 -56.2 188.8 36.7 35.6
21.5 27.7 -49.6 63.3 28.8 36.4
61.3 78.5 -12.9 27.6 28.0 28.5
-17.2 29.2 25.3 27.5
7.0
26.0
14.0
16.0
8.3
26.5
18.2
17.4
LP 238.0 18.1 129.0
17.5 9.0 1.9 10.5
41.2 -17.3 30.2 18.0
27.1 14.9 8.6 27.4
18.3
-16.5
12.5
-32.1
2.9
PL
-13.8
Loss
-37.2
Loss
-7.5
78.9
-5.3
29.9
29.9
38.6
52.1
109.0
52.3
LP
16.4
LP
113.8
LP
0.1
-20.8
30.5
62.3
42.4
16.3
21.0
14.4
19.8
109.9
21.6
5,545
86.9
161.9
10.2
10.4
21.5
31.4
34.7
16.3
39.5
36.3
35.2
Buy
Neutral
Buy
Buy
267
251
303
381
290
290
375
460
9
15
24
21
2.1
23.9
16.9
13.9
Buy
Buy
Buy
133 198
1386 1553
170 199
48
12
17
8.2
35.1
4.7
11.4
53.4
9.8
13.2
64.6
11.2
Buy
Buy
Neutral
Buy
Buy
Neutral
Neutral
Buy
Buy
Buy
70
256
101
683
29
222
78
165
356
1409
101
324
90
820
47
237
92
215
469
1760
45
26
-11
20
60
7
18
30
32
25
-0.3
17.6
-2.9
7.2
-0.2
23.9
13.2
10.1
8.3
26.7
1.6
20.5
0.1
15.3
0.8
23.9
10.5
13.1
13.5
38.0
3.4
24.9
4.0
28.7
2.0
26.3
11.5
16.0
17.8
51.2
NM
43.4 16.6 12.0 -7.8 32.1
14.6
12.5 2.4 2.1 18.4 18.2
NM 1,422.4 2.3 2.3 -6.3 0.2
95.2
44.5 3.7 3.4 3.9 7.9
NM
38.6 2.1 2.0 -1.2 5.2
9.3
9.3
1.2 1.1 14.0 12.4
5.9
7.4
0.7 0.7 12.8 9.1
16.4
12.6 2.6 2.3 14.9 18.5
42.7
26.3 3.4 3.0 8.3 12.2
52.8
37.1 6.1 5.3 12.2 15.3
18 May 2018
26

Click excel icon
for detailed
valuation guide
CMP
(INR)
88
15
975
571
TP % Upside
EPS (INR)
(INR) Downside FY18E FY19E FY20E
130
48
2.5
5.8
7.9
27
80
-0.9
0.1
0.6
1200
23
27.7 35.0 40.6
690
21
14.5 16.5 19.7
EPS Gr. YoY (%)
FY18E FY19E FY20E
100.6 137.5 36.4
Loss LP 411.6
11.6 26.2 15.9
8.4 14.1 19.0
15.3 33.0 28.1
Valuation snapshot
P/E (x)
P/B (x)
ROE (%)
FY18E FY19E FY18E FY19E FY18E FY19E
35.9
15.1 3.7 2.3 11.6 18.9
NM 118.8 2.9 2.8 -15.8 2.4
35.1
27.8 8.3 7.6 25.2 28.4
39.4
34.5 7.3 6.2 19.6 19.4
36.6 27.5 5.2 4.6 14.2 16.6
12.4
14.2
NM
14.2
17.3
8.4
NM
10.5
13.0
8.5
13.9
42.9
9.8
15.7
41.3
14.4
8.0
8.0
29.0
15.6
8.1
13.2
11.2
15.7
15.5
11.4
82.4
10.9
74.4
54.9
21.3
14.6
25.7
18.3
20.9
23.5
29.2
25.7
23.2
19.9
30.5
26.4
17.0
14.7
23.1
20.9
8.9
11.2
40.1
10.9
7.6
8.2
17.7
7.1
9.8
6.8
9.9
28.2
9.5
14.5
26.1
13.7
9.8
9.4
24.7
16.2
9.2
8.9
8.7
13.7
13.5
10.4
59.3
8.6
57.7
42.5
19.3
13.6
22.5
16.9
19.4
21.3
23.0
20.8
19.0
17.1
26.3
23.2
16.0
14.5
18.2
19.8
1.4
3.5
0.8
2.9
1.5
1.5
0.9
2.1
1.7
1.3
1.6
11.7
2.2
1.8
6.5
2.0
2.2
1.4
5.6
4.1
1.7
1.0
1.1
3.4
1.9
1.5
1.4
2.9
0.8
2.4
1.3
1.3
0.8
1.7
1.6
1.1
1.5
8.9
1.9
1.7
5.4
1.8
1.9
1.3
4.7
3.8
1.5
0.9
1.0
2.9
1.7
1.4
12.8
26.7
-2.7
22.5
8.4
18.2
-1.0
22.9
13.3
17.8
11.7
30.7
24.1
11.9
16.7
15.0
28.2
18.5
20.7
28.0
21.3
7.4
9.6
23.7
13.0
13.2
15.5
28.6
2.1
23.9
18.3
17.2
4.8
26.3
17.1
17.4
14.7
35.9
21.6
12.0
22.7
14.0
20.6
14.4
20.8
24.4
16.8
10.5
12.0
22.9
13.2
13.1
Company
Prime Focus
Siti Net.
Sun TV
Zee Ent.
Aggregate
Metals
Hindalco
Hind. Zinc
JSPL
JSW Steel
Nalco
NMDC
SAIL
Rain Industries
Vedanta
Tata Steel
Aggregate
Oil & Gas
Aegis Logistics
BPCL
GAIL
Gujarat Gas
Gujarat St. Pet.
HPCL
IOC
IGL
Mahanagar Gas
MRPL
Oil India
ONGC
PLNG
Reliance Ind.
Aggregate
Retail
Jubilant Food
PC Jeweller
Titan Co.
Aggregate
Technology
Cyient
HCL Tech.
Hexaware
Infosys
KPIT Tech
L&T Infotech
Mindtree
Mphasis
NIIT Tech
Persistent Sys
Tata Elxsi
TCS
Tech Mah
Wipro
Zensar Tech
Aggregate
Reco
Buy
Neutral
Buy
Buy
Buy
Neutral
Buy
Buy
Buy
Buy
Sell
Buy
Buy
Neutral
233
300
256
332
75
115
76
250
277
610
371
336
349
394
120
215
71
426
345
705
59
12
36
19
60
87
-7
70
25
16
18.9
21.1
-8.5
23.3
4.3
13.6
-0.9
23.7
21.3
71.9
26.1
26.8
6.4
30.4
9.9
14.0
4.3
35.2
28.3
90.0
29.3 120.5 38.2 12.1
30.6 7.2 26.8 14.2
10.4 Loss LP 62.3
30.5 57.5 30.2 0.2
10.2 16.8 128.2 3.2
14.7 37.0 2.9 4.7
6.5 Loss LP 50.2
39.8 238.1 48.5 13.2
35.3 40.7 33.0 24.7
67.4 76.5 25.2 -25.1
72.9 40.6 7.0
12.3
46.5
24.6
41.6
13.9
37.8
21.7
12.5
54.6
12.3
28.1
23.5
18.8
74.9
74.2
-17.3
23.9
32.0
43.8
-2.9
-1.2
6.9
27.0
-13.3
-18.3
2.3
23.0
20.7
5.6
52.1
2.9
8.8
58.1
4.9
-17.8
-15.0
17.7
-3.6
-12.0
48.1
29.6
14.3
15.0
9.5
28.5
13.0
7.7
24.2
4.5
16.5
23.1
13.2
1.2
9.1
3.3
8.2
17.9
6.8
10.7
Buy
Buy
Sell
Buy
Neutral
Buy
Buy
Buy
Buy
Neutral
Buy
Buy
Buy
Buy
269 303
392 554
331 285
873 1122
182 191
317 536
165 261
273 416
871 1228
104 120
243 260
189 222
219 317
945 1150
13
41
-14
29
5
69
58
52
41
15
7
18
45
22
6.3
40.0
21.0
21.2
12.7
39.5
20.7
9.4
55.9
12.8
18.3
16.8
14.0
60.9
9.5
41.2
22.9
33.5
13.3
32.5
17.6
11.1
53.9
11.3
27.2
21.8
16.0
70.1
Neutral
Buy
Buy
2451 2450
169 520
937 1125
0
208
20
29.7
15.4
12.6
41.4
19.5
16.2
54.4 180.6 39.1 31.4
24.9 44.4 26.6 27.6
20.5 39.5 28.8 26.1
48.8 29.1 27.1
11.8
8.0
11.0
10.8
29.2
17.9
23.9
9.6
19.4
21.7
18.6
10.9
16.4
13.0
27.2
10.9
16.7 14.4 20.3 24.3
1.7 1.5 16.9 18.4
16.3 14.6 23.9 26.7
10.6 9.3 19.4 22.0
3.8
3.5
6.5
4.1
2.9
6.8
6.0
4.0
3.7
3.2
10.2
8.1
3.4
2.6
3.3
5.2
3.5
3.1
5.5
3.7
2.5
5.5
5.2
3.6
3.3
3.0
8.1
7.0
3.0
2.2
2.9
4.6
18.1
25.0
26.9
24.1
14.9
32.4
18.8
14.6
16.2
16.7
37.6
30.3
20.9
17.0
15.3
24.6
18.1
24.0
26.4
22.9
14.0
28.4
24.3
18.3
18.2
18.7
34.3
32.5
20.1
16.4
17.1
23.2
Neutral
Neutral
Sell
Buy
Neutral
Buy
Buy
Neutral
Neutral
Buy
Buy
Neutral
Buy
Neutral
Buy
813
912
427
1185
262
1558
1002
1133
1058
803
1183
3493
677
277
1220
800
1050
390
1330
250
1400
1000
960
1100
860
1400
3000
700
300
1400
-2
15
-9
12
-5
-10
0
-15
4
7
18
-14
3
8
15
38.2
62.6
16.6
64.8
12.5
66.3
34.4
44.0
45.6
40.4
38.7
132.1
39.8
18.9
52.8
42.2 47.1 24.8 10.3
66.9 72.2 4.5 6.9
18.9 21.0 21.2 14.2
70.1 77.7 3.1 8.3
13.5 17.5 5.1 7.8
73.3 86.3 19.5 10.5
43.5 53.9 38.0 26.7
54.6 59.8 13.2 23.9
55.7 66.6 19.8 22.3
47.0 57.2 7.2 16.4
45.0 53.4 37.7 16.2
150.5 166.9 -1.0 13.9
42.3 49.3 28.8 6.4
19.2 21.7 11.8 1.3
67.0 85.2 1.3 27.0
4.9 5.6
18 May 2018
27

Click excel icon
for detailed
valuation guide
Valuation snapshot
Company
Telecom
Bharti Airtel
Bharti Infratel
Idea Cellular
Tata Comm
Aggregate
Utiltites
Coal India
CESC
JSW Energy
NHPC
NTPC
Power Grid
Tata Power
Aggregate
Others
Arvind
Avenue Supermarts
BSE
Castrol India
Coromandel Intl
Delta Corp
Interglobe
Indo Count
Info Edge
Kaveri Seed
Manpasand
MCX
Navneet Education
Oberoi Realty
Phoenix Mills
Quess Corp
PI Inds.
Piramal Enterp.
SRF
S H Kelkar
Tata Chemicals
Team Lease Serv.
Trident
TTK Prestige
UPL
V-Guard
Reco
Buy
Neutral
Buy
Buy
CMP TP % Upside
EPS (INR)
EPS Gr. YoY (%)
P/E (x)
P/B (x)
ROE (%)
(INR) (INR) Downside FY18E FY19E FY20E FY18E FY19E FY20E FY18E FY19E FY18E FY19E FY18E FY19E
367
320
53
615
581
346
85
730
59
8
61
19
4.1
13.6
-9.6
3.5
1.9
13.7
-12.3
7.5
5.6 -63.3 -53.8 197.1
14.2 -8.1 0.4 3.6
-10.5 Loss Loss Loss
21.1 -67.2 115.3 182.9
-98.8 PL
LP
89.9
23.5
NM
177.3
2,975.6
15.3
11.9
24.0
10.8
12.9
12.6
15.2
13.5
194.8 2.1 2.1 2.4 1.1
23.4 3.5 3.6 15.6 15.2
NM
0.8 1.0 -16.0 -21.9
82.4 35.1 24.6 9.4 35.1
-131 2.2 2.3 0.1 -1.7
10.3
10.0
17.4
8.9
11.0
10.3
12.8
10.5
28.3
87.7
17.2
25.3
19.3
34.7
16.8
10.9
44.7
12.5
31.0
27.2
14.4
10.4
33.6
34.6
24.5
20.6
21.3
26.1
16.9
46.2
8.4
34.6
15.2
39.5
7.2
1.2
1.1
0.9
1.3
2.0
1.4
2.0
6.8
1.1
1.0
0.9
1.2
1.7
1.1
1.8
47.4
10.3
4.6
8.6
10.6
16.6
10.7
14.7
65.8
11.1
6.1
10.3
11.6
17.7
9.7
17.5
Buy
Buy
Sell
Buy
Buy
Buy
Sell
271
1020
73
26
167
213
82
397
1440
61
36
214
287
77
46
41
-16
36
28
34
-6
17.8 26.4 30.8 19.2 48.4 16.5
85.6 102.0 111.7 65.0 19.2 9.5
3.0
4.2
4.8 -21.2 37.9 16.1
2.4
3.0
3.2 -17.2 22.2 7.0
13.0 15.2 16.6 5.0 16.9 9.3
16.9 20.7 21.9 21.3 22.1 6.0
5.3
6.3
7.8
3.5 18.7 22.7
11.7 29.0 11.1
12.2
12.9
43.5
7.0
22.7
5.8
58.3
6.3
23.4
34.2
8.8
21.2
7.7
13.5
15.8
22.8
26.7
83.1
77.4
7.9
33.7
44.6
5.3
137.8
44.2
4.5
Neutral
Sell
Buy
Buy
Buy
Buy
Neutral
Neutral
Buy
Buy
Buy
Buy
Buy
Buy
Buy
Buy
Buy
Buy
Buy
Buy
Buy
Buy
Buy
Neutral
Buy
Neutral
420
1495
815
172
455
250
1178
81
1175
508
431
787
140
526
683
1179
826
2400
2232
253
743
2885
59
6096
709
235
460
900
1000
248
557
327
1318
95
1550
664
467
1050
195
654
737
1300
958
3500
2351
318
940
3400
83
5281
945
167
9
-40
23
44
22
31
12
18
32
31
8
33
39
24
8
10
16
46
5
26
26
18
40
-13
33
-29
14.8 20.3 -1.4 21.6 36.5 34.4
17.0 22.5 68.4 31.9 32.0 115.7
47.4 57.2 6.0 9.0 20.9 18.8
6.8
7.1
2.9 -2.8 4.0 24.6
23.5 27.9 38.8 3.7 18.4 20.0
7.2
10.2 89.8 24.5 41.4 43.2
70.2 94.1 35.1 20.4 34.1 20.2
7.4
8.7 -46.0 17.1 16.6 12.7
26.3 33.4 49.0 12.5 27.1 50.3
40.6 47.4 79.5 18.5 17.0 14.8
13.9 18.7 38.2 58.4 34.6 49.1
28.9 33.7 -14.6 36.5 16.6 37.1
9.8
11.5 4.7 27.4 17.6 18.3
50.3 48.6 21.4 271.7 -3.4 38.8
20.3 26.6 44.2 28.4 30.9 43.2
34.1 43.1 130.7 49.6 26.6 51.8
33.7 39.9 -20.2 26.3 18.5 31.0
116.4 147.9 14.5 40.0 27.1 28.9
105.0 138.3 -9.9 35.6 31.7 28.8
9.7
12.2 9.1 22.4 26.6 32.0
44.0 50.3 0.0 30.5 14.3 22.1
62.4 87.2 14.8 40.1 39.7 64.7
7.0
8.3 -21.8 32.7 18.7 11.2
176.1 203.2 4.4 27.8 15.4 44.2
46.7 55.6 5.9 5.6 19.2 16.0
6.0
6.7 25.3 32.9 12.1 52.5
2.9 2.7 8.6 9.8
20.0 17.2 18.9 21.1
1.4 1.2 7.6 6.8
16.7 15.7 69.1 63.8
4.3 3.7 22.1 20.6
4.2 3.8 12.3 11.5
6.4 6.0 41.3 37.0
1.7 1.4 13.9 14.1
6.6 6.0 13.7 14.0
3.6 3.2 23.4 27.1
4.0 3.7 7.2 12.3
2.9 2.8 7.9 10.4
4.2 3.6 24.2 26.9
2.9 2.4 7.8 25.1
3.7 2.9 9.6 9.6
6.5 5.2 22.3 21.7
5.9 5.0 20.7 22.1
2.2 2.0 8.9 10.2
3.7 3.3 13.3 16.3
4.1 3.7 13.4 14.9
2.0 1.9 11.3 11.5
10.8 8.7 18.2 20.9
1.0 0.9 9.2 11.4
7.6 6.8 18.0 20.7
3.9 3.2 26.9 23.3
12.8 10.2 26.9 28.8
18 May 2018
28

MOSL Universe stock performance
Company
Automobiles
Amara Raja
Ashok Ley.
Bajaj Auto
Bharat Forge
Bosch
CEAT
Eicher Mot.
Endurance Tech.
Escorts
Exide Ind
Hero Moto
M&M
Mahindra CIE
Maruti Suzuki
Motherson Sumi
Tata Motors
TVS Motor
Banks - Private
Axis Bank
DCB Bank
Equitas Hold.
Federal Bank
HDFC Bank
ICICI Bank
IDFC Bank
IndusInd
J&K Bank
Kotak Mah. Bk
RBL Bank
South Indian
Yes Bank
Banks - PSU
BOB
BOI
Canara
Indian Bk
PNB
SBI
Union Bk
NBFCs
Aditya Birla Cap
Bajaj Fin.
Capital First
Cholaman.Inv.&Fn
Dewan Hsg.
GRUH Fin.
HDFC
HDFC Stand. Life
Indiabulls Hsg
L&T Fin.Holdings
LIC Hsg Fin
M&M Fin.
Muthoot Fin
1 Day (%)
0.9
1.1
0.4
-0.3
-1.2
-1.0
-0.2
2.3
-0.7
1.0
-0.6
-0.4
0.3
0.1
-0.7
1.5
-3.2
-1.8
0.1
2.9
-1.2
0.1
-0.7
1.8
-0.7
-0.5
-1.0
-0.2
0.4
-1.2
-1.6
0.6
-0.5
0.3
1.2
0.1
0.9
1.3
7.7
2.5
4.4
0.6
-1.5
-2.1
-0.6
-0.4
2.2
-0.5
0.9
-1.5
1M (%)
6.0
3.6
-1.5
-1.4
-7.6
-14.1
-1.8
-9.7
-2.8
6.8
-5.7
5.0
10.8
-4.9
-3.7
-6.5
-12.4
1.3
-6.6
12.2
-16.7
4.1
1.4
-14.0
2.4
-13.6
8.9
0.1
-1.5
12.1
-11.9
-13.1
-12.8
-5.2
-22.1
-2.0
-12.8
-6.7
6.9
-11.9
1.3
4.8
3.9
-0.8
0.6
-13.0
2.2
-12.0
-7.2
-5.8
12M (%)
-7.3
75.9
-7.0
29.3
-26.0
-24.4
4.7
49.1
45.5
6.2
-2.4
23.4
-1.8
25.3
19.5
-29.9
10.9
7.3
-3.8
2.7
-28.0
30.1
5.1
-33.5
34.3
-40.3
33.4
-9.0
0.4
18.7
-32.2
-48.2
-35.8
-15.8
-53.7
-20.9
-52.6
Company
MAS Financial Serv.
PNB Housing
Repco Home
Shriram City Union
Shriram Trans.
Capital Goods
ABB
Bharat Elec.
BHEL
Blue Star
CG Cons. Elec.
CG Power & Inds Sol.
Cummins
Engineers India
GE T&D
Havells
K E C Intl
L&T
Siemens
Solar Ind
Thermax
Va Tech Wab.
Voltas
Cement
Ambuja Cem.
ACC
Birla Corp.
Dalmia Bharat
Grasim Inds.
India Cem
JK Lakshmi Ce
Ramco Cem
Orient Cem
Prism Johnson
Sagar Cements
Sanghi Inds.
Shree Cem
Ultratech
Consumer
Asian Paints
Britannia
Colgate
Dabur
Emami
Future Consumer
Godrej Cons.
GSK Cons.
HUL
ITC
Jyothy Lab
Marico
Nestle
Page Inds
Pidilite Ind.
1 Day (%)
-1.2
0.0
-0.2
0.3
0.5
-0.3
3.0
0.1
-0.1
7.9
0.5
1.7
0.5
-0.4
-1.0
0.3
0.0
-0.8
0.4
0.4
-0.1
-1.3
2.7
-0.7
5.2
-0.3
0.0
0.4
-1.8
0.6
2.5
-1.7
-0.9
1.5
-0.6
-0.8
-0.8
-1.7
0.1
-0.8
-0.3
2.0
-1.1
-0.1
-0.3
-2.4
20.0
0.9
0.6
-0.3
-1.9
1M (%)
-0.2
-5.3
-4.5
0.1
-7.7
-2.7
-9.8
-9.7
-2.9
9.9
-7.1
2.9
-6.9
1.0
-1.9
-9.0
0.3
-2.8
5.2
3.7
-10.8
-8.7
-11.2
-11.6
-3.9
-3.3
-1.0
-12.0
-10.5
0.9
-12.3
-10.0
-0.4
-12.0
-3.3
0.9
11.4
2.2
6.9
8.1
-8.4
-2.9
0.6
0.8
8.5
4.2
27.6
0.3
7.5
-5.2
3.3
12M (%)
-3.6
-23.0
-2.4
42.9
-21.2
-23.4
-30.3
12.9
2.0
-17.8
-26.7
-15.7
0.7
6.1
58.5
16.6
-25.3
34.9
16.7
-33.1
35.6
-15.9
-17.6
-6.0
8.2
10.9
-38.5
-26.9
18.0
-22.8
-14.8
2.8
20.5
-13.1
-11.7
13.5
49.1
20.3
34.5
-4.0
76.5
16.5
11.9
55.9
-1.0
23.2
4.1
47.9
56.6
38.7
56.3
-20.7
54.0
43.8
60.2
20.8
9.5
33.9
-28.4
41.1
4.8
18 May 2018
29

MOSL Universe stock performance
Company
P&G Hygiene
Prabhat Dairy
United Brew
United Spirits
Healthcare
Alembic Phar
Alkem Lab
Ajanta Pharma
Aurobindo
Biocon
Cadila
Cipla
Divis Lab
Dr Reddy’s
Fortis Health
Glenmark
Granules
GSK Pharma
IPCA Labs
Jubilant Life
Lupin
Laurus Labs
Sanofi India
Shilpa Medicare
Strides Shasun
Sun Pharma
Torrent Pharma
Infrastructure
Ashoka Buildcon
IRB Infra.Devl.
KNR Construct.
Sadbhav Engg.
Logistics
Allcargo Logistics
Concor
Gateway Distriparks
Media
Dish TV
D B Corp
Den Net.
Ent.Network
Hathway Cab.
Hind. Media
HT Media
Jagran Prak.
Music Broadcast
PVR
Prime Focus
Siti Net.
Sun TV
Zee Ent.
Metals
Hindalco
Hind. Zinc
JSPL
1 Day (%)
-1.5
0.6
0.2
-0.3
-0.8
-1.3
-0.7
-1.2
-0.4
0.8
-1.2
0.1
-0.7
0.3
1.2
6.6
-1.0
-0.5
-0.6
-0.5
0.5
0.4
-0.9
0.8
1.7
0.7
0.2
-0.5
-0.3
-1.7
4.5
-1.0
2.9
-0.6
-3.4
0.0
0.2
0.5
1.3
-1.6
-0.4
1.0
-0.5
0.5
-2.9
-0.5
-1.0
-2.8
0.7
1.1
1M (%)
-5.7
2.5
4.2
-8.0
-6.1
14.9
-23.4
-4.0
2.2
-0.4
-4.6
-1.0
-5.9
4.8
-8.6
-5.3
0.9
-2.6
-0.4
-5.1
-7.8
-3.0
-8.8
-22.8
-6.4
2.2
1.0
-2.4
-3.8
-4.0
-11.2
1.5
-3.5
-12.2
-18.9
-2.5
-2.2
-27.4
1.9
-10.9
5.8
-8.4
5.8
-2.5
-7.1
10.7
-0.8
-2.8
-5.7
1.9
12M (%)
20.5
47.9
37.8
51.2
-21.8
5.6
-36.0
-2.1
93.4
-19.1
-1.1
88.3
-27.5
-26.5
-24.9
-31.7
-0.9
28.6
7.1
-41.2
-19.5
18.2
-37.9
-50.9
-26.2
2.5
23.2
-2.2
43.2
13.3
-27.3
15.9
-30.6
-31.6
-30.1
-0.9
-14.2
-29.4
-22.2
-13.1
-12.9
3.1
-7.9
-24.8
-53.1
9.6
9.0
17.6
18.9
120.2
Company
JSW Steel
Nalco
NMDC
Rain Industries
SAIL
Vedanta
Tata Steel
Oil & Gas
Aegis Logistics
BPCL
GAIL
Gujarat Gas
Gujarat St. Pet.
HPCL
IOC
IGL
Mahanagar Gas
MRPL
Oil India
ONGC
PLNG
Reliance Ind.
Retail
Jubilant Food
PC Jeweller
Titan Co.
Technology
Cyient
HCL Tech.
Hexaware
Infosys
KPIT Tech
L&T Infotech
Mindtree
Mphasis
NIIT Tech
Persistent Sys
Tata Elxsi
TCS
Tech Mah
Wipro
Zensar Tech
Telecom
Bharti Airtel
Bharti Infratel
Idea Cellular
Tata Comm
Utiltites
Coal India
CESC
JSW Energy
NHPC Ltd
NTPC
Power Grid
Tata Power
1 Day (%)
-1.3
-0.2
-0.6
5.6
3.4
-0.5
-1.9
0.8
-1.9
-0.1
-1.0
3.3
-0.3
-0.9
1.3
0.6
-1.5
2.4
0.9
8.1
-1.2
-0.2
-1.5
0.6
-0.3
-0.9
-1.6
-0.4
0.4
-2.3
-0.5
3.2
-1.7
0.4
1.5
-0.1
0.6
1.1
-0.7
-2.3
1.8
-0.1
-1.5
2.5
-1.6
-0.3
0.2
-1.3
0.0
0.5
1M (%)
7.6
-3.8
-7.7
-27.3
-1.4
-4.4
2.4
-4.6
-4.6
1.6
1.6
-2.2
-3.8
-1.4
-6.7
-2.7
-4.8
11.3
4.4
-9.7
0.2
-2.6
-44.7
-6.1
24.6
-9.8
3.3
5.3
15.1
12.4
13.4
26.4
13.3
17.1
10.4
10.3
1.3
-2.8
21.1
-3.9
-3.9
-26.2
-1.4
-5.6
-1.9
-13.1
-3.5
-5.5
4.1
-6.8
12M (%)
60.8
10.9
-10.2
129.9
21.8
14.4
31.2
39.7
-19.2
7.9
10.9
6.1
-12.2
-25.8
34.2
-13.5
-23.0
13.5
2.5
-2.5
39.8
133.6
-26.1
94.3
54.6
6.7
70.0
24.4
103.8
100.6
97.7
93.9
102.5
37.2
51.4
42.5
56.9
9.7
35.9
-2.5
-17.9
-39.5
-8.8
-1.8
4.4
6.1
-14.5
5.1
2.5
-4.5
18 May 2018
30

MOSL Universe stock performance
Company
Others
Arvind
Avenue Super.
BSE
Castrol India
Coromandel Intl
Delta Corp
Interglobe
Indo Count
Info Edge
Kaveri Seed
Manpasand
MCX
Navneet Educat.
Oberoi Realty
Phoenix Mills
PI Inds.
Piramal Enterp.
Quess Corp
SRF
S H Kelkar
Tata Chemicals
Team Lease Serv.
Trident
UPL
V-Guard
1 Day (%)
-0.3
-0.1
0.0
-1.2
0.9
4.8
-1.8
1.1
-0.9
-0.2
2.5
-0.3
0.0
-1.1
0.3
1.8
-0.7
-0.6
-1.2
0.0
1.8
4.4
-1.2
-2.3
-0.3
1M (%)
0.4
-0.8
-1.6
-18.3
-14.7
-10.1
-20.8
-16.2
-4.7
-6.1
2.4
2.7
-6.2
2.5
16.3
-3.1
-7.7
11.6
3.7
1.3
0.7
31.9
-17.8
-6.6
-0.4
12M (%)
5.2
100.6
-24.0
-21.6
8.4
53.8
5.8
-58.5
34.2
-5.3
9.6
-26.4
-14.7
32.5
62.9
-2.0
-14.7
44.5
22.0
-11.5
16.5
147.8
-30.0
-14.6
9.0
18 May 2018
31

NOTES
18 May 2018
32

THEMATIC/STRATEGY RESEARCH GALLERY

REPORT GALLERY
RECENT INITIATING COVERAGE REPORTS
.
Rs

DIFFERENTIATED PRODUCT GALLERY

Explanation of Investment Rating
Investment Rating
BUY
SELL
NEUTRAL
UNDER REVIEW
NOT RATED
Expected return (over 12-month)
>=15%
< - 10%
> - 10 % to 15%
Rating may undergo a change
We have forward looking estimates for the stock but we refrain from assigning recommendation
Telecom
*In case the recommendation given by the Research Analyst becomes inconsistent with the investment rating legend, the Research Analyst shall within 28 days of the inconsistency, take appropriate measures to make the recommendation consistent with the investment rating legend.
Disclosures:
The following Disclosures are being made in compliance with the SEBI Research Analyst Regulations 2014 (herein after referred to as the Regulations).
Motilal Oswal Securities Ltd. (MOSL) is a SEBI Registered Research Analyst having registration no. INH000000412. MOSL, the Research Entity (RE) as defined in the Regulations, is engaged in the business of providing Stock broking services,
Investment Advisory Services, Depository participant services & distribution of various financial products. MOSL is a subsidiary company of Motilal Oswal Financial Service Ltd. (MOFSL). MOFSL is a listed public company, the details in respect of
which are available on
www.motilaloswal.com.
MOSL is registered with the Securities & Exchange Board of India (SEBI) and is a registered Trading Member with National Stock Exchange of India Ltd. (NSE) and Bombay Stock Exchange Limited
(BSE), Metropolitan Stock Exchange Of India Ltd. (MSE) for its stock broking activities & is Depository participant with Central Depository Services Limited (CDSL) & National Securities Depository Limited (NSDL) and is member of Association of
Mutual Funds of India (AMFI) for distribution of financial products. Details of associate entities of Motilal Oswal Securities Limited are available on the website at
http://onlinereports.motilaloswal.com/Dormant/documents/Associate%20Details.pdf
Regulatory Enquiries against Motilal Oswal Securities Limited by SEBI:
SEBI pursuant to a complaint from client Shri C.R. Mohanraj alleging unauthorized trading, issued a letter dated 29th April 2014 to MOSL notifying appointment of an Adjudicating Officer as per SEBI regulations to hold inquiry and
adjudge violation of SEBI Regulations; MOSL requested SEBI to provide all documents, records, investigation report relied upon by SEBI which were referred in Show Cause Notice. The matter is closed and MOSL had to pay Rs. 2
lakhs towards penalty for misplacement of original POA of client.
MOSL, it’s associates, Research Analyst or their relative may have any financial interest in the subject company. MOSL and/or its associates and/or Research Analyst may have beneficial ownership of 1% or more securities in the subject company at
the end of the month immediately preceding the date of publication of the Research Report.
MOSL and its associate company(ies), their directors and Research Analyst and their relatives may; (a) from time to time, have a long or short position in, act
as principal in, and buy or sell the securities or derivatives thereof of companies mentioned herein. (b) be engaged in any other transaction involving such securities and earn brokerage or other compensation or act as a market maker in the financial
instruments of the company(ies) discussed herein or act as an advisor or lender/borrower to such company(ies) or may have any other potential conflict of interests with respect to any recommendation and other related information and opinions.;
however the same shall have no bearing whatsoever on the specific recommendations made by the analyst(s), as the recommendations made by the analyst(s) are completely independent of the views of the associates of MOSL even though there
might exist an inherent conflict of interest in some of the stocks mentioned in the research report.
Research Analyst may have served as director/officer, etc. in the subject company in the last 12 month period. MOSL and/or its associates may have
received any compensation from the subject company in the past 12 months.
In the last 12 months period ending on the last day of the month immediately preceding the date of publication of this research report, MOSL or any of its associates may have:
a)
managed or co-managed public offering of securities from subject company of this research report,
b)
received compensation for investment banking or merchant banking or brokerage services from subject company of this research report,
c)
received compensation for products or services other than investment banking or merchant banking or brokerage services from the subject company of this research report.
d)
Subject Company may have been a client of MOSL or its associates during twelve months preceding the date of distribution of the research report.
MOSL and it’s associates have not received any compensation or other benefits from the subject company or third party in connection with the research report. To enhance transparency, MOSL has incorporated a Disclosure of Interest Statement in
this document. This should, however, not be treated as endorsement of the views expressed in the report. MOSL and / or its affiliates do and seek to do business including investment banking with companies covered in its research reports. As a result,
the recipients of this report should be aware that MOSL may have a potential conflict of interest that may affect the objectivity of this report. Compensation of Research Analysts is not based on any specific merchant banking, investment banking or
brokerage service transactions.
Terms & Conditions:
This report has been prepared by MOSL and is meant for sole use by the recipient and not for circulation. The report and information contained herein is strictly confidential and may not be altered in any way, transmitted to, copied or distributed, in part
or in whole, to any other person or to the media or reproduced in any form, without prior written consent of MOSL. The report is based on the facts, figures and information that are considered true, correct, reliable and accurate. The intent of this report
is not recommendatory in nature. The information is obtained from publicly available media or other sources believed to be reliable. Such information has not been independently verified and no guaranty, representation of warranty, express or implied,
is made as to its accuracy, completeness or correctness. All such information and opinions are subject to change without notice. The report is prepared solely for informational purpose and does not constitute an offer document or solicitation of offer to
buy or sell or subscribe for securities or other financial instruments for the clients. Though disseminated to all the customers simultaneously, not all customers may receive this report at the same time. MOSL will not treat recipients as customers by
virtue of their receiving this report.
Analyst Certification
The views expressed in this research report accurately reflect the personal views of the analyst(s) about the subject securities or issues, and no part of the compensation of the research analyst(s) was, is, or will be directly or indirectly related to the
specific recommendations and views expressed by research analyst(s) in this report.
Disclosure of Interest Statement
Analyst ownership of the stock
Companies where there is interest
No
A graph of daily closing prices of securities is available at
www.nseindia.com, www.bseindia.com.
Research Analyst views on Subject Company may vary based on Fundamental research and Technical Research. Proprietary trading desk of MOSL or
its associates maintains arm’s length distance with Research Team as all the activities are segregated from MOSL research activity and therefore it can have an independent view with regards to subject company for which Research Team have
expressed their views.
Regional Disclosures (outside India)
This report is not directed or intended for distribution to or use by any person or entity resident in a state, country or any jurisdiction, where such distribution, publication, availability or use would be contrary to law, regulation or which would subject
MOSL & its group companies to registration or licensing requirements within such jurisdictions.
For Hong Kong:
This report is distributed in Hong Kong by Motilal Oswal capital Markets (Hong Kong) Private Limited, a licensed corporation (CE AYY-301) licensed and regulated by the Hong Kong Securities and Futures Commission (SFC) pursuant to the Securities
and Futures Ordinance (Chapter 571 of the Laws of Hong Kong) “SFO”. As per SEBI (Research Analyst Regulations) 2014 Motilal Oswal Securities (SEBI Reg No. INH000000412) has an agreement with Motilal Oswal capital Markets (Hong Kong)
Private Limited for distribution of research report in Hong Kong. This report is intended for distribution only to “Professional Investors” as defined in Part I of Schedule 1 to SFO. Any investment or investment activity to which this document relates is only
available to professional investor and will be engaged only with professional investors.” Nothing here is an offer or solicitation of these securities, products and services in any jurisdiction where their offer or sale is not qualified or exempt from
registration. The Indian Analyst(s) who compile this report is/are not located in Hong Kong & are not conducting Research Analysis in Hong Kong.
For U.S.
Motilal Oswal Securities Limited (MOSL) is not a registered broker - dealer under the U.S. Securities Exchange Act of 1934, as amended (the"1934 act") and under applicable state laws in the United States. In addition MOSL is not a registered
investment adviser under the U.S. Investment Advisers Act of 1940, as amended (the "Advisers Act" and together with the 1934 Act, the "Acts), and under applicable state laws in the United States. Accordingly, in the absence of specific exemption
under the Acts, any brokerage and investment services provided by MOSL, including the products and services described herein are not available to or intended for U.S. persons. This report is intended for distribution only to "Major Institutional
Investors" as defined by Rule 15a-6(b)(4) of the Exchange Act and interpretations thereof by SEC (henceforth referred to as "major institutional investors"). This document must not be acted on or relied on by persons who are not major institutional
investors. Any investment or investment activity to which this document relates is only available to major institutional investors and will be engaged in only with major institutional investors. In reliance on the exemption from registration provided by Rule
15a-6 of the U.S. Securities Exchange Act of 1934, as amended (the "Exchange Act") and interpretations thereof by the U.S. Securities and Exchange Commission ("SEC") in order to conduct business with Institutional Investors based in the U.S.,
MOSL has entered into a chaperoning agreement with a U.S. registered broker-dealer, Motilal Oswal Securities International Private Limited. ("MOSIPL"). Any business interaction pursuant to this report will have to be executed within the provisions of
this chaperoning agreement.
The Research Analysts contributing to the report may not be registered /qualified as research analyst with FINRA. Such research analyst may not be associated persons of the U.S. registered broker-dealer, MOSIPL, and therefore, may not be subject
to NASD rule 2711 and NYSE Rule 472 restrictions on communication with a subject company, public appearances and trading securities held by a research analyst account.
For Singapore
In Singapore, this report is being distributed by Motilal Oswal Capital Markets Singapore Pte Ltd (“MOCMSPL”) (Co.Reg. NO. 201129401Z) which is a holder of a capital markets services license and an exempt financial adviser in Singapore,
as per the approved agreement under Paragraph 9 of Third Schedule of Securities and Futures Act (CAP 289) and Paragraph 11 of First Schedule of Financial Advisors Act (CAP 110) provided to MOCMSPL by Monetary Authority of Singapore.
Persons in Singapore should contact MOCMSPL in respect of any matter arising from, or in connection with this report/publication/communication. This report is distributed solely to persons who qualify as “Institutional Investors”, of which some of
whom may consist of "accredited" institutional investors as defined in section 4A(1) of the Securities and Futures Act, Chapter 289 of Singapore (“the SFA”). Accordingly, if a Singapore person is not or ceases to be such an institutional investor, such
Singapore Person must immediately discontinue any use of this Report and inform MOCMSPL.
Disclaimer:
The report and information contained herein is strictly confidential and meant solely for the selected recipient and may not be altered in any way, transmitted to, copied or distributed, in part or in whole, to any other person or to the media or reproduced
in any form, without prior written consent. This report and information herein is solely for informational purpose and may not be used or considered as an offer document or solicitation of offer to buy or sell or subscribe for securities or other financial
instruments. Nothing in this report constitutes investment, legal, accounting and tax advice or a representation that any investment or strategy is suitable or appropriate to your specific circumstances. The securities discussed and opinions expressed in
this report may not be suitable for all investors, who must make their own investment decisions, based on their own investment objectives, financial positions and needs of specific recipient. This may not be taken in substitution for the exercise of
independent judgment by any recipient. Each recipient of this document should make such investigations as it deems necessary to arrive at an independent evaluation of an investment in the securities of companies referred to in this document
(including the merits and risks involved), and should consult its own advisors to determine the merits and risks of such an investment. The investment discussed or views expressed may not be suitable for all investors. Certain transactions -including
those involving futures, options, another derivative products as well as non-investment grade securities - involve substantial risk and are not suitable for all investors. No representation or warranty, express or implied, is made as to the accuracy,
completeness or fairness of the information and opinions contained in this document. The Disclosures of Interest Statement incorporated in this document is provided solely to enhance the transparency and should not be treated as endorsement of the
views expressed in the report. This information is subject to change without any prior notice. The Company reserves the right to make modifications and alternations to this statement as may be required from time to time without any prior approval.
MOSL, its associates, their directors and the employees may from time to time, effect or have effected an own account transaction in, or deal as principal or agent in or for the securities mentioned in this document. They may perform or seek to perform
investment banking or other services for, or solicit investment banking or other business from, any company referred to in this report. Each of these entities functions as a separate, distinct and independent of each other. The recipient should take this
into account before interpreting the document. This report has been prepared on the basis of information that is already available in publicly accessible media or developed through analysis of MOSL. The views expressed are those of the analyst, and
the Company may or may not subscribe to all the views expressed therein. This document is being supplied to you solely for your information and may not be reproduced, redistributed or passed on, directly or indirectly, to any other person or
published, copied, in whole or in part, for any purpose. This report is not directed or intended for distribution to, or use by, any person or entity who is a citizen or resident of or located in any locality, state, country or other jurisdiction, where such
distribution, publication, availability or use would be contrary to law, regulation or which would subject MOSL to any registration or licensing requirement within such jurisdiction. The securities described herein may or may not be eligible for sale in all
jurisdictions or to certain category of investors. Persons in whose possession this document may come are required to inform themselves of and to observe such restriction. Neither the Firm, not its directors, employees, agents or representatives shall
be liable for any damages whether direct or indirect, incidental, special or consequential including lost revenue or lost profits that may arise from or in connection with the use of the information.
The person accessing this information specifically agrees
to exempt MOSL or any of its affiliates or employees from, any and all responsibility/liability arising from such misuse and agrees not to hold MOSL or any of its affiliates or employees responsible for any such misuse and further agrees to hold MOSL
or any of its affiliates or employees free and harmless from all losses, costs, damages, expenses that may be suffered by the person accessing this information due to any errors and delays.
Registered Office Address: Motilal Oswal Tower, Rahimtullah Sayani Road, Opposite Parel ST Depot, Prabhadevi, Mumbai-400025; Tel No.: 022-3980 4263; www.motilaloswal.com. Correspondence Address: Palm Spring Centre, 2nd Floor, Palm
Court Complex, New Link Road, Malad (West), Mumbai- 400 064. Tel No: 022 3080 1000. Compliance Officer: Neeraj Agarwal, Email Id:
na@motilaloswal.com,
Contact No.:022-30801085.
Registration details of group entities.: MOSL: SEBI Registration: INZ000158836 (BSE/NSE/MSE); CDSL: IN-DP-16-2015; NSDL: IN-DP-NSDL-152-2000; Research Analyst: INH000000412. AMFI: ARN 17397. Investment Adviser: INA000007100.
Motilal Oswal Asset Management Company Ltd. (MOAMC): PMS (Registration No.: INP000000670) offers PMS and Mutual Funds products. Motilal Oswal Wealth Management Ltd. (MOWML): PMS (Registration No.: INP000004409) offers wealth
management solutions. *Motilal Oswal Securities Ltd. is a distributor of Mutual Funds, PMS, Fixed Deposit, Bond, NCDs, Insurance and IPO products. * Motilal Oswal Commodities Broker Pvt. Ltd. offers Commodities Products. * Motilal Oswal Real
Estate Investment Advisors II Pvt. Ltd. offers Real Estate products. * Motilal Oswal Private Equity Investment Advisors Pvt. Ltd. offers Private Equity products
15 May 2018
6