22 May 2018
Market snapshot
Equities - India
Close
Chg .%
Sensex
34,616
-0.7
Nifty-50
10,517
-0.8
Nifty-M 100
18,571
-1.7
Equities-Global
Close
Chg .%
S&P 500
2,733
0.7
Nasdaq
7,394
0.5
FTSE 100
7,859
1.0
DAX
13,078
-0.3
Hang Seng
12,350
0.0
Nikkei 225
23,002
0.3
Commodities
Close
Chg .%
Brent (US$/Bbl)
79
1.1
Gold ($/OZ)
1,293
0.0
Cu (US$/MT)
6,844
0.3
Almn (US$/MT)
2,276
0.4
Currency
Close
Chg .%
USD/INR
68.1
0.2
USD/EUR
1.2
0.2
USD/JPY
111.1
0.2
YIELD (%)
Close
1MChg
10 Yrs G-Sec
7.8
-0.03
10 Yrs AAA Corp
8.5
0.00
Flows (USD b)
21-May
MTD
FIIs
-0.1
-0.7
DIIs
0.2
1.4
Volumes (INRb)
21-May
MTD*
Cash
338
342
F&O
6,355
7,554
Note: YTD is calendar year, *Avg
YTD.%
1.6
-0.1
-12.1
YTD.%
2.2
7.1
2.2
1.2
5.5
1.0
YTD.%
18.2
-0.8
-5.0
0.9
YTD.%
6.7
-1.8
-1.5
YTDchg
0.5
0.6
YTD
0.6
6.4
YTD*
371
7,967
Today’s top research idea
Ultratech Cement: Ultratech to acquire Century Textiles’
cement assets
Acquisition bodes well for Ultratech
Ultratech’s (UTCEM’s) board has approved the acquisition of cement division of
Century textiles Industries Limited (CTIL) which has total grinding capacity of
13.4mt with 11.4mt of integrated capacity and grinding unit of 2mt.
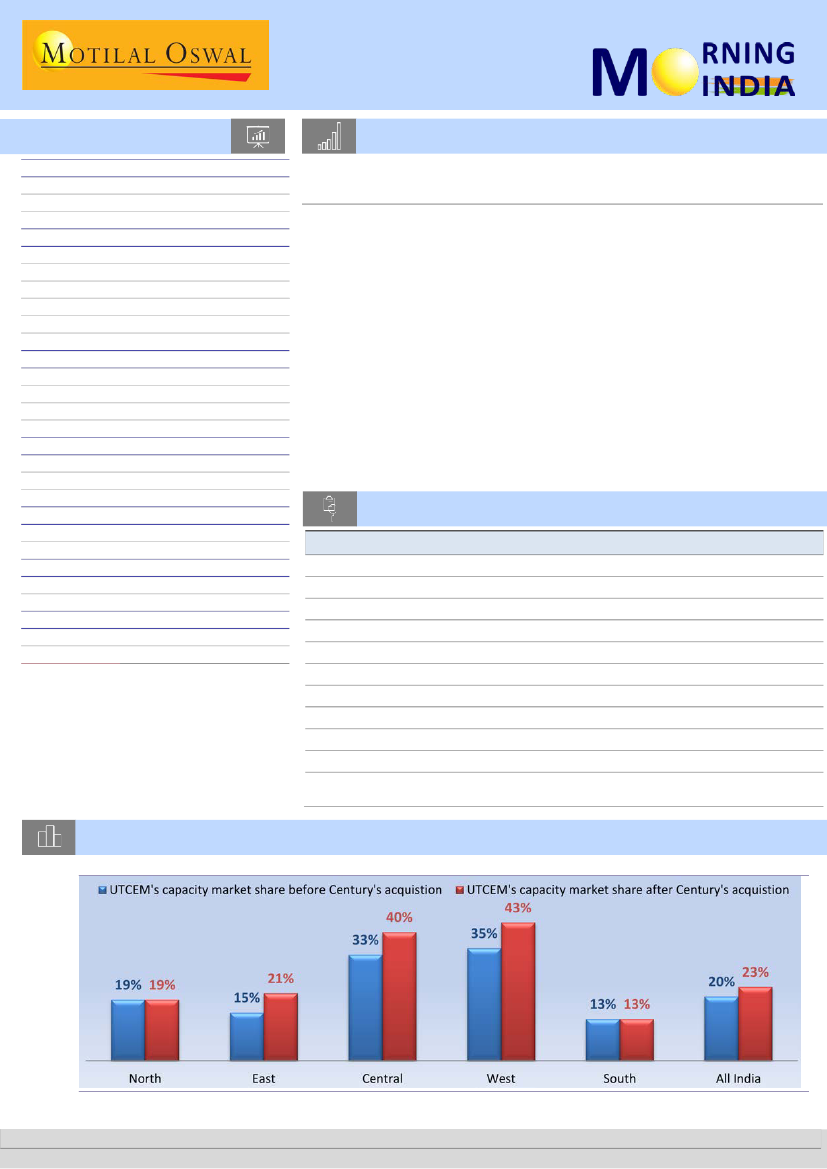
We believe the acquisition of CTIL’s integrated cement capacity of 13.4mt at
USD106/t is positive for UTCEM as it will help in increasing UTCEM’s domestic
capacity to 106mt and capacity market share by ~3pp to 23% by FY19 end. The
acquisition cost is ~7-8% lower than the cost of JPA’s acquired assets about 2
years back. Additionally, the acquisition is earnings accretive from 1st year of
operations vs 2 years in case of JPA.
UTCEM by way of this acquisition has ensured higher market share with zero
lead time for asset creation and at valuation largely in line with greenfield
expansions which we believe is positive for UTCEM.
Research covered
Cos/Sector
UltraTech Cement
Bajaj Auto
Petronet LNG
Colgate-Palmolive
Dalmia Bharat
Thermax
Guj.St.Petronet
Mahanagar Gas
Sanghi Inds
Metals Weekly
Key Highlights
Ultratech to acquire Century Textiles’ cement assets
Operating performance in-line, higher other income boosts PAT
In-line EBITDA; Dahej utilization at 109%
Mixed bag – volumes disappoint but margins expand sharply
Healthy volume growth, realization drive profitability
Miss led by weak execution, pressure on margins
EBITDA below estimate; strong transmission volumes
EBITDA below estimate; volume growth strong
Cost push impacts margins, shutdown hurts volumes
Thermal coal prices continue to rise
AGLL | BHFC | BOS | CIPLA | DRRD | FCON | HPCL | IOCL |
Results Expectation
RADIOCIT | SBIN
Chart of the Day: Ultratech Cement – Ultratech to acquire Century Textiles’ cement assets
UTCEM’s all-India capacity market share to increase by ~3pp
Research Team (Gautam.Duggad@MotilalOswal.com)
Source: MOSL, Company
Motilal Oswal research is available on www.motilaloswal.com/Institutional-Equities, Bloomberg, Thomson Reuters, Factset and S&P Capital.
Investors are advised to refer through important disclosures made at the last page of the Research Report.
 Motilal Oswal Financial Services
In the news today
Kindly click on textbox for the detailed news link
1
The rupee lost another 12 paise to
close at fresh 16-month low of
68.12 against the US currency on
sustained dollar demand from
importers and corporates amid
weak global cues.…
2
NCLAT issues notice to Tata Steel over Bhushan Steel acquisition
The National Company Law Appellate Tribunal (NCLAT) on Monday refused
to grant an interim stay on acquisition of Bhushan Steel Ltd by Tata Steel
Ltd. “Let us decide the law, but not stall the process,” a bench headed by
Justice S.J Mukhopadhyay said. The appellate tribunal was hearing an
appeal by Bhushan Steel promoter Neeraj Singal challenging an order of
the National Company Law Tribunal (NCLT) approving Tata Steel’s
resolution plan for the debt-ridden company…
Rupee falls 12 paise to close at
fresh 16-month low
3
Former MD of PNB was aware
of Nirav Modi fraud, says CBI
US Treasury Secretary Steven
Former MD and CEO of the Punjab
National Bank Usha
Ananthasubramanian and some
other senior bank officials were
aware of the "fraudulent" dealings
with diamond merchant Nirav
Modi but kept misleading the RBI,
the CBI has alleged in its charge
sheet.…
4
Bharti’s Cedar looks to exit
Future Retail, in talks with
PremjiInvest
Bharti Group firm Cedar Services is
in talks with PremjiInvest, the
investment arm of Wipro
chairman Azim Premji, and several
other potential investors for
selling its stake in Future Retail
after the Kishore Biyani company
eased curbs on offloading the
shares…
5
Industry seeks cut in petrol,
diesel excise duty as oil prices
zoom
India Inc. on Monday urged the
government to cut excise duty
on petrol and diesel prices
immediately, observing that
rising oil prices pose a high risk
to India’s economic growth
trajectory.…
6
Ultratech Cement bags
limestone mining block in MP
Aditya Birla group firm Ultratech
Cement today said it has bagged
the Deora-Sitapuri-Udipyapura
limestone mining block in
Madhya Pradesh (MP). Ultratech
Cement said the block is in close
proximity to its existing
limestone mines of the
company's recently
commissioned unit Dhar Cement
Works…
7
SEBI proposes stringent
norms for debt disclosure
Listed companies might soon
have to make a quick disclosure
in the event of a default on debt
securities or even if the company
is merely expecting a possible
delay or default in the payment
of the interest or the principal
amount…
22 May 2018
2
 Motilal Oswal Financial Services
Ultratech Cement
BSE SENSEX
34,616
S&P CNX
10,517
21 May 2018
Update
| Sector:
Cement
CMP: INR3,852
TP: INR4,818 (+25%)
Buy
Ultratech to acquire Century Textiles’ cement assets
Acquisition bodes well for Ultratech
Stock Info
Bloomberg
Equity Shares (m)
52-Week Range (INR)
1, 6, 12 Rel. Per (%)
M.Cap. (INR b)
M.Cap. (USD b)
Avg Val, INRm
Free float (%)
UTCEM IN
274.4
4531 / 3052
1/10/6
1057
16.3
1156
37.8
Financials Snapshot (INR b)
Y/E Mar
2018 2019E 2020E
Sales
297.9 366.3 421.8
EBITDA
58.8
74.1
94.0
NP
23.1
33.3
47.0
EPS (INR)
84.3 121.2 171.3
EPS Gr. (%)
-12.3
43.8
41.3
BV/Sh. (INR)
949.8 1,044.8 1,170.5
RoE (%)
9.3
12.2
15.5
RoCE (%)
8.2
9.8
12.3
Valuation
P/E (x)
45.8
31.8
22.5
P/BV (x)
4.1
3.7
3.3
EV/EBITDA (x)
19.7
15.1
11.6
Shareholding pattern (%)
As On
Mar-18 Dec-17 Mar-17
Promoter
62.0
62.1
62.2
DII
5.8
5.7
5.6
FII
22.3
22.2
21.9
Others
9.9
10.1
10.4
FII Includes depository receipts
Stock Performance (1-year)
UltraTech Cem.
Sensex - Rebased
5,500
Ultratech Cement’s (UTCEM) board has approved the acquisition of cement assets of
Century Textiles Industries (CTIL), which has total grinding capacity of 13.4mt
(comprises 11.4mt of integrated capacity and a grinding unit of 2mt).
The acquisition bodes well for UTCEM, as it will help the company to enhance its
domestic capacity to 106mt and expand its capacity market share by ~3pp to 23% by
end-FY19. We note that the acquisition cost of USD106/t is ~7-8% lower than the cost
incurred to acquire JPA’s assets about two years ago. Additionally, the acquisition is
likely to be earnings accretive from the first year of operations versus two years in
case of JPA’s acquired assets.
Importantly, the acquisition will ensure a higher market share with zero lead time for
asset creation and at valuation largely in line with greenfield expansion.
Event
UTCEM’s board has approved the acquisition of the cement division of CTIL,
which has grinding capacity of 13.4mt (~11.4mt of integrated capacity, and a
grinding unit of 2mt in West Bengal).
Post-acquisition, UTCEM’s domestic capacity will increase by ~15% to 106mt
from 92.6mt, thereby increasing its capacity market share by 3pp from ~20% to
23% at end-FY19. Additionally, the acquisition is likely to fortify its capacity
market share in the central, eastern and western regions.
CTIL’s cement assets will be acquired at a total EV of INR86.2b, with equity
issuance of INR56.2b and debt of INR30b. UTCEM will issue one equity share of
face value of INR10 for every eight equity shares of CTIL of face value of INR10,
thereby issuing 14m new equity shares to CTIL’s shareholders. This will
increase UTCEM’s equity capital to INR2885.8m divided into 288.6m equity
shares of INR10 each.
Assuming an EV of INR5.4b (valuing grinding capacity of 2mt at USD40/t), the
integrated capacity has been acquired at USD106/t, which is ~7-8% discount to
the acquisition value of JPA’s assets about two years ago.
We believe the acquisition value of USD106/t is attractive, given i) it is at a
discount to the earlier acquisition value (of JPA’s assets) by 7-8%, ii) the
acquisition value is in line with UTCEM’s capital cost for putting up its own
capacity and iii) the acquisition value is at a deep discount to the recent bid for
Binani Cement, although synergy values are different in case of Binani Cement.
The acquisition is earnings accretive from the first year of operations, as
against two years in case of JPA’s acquired assets.
Deal valuation and structure
5,000
4,500
4,000
3,500
22 May 2018
3
 Motilal Oswal Financial Services
Timelines and approvals
The transaction is subject to approval of shareholders and creditors, stock
exchanges, NCLT and CCI, and is expected to take around 6-9 months to be
consummated.
Management commentary
CTIL’s EBITDA margin stood at 12.5% v/s 20% for UTCEM. The difference in the
pricing of UTCEM and CTIL is INR10-15/bag, which management expects to
eliminate post the acquisitions of assets.
UTCEM will incur a capex of INR5b over the next five years to upgrade the plants
and acquire land related to mines. There is no scope of capacity expansion at
Chhattisgarh, at least for the next 7-8 years. However, the line in the
Chhattisgarh unit is 44 years old, which will be completely upgraded at a cost of
INR3.5b.
Profitability improvement at CTIL should be faster compared to JPA, as the
former has presence in markets where UTCEM already has a dealer network.
Significant savings should come from elimination of corporate overheads and
marketing spends.
CTIL’s Sonar Bangla plant (established in 2013) and Manikgarh plant (established
in 2015) enjoy incentives.
Valuation and view
We believe the proposed acquisition of Century Textiles’ cement assets is
positive as it allows UTCEM to increase its all-India capacity market share by 3pp
in a very short time (nine months). This apart, the acquisition will allow the
company to cement its position in the promising east, west and central markets,
which are expected to grow at healthy rates. We believe the acquisition value of
USD106/t is attractive, given the benefits in terms of access to the large
limestone reserves and the lower lead time for asset creation. UTCEM, thus,
would position itself well in terms of market share gains before the expected
upturn in the cement cycle and would also be a key beneficiary of pricing
improvement across India. We value UTCEM at 14x EV/EBITDA on FY20 earnings
to arrive at a target price of INR4818/share, implying an upside of 25%.
22 May 2018
4
 Motilal Oswal Financial Services
21 May 2018
Q4FY18 Results Update | Sector: Automobiles
Bajaj Auto
Buy
BSE SENSEX
34,616
Bloomberg
Equity Shares (m)
M.Cap.(INRb)/(USDb)
52-Week Range (INR)
1, 6, 12 Rel. Per (%)
Avg Val, INRm
Free float (%)
S&P CNX
10,517
BJAUT IN
289
787.1 / 11.6
3473 / 2695
-5/-21/-22
914.0
50.7
CMP: INR2,720
TP: INR3,450(+27%)
Operating performance in-line, higher other income boosts PAT
Financials & Valuations (INR b)
Y/E Mar
2018 2019E 2020E
Net Sales
252
275
308
EBITDA
47.8
53.3
61.9
PAT
43.8
48.4
55.5
EPS (INR)
151
167
192
Gr. (%)
7.3
10.5
14.7
BV/Sh (INR)
660
733
817
RoE (%)
24.2
24.0
24.7
RoCE (%)
22.0
21.9
31.9
P/E (x)
18.0
16.3
14.2
P/BV (x)
4.1
3.7
3.3
Estimate change
TP change
Rating change
Price hikes, favorable mix drives realizations:
Net sales grew 38.3% YoY (6.3%
QoQ) to INR67.7b (in-line), as volume grew 32.7% YoY (4.4% QoQ). Realization
grew 1.9% QoQ (4.2% YoY) to INR64.8k (our estimate: INR63.7k), largely led by
price hikes of 1-1.5% in 2W and 3W. A favorable product mix (higher share of
3W, exports) also helped YoY realization growth.
EBITDA margin in-line at 19.4% (est 19.1%):
Gross margin was 30.7% (our
estimate: 31.3%), primary led by RM inflation. However, other expense shrunk
180bp YoY (-90bp QoQ) to 7.4% (our estimate: 8.4%) to INR5b (our estimate:
INR5.6b). EBITDA grew 45% YoY (6.8% QoQ) to INR13.2b (in-line), implying
EBITDA margin of 19.4% (+90bp YoY, +10bp QoQ). Other income grew 25% YoY
(62% QoQ) to INR3.7b (our estimate: INR2.2b) due to MTM gain of ~INR700m.
PAT grew 34.7% YoY (13.4% QoQ) to INR10.8b (our estimate: INR9.8b). FY18
revenue/EBITDA/ adjusted PAT grew 15.6%/8.2%/7.3%.
Management commentary:
(a) Domestic MC industry growth at 9-11% in FY19
and BJAUT to outperform; (b) Exports to grow 13-14% in FY19 to 1.9m units,
spares revenue to grow 10% in FY19; (c) Domestic 3W demand momentum to
continue, led by growth in Maharashtra (ex-Mumbai) and permit release in
Telangana, Delhi and Karnataka; (d) Taken price hike of 1-1.5% in March and
May in 2W/3W, which covers current RM inflation; (e) Price correction of
~INR3k for CT100 kick-start and ~INR2k in Pulsar to accommodate new variant
of twin disc; (f) Guided capex of INR2.5b-3b in FY19; (g) Has network of 650
dealers (targets ~710 dealers by March 2019), with ~4k touch points.
Valuation and view:
We largely keep FY19/FY20E EPS unchanged. We value
BJAUT at INR3,450 (18x March 2020E consolidated EPS). Maintain
Buy.
FY18
2Q
3Q
1,072
1,001
3.8
17.6
61,408 63,600
4.7
6.9
65,799 63,693
8.7
25.7
69.1
68.4
4.0
4.2
7.2
8.3
12,984 12,315
19.7
19.3
2,964
2,269
5
3
770
747
15,174 13,833
4,055
4,309
26.7
31.1
11,119
9,524
(1.0)
3.0
FY17
3,666
(5.8)
59,419
2.4
217,827
(3.6)
67.1
4.6
8.0
44,384
20.4
12,220
14
3,073
53,516
15,081
28.2
38,436
(2.2)
FY18
4,007
9.3
62,806
5.7
251,649
15.5
69.4
4.2
7.7
47,290
18.8
13,473
13
3,148
57,602
17,145
29.8
41,001
6.7
Est.
4QE
1,045
32.7
63,725
2.5
66,617
36.0
68.7
4.0
8.4
12,736
19.1
2,168
0
794
14,110
4,326
30.7
9,784
22.0
Var.
(%)
0.0
1.7
1.7
Quarterly Performance
(INR Million)
Volumes ('000 units)
Growth YoY (%)
Realization (INR/unit)
Growth YoY (%)
Net Sales
Change (%)
RM/Sales %
Staff cost/Sales %
Oth. Exp./Sales %
EBITDA
EBITDA Margins (%)
Other Income
Interest
Depreciation
PBT
Tax
Effective Tax Rate (%)
Adj. PAT
Change (%)
E: MOSL Estimates
1Q
995
-1.8
57,784
4.5
57,480
2.7
67.2
4.7
7.7
11,763
20.5
2,671
2
775
13,657
3,873
28.4
9,784
2.2
FY17
2Q
3Q
1,032
852
-2.3
-10.5
58,676 59,495
2.0
2.0
60,545 50,669
-0.4
-8.7
67.0
66.8
4.3
4.8
7.4
7.9
12,961 10,439
21.4
20.6
3,420
3,193
7
3
770
772
15,605 12,858
4,378
3,612
28.1
28.1
11,228
9,246
6.7
(4.7)
4Q
788
-9.7
62,171
1.2
48,973
-8.6
67.8
4.6
9.2
9,060
18.5
2,936
2
757
11,236
3,218
28.6
8,018
(15.5)
1Q
888
-10.7
61,258
6.0
54,424
-5.3
70.0
5.0
7.8
9,384
17.2
4,573
2
753
12,881
3,642
28.3
9,469
(3.2)
4Q
1,045
32.7
64,793
4.2
67,733
38.3
69.3
3.9
7.4
13,152
19.4
3,667
3
879
15,937
5,138
32.2
10,799
34.7
3.3
30bp
12.9
10.4
22 May 2018
5
 Motilal Oswal Financial Services
21 May 2018
4QFY18 Results Update | Sector: Oil & Gas
Petronet LNG
Buy
BSE SENSEX
34,616
Bloomberg
Equity Shares (m)
M.Cap.(INRb)/(USDb)
52-Week Range (INR)
1, 6, 12 Rel. Per (%)
Avg Val, INRm
Free float (%)
S&P CNX
10,517
PLNG IN
1500
373.0 / 5.5
275 / 198
-12/-20/-20
1237.0
50.0
CMP: INR211
TP: INR320 (+52%)
In-line EBITDA; Dahej utilization at 109%
EBITDA grew 33% YoY (-3% QoQ) to INR8.2b, in-line with our estimate. PAT
grew 11% YoY (declined 1 QoQ) to INR5.2b, below our estimate of INR5.4b,
due to higher tax rate of 34% in 4QFY18 v/s 29% in 3QFY18 and 24% in 4QFY17.
Dahej throughput grew 17% YoY (-4% QoQ) to 207tbtu (est. of 199tbtu),
implying 109% utilization of the 15mmt capacity. This throughput includes (in
tbtu) long term: 115 (+7% YoY, -3% QoQ), third-party: 85 (+22% YoY, -8% QoQ),
and short term: 7 (+78% QoQ). Marketing margin stood at INR613/mmBtu in
4QFY18 v/s INR200/mmBtu in 3QFY18.
Kochi throughput grew 310% YoY (-26% QoQ) to 5.9tbtu (est. of 8.8tbtu),
implying 9% utilization of the 5mmt capacity. This includes 6tbtu long-term
(flat QoQ) and 0.1tbtu pure short-term.
For FY18, EBITDA grew 28% YoY to INR33b and PAT grew 22% YoY to INR21b.
While utilization for Dahej stood at 108%, utilization for Kochi stood at 12% in
FY18.
Management has recommended dividend of INR4.5/share for FY18.
Financials & Valuations (INR b)
2018 2019E 2020E
Y/E Mar
Sales
306.0 289.5 332.9
EBITDA
33.1
36.1
43.1
Adj. PAT
20.8
25.3
29.5
Adj. EPS (INR)
13.9
16.8
19.7
EPS Gr. (%)
21.8
21.6
16.8
BV/Sh.(INR)
64.8
76.9
91.1
RoE (%)
23.3
23.8
23.4
RoCE (%)
21.9
23.1
23.4
P/E (x)
15.2
12.5
10.7
P/BV (x)
3.3
2.7
2.3
EV/EBITDA (x)
9.5
8.1
6.3
Div. Yield (%)
2.1
1.9
2.2
Valuation and
view
Estimate change
TP change
Rating change
We see immediate trigger for volume offtake from (a) Dahej further expansion
to 17.5mmtpa in early 2019, (b) higher offtake from BPCL’s refinery as it
stabilizes and (c) completion of Kochi-Mangalore pipeline.
Net cash stands at INR1.3b. Lack of immediate capital expenditure outlay amid
high free cash flow generation has been a concern for investors. However, so
far, the company has not announced any unrelated expansion.
With increased capacity at Dahej and Kochi ramp-up, we assume FY19/20 total
volumes at 17.2/18.8mmt. We assume terminal growth of 3% beyond FY22.
The stock trades at 10.7x FY20E EPS of INR19.7. We value PLNG on DCF (WACC:
11.7%, TGR: 3%) to arrive at a fair value of INR320. Reiterate
Buy.
FY17
FY18
FY17
FY18
2Q
3Q
4Q
1Q
2Q
3Q
4Q
66,144 62,993 63,651 64,351 77,702 77,571 86,362 246,160 305,986
-12.3
22.4
4.9
20.6
17.5
23.1
35.7
-9.3
24.3
7,264 6,071 6,163 7,442 8,987 8,474 8,221 25,923 33,124
11.0
9.6
9.7
11.6
11.6
10.9
9.5
10.5
10.8
860 1,009 1,016 1,027 1,039 1,039 1,013
3,691
4,117
554
517
469
465
465
367
335
2,097
1,630
915
550 1,508
707 1,019
414 1,034
3,466
3,174
6,765 5,095 6,186 6,658 8,504 7,482 7,908 23,602 30,551
2,170 1,121 1,478 2,282 2,616 2,194 2,681
6,545
9,773
32
22
24
34
31
29
34
28
32
4,596 3,975 4,708 4,376 5,888 5,288 5,227 17,057 20,778
84.7 122.8
96.8
15.8
28.1
33.0
11.0
102.7
21.8
6.9
6.3
7.4
6.8
7.6
6.8
6.1
6.9
6.8
60.7
128.2
75.3
116.1
71.1
108.9
80.5
111.1
79.0
141.0
92.0
131.0
84.7
128.0
257.1
471.2
336.2
511.1
(INR Million)
FY18 Var. vs
4QE
est
66,349
30%
4.2
8,236
0%
12.4
1,118
-9%
306
9%
944
10%
7,757
2%
2,327
15%
30
5,430
-4%
15.3
8.2
94.3
113.6
-10%
13%
Standalone - Quarterly Earning Model
Y/E March
Net Sales
YoY Change (%)
EBITDA
Margins (%)
Depreciation
Interest
Other Income
PBT
Tax
Rate (%)
PAT
YoY Change (%)
Margins (%)
Key Assumptions
Regas volume (tbtu)
Sales volume (tbtu)
E: MOSL Estimates
1Q
53,373
-36.3
6,425
12.0
806
556
494
5,556
1,777
32
3,779
115.8
7.1
50.1
118.1
22 May 2018
6
 Motilal Oswal Financial Services
21 May 2018
4QFY18 Results Update | Sector: Consumer
Colgate
Buy
BSE SENSEX
34,616
Bloomberg
Equity Shares (m)
M.Cap.(INRb)/(USDb)
52-Week Range (INR)
1, 6, 12 Rel. Per (%)
12M Avg Val (INR M)
Free float (%)
S&P CNX
10,517
CLGT IN
272.0
328.4 / 5.2
1285 / 976
9/12/5
364.0
49.0
CMP: INR1,208
TP: INR1,420(+18%)
Mixed bag – volumes disappoint but margins expand sharply
Financials & Valuations (INR b)
Y/E Mar
2018 2019E 2020E
41.9
47.1
53.8
Net Sales
11.1
13.0
15.2
EBITDA
6.8
7.9
9.4
PAT
25.0
29.2
34.6
EPS (INR)
18.0
16.5
18.5
Gr. (%)
56.1
59.5
59.9
BV/Sh (INR)
48.7
50.5
58.0
RoE (%)
47.6
49.4
56.7
RoCE (%)
48.2
41.4
34.9
P/E (x)
21.5
20.3
20.2
P/BV (x)
Estimate change
TP change
Rating change
Colgate’s (CLGT) volumes rose 4% YoY (est. of +6%) in 4QFY18.
Net sales grew
5.2% YoY to INR10.9b (est. of INR11.4b). EBITDA was up 26.6% YoY to INR3.1b
(est. of INR2.8b), while adj. PAT rose 37.9% YoY to INR2b (est. of INR1.7b).
Toothpaste market share stood at 53.4% in FY18 (-170bp YoY, -30bp QoQ).
Gross margin continued expanding to reach 65.7%
(+300bp YoY; est. of 63%).
Low ad spends (-80bp YoY to 13.1% of sales), other expenses (-60bp YoY to
17.4% of sales) and staff cost (-40bp YoY to 6.9% of sales) led to EBITDA margin
expansion of 470bp YoY to 28.2% (est. of 24.8%).
FY18 performance:
Sales, EBITDA and adj. PAT grew 5.2%, 17.9% and 18%,
respectively. Gross and EBITDA margin expanded 150bp (to 64.4%) and 290bp
(to 26.6%), respectively.
Concall highlights:
1)
Company expects a pick-up in rural sales.
2)
CLGT plans
to hike prices in view of rising commodity costs.
Valuation view:
We are optimistic on CLGT’s earnings prospects, given (1) its
impressive execution after a delay in the herbal portfolio launch – the two
products launched have seen good response, and more products will be rolled
out under the Vedshakti umbrella and (2) CLGT’s high rural market share of
~60% (rural contributes 40%+ of its sales), which makes it a promising play on a
rural recovery. Patanjali impacted severely initially, but the threat is
perceptibly reducing. Even on FY18 EPS, CLGT trades at ~10% discount to our
ex-cigarette and alcohol consumer peer valuations. With return ratios superior
to peers barring HUL (return ratios will only improve on better utilization of
expanded capacity and with earnings growth apparently back on track), such
discounts are unwarranted, in our view. Valuing CGLT at 41x FY20E EPS (in line
with three-year average), we derive a TP of INR1,420.
Buy.
FY18
2Q
3Q
-0.9
12.0
10,849 10,333
2.7
18.2
3,970
3,598
6,879
6,735
63.4
65.2
3,873
3,911
35.7
37.9
3,006
2,824
27.7
27.3
9.4
31.9
392
396
89
90
2,703
2,519
927
812
34.3
32.3
1,776
1,707
-2.1
33.5
FY17
-1.5
39,818
2.9
14,768
25,050
62.9
15,619
9,431
FY18
2.5
41,880
5.2
14,901
26,979
64.4
15,855
11,124
FY18
4QE
6.0
11,439
10.3
4,228
7,211
63.0
4,377
38.3
2,834
24.8
16.0
405
110
2,539
865
34.1
1,673
17.4
Quarterly Performance
Y/E March
Toothpaste Volume Gr %
Net Sales
YoY Change (%)
COGS
Gross Profit
Gross Margin (%)
Other opera ti ng Expens es
% to sales
EBITDA
Margins (%)
YoY Growth (%)
Depreci a ti on
Fi na nci a l other Income
PBT
Ta x
Rate (%)
Adj PAT
YoY Change (%)
E: MOSL Estimates
1Q
5.0
10,131
8.8
3,822
6,309
62.3
4,197
41.4
2,113
20.9
3.7
316
101
1,897
640
33.7
1,257
1.3
FY17
2Q
4.0
10,566
9.5
3,910
6,656
63.0
3,909
37.0
2,748
26.0
8.1
333
113
2,527
714
28.3
1,813
15.6
(INR Million)
3Q
-12.0
8,746
-8.6
3,159
5,587
63.9
3,446
39.4
2,141
24.5
-10.3
342
109
1,908
630
33.0
1,278
-12.8
4Q
-3.0
10,375
2.2
3,877
6,498
62.6
4,068
39.2
2,430
23.4
0.7
341
93
2,182
756
34.7
1,426
-0.5
1Q
-5.0
9,781
-3.5
3,584
6,197
63.4
3,979
40.7
2,218
22.7
5.0
373
125
1,970
606
30.8
1,364
8.5
4Q
4.0
10,917
5.2
3,750
7,167
65.7
4,092
37.5
3,075
28.2
26.6
405
85
2,755
789
28.7
1,966
37.9
Var.
(%)
-4.6%
-0.6%
39.2
37.9
1,332
416
8,514
2,740
32.2
5,774
23.7
0.5
1.2
1,565
388
9,947
3,135
31.5
6,812
26.6
17.9
8.5%
8.5%
18.0
17.5%
22 May 2018
7
 Motilal Oswal Financial Services
21 May 2018
4QFY18 Results Update | Sector: Cement
Dalmia Bharat
Buy
BSE SENSEX
34,616
Bloomberg
Equity Shares (m)
M.Cap.(INR b)/(USD b)
52-Week Range (INR)
1, 6, 12 Rel. Per (%)
Avg Val, INRm
Free float (%)
S&P CNX
10,517
DBEL IN
Healthy volume growth, realization drive profitability
88.8
Volumes in-line:
Volumes grew 14% YoY to 5.18mt (in-line) in 4QFY18.
243 / 3.6
Cement realization rose 3% YoY (-1% QoQ) to INR4,892/t, while blended
3349 / 2299
realization increased 6% YoY (+1% QoQ) to INR5,093/t (est. of INR4,907),
-6/-13/-1
leading to a 21% YoY rise in net sales to INR26.4b (est. of INR25.4b).
475.0
42.0
Sequential improvement in profitability:
EBITDA/t rose 4% QoQ (-6% YoY) to
CMP:INR2,736
TP:INR3,403(+24%)
Financials & Valuations (INR b)
2018 2019E
Y/E Mar
Sales
86.1
97.9
EBITDA
20.4
22.3
NP
5.4
6.5
Adj EPS (INR)
60.2
72.6
EPS Gr. (%)
109.9
20.5
BV/Sh. (INR)
616
685
RoE (%)
10.3
11.2
RoCE (%)
8.6
9.3
P/E (x)
45.4
37.7
P/BV (x)
4.4
4.0
2020E
117.8
27.1
9.6
107.6
48.3
788
14.6
11.3
25.4
3.5
Estimate change
TP change
Rating change
INR1,137, led by better realization and lower P&F cost/t due to cost
efficiencies. Hence, EBITDA rose 7% YoY (+30% QoQ) to INR5.9b (est. of
INR5.1b), with the margin at 22.3% (-2.8pp YoY, +0.6pp QoQ). Interest cost
declined 20% YoY to INR1.54b due to gross debt reduction by INR7.75b in
FY18. Tax rate was at 33% in 4QFY18 (17% in 4QFY17). Adj. PAT, thus,
increased 10% YoY to INR1.85b (est. of INR1.68b).
Management commentary:
1) DBEL announced capacity expansion of 7.8mt
in east at total capex of INR37b. 2) OCL merger to be completed by Sep’18.
FY18 performance:
Volumes increased 11% to 16.96mt. Blended realization
increased 4.5% to INR5,076, resulting in net sales of INR86b (+16% YoY).
EBITDA rose 8% YoY to INR20b, with EBITDA/t declining by INR35/t to
INR1,204. Adj. PAT increased 110% YoY to INR5.35b due to lower interest
cost and tax rate (32% v/s 43% in FY17).
Valuation view:
In our view, net debt reduction of ~INR7.75b in FY18 will
continue into FY19. Operating cash flow is likely to improve strongly, led by
better margins on the back of cost efficiency and realization improvement.
OCL-DBL merger synergy benefits are likely to further improve cash flow in
FY19. We expect valuation multiple for DBEL to catch up with large caps,
given its improving balance sheet and earnings CAGR of 34% over FY18-20.
We value DBEL at 13x FY20 EV/EBITDA and arrive at a TP of INR3,403.
Buy.
(INR m)
4Q
4.55
17.3
4,794
-1.6
-0.9
21,812
15.4
5,490
25.2
1,815
1,920
663
2,418
-159
2,577
436
16.9
2,141
319
1,690
78.4
1Q
3.99
6.1
5,129
8.5
7.0
20,466
15.1
5,566
27.2
1,532
2,117
700
2,617
-267
2,885
889
30.8
1,996
357
1,454
54.7
FY18
2Q
3Q
3.64
4.15
6.4
16.6
5,038
5,037
0.5
4.2
-1.8
0.0
18,337 20,905
7.0
21.4
4,408
4,543
24.0
21.7
1,653
1,814
1,974
1,419
922
507
1,703
1,818
33
-299
1,669
2,116
556
673
33.3
31.8
1,113
1,444
193
279
942
953
202.9
135.5
4Q
5.18
13.8
5,093
6.2
1.1
26,380
20.9
5,891
22.3
1,861
1,539
655
3,145
23
3,123
1,037
33.2
2,086
249
1,852
9.5
FY17
15.29
19.5
4,855
-3.1
74,235
15.8
18,935
25.5
7,262
8,689
2,862
5,846
-150
5,996
2,573
42.9
3,423
870
2,553
410.8
FY18
16.96
10.9
5,076
4.5
86,088
16.0
20,415
23.7
7,037
7,049
2,784
9,112
-390
9,502
3,067
32.3
6,436
1,078
5,358
109.9
FY18
4QE Var (%)
5.17
0
13.7
4,907
4
2.2
-2.6
25,386
4
16.2
5,118
15
20.2
1,721
1,461
571
2,507
25
0
2,507
629
25.1
1,878
11
196
27
1,683
10
-3.1
Quarterly Performance (Consolidated)
Y/E March
1Q
Sales Dispatches (m ton)
3.76
YoY Change (%)
21.7
Realization (INR/ton)
4,727
YoY Change (%)
-8.7
QoQ Change (%)
-3.0
Net Sales
17,775
YoY Change (%)
11.1
EBITDA
5,084
Margins (%)
28.6
Depreciation
1,338
Interest
2,412
Other Income
766
PBT before EO Expense
2,100
Extra-Ord expense
0
PBT after EO Expense
2,100
Tax
911
Rate (%)
43.4
Reported PAT (pre minority)
1,189
Minority + associate
250
PAT Adj for EO items
940
YoY Change (%)
78.3
FY17
2Q
3Q
3.42
3.56
20.0
20.3
5,010
4,837
0.6
-3.2
6.0
-3.5
17,134 17,219
20.8
16.4
4,207
4,147
24.6
24.1
1,587
1,887
2,291
2,105
796
676
1,125
831
0
8
1,125
823
662
273
58.9
33.2
463
550
152
151
311
405
149.8
35.2
22 May 2018
8
 Motilal Oswal Financial Services
21 May 2018
4QFY18 Results Update | Sector: Capital Goods
Thermax
Buy
BSE SENSEX
34,616
Bloomberg
Equity Shares (m)
M.Cap.(INRb)/(USDb)
52-Week Range (INR)
1, 6, 12 Rel. Per (%)
Avg Val, INRm
Free float (%)
S&P CNX
10,517
TMX IN
112.6
131.3 / 2.0
1375 / 835
2/6/3
72.0
38.0
CMP: INR1,147
TP: INR1,370 (+17%)
Miss led by weak execution, pressure on margins
Operational results below expectations due to weak execution and margins
pressure:
4QFY18 operating performance at the consolidated level was below
expectations. Sales declined 3% YoY to INR14.4b (est. of INR18.4b) due to a
delay in dispatches (impact of INR2b) on account of (i) E-Way bill
implementation (impact of INR1b) and (ii) inability to push sales (INR1b). TMX
expects lost sales of INR2b to be recovered in 1QFY19. EBIDTA fell 20% YoY to
INR1.4b, as negative operating leverage led to margin contraction of 200bp
YoY to 9.6% (11.6% in 4QFY17). Adj. net profit rose 23% YoY to INR0.8b (est. of
INR1.6b), led by a reduction in the share of loss from JV/associates from
INR562m to INR172m in 4QFY18. For FY18, sales stood at INR44.6b (-0.4%
YoY), EBIDTA at INR4.0b (-7.4% YoY) and adj. net profit at INR2.3b (-1.2% YoY).
Weak performance at subsidiaries:
Subsidiaries’ revenue declined 10% YoY to
INR1.3b, and operating loss stood at INR118m v/s operating profit of INR211m
in the year-ago period. Net loss stood at INR351m in the quarter. This was
mainly on account of a loss at Danstoker and Chinese subsidiary Zheijang
(NR178m provision for litigation on four cases).
Key concall highlights:
a) Order inflow for FY19 to be at FY18 levels. b) Sectors
like cement, steel and fertilizers showing traction. c) To buy 49% of B&W stake
in the boiler facility, where it will look to manufacture subcritical/super critical
boilers and NOx equipment. It has also got technology transferred from TBW
for these equipment for 20 years. d) Targets double-digit EBIDTA margin in
FY19.
Valuation & view:
We maintain our
Buy
rating with a TP of INR1,370 (30x
FY20E EPS, in line with five year average of INR42.7), given the improving
domestic end-market outlook.
(INR Million)
1Q
9,791
-20.4
804
-21.2
8.2
194
32
231
809
277
34.3
(42.4)
490
(32.2)
490
(10.4)
FY17
2Q
3Q
4Q
10,703 9,440 14,905
-15.4 -22.6
-0.2
919 875 1,732
-16.8
3.6
30.9
8.6
9.3
11.6
199 197
229
24
17
25
361 252
297
1,057 913 1,775
350 335
598
33.1 36.7
33.7
75.3 (42.1)
-562
783 536
437
5.4 (12.3) (62.2)
783 536
615
32.4 (1.2) (46.2)
1Q
8,718
-11.0
721
-10.3
8.3
189
16
241
757
284
37.5
(66.7)
406
(17.0)
406
(17.0)
FY18
FY17E FY18E MOSL
Var.
2Q
3Q
4Q
4Q Est Vs Est
10,331 11,170 14,430 44,831 44,649 18,412 -21.6%
-3.5
18.3
-3.2 -18.5
23.5
952
955 1,382 4,330 4,009 2,220 -37.8%
3.6
9.1 -20.2
-3.4
-7.4
28.2
9.2
8.5
9.6
9.7
9.0
12.1
189
208
239
819
824
194
51
25
37
97
129
8
236
238
450 1,141 1,164
361
947
961 1,555 4,554 4,220 2,379 -34.6%
370
378
626 1,560 1,658
784
39.0
39.3
40.3
34.3
39.3
33.0
(9.7)
2.8
-172 (654.6) (251.9)
568
586
757 2,340 2,311 1,594 -52.5%
(27.4)
9.3
73.4 (16.6)
(1.2)
35.5
568
586
757 2,340 2,311 1,598 -52.6%
(27.4)
9.3
23.1 (17.1)
(1.2) 159.8
Financials & Valuations (INR b)
Y/E Mar
2018 2019E
Net Sales
44.6
54.9
EBITDA
4.0
5.5
PAT
2.3
3.8
EPS (INR)
20.5
33.4
Gr. (%)
-1.2
63.0
BV/Sh (INR)
241.1 266.8
RoE (%)
8.8
13.2
RoCE (%)
9.8
13.0
P/E (x)
56.8
34.9
P/BV (x)
4.8
4.4
2020E
66.8
7.1
4.8
42.7
27.7
301.0
15.0
14.6
27.3
3.9
Estimate change
TP change
Rating change
Thermax Consolidated
Y/E March
Sales
Change (%)
EBITDA
Change (%)
As of % Sales
Depreciation
Interest
Other Income
PBT
Tax
Effective Tax Rate (%)
Share of Profit /Loss from JV/Minority
Reported PAT
Change (%)
Adj PAT
Change (%)
22 May 2018
9
 Motilal Oswal Financial Services
Gujarat State Petronet
BSE SENSEX
34,616
Bloomberg
Equity Shares (m)
M.Cap.(INR b)/(USD b)
52-Week Range (INR)
1, 6, 12 Rel. Per (%)
12M Avg Val (INR M)
Free float (%)
S&P CNX
10,517
GUJS IN
563.0
116.6/ 1.7
236 / 154
-8/-20/-14
176.0
62.4
21 May 2018
4QFY18 Results Update | Sector: Oil & Gas
CMP: INR174
TP: INR187 (+8%)
Neutral
EBITDA below estimate; strong transmission volumes
Reported revenue rose 43% YoY (flat QoQ) to INR3.5b, falling short of our
estimate of INR3.6b, primarily due to lower-than-expected transmission volumes
of 34.1mmscmd (est. of 35mmscmd). EBITDA of INR2.9b (+44% YoY, -3% QoQ)
was below our estimate of INR3.1b due to higher O&M expenses of INR164/mscm
(+1% YoY, +20% QoQ). Reported PAT stood at INR1.6b (est. of INR2.0b; +24% YoY,
-13% QoQ) – the difference at the PAT level increased due to lower other income
of INR171m (est. of INR357m; -37% YoY, +42% QoQ) and a higher tax rate of
37.5% (est. of 30%; 30% in 3QFY18 and 28% in 4QFY17).
Strong transmission volumes; in-line implied tariff
Transmission volume grew 46% YoY (+2% QoQ) to 34.1mmscmd (est. of
35mmscmd) in 4QFY18, which is believed to be led by higher offtake from the
power sector.
Implied transmission tariff stood at INR1,126/mscm (est. of INR1,127; -6%
YoY, flat QoQ).
Valuation and view
We model (a) transmission tariff of INR1,200/mscm in FY19/20 v/s actual
INR1,126 in 4QFY18 and (b) volumes of 32mmscmd in FY19/FY20 v/s actual
34.1mmscmd in 4QFY18.
Medium-term risk is some volumes (~5mmscmd) going away with the start of
RIL’s petcoke gasification project. For every 5% variation in volumes/tariff,
earnings change by ~6%. The stock trades at 12.9x FY20E adj. EPS of INR13.4.
Our 10x FY20E P/E based TP stands at INR187. Maintain
Neutral.
FY17
2Q
2,564
-0.7
2,245
87.6
-3.8
436
148
304
1,965
666
33.9
1,298
1,298
7
2.3
24.6
1,079
FY18
2Q
3,348
30.6
2,855
85.3
27.2
438
90
278
2,605
836
32.1
1,770
1,770
36
3.1
31.6
1,112
FY17
3Q
3,502
31.3
2,971
84.8
30.6
442
55
121
2,595
779
30.0
1,816
1,816
53
3.2
33.5
1,123
FY18
(INR Million)
FY18 Var. vs
4QE est
3,611
-3.0%
47.6
3,077
-6.0%
85.2
52.8
460
-4.2%
72
44.1%
357 -52.0%
2,902 -13.2%
871
8.6%
30.0
2,031 -22.5%
2,031 -22.5%
60
3.6 -22.5%
35.0
-2.4%
1,127
-0.1%
Financials & Valuations (INR b)
2018 2019E 2020E
Y/E Mar
13.3
14.4
14.5
Sales
11.5
12.4
12.4
EBITDA
6.9
7.0
7.6
Adj. PAT
12.2
12.5
13.4
Adj. EPS (INR)
38.5
2.5
7.5
EPS Gr. (%)
89.9
99.6 110.0
BV/Sh.(INR)
14.4
13.2
12.8
RoE (%)
11.1
10.2
10.4
RoCE (%)
14.2
13.9
12.9
P/E (x)
1.9
1.7
1.6
P/BV (x)
Estimate change
TP change
Rating change
Quarterly Performance
Y/E March
Net Sales
Change (%)
EBITDA
% of Net Sales
% Change
Depreciation
Interest
Other Income
PBT
Tax
Rate (%)
PAT
Adj. PAT
Change (%)
EPS (INR)
Transmission Vol. (mmscmd)
Implied adj. tariff (INR/mscm)
E: MOSL Estimates
1Q
2,579
-0.5
2,330
90.4
2.6
430
167
147
1,881
668
35.5
1,213
1,213
8
2.2
25.1
1,073
3Q
2,668
3.4
2,275
85.3
0.6
465
165
177
1,822
636
34.9
1,186
1,186
-9
2.1
26.2
1,095
4Q
2,446
5.5
2,013
82.3
-1.6
460
116
273
1,710
441
25.8
1,270
1,270
28
2.3
23.4
1,197
1Q
2,963
14.9
2,760
93.1
18.4
430
106
164
2,389
864
36.2
1,525
1,525
26
2.7
26.9
1,157
4Q
3,504 10,256 13,317
43.2
1.8
29.8
2,892 8,864 11,478
82.5
86.4
86.2
43.7
-0.5
29.5
440 1,791 1,750
103
596
354
171
901
735
2,520 7,378 10,108
946 2,411 3,424
37.5
32.7
33.9
1,574 4,966 6,684
1,574 4,966 6,684
24
7
35
2.8
8.8
11.9
34.1
24.8
31.5
1,126 1,111 1,130
22 May 2018
10
 Motilal Oswal Financial Services
RESULTS
FLASH
BSE SENSEX
34,616
S&P CNX
10,517
MahanagarCorp
Quess star
Blue Gas
Under Review
Buy
21
17
14 May 2018
Results FlashFlash | Sector: OilOthers
Results |Flash | Sector: Goods
Results Sector: Capital & Gas
CMP: INR845
EBITDA below estimate; volume growth strong
Conference Call Details
Date:
22 May 2018
Time:
4:00pm IST
6280 1146
nd
Dial-in details:
+91-22-
Financials & Valuations (INR b)
Y/E March
2018 2019E
Sales
EBITDA
Adj. PAT
Adj. EPS (INR)
EPS Gr. (%)
BV/Sh.(INR)
RoE (%)
RoCE (%)
P/E (x)
P/BV (x)
EV/EBITDA (x)
Div. Yield (%)
Y/E March
22.3
7.8
4.8
54.0
22.7
209.7
27.1
27.0
15.6
4.0
9.1
3.2
24.5
7.8
4.8
53.9
-0.2
231.0
24.5
24.3
15.7
3.7
8.8
3.2
2020E
27.1
7.9
4.9
54.6
1.2
252.5
22.6
22.5
15.5
3.3
8.4
3.2
MGL reported EBITDA of INR1.8b (+8% YoY, -12 QoQ) below our estimate of
INR2b led by lower EBITDA/scm
EBITDA/scm at INR7.0/scm (est. INR8.0/scm; +1% YoY, -12% QoQ)
PBT at INR1.6b (est. INR1.9b; +6% YoY, -15% QoQ).
PAT stood at INR1.05b (est. INR1.3b; +6% YoY, -15% QoQ)
CNG sales stood at 2.05mmscmd (+7% YoY) and PNG at 0.74mmscmd (+7%
YoY)
Management has recommended a final dividend of INR11/share
Valuation view:
We will revisit our estimates post the earnings call. The stock
trades at 10.1x FY19E EPS and 7.2x FY19E EV/EBITDA. Maintain
Buy.
Standalone - Quarterly Earning Model
Net Sales
YoY Change (%)
Total Expenditure
EBITDA
EBITDA/SCM
Margins (%)
Depreciation
Interest
Other Income
PBT
Tax
Rate (%)
Reported PAT
Adj PAT
YoY Change (%)
Margins (%)
Sales Volumes (mmscmd)
CNG
PNG - Domestic
PNG - Industry/ Commercial
PNG - Total
Total Volumes
E: MOSL Estimates
1Q
4,834
-5.9
3,311
1,524
6.7
31.5
216
5
123
1,425
498
34.9
927
927
19.1
19.2
1.86
0.29
0.35
0.64
2.50
(INR m)
FY17
2Q
3Q
5,209 5,043
-3.4
-2.1
3,594 3,372
1,615 1,672
6.8
7.1
31.0
33.1
231
247
1
5
150
124
1,533 1,544
511
554
33.3
35.9
1,022
990
1,022
990
40.9
30.2
19.6
19.6
1.93
0.29
0.37
0.67
2.60
1.88
0.31
0.37
0.68
2.56
4Q
5,253
3.0
3,622
1,631
6.9
31.1
257
-1
130
1,505
510
33.9
995
995
17.9
18.9
1.92
0.32
0.37
0.70
2.62
1Q
5,309
9.8
3,276
2,033
8.7
38.3
246
2
120
1,904
661
34.7
1,243
1,243
34.1
23.4
1.89
0.32
0.36
0.68
2.57
2Q
5,338
2.5
3,335
2,003
8.1
37.5
259
0
139
1,883
635
33.7
1,248
1,248
22.1
23.4
1.99
0.33
0.38
0.71
2.70
3Q
5,814
15.3
3,805
2,009
8.0
34.6
268
0
141
1,883
643
34.1
1,240
1,240
25.2
21.3
2.01
0.34
0.39
0.73
2.74
FY18
4QE 4QAct Var (%) YoY (%) QoQ (%)
6,601 5,870
-11%
12%
1%
25.7
11.7
4,603 4,108
-11%
13%
8%
1,998 1,762
-12%
8%
-12%
8.0
7.0
-12%
1%
-12%
30.3
30.0
292
339
16%
32%
27%
5
1
197
174
-12%
34%
23%
1,898 1,595
-16%
6%
-15%
643
548
-15%
7%
-15%
33.9
34.3
1,255 1,048
-16%
5%
-16%
1,255 1,048
-16%
5%
-16%
26.1
5.3
19.0
17.8
2.01
0.38
0.39
0.77
2.79
2.05
0.35
0.39
0.74
2.80
2%
-8%
1%
-4%
0%
7%
9%
5%
7%
7%
2%
3%
-1%
1%
2%
22 May 2018
11
 Motilal Oswal Financial Services
Sanghi Industries
BSE SENSEX
34,616
Bloomberg
Equity Shares (m)
M.Cap.(INRb)/(USDb)
52-Week Range (INR)
1, 6, 12 Rel. Per (%)
Avg Val, INRm
Free float (%)
S&P CNX
10,517
SNGI IN
Cost push impacts margins, shutdown hurts volumes
251
Volumes impacted by shutdown
:
4QFY18 volumes including clinker fell 20%
24.7 / 0.4
YoY to 0.62mt on account of 15 days shutdown. Realizations increased 7%
144 / 70
QoQ to INR4,091 (est. of INR4,002), led by firm prices in Gujarat. Revenue
-16/-24/9
rose 3% YoY (-9% QoQ) to INR2.5b (est. of INR2.97b).
99.0
34.3
Margins impacted by cost push
:
Unitary cost rose 15% QoQ/30% YoY to
21 May 2018
4QFY18 Results Update | Sector: Cement
CMP: INR98
TP: INR134(+36%)
Buy
Financials & Valuations (INR b)
2018
2019E
Y/E Mar
10.3
12.2
Net Sales
2.2
2.7
EBITDA
0.9
1.8
PAT
3.7
7.3
EPS (INR)
29.5
96.7
Gr. (%)
56.3
64.6
BV/Sh (INR)
7.9
13.8
RoE (%)
9.4
11.9
RoCE (%)
26.4
13.4
P/E (x)
1.7
1.5
P/BV (x)
2020E
14.2
3.4
2.5
9.8
33.8
75.8
15.9
11.8
10.0
1.3
Estimate change
TP change
Rating change
INR3,425/t, led by higher freight and power & fuel costs. Thus, EBITDA/t
declined 22% QoQ (+22% YoY) to INR665, with EBITDA at INR413m (-33%
QoQ/-3% YoY) v/s our estimate of INR714m. The cost push can be attributed to
higher RM cost/t (+INR50/t) due to procurement of high-cost clinker because
of kiln shutdown. Freight cost/t increased in the quarter due to (i) freight costs
of INR70-80m booked in 4QFY18 (was associated with the earlier period) and
(ii) higher pilot charges (impact of INR30m). Interest cost increased 111% YoY
at INR173m. PAT declined 29% YoY to INR186m (est. of INR400m).
FY18 performance
:
Volumes fell 16% YoY to 2.44mt due to lower clinker
sales. Revenue rose 3% YoY to INR10.2b. EBITDA margin expanded 1.2pp
YoY to 21%, led by healthy pricing. Hence, EBITDA rose 9% YoY to INR2.1b,
with EBITDA/t at INR885 (+INR199/t YoY). PAT rose 48% YoY to INR933m.
Valuation view:
SNGI is likely to deliver EBITDA CAGR of 26% over FY18-20,
led by healthy volume growth (driven by higher sales to Mumbai market and
a favorable base) and pricing improvement (driven by higher realizations in
the underlying markets of Gujarat). In our view, SNGI – with 62% earnings
CAGR over FY18-20 – is available at attractive valuations of 6x FY20E EBITDA
and EV/tonne of USD66 on FY20 expanded capacity. We, thus, value the
stock at USD82/t on capacity of 8.2mt (valuing present capacity of ~4mt at
USD100/t and new capacity of ~4mt at USD65/t) and arrive at a TP of
INR134/share.
Buy.
FY18
2Q
3Q
0.46
0.73
(18.5) (13.3)
4,427 3,838
21.8
18.5
2.4 (13.3)
2,056 2,796
-0.8
2.8
467
618
22.7
22.1
180
181
189
173
11
57
109
322
0
0
0.0
0.0
109
322
109
322
28.4 596.7
5.3
11.5
FY17
4Q
0.62
(20.1)
4,091
28.7
6.6
2,536
2.8
413
16.3
185
173
131
186
0
0.0
186
186
-29.2
7.3
2.9
4%
3,452
-5.30
FY18
2.44
(15.6)
4,209
21.9
(INR m)
FY18
Var.
4QE
(%)
0.7
-17%
(4.2)
4,002
2%
25.9
4.3
2,974
-15%
20.6
714
-42%
24.0
176
156
18
400
-54%
0
0.0
400
-54%
400
52.4
13.5
Standalone - Quarterly Earning Model
Y/E March
Sales Dispatches (m ton)
YoY Change (%)
Realization (INR/ton)
YoY Change (%)
QoQ Change (%)
Net Sales
YoY Change (%)
EBITDA
Margins (%)
Depreciation
Interest
Other Income
PBT
Tax
Rate (%)
Reported PAT
Adj PAT
YoY Change (%)
Margins (%)
E: MOSL Estimates
1Q
0.71
0.5
3,807
2.7
8.0
2,707
3.1
655
24.2
180
187
5
292
54
18.6
238
238
9,408.0
8.8
FY17
2Q
3Q
0.57
0.84
10.1
29.9
3,635 3,239
(9.3) (11.9)
(4.5) (10.9)
2,072 2,721
-0.1
14.4
471
424
22.7
15.6
184
184
182
191
6
14
111
62
26
16
23.5
26.1
85
46
85
46
-671.1
-80.4
4.1
1.7
4Q
0.78
(13.6)
3,179
(9.8)
(1.9)
2,467
-22.1
423
17.2
183
82
7
166
-97
-58.4
263
263
-61.7
10.7
1Q
0.67
(6.5)
4,324
13.6
36.0
2,875
6.2
661
23.0
178
187
21
316
0
0.0
316
316
32.9
11.0
9,975 10,264
-2%
2.9
1,982 2,158
19.9
21.0
731
724
642
721
22
220
631
933
0
0
0.0
0.0
631
933
631
933
-48%
47.8
6.3
9.1
22 May 2018
12
 Motilal Oswal Financial Services
Metals Weekly
Thermal coal prices continue to rise
21 May 2018
Update
Indian steel: Long product (TMT Mumbai) prices were unchanged WoW. Sponge iron prices declined ~5%
WoW, while domestic scrap prices were up ~4% WoW. Domestic iron ore prices were unchanged. Pellet prices
were marginally lower. Domestic HRC prices were unchanged. Import and export HRC offers were also
unchanged.
Raw material prices stable: Iron ore prices (China cfr) declined ~1% WoW. Thermal coal prices grew ~4%
WoW. Coking coal prices were unchanged WoW. China’s pellet import prices were also unchanged. Chinese
graphite electrode prices were lower WoW.
Europe: HRC prices were unchanged. CIS HRC export prices declined ~4% WoW. Rotterdam scrap prices were
down ~2% WoW.
China prices stable: Chinese local HRC and rebar prices were stable. Export rebar prices were unchanged, but
HRC prices were up ~1% WoW.
Mixed trend in base metals: Aluminum (cash LME) was up ~1% WoW. Alumina prices were lower WoW.
Copper (cash LME) was down ~1% WoW. Zinc and lead prices were unchanged WoW. Brent crude prices were
up ~2% WoW.
22 May 2018
13
 Motilal Oswal Financial Services
March 2018 Results Preview | Sector: Logistics
Allcargo
Bloomberg
Equity Shares (m)
M. Cap. (INR b)/(USD b)
52-Week Range (INR)
1,6,12 Rel Perf. (%)
AGLL IN
245.7
37 / 1
229 / 145
-13 / -17 / -22
CMP: INR152
We expect AGLL to report EBITDA of INR 994m (-6% YoY, +7%
INR419m (-27% YoY, +20% QoQ) in 4QFY18.
TP: INR198 (+30%)
Buy
QoQ), led by improvement in MTO segment. We expect PAT of
We estimate MTO volumes at 147k TEU (+16% YoY, +2% QoQ) and
CFS volumes at 92k TEU (+20% YoY, +28% QoQ).
Financial snapshot (INR b)
Y/E March
2017 2018E 2019E 2020E
Sales
EBITDA
NP
EPS (INR)
EPS Growth (%)
BV/Share (INR)
RoE (%)
RoCE (%)
Valuations
P/E (x)
P/BV (x)
EV/EBITDA (x)
15.5
2.1
8.8
18.5
1.9
9.6
13.4
1.7
7.2
11.5
1.6
5.8
55.7
4.6
2.4
9.8
-1.2
72.9
13.7
12.1
65.0
4.0
2.0
8.2
-16.5
79.1
10.8
9.5
73.9
4.9
2.8
11.4
38.6
87.3
13.7
11.8
83.7
5.5
3.2
13.2
16.3
96.6
14.4
12.5
We estimate ~6% EBITDA CAGR and ~10% PAT CAGR over FY17-20,
and expect return ratios to improve from ~13.7% in FY17 to ~14.4%
in FY20, driven by margin expansion and reduction in capex
intensity in the business.
The stock trades at a P/E of 13.4x (FY19E) and 11.5x (FY20E), and at
an EV/EBITDA of 7.2x (FY19E) and 5.8x (FY20E). Maintain Buy.
Key issues to watch for
(a) Volume data, and (b) set up of logistics park in Jhajjar.
Consolidated - Quarterly Earning Model
Y/E March
Net Sales
YoY Change (%)
EBITDA
Margins (%)
Depreciation
Interest
Other Income
PBT before EO expense
Extra-Ord expense
PBT
Tax
Rate (%)
Reported PAT
Min. Interest & P& L of Asso. Cos.
Adj PAT
YoY Change (%)
Margins (%)
E: MOSL Estimates
1Q
13,989
-5.2
1,332
9.5
436
75
59
880
0
880
256
29.1
624
-14
610
-24.6
4.4
FY17
2Q
3Q
14,084 14,114
-3.1
6.4
1,261
993
9.0
7.0
434
407
75
78
80
183
832
691
10
0
822
691
178
211
21.7
30.6
643
480
1
12
652
492
5.4
-15.2
4.6
3.5
4Q
13,628
-1.6
1,056
7.7
386
96
149
724
0
724
131
18.1
593
-20
572
-10.6
4.2
1Q
14,834
6.0
1,030
6.9
399
83
159
707
0
707
76
10.8
630
-19
611
0.2
4.1
FY18
2Q
3Q
15,472 14,799
9.9
4.9
1,047
933
6.8
6.3
398
397
71
71
51
49
629
515
0
0
629
515
6
199
1.0
38.7
623
315
15
32
638
348
-2.1
-29.3
4.1
2.3
(INR Million)
FY17
FY18E
4QE
19,878
45.9
994
5.0
392
68
41
574
0
574
131
22.7
444
-25
419
-26.9
2.1
55,816
-0.8
4,642
8.3
1,662
324
471
3,127
10
3,117
776
24.9
2,340
-22
2,414
-3.7
4.3
64,984
16.4
4,004
6.2
1,586
293
300
2,425
0
2,425
412
17.0
2,013
3
2,016
-16.5
3.1
22 May 2018
14
 Motilal Oswal Financial Services
March 2018 Results Preview | Sector: Automobiles
Bharat Forge
Bloomberg
Equity Shares (m)
M. Cap. (INR b)/(USD b)
52-Week Range (INR)
1,6,12 Rel Perf. (%)
BHFC IN
465.7
334 / 5
800 / 511
-6 / 10 / 22
CMP: INR717
TP: INR869 (+21%)
Buy
Financial Snapshot (INR b)
Y/E Mar
2017 2018E 2019E 2020E
Sales
EBITDA
EPS (INR)
EPS Gr. (%)
BV/Sh. (INR)
RoE (%)
RoCE (%)
Valuations
P/E (x)
P/BV (x)
EV/EBITDA(x)
EV/Sales (x)
Consolidated
54.8
8.1
29.0
5.7
35.9
6.9
19.6
4.3
27.2
5.8
15.7
3.7
20.6
4.8
12.5
3.1
64.0
12.5
13.1
-7.2
16.2
9.5
82.1
17.9
20.0
52.8
20.9
13.2
94.2 108.7
22.1
26.4
32.1
23.3
15.8
26.8
34.8
31.7
25.4
18.5
88.4 103.3 123.4 150.6
BHFC’s shipment tonnage is expected to increase by 21.7% YoY
(+3.3% QoQ) to 67,169 tons, as demand for class 8 trucks as well
as domestic CV was strong, along with strong recovery in oil & gas
and industrial segments.
Net realization is expected to increase 4.6% YoY (flat QoQ) to
~INR213.3k/ton.
As a result, net revenue would increase 27.3% YoY (+3.0% QoQ) to
~INR14.3b.
EBITDA margin is likely to expand 180bp YoY (+30bp QoQ) to
30.2%.
PAT is expected to increase by 31.7% YoY (+3.9% QoQ) to INR2.4b.
We maintain our FY19 and FY20E EPS estimates.
The stock trades at 27.2x FY19E and 20.6x FY20E EPS; Maintain
Buy.
Key issues to watch
Update on FY19 outlook for Class 8 trucks & India M&HCV.
Outlook for oil & gas and mining segments, primarily with
regard to price recovery.
Comment on industry-wide supply constraint in domestic CV.
Update on new order wins and ramp-up of past order wins
under commercial vehicles, PVs, aerospace and rail.
Update on capex plans and any capacity addition plans.
Quarterly performance
Tonnage
Change (%)
Realization (INR '000/ton)
Change (%)
Net operating income
Change (%)
RM/Sales (%)
Staff Cost (% of Sales)
Other Exp. (% of Sales)
EBITDA
EBITDA Margins (%)
Non-Operating Income
Interest
Depreciation
EO Exp / (Inc)
PBT after EO items
Eff. Tax Rate (%)
Adj. PAT
Change (%)
E: MOSL Estimates
1Q
49,098
-5.6
184.2
-15.9
9,044
-20.6
34.4
10.1
28.5
2,444
27.0
256
170
740
0
1,791
31.8
1,221
-37.7
FY17
2Q
46,203
-15.3
192.8
-6.4
8,909
-20.7
34.4
10.1
27.6
2,477
27.8
309
189
726
0
1,870
32.2
1,269
-26.3
3Q
47,083
-7.2
200.4
-4.0
9,437
-11.0
32.6
9.6
30.2
2,606
27.6
208
183
739
0
1,892
32.0
1,286
-22.8
4Q
55,189
5.3
204.0
5.7
11,257
11.3
35.1
9.2
27.3
3,200
28.4
222
185
744
-380
2,872
27.8
1,801
8.7
1Q
55,100
12.2
217.9
18.3
12,008
32.8
35.0
8.9
28.3
3,333
27.8
259
185
774
0
2,633
33.5
1,751
43.4
FY18
2Q
58,659
27.0
214.5
11.2
12,580
41.2
35.0
8.5
27.1
3,694
29.4
366
217
781
0
3,063
33.5
2,037
60.5
FY17
3Q
65,050
38.2
213.8
6.7
13,906
47.4
35.6
8.0
26.4
4,163
29.9
219
143
807
0
3,432
33.5
2,282
77.4
(INR m)
FY18E
4QE
67,169 197,573 245,978
21.7
-5.8
24.5
213.3
195.6
214.7
4.6
-4.7
9.8
14,328
38,647 52,822
27.3
-10.2
36.7
35.2
34.2
35.3
8.1
9.7
8.3
26.5
28.3
27.0
4,327
10,726 15,518
30.2
27.8
29.4
229
995
1,074
185
728
730
806
2949
3,168
0
-380
0
3,565
8,425 12,693
33.5
30.6
33.5
2,371
5,587
8,441
31.7
-16.9
51.1
22 May 2018
15
 Motilal Oswal Financial Services
March 2018 Results Preview | Sector: Automobiles
Bosch
Bloomberg
Equity Shares (m)
M. Cap. (INR b)/(USD b)
52-Week Range (INR)
1,6,12 Rel Perf. (%)
BOS IN
31.4
600 / 9
25245 / 16990
4 / -12 / -27
CMP: INR19,116 TP: INR19,096 (0%)
Neutral
Financial Snapshot (INR b)
Y/E Mar
FY17 FY18E FY19E FY20E
Sales
EBITDA
NP
EPS (INR)
EPS Gr. (%)
BV/Sh. (INR)
RoE (%)
RoCE (%)
Valuations
P/E (x)
P/BV (x)
EV/EBITDA(x)
EV/Sales (x)
40.4
6.6
28.9
5.4
41.6
6.1
25.0
4.6
32.8
5.5
19.3
4.0
27.5
4.9
16.2
3.4
104.4 115.2 132.2 150.8
19.6
14.4
-1.8
15.8
23.1
21.3
14.0
-3.0
15.2
23.0
27.2
17.8
27.0
17.5
26.3
31.9
21.2
19.1
18.7
27.9
473.1 459.1 582.9 694.4
2,883.1 3,155 3,501 3,912
Net revenue is expected to grow 16% YoY (-2.6% QoQ) to
INR29.9b, led by strong growth in CVs and Tractors.
EBITDA margin is expected to decline by 290bp YoY (+990bp QoQ)
to 24.4%, impacted by higher import content for BS6 products.
EBITDA is projected to grow 4% YoY (+64% QoQ) to INR7.3b.
Adjusted PAT is likely to increase 5% YoY to INR4.6b.
We cut FY19 EPS by 3.6% and FY20 EPS by 5% to factor in
potentially lower margins on BS6 than original estimate.
The stock trades at 32.8x FY19E and 27.5x FY20E EPS; Maintain
Neutral.
Key issues to watch
Implementation of BS-VI norms for 2-wheelers and underlying
opportunity for Bosch.
Advancement of BS-VI implementation and its impact on Bosch.
Capex plans for BS VI norms.
Further details on EV strategy & competitive positioning in EVs.
Quarterly performance (S/A)
Y/E March
(INR Million)
Net Sales
YoY Change (%)
RM Cost (% of sales)
Staff Cost (% of sales)
Other Expenses (% of sales)
EBITDA
Margins (%)
Depreciation
Interest
Other Income
PBT before EO expense
Extra-Ord expense
PBT after EO Expense
Tax
Tax Rate (%)
Reported PAT
Adj PAT
YoY Change (%)
E: MOSL Estimates
1Q
25,418
10.5
51.3
12.8
17.3
4,734
18.6
860
13
1,566
5,428
0
5,428
1,679
30.9
3,749
3,749
-0.7
FY17
2Q
3Q
26,333 26,927
10.6
8.6
50.1
54.3
13.2
14.4
18.1
20.7
4,911
2,875
18.6
10.7
889
1,294
10
17
1,890
1,427
5,902
2,991
0
0
5,902
2,991
1,673
843
28.3
28.2
4,229
2,148
4,229
2,148
10.8
-23.5
4Q
25,746
2.8
47.6
11.0
14.1
7,037
27.3
1,492
232
1,310
6,624
0
6,624
2,219
33.5
4,405
4,405
-6.8
1Q
26,484
4.2
54.4
12.9
16.2
4,390
16.6
1,062
5
1,295
4,618
0
4,618
1,592
34.5
3,026
3,026
-19.3
FY18E
2Q
28,119
6.8
55.1
12.2
14.5
5,080
18.1
1,108
0
1,290
5,262
0
5,262
1,728
32.8
3,533
3,533
-16.5
FY17
3Q
30,719
14.1
52.8
11.1
21.5
4,457
14.5
1,243
27
1,023
4,211
0
4,211
1,419
33.7
2,792
2,792
30.0
FY18E
4QE
29,916 104,351 115,238
16.2
7.6
10.4
50.0
51.3
50.1
11.9
12.8
13.2
11.2
17.3
18.1
7,310
19,604 21,256
24.4
18.8
18.4
1,522
4,562
4,935
118
272
150
1,292
6,174
4,900
6,962
20,944 21,071
0
0
0
6,962
20,944 21,071
2,320
7,244
7,059
33.3
34.6
33.5
4,643
13,700 14,012
4,643
13,700 14,012
5.4
-9.4
2.3
22 May 2018
16
 Motilal Oswal Financial Services
March 2018 Results Preview | Sector: Healthcare
Cipla
Bloomberg
Equity Shares (m)
M. Cap. (INR b)/(USD b)
52-Week Range (INR)
1,6,12 Rel Perf. (%)
CIPLA IN
804.5
459 / 7
663 / 479
0 / -8 / -15
CMP: INR571
TP: INR600 (+5%)
Neutral
Financial Snapshot (INR Billion)
Y/E MARCH
2017 2018E 2019E 2020E
Sales
EBITDA
NP
EPS (INR)
EPS Gro. (%)
BV/Sh. (INR)
RoE (%)
RoCE (%)
Valuations
P/E (x)
P/BV (x)
EV/EBITDA (x)
Div. Yield (%)
35.9
3.7
20.0
0.4
26.5
3.3
16.0
0.4
21.8
2.9
13.4
0.4
17.8
2.5
11.1
0.4
146.3
24.8
12.8
15.9
-15.5
155.7
10.2
8.1
154.2
30.5
17.3
21.6
35.7
173.9
12.4
9.8
174.8
35.5
21.0
26.2
21.3
197.0
13.3
11.1
197.5
41.3
25.7
32.0
22.3
225.9
14.1
12.2
We expect Cipla’s revenues to grow 9% YoY to INR39b in 4QFY18.
Export formulation business is expected to report muted growth
of ~4% YoY, while domestic business is expected to report robust
growth of ~22% YoY. Export API sales are expected to report
decline of ~12% YoY to INR1.4b.
EBITDA is expected to increase significantly by ~55% YoY with
margin expansion of ~600bp. This is primarily due to lower margin
in 4QFY17 on back of decline in domestic business and higher
R&D expense.
We expect reported PAT to increase significantly by 113% YoY to
INR4.3b on back of margin expansion.
Unlike other large cap peers, Cipla is well poised to deliver robust
growth in the US due to a lower base and a significant pick-up in
the filing quality and rate (filed 32 ANDAs in FY17 and planning to
file 20 in FY18E). We maintain our Neutral rating on the stock with
a TP of INR600 @ 20x 1HFY20E PER.
Key issues to watch out
Launch of combination inhaler in the UK market (USD450m
market size).
Growth outlook for FY19E.
Sustained strong growth in domestic formulations (38% of
sales).
Y/E March
Quarterly Performance
1Q
36,500
-4.9
6,112
16.7
2,038
315
252
4,011
553
13.8
67.6
3,391
3,391
-47.8
9.3
Net Revenues
YoY Change (%)
EBITDA
Margins (%)
Depreciation
Interest
Other Income
PBT after EO expense
Tax
Rate (%)
Minority Interest
Reported PAT
One-off upside
Adj PAT
YoY Change (%)
Margins (%)
FY17
2Q
3Q
37,510 36,472
8.6
17.4
6,807
6,776
18.1
18.6
2,292
2,577
352
593
272
1,535
4,436
5,141
719
1,283
16.2
25.0
173.6
109.8
3,543
3,748
3,543
-34.7
9.4
3,748
8.7
10.3
4Q
35,820
9.7
5,062
14.1
2,322
334
228
2,634
593
22.5
9.3
2,032
2,032
-33.2
5.7
1Q
35,251
-3.4
6,465
18.3
2,134
279
1,514
5,566
1,308
23.5
169.6
4,088
4,088
20.6
11.6
FY18E
2Q
3Q
40,824
39,139
8.8
7.3
8,044
8,187
19.7
20.9
3,022
5,224
420
92
1,133
529
5,735
3,402
1,374
-642
24.0
-18.9
134.7
38.1
4,226
4,006
4,226
19.3
10.4
4,677
24.8
12.0
FY17
4QE
39,031
9.0
7,845
20.1
2,515
238
324
5,415
978
18.1
107.6
4,330
4,330
113.1
11.1
(INR Million)
FY18E
154,244
5.4
30,540
19.8
12,895
1,028
3,500
20,117
3,018
15.0
450.0
16,649
16,649
30.4
10.8
146,300
7.0
24,756
16.9
9,229
1,594
2,287
16,220
3,094
19.1
360.2
12,766
12,766
-30.7
8.7
22 May 2018
17
 Motilal Oswal Financial Services
March 2018 Results Preview | Sector: Healthcare
Dr Reddy’s Labs
Bloomberg
Equity Shares (m)
M. Cap. (INR b)/(USD b)
52-Week Range (INR)
1,6,12 Rel Perf. (%)
DRRD IN
170.5
363 / 6
2788 / 1902
-2 / -15 / -34
CMP: INR2,129 TP: INR2,575 (+21%)
Neutral
Financial Snapshot (INR Billion)
Y/E March
2017 2018E 2019E 2020E
Sales
EBITDA
NP
EPS (INR)
EPS Gro. (%)
BV/Sh. (INR)
RoE (%)
RoCE (%)
Valuations
P/E (x)
P/BV (x)
EV/EBITDA (x)
Dividend Yield (%)
29.3
2.9
15.4
0.5
31.7
2.8
15.0
0.5
18.7
2.4
9.5
0.8
14.6
2.1
7.2
1.0
140.8 144.2 170.9 201.6
24.2
12.0
72.6
-45.1
740
9.7
6.4
24.9
11.4
-7.6
768
9.0
4.8
38.4
19.5
70.0
871
13.9
10.4
48.0
24.9
28.0
997
15.6
12.4
67.1 114.1 146.1
Dr Reddy’s Lab is expected to report moderate growth of ~6% YoY
in 4QFY18, with revenue at INR37.5b.
US business is likely to grow ~6% YoY to INR16.2b on the back of
new launches, while Europe sales are expected to post decline of
~4% YoY. India business is expected to report robust growth of
~16% YoY to INR6.6b.
EBITDA is expected to grow by 30% YoY to INR7.6b and margin to
expand by ~380bp YoY to 20.2% due to lower base in 4QFY17
(which had lower gross margin (due to pricing pressure) and
certain one-off charges).
PAT is expected to increase by ~20% YoY to INR3.7b, led by
margin expansion.
We believe the stock will remain range bound until the time we
do not get more visibility about key launches in the US (including
Aloxi, Nuvaring, Soboxone, Copaxone 20 & 40mg). We maintain
Neutral with a TP of INR2,575 @ 20x 1HFY20E PER.
Key issues to watch out
Update on USFDA resolution of warning letters for Srikakulam,
Duvvada and Miryalaguda API plants.
FY19 outlook for both the generics and PSAI businesses.
Impact of pricing pressure in the US.
Quarterly Performance
Y/E March
Sales
YoY Change (%)
Total Expenditure
EBITDA
Margins (%)
Amortization
Other Income
Profit before Tax
Tax
Rate (%)
Reported PAT
Minority Interest
Net Profit
One-off/low-competition PAT in US
Adjusted PAT
YoY Change (%)
Margins (%)
1Q
32,345
-13.9
28,572
3,773
11.7
2,681
615
1,707
444
26.0
1,263
0
1,263
0
1,263
-79.8
3.9
FY17
2Q
3Q
35,857 37,065
-10.1
-6.6
29,834 28,539
6,023
8,526
16.8
23.0
2,914
2,924
726
320
3,835
5,922
885
1,221
23.1
20.6
2,950
4,701
0
0
2,950
4,701
0
0
3,244
4,701
-55.1
-18.8
9.0
12.7
4Q
35,542
-5.4
29,708
5,834
16.4
3,204
559
3,189
64
2.0
3,125
0
3,125
0
3,125
-16.9
8.8
1Q
33,159
2.5
30,101
3,058
9.2
2,799
513
772
181
23.4
591
0
591
0
591
-53.2
1.8
FY18E
2Q
3Q
35,460 38,060
-1.1
2.7
28,826 30,393
6,634
7,667
18.7
20.1
2,940
2,971
182
1,249
3,876
5,945
1,027
2,601
26.5
43.8
2,849
3,344
0
0
2,849
3,344
0
-930
2,849
4,274
-12.2
-9.1
8.0
11.2
4QE
37,506
5.5
29,921
7,585
20.2
2,969
492
5,108
1,372
26.9
3,736
0
3,736
0
3,736
19.5
10.0
(INR Million)
FY17
140,809
-9.0
116,654
24,155
17.2
11,722
2,220
14,652
2,614
17.8
12,038
0
12,038
0
12,038
-39.8
8.5
FY18
144,185
2.4
119,241
24,944
17.3
11,679
2,436
15,700
5,181
33.0
10,519
0
10,519
0
10,519
-12.6
7.3
22 May 2018
18
 Motilal Oswal Financial Services
March 2018 Results Preview | Consumer
Future Consumer
Bloomberg
Equity Shares (m)
M. Cap. (INR b)/(USD b)
52-Week Range (INR)
1,6,12 Rel Perf. (%)
FCON IN
1834.7
101 / 2
79 / 29
-6 / -15 / 69
CMP: INR55
TP: INR 76 (+39%)
Buy
Financial Snapshot (INR b)
Y/E March
2017 2018E 2019E 2020E
Sales
EBITDA
NP
EPS (INR)
EPS Gr. (%)
BV/Sh. (INR)
RoE (%)
RoCE (%)
Valuations
P/E (x)
P/BV (x)
EV/Sales (x)
EV/EBITDA (x)
-147.9 -546.5 182.0
10.2
4.5
9.2
3.2
8.7
2.3
69.2
48.3
7.4
1.6
31.3
21.2
0.1
-0.6
-0.4
-43.3
5.4
-8.5
0.2
29.7
0.6
-0.2
-0.1
6.0
-1.8
3.3
42.6
1.4
0.5
0.3
6.3
4.9
7.3
59.9
3.1
1.9
1.1
7.4
16.6
13.9
We expect Future Consumer’s (FCON) sales to grow 45% YoY to
INR7.7b.
Gross margins are expected to expand by 30bp YoY to 14.1%.
We estimate EBITDA margin expansion of 200bp YoY to 2.5%.
Hence, we have modeled EBITDA growth of 633.1% and adjusted
PAT to change from loss to profit for the quarter.
The stock trades at 2.3x/1.6x FY19E/20E EV/sales; we have a Buy
rating on the stock.
-72.9 -400.3 276.5
982.4 169.6
Key issues to watch for
If the pace of topline growth will be sustained
Extent of gross margin expansion.
Flow of gross margin expansion into EBITDA margin.
Consolidated - Quarterly Earning Model
Y/E March
Sales
YoY Change (%)
Gross Profit
Margins (%)
Total Expenditure
EBITDA
YoY Change (%)
Margins (%)
Depreciation
Interest
Other Income
PBT
Tax
Rate (%)
Minority Interest & P/L of Asso. Cos
Reported PAT
Adj PAT
YoY Change (%)
Margins (%)
E: MOSL Estimates
1Q
4,671
35.4
662
14.2
4,663
8
-108.5
0.2
77
134
52
-151
7
-4.8
49
-207
-207
-28.7
-4.4
FY17
2Q
3Q
5,637
5,516
30.3
9.3
746
773
13.2
14.0
5,607
5,484
31
32
-143.0
212.6
0.5
0.6
90
89
106
121
54
65
-112
-113
0
0
0.0
0.0
50
27
-162
-140
-162
-140
-43.5
-31.0
-2.9
-2.5
4Q
5,335
27.1
738
13.8
5,309
26
-517.7
0.5
70
88
80
-52
2
-3.3
47
-101
-101
-66.0
-1.9
1Q
6,623
41.8
924
13.9
6,537
86
945.1
1.3
90
128
58
-74
0
0.0
15
-89
-89
-57.2
-1.3
FY18
2Q
7,505
33.1
1,036
13.8
7,378
128
316.7
1.7
113
121
52
-55
0
0.0
33
-88
-88
-45.6
-1.2
FY17
3Q
7,840
42.1
1,076
13.7
7,676
165
416.3
2.1
106
136
46
-31
0
0.0
16
-47
-47
-66.5
-0.6
4QE
7,737
45.0
1,093
14.1
7,547
190
633.1
2.5
61
101
141
168
0
0.0
110
58
58
LP
0.8
21,159
24.3
2,919
13.8
21,062
97
LP
0.5
326
448
250
-427
9
-2.1
174
-610
-610
Loss
-2.9
FY18E
29,705
40.4
4,129
13.9
29,138
568
487.8
1.9
370
486
297
9
0
0.0
174
-165
-165
Loss
-0.6
22 May 2018
19
 Motilal Oswal Financial Services
March 2018 Results Preview | Sector: Oil & Gas
HPCL
Bloomberg
Equity Shares (m)
M. Cap. (INR b)/(USD b)
52-Week Range (INR)
1,6,12 Rel Perf. (%)
Financial snapshot (INR b)
y/e march
2017 2018E
Sales
1,870 2,202
EBITDA
105.8 104.8
Adj. PAT
62.1 60.3
Adj. EPS (INR)
40.7 39.5
EPS Gr. (%)
66.6 (2.9)
BV/Sh.(INR)
133.4 147.5
RoE (%)
32.4 28.2
RoCE (%)
18.8 15.1
Payout (%)
67.4 64.3
Valuations
P/E (x)
8.7
8.9
P/BV (x)
EV/EBITDA (x)
Div. Yield (%)
2.6
6.7
6.5
2.4
7.4
6.2
HPCL IN
1525.5
539 / 8
493 / 324
-4 / -24 / -9
CMP: INR353
TP: INR536 (+52%)
Buy
2019E
2,402
100.2
49.6
32.5
(17.8)
168.6
20.6
10.8
35.1
10.9
2.1
8.1
2.8
2020E
2,507
114.8
57.7
37.8
16.5
193.1
20.9
11.1
35.1
9.3
1.8
7.3
3.2
We expect HPCL’s core earnings to decline YoY/QoQ, led by lower
core GRMs in 4QFY18.
We model nil subsidy-sharing for OMCs; subsidy in 4QFY18 would
be entirely borne by the government.
We peg HPCL’s refinery throughput at 4.6mmt for 4QFY18 v/s
4.6mmt in 4QFY17 and 4.5mmt in 3QFY18.
We model GRM of USD4.6/bbl and total inventory gains of INR5.5b
for HPCL in 4QFY18.
We expect HPCL to report adjusted EBITDA of INR22.4b (-21% YoY,
+33% QoQ) in 4QFY18.
We estimate PAT at INR14.2b (-22% YoY, -27% QoQ) for 4QFY18.
HPCL trades at 9.3x FY20E EPS of INR37.8 and 1.8x FY20E BV
(adjusted for investments), with ~5% dividend yield. Maintain Buy.
Key issues to watch for
GRM
Impact of forex and inventory change
Standalone - Quarterly Earning Model
Y/E March
Net Sales
YoY Change (%)
Total Expenditure
EBITDA
Margins (%)
EBITDA adj. for inventory and one-offs
Depreciation
Interest
Other Income
PBT
Tax
Rate (%)
Reported PAT
YoY Change (%)
Margins (%)
Key Assumptions
Refining throughput (mmt)
Core GRM (USD/bbl)
Marketing sales volume incl exports
(mmt)
Marketing GM incld inv (INR/litre)
E: MOSL Estimates
1Q
448,495
-12.9
411,534
36,961
8.2
21,567
6,108
1,250
2,665
32,268
10,534
32.6
21,734
72.5
4.8
4.5
4.8
8.9
4.7
FY17
FY18E
2Q
3Q
4Q
1Q
2Q
3Q
4QE
421,025 485,556 515,248 534,685 475,226 574,743 617,314 1,870,324 2,201,967
0.0
12.9
25.3
19.2
12.9
18.4
19.8
5.3
17.7
408,416 455,903 486,388 518,405 446,170 543,157 589,442 1,762,241 2,097,175
12,609 29,653 28,860 16,280 29,056 31,585 27,871 108,083 104,792
3.0
6.1
5.6
3.0
6.1
5.5
4.5
5.8
4.8
18,593 18,398 28,203 32,164 21,183 16,873 22,394
86,761
92,613
6,160
6,336
6,749
6,671
6,804
6,799
7,068
25,353
27,342
1,164
530
2,268
1,430
1,563
899
1,581
5,212
5,473
5,469
2,878
4,047
5,703
5,194
4,743
2,105
15,060
17,744
10,755 25,666 23,890 13,883 25,882 28,631 21,326
92,578
89,722
3,741
8,143
5,702
4,636
8,535
9,134
7,108
28,120
29,412
34.8
31.7
23.9
33.4
33.0
31.9
33.3
30.4
32.8
7,013 17,523 18,188
9,247 17,347 19,497 14,218
64,458
60,310
-356.9
60.9
24.9
-57.5
147.4
11.3
-21.8
82.5
-6.4
1.7
3.6
3.5
1.7
3.7
3.4
2.3
3.4
2.7
4.0
4.2
8.0
3.5
4.7
3.9
9.3
3.9
4.6
8.5
8.9
4.0
4.5
8.8
9.3
3.2
4.6
5.6
8.7
3.8
4.5
6.1
9.4
3.1
4.6
4.6
9.2
4.3
17.8
5.4
35.1
4.0
18.3
6.3
36.6
3.6
(INR Million)
FY17
FY18E
22 May 2018
20
 Motilal Oswal Financial Services
March 2018 Results Preview | Sector: Oil & Gas
IOC
Bloomberg
Equity Shares (m)
M. Cap. (INR b)/(USD b)
52-Week Range (INR)
1,6,12 Rel Perf. (%)
IOCL IN
9478.7
1650 / 25
231 / 165
-7 / -20 / -20
CMP: INR174
TP: INR261 (+50%)
Buy
Financial snapshot (INR b)
Y/E MARCH
2017 2018E 2019E 2020E
Sales
EBITDA
Adj. PAT
Adj. EPS (INR)
EPS Gr. (%)
BV/Sh.(INR)
RoE (%)
RoCE (%)
Payout (%)
Valuations
P/E (x)
P/BV (x)
EV/EBITDA (x)
Div. Yield (%)
8.3
1.6
6.6
6.4
8.4
1.5
5.9
7.0
9.9
1.4
6.3
3.0
8.0
1.2
5.3
3.7
3,553 4,320 4,788 5,337
340
198
21
101
108
21
15
64.1
366
196
21
-1
116
18
13
62.9
333
167
18
-15
128
14
11
34.4
386
205
22
23
142
16
13
34.4
We expect IOCL’s core earnings to improve YoY, led by strong GRMs
and healthy marketing margins in 4QFY18.
We model nil subsidy-sharing for OMCs; subsidy in 4QFY18 would
be entirely borne by the government.
We peg IOCL’s refinery throughput at 17.0mmt for 4QFY18 v/s
17.1mmt in 4QFY17 and 18.2mmt in 3QFY18 –Paradip refinery was
under shutdown in Feb-Mar 2018.
We model GRM of USD5.6/bbl and total inventory gains of INR14b
for IOCL in 4QFY18.
We expect IOCL to report adjusted EBITDA of INR75b (-10% YoY,
+8% QoQ) in 4QFY18.
We estimate PAT at INR48b (+30% YoY, -39% QoQ) in 4QFY18.
IOCL trades at 8.0x FY20E EPS of INR22 and at 1.2x FY20E BV.
Dividend yield is 6-7%. Maintain Buy.
Key issues to watch for
Utilization of Paradip refinery
GRM
Capex plans
Forex/inventory changes
Standalone - Quarterly Earning Model
Y/E March
1Q
Net Sales
856,553
YoY Change (%)
-15.3
Total Expenditure
720,652
EBITDA
135,901
Margins (%)
15.9
EBITDA adj. for inventory and one-offs 65,840
Depreciation
14,350
Interest
6,800
Other Income
5,637
PBT
120,388
Tax
37,698
Rate (%)
31.3
Reported PAT
82,690
Adj PAT
82,690
YoY Change (%)
35.2
Margins (%)
9.7
Key Assumptions
Refining throughput (mmt)
16.1
Core GRM (USD/bbl)
3.6
Domestic sale of refined products (mmt)
19.3
Marketing GM/litre net of inv gain
(INR/litre)
3.5
E: MOSL Estimates
FY17
FY18E
2Q
3Q
4Q
1Q
2Q
3Q
4QE
800,435 931,019 1,003,375 1,054,342 905,667 1,106,669 1,290,638 3,591,382 4,357,317
-5.1
13.0
28.0
23.1
13.1
18.9
28.6
3.7
21.3
748,519 848,541 959,289 1,002,427 831,935 973,982 1,201,638 3,277,001 4,009,982
51,916 82,478
44,086
51,915 73,732 132,687
88,999 314,381 347,335
6.5
8.9
4.4
4.9
8.1
12.0
6.9
8.8
8.0
62,044 71,745
83,756
92,335 69,172
69,657
75,004 283,385 306,169
15,048 15,541
17,290
17,213 16,970
17,151
17,145
62,230
68,479
6,147
9,967
11,541
7,180
7,726
6,549
6,860
34,454
28,315
14,347
4,938
20,593
12,276
5,878
13,534
7,518
45,515
39,206
45,069 61,907
35,849
67,878 54,914 122,522
72,513 263,212 317,827
13,850 21,958
-1,358
22,393 17,951
43,690
24,169
72,148 108,203
30.7
35.5
-3.8
33.0
32.7
35.7
33.3
27.4
34.0
31,219 39,949
37,206
45,485 36,963
78,832
48,345 191,064 209,625
31,219 39,949
37,206
26,767 36,963
78,832
48,345 191,064 191,104
-456.2
52.3
85.5
-67.6
18.4
97.3
29.9
84.9
0.0
3.9
4.3
3.7
2.5
4.1
7.1
3.7
5.3
4.4
15.6
4.2
17.3
3.8
16.4
5.1
19.0
4.0
17.1
6.9
18.5
4.0
17.5
6.6
19.8
5.1
16.1
6.9
18.0
3.9
18.2
7.9
19.7
2.9
17.0
5.6
19.3
3.7
65.2
6.4
74.1
3.8
68.8
9.1
76.8
3.9
(INR Million)
FY17
FY18E
22 May 2018
21
 Motilal Oswal Financial Services
March 2018 Results Preview | Sector: Media
Music Broadcast
Bloomberg
Equity Shares (m)
M. Cap. (INR b)/(USD b)
52-Week Range (INR)
1,6,12 Rel Perf. (%)
RADIOCIT IN
57.1
23 / 0
458 / 333
3 / -2 / -2
CMP: INR397
TP: INR469 (+18%)
Buy
Financial Snapshot (INR Billion)
Y/E March
2017 2018E 2019E 2020E
Sales
EBITDA
Adj. NP
Adj. EPS (INR)
Adj.EPS Gr (%)
BV/Sh. (INR)
RoE (%)
RoCE (%)
Valuations
P/E (x)
P/BV (x)
EV/EBITDA (x)
61.7
4.1
23.5
47.5
3.8
21.5
29.3
3.4
15.6
22.3
2.9
11.7
2.7
0.9
0.4
6.4
-26.1
9.7
8.6
3.0
1.0
0.5
8.3
29.9
8.3
8.7
3.5
1.3
0.8
13.5
62.3
12.2
12.0
4.0
1.6
1.0
17.8
31.4
14.0
14.0
We expect revenue to grow 15% YoY to INR762m on the back of
waning GST impact (providing impetus to revival in ad spends
across sectors) and higher utilization at new stations.
EBITDA is expected to rise 53% YoY to INR254m; margin is likely
to expand 836bp YoY to 33.3%.
We expect PAT to grow 170% YoY to INR122m, led by higher
EBITDA.
The stock trades at EV/EBITDA of 15.6x FY19E and 11.7x FY20E.
Maintain Buy.
96.1 104.4 118.0 135.8
Key things to watch for
Growth in utilization in new and old stations.
Yield improvement at legacy stations.
Standalone - Quarterly Earning Model
Y/E March
Net Sales
YoY Change (%)
Total Expenditure
EBITDA
Margins (%)
Depreciation
Interest
Other Income
PBT before EO expense
Extra-Ord expense
PBT
Tax
Rate (%)
Reported PAT
Adj PAT
YoY Change (%)
Margins (%)
E: MOSL Estimates
1Q
628
38.0
437
192
30.5
45
41
11
116
0
116
40
34.5
76
76
-27.5
12.1
FY17
2Q
692
24.7
403
289
41.7
45
41
8
211
0
211
68
32.2
143
116
7.4
16.8
3Q
728
12.3
462
266
36.6
50
50
9
175
0
175
73
41.6
102
102
-52.5
14.0
4Q
666
12.7
500
166
24.9
56
59
17
68
0
68
23
33.3
45
45
-75.7
6.8
1Q
703
11.9
481
222
31.5
64
39
47
166
0
166
57
34.6
108
108
42.3
15.4
FY18
2Q
758
9.5
516
242
31.9
67
38
50
187
0
187
60
32.0
127
127
9.7
16.8
FY17
3Q
762
4.7
529
233
30.6
65
39
43
172
0
172
53
30.9
119
119
16.4
15.6
4QE
762
14.6
508
254
33.3
63
42
37
186
0
186
64
34.6
122
122
170.4
16.0
2,714
20.7
1,802
913
33.6
197
190
44
570
0
570
203
35.7
367
367
32.7
13.5
(INR m)
FY18E
2,985
10.0
2,034
951
31.9
259
158
177
711
0
711
235
33.0
476
476
29.9
15.9
22 May 2018
22
 Motilal Oswal Financial Services
March 2018 Results Preview | Sector: Financials
State Bank of India
Bloomberg
Equity Shares (m)
M. Cap. (INR b)/(USD b)
52-Week Range (INR)
1,6,12 Rel Perf. (%)
SBIN IN
8946.3
2240 / 34
352 / 233
-3 / -6 / -26
CMP: INR250
TP: INR362 (+45%)
Buy
Financial Snapshot (INR B)
Y/E March
2017 2018E 2019E 2020E
NII
753.5 737.2 910.4 1,011.
7
OP
597.0 577.2 718.8 793.6
NP
NIM (%)
EPS (INR)
EPS Gr. (%)
Cons. BV (INR)
Cons. ABV (INR)
RoE (%)
RoA (%)
Div. Payout (%)
Valuations
P/E (x)
P/BV (x)
P/ABV (x)
Div. Yield (%)
-20.2 -4.8 107.2 255.3
2.8
2.6
2.7
2.7
0.3 -0.6 11.8 27.9
- 135.5
-98.1 -77.2
2,186. 294.8
211.3 249.0 264.9
126.9 166.8 206.9 246.7
-1.2 -0.3
5.7 12.5
-0.1
0.0
0.3
0.7
NM
NM 23.9 14.4
NM
0.9
2.0
1.0
NM
1.1
1.4
0.2
21.1
1.1
1.1
1.1
9.0
1.0
0.9
1.6
For historical data, we have done the line-by-line consolidation
for the banking business with associate banks (AB) for
comparison. Hence, YoY growth numbers will not be strictly
comparable.
We expect loan growth to be muted (+4% QoQ) but pick up slowly
from the previous few quarters.
NII is expected to be sequentially flat, as interest reversals are
expected to keep yields under pressure and loan growth remains
sluggish.
Stress additions should continue to be high at 6.5%. Commentary
on RBI resolution with respect to large accounts is a key
monitorable.
We expect credit cost to remain elevated, led by continued stress
additions and focus on shoring up PCR. The stock trades at 0.9x
FY19E consolidated BV and 13.4x FY19E consolidated EPS.
Buy.
Key issues to watch for
Performance and guidance on asset quality.
Outlook and update on ABs’ merger.
Quarterly performance
Y/E March
Net Interest Income
% Change (YoY)
Other Income
Total Income
Operating Expenses
Operating Profit
% Change (YoY)
Other Provisions
Profit before Tax
Tax Provisions
Net Profit
% Change (YoY)
Operating Parameters
Deposits (INR b)
Loans (INR b)
Asset Quality
Gross NPA (INR b)
Gross NPA (%)
Net NPA (INR b)
Net NPA (%)
PCR (%)
E: MOSL Estimates
1Q
1,82,450
3.9
87,610
2,70,060
1,32,450
1,37,610
17.7
1,30,370
7,240
3,510
3,730
-91.8
22,974
17,958
1,377
7.4
782.4
4.4
43.2
FY17
2Q
3Q
1,81,190 1,77,690
0.6
1.4
1,01,460 1,15,070
2,82,650 2,92,760
1,42,770 1,48,750
1,39,880 1,44,010
9.3
19.5
1,48,300 1,19,230
-8,420
24,780
-2,840
6,580
-5,580
18,200
-111.7
94.9
23,790 26,028
18,039 18,069
1,598
8.5
923.7
5.1
42.2
1,082
7.2
614.3
4.2
43.2
4Q
2,10,660
10.5
1,22,220
3,32,880
1,59,780
1,73,100
1.0
2,09,320
-36,220
-1,810
-34,410
-359.6
25,853
18,690
1,779
9.1
969.8
5.2
45.5
1Q
1,76,060
-3.5
80,057
2,56,117
1,37,376
1,18,741
-13.7
89,295
29,446
9,391
20,055
437.7
26,025
18,042
1,881
10.0
1077.6
6.0
42.7
FY18E
2Q
3Q
1,85,857 1,86,875
2.6
5.2
1,60,170
80,842
3,46,027 2,67,717
1,46,028 1,50,171
1,99,999 1,17,546
43.0
-18.4
1,91,374 1,88,762
8,625 -71,216
-7,198 -47,053
15,823 -24,164
-383.6
-232.8
26,232
18,026
1,861
9.8
979.0
5.4
47.4
26,512
18,262
1,991
10.4
1023.7
5.6
48.6
(INR Million)
FY17
4QE
1,88,438 7,53,483
-10.5
299.9
1,10,548 4,28,627
2,98,985 11,82,110
1,58,092 5,85,150
1,40,893 5,96,960
-18.6
323.7
2,03,818 6,09,844
-62,925
-12,884
-46,407
7,355
-16,518
-20,239
-52.0
22.5
26,888
18,931
2,171
11.5
1156.8
6.1
46.7
25,853
18,690
1,779
9.1
969.8
5.2
45.5
FY18E
7,37,230
-2.2
4,31,616
11,68,846
5,91,668
5,77,178
-3.3
6,73,249
-96,071
-91,268
-4,804
-76.3
26,888
18,931
2,171
11.5
1156.8
6.1
46.7
22 May 2018
23
 Motilal Oswal Financial Services
In conversation
1. ASHOK LEYLAND : Will not sacrifice profitability at the cost of
market share; Vinod Dasari, MD
The performance last year was pleasing despite all the challenges that company
had like Supreme Court ban of BS-III vehicles, goods and services tax (GST) and a
significant shift towards higher tonnage vehicles.
Company maintained market share despite many challenges, grew on the export
markets substantially, turned around the light commercial vehicle (LCV) business
and made the foundry business profitable.
Infrastructure boom is giving rise to strong tipper demand.
Demand will be higher if overloading ban continues in Uttar Pradesh.
Believe that company should not create a pricing policy which is focused on
buying market share. Market share is important but profitability is also
important. Will work hard and sell company’s products based on performance of
the products and not on the basis of price.
2. INDOSTAR CAPITAL : IPO proceeds will strengthen capital base
of the company; R Sridhar, Executive Vice-Chairman & CEO
Rs 700 crore is coming into the company as a primary capital - strengthens the
capital base of the company, which is required for company’s growth plan for
next two-three years.
Came with Rs 1,844 crore of issue, out of which Rs 700 had been the primary
and the balance Rs 1,044 had been offer for sale which goes to the existing
shareholders who have sold.
Confident that the existing capital plus the Rs 700 crore which is coming in is
sufficient for next three years.
CV biz has got extraordinary potential and will be a focus.
Current loan book stands at INR 7000 crores out of 77% is corporate.
Company has recently started diversifying into retail business. Will aggressively
focus on growing biz in retail segment going forward.
3. TATA CHEMICALS : Eyeing Rs 5,000 crore revenue from
consumer business in 3-4 years; R Mukundan, MD and CEO
Company is expected to be debt free very soon. Currently, consolidate net debt
is around Rs 1800 crore, while standalone is already positive cash.
The revenues were a bit down because of the company's decision to restructure
the business.
The strongest impact has come from the pulses category where the company
completely changed strategy from long supply chain to short supply chain. There
was also more focus on consumer business in modern trade channels.
All this restructuring aided margins but impacted revenues. Revenues will be
good going forward.
Company has a target of Rs 5,000 crore in revenues from consumer business in
three to four years. Pulses is a big business in India and the company is
diversifying into various products in that category. It is also penetrating in the
spice space and hope to grow that further.
22 May 2018
24
 Motilal Oswal Financial Services
Margins mainly depend on market conditions and for last six to seven months
the conditions were favourable for the company. Would guide to stick to 18%
margins, but definitely strive for better numbers now that they have tested 20%.
With regards to Europe business, operational issues impacted and not the main
product sales.
The exceptional income in the profit after tax number would not be there in the
next quarter. Overall they would be able to maintain the profit numbers.
4. MANAPPURAM FINANCE : Looking for acquisition in home
finance business; VP Nandakumar, MD & CEO
Looking for acquisition in home finance business as the quality parameters in
housing portfolio has improved.
Growth started in Q3 and still continues and collections are back to normal level
in microfinance book.
Gold loan is witnessing around 2-4% every quarter in the collateral growth. AUM
growth should be at 20% for FY19.
This may lead to around 10-15% growth in gold loan in the current year and
other businesses like microfinance is completely back to normal; the
disbursements are happening and collections are 100%. So company’s aim is to
grow to Rs 3,200 crore this year.
5. PRABHAT DAIRY : Ice cream business could be in Rs 100 crore
category in 4-5 years;
6. Vivek Nirmal, Joint Managing Director
Ice cream is a small segment of the business and is not more than Rs 10 crore of
the overall revenues currently. It will continue to be in the test launch phase in
FY19 as well. However, it could be in Rs 100 crore category over the next 4-5
years once it goes statewide.
Post-2020, the company see a lot of distribution efficiencies and sales
efficiencies coming in, and expect to report double-digit margins.
The company is largely focused in Maharashtra and cover 40,000 outlets in the
state, said Nirmal. The milk procurement prices have remained stable around Rs
23 currently.
Promoters have no intention of selling their stake and would in fact look at
upping these stake at the right price.
22 May 2018
25
 Motilal Oswal Financial Services
From the think tank
1. A bumpy ride ahead for the Indian stock market
After rising about 1% in the intraday trade, as votes were being counted in
Karnataka, the benchmark S&P BSE Sensex ended the day in the red after it
became clear that the Bharatiya Janata Party (BJP) would not be able to cross the
halfway mark to attain a simple majority. Clearly, the stock market was focusing
on what the Karnataka results mean for the Lok Sabha election in 2019. The base
case for the market is that the Narendra Modi-led National Democratic Alliance
government will be voted back to power in 2019. However, there is still about a
year to go before the next general election and a lot can happen on the political
front during this period. A post-poll alliance between the Congress and Janata Dal
(Secular) could be a major step forward in attaining opposition unity. Similar
alliances in large states, like Uttar Pradesh, could affect the BJP’s prospects in
2019. The stock market will closely watch the political situation as it unfolds. The
next big test for the BJP will be assembly elections in states like Rajasthan,
Madhya Pradesh and Chhattisgarh. Any indication of the political momentum
shifting away from the ruling party will affect sentiment in the market. Investors
like political stability and chances of uncertainty will not bode well for the market.
2. The ev vision shouldn’t run out of charge
The automotive industry is quietly but resolutely preparing for the electric
vehicle (EV) revolution. No less than 22 original equipment manufacturers
(OEM) for automobiles have registered themselves as EV manufacturers in the
last three years and they plan to manufacture 77 EV variants. At the same time,
we have seen a lot of debate about India’s EV vision. The dominant belief is that
India will need both internal combustion and EV technologies to survive and
coexist. There are many reasons for this belief to have taken shape; but this
piece aims to focus on the issue of batteries. Whether it is pure EVs or hybrids,
the one thing common among them is the battery—what really makes the
vehicles electric. The lithium-ion batteries, based on various chemistries of
lithium, are widely considered to be a long-term constituent of all EVs. However,
the EV vision often assumes that batteries will be available in plenty at
unprecedented low price points, and this hypothesis in turn assumes that the
basic constituents of lithium-ion cells will always be available in surplus.
3. The smart cities project must promote diversity
India is urbanizing at 100 times the scale of the first country in the world to
urbanize—the UK. India has launched a big urban agenda focused on building 100
smart cities. India’s urban population will reach 600 million people by 2030, twice
the size of the US. India will urbanize in just one-tenth of the time taken by
developed countries. How will urbanization and smart cities impact growth and
jobs? Will it take place through specialisation or diversification? The debate on
whether cities grow through specialization or diversification is an old question
dating back to Alfred Marshall and Jane Jacobs. The field of city agglomeration
and city clusters notes that similar firms from the same industry benefit from
locating together. These externalities and spillovers come from within industries,
especially when concentration is high, and can lead to local job growth. These
spillovers emerge from within industries, but only in the presence of competition.
22 May 2018
26
 Motilal Oswal Financial Services
4. The fortune at the bottom of pyramid
The concept ‘Bottom of the Pyramid’ was first used by US President Franklin D
Roosevelt in 1932, while talking about the poor people who are often forgotten
because they live at the bottom of the economic pyramid. Bottom of the
pyramid, also called the base of the pyramid, is a phrase in economics that
refers to the poorest two-thirds of the economic human pyramid. Management
scholar CK Prahalad popularised the idea of this demographic segment as a
profitable consumer base in his 2004 book ‘The Fortune at the Bottom of the
Pyramid’ co-authored by Stuart Hart. Prahalad has some useful insights about
consumer needs in poor societies and opportunities for the private sector to
serve important public purposes while enhancing its own bottom line. Four
consumer tiers: At the top of the pyramid are 75-100 million affluent
consumers. These are cosmopolitan groups composed of middle- and upper-
income people in developed countries, and rich elites from the developing world
(they are tier one). At the middle of the pyramid, in tiers two and three, are
poor customers in developed nations and the rising middle classes in developing
countries—they have been and are the target market for MNCs for whom
strategies are made. At the bottom of the pyramid, tier four consists of 4 billion
people earning $2 or less per day.
International
5. Donald Trump’s dangerous triple gamble
Even by the standards of dystopia set by the Donald Trump administration,
events of the past fortnight have plumbed an alarming new nadir. The unilateral
spiteful decision to pull out of the Iran nuclear agreement and re-impose US
sanctions, followed by the inflammatory decision to move the US embassy from
Tel Aviv to Jerusalem, and the ill-conceived approach of disarming North Korea’s
nuclear fangs without any reciprocal “give” have plunged inter-state relations—
not to mention Washington’s reputation—to a new low. Initiating and managing
any one of these would have proved a calculated risk for a functional
administration; Trump’s dangerous triple gamble reflects a lethal mix of hubris
and sciolism. Trump’s decision on Iran is akin to releasing the emergency brakes
on an explosive-laden car precariously parked on a steep slope. Trump’s
rationale that the deal neither addressed Iran’s missile programme nor Tehran’s
interventions in Syria and Yemen is entirely disingenuous; pulling out of the deal
and imposing unilateral sanctions in no way prevents either.
22 May 2018
27
 Motilal Oswal Financial Services
Click excel icon
for detailed
valuation guide
Valuation snapshot
Company
Automobiles
Amara Raja
Ashok Ley.
Bajaj Auto
Bharat Forge
Bosch
CEAT
Eicher Mot.
Endurance Tech.
Escorts
Exide Ind
Hero Moto
M&M
Mahindra CIE
Maruti Suzuki
Motherson Sumi
Tata Motors
TVS Motor
Aggregate
Banks - Private
Axis Bank
DCB Bank
Equitas Hold.
Federal Bank
HDFC Bank
ICICI Bank
IDFC Bank
IndusInd
J&K Bank
Kotak Mah. Bk
RBL Bank
South Indian
Yes Bank
Aggregate
Banks - PSU
BOB
BOI
Canara
Indian Bk
PNB
SBI
Union Bk
Aggregate
NBFCs
Aditya Birla Cap
Bajaj Fin.
Capital First
Cholaman.Inv.&Fn
Dewan Hsg.
GRUH Fin.
HDFC
HDFC Stand. Life
Indiabulls Hsg
L&T Fin Holdings
LIC Hsg Fin
Reco
Buy
Buy
Buy
Buy
Neutral
Buy
Buy
Buy
Neutral
Buy
Neutral
Buy
Buy
Buy
Buy
Buy
Neutral
CMP TP % Upside
EPS (INR)
EPS Gr. YoY (%)
P/E (x)
P/B (x)
ROE (%)
(INR) (INR) Downside FY18E FY19E FY20E FY18E FY19E FY20E FY18E FY19E FY18E FY19E FY18E FY19E
811 952
134 179
2720 3450
696 869
17625 19096
1352 1845
29445 35572
1225 1530
882 982
247 301
3495 4052
827 914
238 274
8428 10468
324 437
297 565
563 635
17
33
27
25
8
36
21
25
11
22
16
11
15
24
35
91
13
27.6
5.4
151.3
20.0
459.1
64.0
799.6
29.1
39.5
8.2
185.1
39.7
9.6
266.7
8.1
24.8
13.9
31.5 38.1
7.3
9.3
169.9 199.5
26.4 34.8
582.9 694.4
84.9 115.3
1,050.3 1,347.1
38.4 51.0
52.4 65.5
10.1 12.8
201.2 229.1
46.9 51.2
13.7 16.6
349.9 444.8
12.5 17.5
57.0 65.7
19.7 28.8
-1.5
23.9
7.3
52.8
-3.0
-31.5
27.0
23.8
88.0
0.4
9.5
45.1
107.8
7.3
5.0
25.2
18.7
17.2
-92.8
13.8
-82.3
-1.3
19.4
-31.0
0.3
25.2
LP
21.3
27.3
-25.5
26.3
4.0
14.2
36.2
12.3
32.1
27.0
32.8
31.3
32.0
32.5
23.5
8.6
18.0
43.1
31.2
54.7
129.8
41.5
47.2
-
22.4
710.5
21.3
16.9
68.7
7.2
37.9
13.5
24.5
46.1
77.8
31.7
44.7
20.8
26.8
17.4
31.7
19.1
35.8
28.3
32.9
25.0
26.1
13.9
9.3
20.5
27.1
39.6
15.3
46.1
20.6
29.4
25.0
18.0
34.8
38.4
21.1
36.8
42.1
22.3
30.1
18.9
20.8
24.8
31.6
40.0
12.0
40.3
24.9
25.7
18.3
16.0
26.3
30.2
15.9
28.0
31.9
16.8
24.4
17.4
17.6
17.3
24.1
25.9
5.2
28.5
16.9
27.2
18.5
21.3
14.0
25.1
16.3
12.5
23.1
5.0
31.4
22.6
7.5
13.8
22.2
14.5
15.6
29.5
8.2
NM
13.1
NM
16.3
27.1
33.8
12.4
20.6
11.9
57.0
37.4
73.6
10.2
18.0
10.6
4.7
5.5
4.1
6.7
5.6
2.1
11.4
7.9
3.5
3.9
5.9
3.4
2.4
6.1
7.2
1.4
9.3
4.3
2.1
2.2
2.4
1.3
4.9
1.8
0.9
4.9
0.5
4.8
3.1
0.9
3.0
3.3
0.8
0.5
0.6
0.9
0.6
1.0
0.4
0.8
4.1
4.6
3.7
5.6
5.0
1.9
8.6
6.6
3.0
3.5
5.3
3.1
2.1
5.2
6.0
1.1
7.5
3.6
1.9
2.0
2.2
1.2
3.8
1.7
0.8
4.2
0.5
4.4
2.9
0.8
2.5
2.8
17.0
23.7
24.2
20.9
15.2
10.3
35.2
21.0
18.3
12.9
33.8
14.6
10.4
18.5
19.2
13.2
25.1
17.4
0.5
10.9
1.4
8.3
17.9
6.7
6.8
16.5
9.1
10.9
11.6
6.6
17.7
10.2
17.1
27.4
24.4
23.3
17.5
12.5
35.0
22.6
19.3
14.4
32.1
14.8
13.1
21.4
25.4
24.3
29.0
21.5
7.4
11.1
10.7
9.0
16.9
10.8
6.9
19.6
9.9
12.0
13.3
11.0
19.9
12.6
Buy
Neutral
Buy
Buy
Buy
Buy
Neutral
Buy
Buy
Buy
Buy
Buy
Buy
529
181
160
81
1992
290
40
1921
50
1274
499
25
334
600
198
185
127
2400
380
65
2150
100
1400
650
34
444
13
10
16
57
20
31
61
12
98
10
30
38
33
1.1
8.0
0.9
4.8
67.8
10.6
3.0
60.2
8.8
32.5
15.1
1.9
18.4
19.4
9.7
7.5
5.8
79.3
17.8
3.2
83.0
10.0
40.5
22.1
3.3
24.3
35.8
11.5
11.9
8.2
94.5
24.1
3.8
104.4
14.4
50.1
29.5
4.6
32.1
84.1 475.8
17.9 22.7
58.1 173.0
42.4 17.0
19.3 29.4
35.2 27.4
19.2 13.4
25.8 31.9
43.6 5.7
23.6 39.1
33.6 33.0
38.8 13.3
32.3 18.1
33.1 32.1
75.6 38.0
91.8 NM
378.2 NM
22.1 11.7
LP
NM
81.6 85.7
LP
NM
126.8 0.0
42.1
33.4
27.5
19.1
22.8
20.4
18.9
25.8
20.9
49.3
18.7
38.4
45.3
16.1
24.7
16.4
66.5
43.4
88.7
12.3
24.7
12.1
Buy
Neutral
Neutral
Buy
Neutral
Buy
Neutral
130
98
246
307
78
245
87
185
112
266
371
85
362
97
43
14
8
21
9
48
12
3.4
-18.8
-63.5
26.2
-50.3
2.9
-56.5
8.9
6.3
8.3
37.3
-9.6
18.7
-1.5
15.7 -43.1 161.5
12.1 Loss LP
39.9
PL
LP
45.6 -10.4 42.5
8.0
PL Loss
34.0 861.1 553.8
5.7
PL Loss
PL
LP
0.8 2.0 5.0
0.5 -7.7 3.0
0.6 -12.2 1.8
0.8 8.3 11.0
0.6 -29.6 -6.8
0.9 -0.3 5.7
0.4 -23.8 -0.7
0.7 -4.8 4.6
Buy
Buy
Buy
Buy
Buy
Neutral
Buy
Buy
Buy
Buy
Neutral
144
2105
551
1541
613
659
1820
489
1109
167
476
215
2450
960
1930
765
600
2225
475
1650
240
610
49
16
74
25
25
-9
22
-3
49
44
28
3.8
5.3
7.5
NA 41.5
46.5 62.3 83.1 45.6 33.9
34.2 44.6 56.8 38.9 30.2
62.3 75.0 89.3 35.5 20.4
37.4 51.7 63.5 26.2 38.4
9.9 11.6 13.9 21.9 16.6
42.0 48.7 57.9 5.3 16.1
5.5
6.6
8.4 23.5 20.4
90.2 108.8 131.5 31.5 20.6
6.8
9.3
13.9 29.5 37.4
39.4 45.0 53.5 3.0 14.3
3.7 2.9 12.4 12.1
7.4 6.2 20.7 20.1
2.1 1.8 13.7 15.6
4.7 3.9 20.6 20.7
2.2 1.9 14.1 17.4
19.5 16.2 32.6 31.0
4.9 4.2 18.4 17.5
3.2 2.7 21.7 21.7
3.7 3.1 30.7 33.2
2.7 2.4 13.4 14.1
2.0 1.7 17.0 17.2
22 May 2018
28
 Motilal Oswal Financial Services
Click excel icon
for detailed
valuation guide
CMP
(INR)
580
460
399
1259
578
2164
1408
TP % Upside
EPS (INR)
(INR) Downside FY18E FY19E FY20E
750
29
24.4 31.1 38.9
600
30
14.5 20.7 26.5
470
18
43.0 44.8 48.9
1750
39
49.9 65.7 87.3
740
28
32.9 39.0 46.0
2800
29
100.8 145.9 175.9
1950
38
69.1 118.2 141.5
EPS Gr. YoY (%)
FY18E FY19E FY20E
62.2 27.5 25.2
104.9 42.9 27.9
45.6 4.1 9.2
57.7 31.8 32.9
13.0 18.5 18.1
19.5 44.8 20.6
24.7 71.0 19.8
27.2 27.2 24.3
Valuation snapshot
P/E (x)
P/B (x)
ROE (%)
FY18E FY19E FY18E FY19E FY18E FY19E
23.8
18.7 3.6 3.1 21.3 17.8
31.7
22.2 3.0 2.8 10.5 13.1
9.3
8.9
2.1 1.8 24.1 21.4
25.3
19.2 3.4 3.0 14.3 16.5
17.6
14.8 2.7 2.3 16.7 16.9
21.5
14.8 2.6 2.3 12.7 16.3
20.4
11.9 2.5 2.1 13.1 19.5
31.4 24.7 4.6 3.9 14.6 15.9
60.7
18.0
23.8
46.7
46.5
62.7
32.0
22.2
35.4
46.7
20.4
27.1
52.3
45.4
55.9
13.7
31.4
30.8
34.5
28.4
36.9
49.5
21.8
44.7
51.6
33.9
55.6
43.0
35.3
26.4
41.4
45.7
38.3
61.5
66.1
50.4
47.9
42.0
NM
51.1
35.6
64.5
30.7
53.2
44.1
16.2
20.8
31.8
38.9
38.4
23.8
20.3
32.2
36.6
18.7
22.8
38.4
38.3
32.1
12.9
26.7
25.5
25.6
22.2
18.2
36.8
10.6
19.5
29.9
27.5
22.3
21.0
17.6
13.8
31.8
31.8
24.6
50.8
51.5
42.7
41.3
34.5
181.6
44.5
31.6
54.5
28.2
40.1
7.1 6.3 11.6 14.3
3.0 2.7 16.6 16.7
0.8 0.8 3.6 4.0
8.1 7.2 18.1 24.0
19.1 15.2 48.7 43.5
1.1 1.0 1.7 2.7
5.1 4.7 16.5 20.7
3.2 2.9 13.9 14.1
7.7 6.7 23.5 22.3
8.7 7.7 18.7 21.0
4.7 3.9 23.1 20.8
3.4 3.1 13.0 14.0
4.8 4.4 9.1 11.5
9.2 7.7 21.9 22.0
4.8 4.3 8.8 14.0
2.2 1.9 17.1 16.0
4.6 4.1 15.9 16.3
3.3 3.1 10.9 12.1
2.1
2.8
1.7
4.5
1.5
0.8
3.1
4.6
2.4
4.9
2.2
1.7
6.3
4.1
3.1
14.8
19.5
24.5
11.5
11.5
9.2
11.8
7.2
48.3
6.7
7.0
1.9
2.7
1.6
4.0
1.3
0.7
2.8
4.0
2.2
4.1
2.0
1.5
5.3
3.7
2.8
13.6
17.2
23.0
10.5
10.1
8.7
9.2
6.4
45.0
6.3
6.7
6.1
10.1
4.6
9.5
6.9
1.7
6.1
14.3
4.4
11.9
6.5
7.9
16.3
9.3
8.1
25.3
32.9
49.9
25.9
29.2
-1.8
24.9
21.2
78.1
22.3
13.4
7.8
12.4
8.9
11.5
12.9
3.9
9.8
15.6
10.3
21.2
12.0
13.5
18.2
12.2
11.5
27.9
35.5
55.5
26.5
31.3
4.9
23.2
21.4
85.5
23.0
17.1
Company
MAS Financial
M&M Fin.
Muthoot Fin
PNB Housing
Repco Home
Shriram City Union
Shriram Trans.
Aggregate
Capital Goods
ABB
Bharat Elec.
BHEL
Blue Star
CG Cons. Elec.
CG Power & Indu.
Cummins
Engineers India
GE T&D
Havells
K E C Intl
L&T
Siemens
Solar Ind
Thermax
Va Tech Wab.
Voltas
Aggregate
Cement
Ambuja Cem.
ACC
Birla Corp.
Dalmia Bharat
Grasim Inds.
India Cem
JK Lakshmi Ce
Ramco Cem
Orient Cem
Prism Johnson
Sagar Cements
Sanghi Inds.
Shree Cem
Ultratech
Aggregate
Consumer
Asian Paints
Britannia
Colgate
Dabur
Emami
Future Consumer
Godrej Cons.
GSK Cons.
HUL
ITC
Jyothy Lab
Reco
Buy
Buy
Neutral
Buy
Buy
Buy
Buy
Sell
Buy
Sell
Neutral
Buy
Neutral
Buy
Buy
Neutral
Buy
Neutral
Buy
Neutral
Neutral
Buy
Buy
Neutral
1203
118
75
703
240
72
738
140
364
524
366
1314
1032
1106
1147
455
544
1060
196
80
860
270
90
1040
200
430
630
410
1690
1185
1100
1370
700
620
-12
67
6
22
12
26
41
43
18
20
12
29
15
-1
17
54
14
19.8
6.5
3.2
15.1
5.2
1.1
23.0
6.3
10.3
11.2
17.9
48.6
19.8
24.4
20.5
33.3
17.3
27.3
7.3
3.6
22.1
6.2
1.9
31.0
6.9
11.3
14.3
19.6
57.6
26.9
28.9
35.7
35.2
20.4
32.1 8.1 37.7 17.7
7.8
3.7 11.4 7.6
4.3 135.9 14.2 19.4
29.6 17.0 46.8 33.8
7.5 14.3 19.5 22.0
3.0 -72.2 63.3 58.8
36.8 -13.2 34.7 18.6
8.2 48.1 9.2 19.8
12.9 79.8 9.7 14.2
17.1 17.4 27.4 19.3
25.5 51.1 9.2 30.6
69.0 14.8 18.5 20.0
31.9 10.9 36.2 18.8
36.8 18.2 18.6 27.4
45.5 -1.2 74.1 27.2
38.6 76.4 5.7 9.8
22.7 11.9 17.9 11.2
16.8 20.4 18.9
10.7
79.6
50.6
104.4
111.8
9.4
21.8
37.8
8.7
6.5
70.6
9.9
683.8
171.3
29.5
31.3
-30.5
42.7
-29.8
-48.5
5.8
-11.9
LP
769.4
LP
29.5
1.1
-12.3
-5.7
34.9
28.1
102.8
34.3
105.6
129.3
72.3
23.4
148.6
105.1
101.0
92.3
30.3
43.8
55.9
31.9
31.0
26.0
40.5
14.2
41.8
71.6
27.6
62.2
32.7
39.7
38.8
35.1
41.3
29.9
Neutral
Neutral
Buy
Buy
Neutral
Neutral
Buy
Buy
Buy
Buy
Not Rated
Buy
Buy
Buy
208 255
1345 1747
731 1020
2736 3403
1039 1187
129 148
380 451
814 967
120 170
102 144
889
-
98
134
16075 19731
3852 4818
23
30
40
24
14
14
19
19
42
41
36
23
25
6.0
47.4
19.8
55.3
47.6
2.9
7.4
24.0
2.2
2.4
25.2
3.7
388.5
84.3
8.1
60.7
40.2
74.3
97.9
6.6
12.7
29.7
5.4
4.9
50.6
7.1
506.3
121.2
Neutral
Buy
Buy
Buy
Buy
Buy
Neutral
Neutral
Buy
Neutral
Neutral
1300
5525
1208
372
1019
55
1079
5932
1579
282
438
1280
6400
1420
435
1390
76
1155
6255
1805
295
425
-2
16
18
17
36
39
7
5
14
5
-3
21.1
83.6
24.0
7.8
24.3
-0.1
21.1
166.5
24.5
9.2
8.2
25.6 30.5 1.9 21.1 19.0
107.4 133.2 13.5 28.4 24.0
28.3 33.8 12.9 17.9 19.7
9.0
10.4 7.2 16.0 15.5
29.6 35.6 -8.5 21.9 20.4
0.3
1.1 Loss LP 276.5
24.3 28.1 11.7 14.9 15.9
187.8 215.6 6.6 12.8 14.8
29.0 35.4 24.7 18.3 22.3
10.0 11.3 9.5 8.8 13.4
10.9 13.0 -26.7 32.7 19.4
22 May 2018
29
 Motilal Oswal Financial Services
Click excel icon
for detailed
valuation guide
CMP TP % Upside
EPS (INR)
Reco
(INR) (INR) Downside FY18E FY19E FY20E
Neutral
310 350
13
6.4
7.6
9.0
Neutral
9480 9535
1
140.0 189.3 209.0
Buy
22946 27490
20
297.1 415.7 549.8
Buy
1095 1115
2
17.6 20.6 23.7
Neutral
9206 9065
-2
131.3 162.1 187.8
Not Rated 173
-
3.5
6.4
9.7
Buy
1142 1450
27
14.1 17.4 22.9
Neutral
3118 3510
13
32.6 56.9 78.5
EPS Gr. YoY (%)
FY18E FY19E FY20E
2.0 18.3 18.2
13.2 35.2 10.4
24.5 39.9 32.2
5.4 17.0 14.9
-1.2 23.4 15.8
-2.0 83.8 52.1
62.0 23.9 31.2
22.1 74.3 38.1
10.1 18.9 18.0
Valuation snapshot
P/E (x)
FY18E FY19E
48.3
40.8
67.7
50.1
77.2
55.2
62.1
53.1
70.1
56.8
49.7
27.1
81.1
65.5
95.5
54.8
50.4 42.3
17.6
21.6
19.1
11.6
58.2
17.5
19.9
25.8
16.6
53.9
15.2
11.2
55.6
22.8
12.5
16.5
20.3
30.5
16.9
21.2
20.6
21.8
21.0
34.9
8.7
20.2
22.4
15.7
11.0
26.0
17.2
23.1
P/B (x)
ROE (%)
FY18E FY19E FY18E FY19E
15.7 13.7 34.0 35.8
26.7 23.8 40.3 50.2
30.8 24.6 39.9 44.6
14.0 12.2 24.2 24.5
37.0 31.2 57.0 59.7
2.4 2.2 4.9 8.5
11.4 9.9 14.9 16.2
16.4 12.2 17.2 22.3
13.3 12.0 26.3 28.4
3.8 3.3 19.6 19.4
4.6 3.9 16.4 19.5
4.3 3.6 26.0 20.4
2.8 2.3 24.2 21.7
7.3 6.7 7.2 11.5
4.4 3.7 21.6 22.8
3.0 2.6 12.4 13.3
5.5 4.9 16.0 20.0
2.5 2.2 9.0 13.9
1.2 1.2 1.2 2.2
2.7 2.3 16.4 15.3
1.6 1.5 13.2 13.9
12.2 15.1 19.7 27.2
3.1 2.8 10.5 13.0
3.0 2.4 18.9 21.5
3.2 2.7 11.9 17.8
2.5 2.3 15.8 11.8
5.6 5.1 16.1 16.8
3.2 2.7 11.0 17.4
1.2 1.2 3.9 5.7
2.8 2.6 8.5 13.2
4.6 4.1 17.6 19.9
3.4 3.0 12.7 14.5
2.5
1.3
3.6
3.3
2.2
1.6
3.6
1.8
3.1
2.3
1.2
3.0
2.9
1.9
1.4
3.4
1.7
2.9
2.2
14.6
23.6
13.5
12.4
10.8
9.4
5.0
9.0
6.9
14.1
16.2
13.7
12.4
13.7
13.4
10.1
12.7
Company
Marico
Nestle
Page Inds
Pidilite Ind.
P&G Hygiene
Prabhat Dairy
United Brew
United Spirits
Aggregate
Healthcare
Alembic Phar
Alkem Lab
Ajanta Pharma
Aurobindo
Biocon
Cadila
Cipla
Divis Lab
Dr Reddy’s
Fortis Health
Glenmark
Granules
GSK Pharma
IPCA Labs
Jubilant Life
Laurus Labs
Lupin
Sanofi India
Shilpa Medicare
Strides Shasun
Sun Pharma
Torrent Pharma
Aggregate
Infrastructure
Ashoka Buildcon
IRB Infra
KNR Constructions
Sadbhav Engineering
Aggregate
Logistics
Allcargo Logistics
Concor
Gateway Distriparks
Aggregate
Media
Dish TV
D B Corp
Den Net.
Ent.Network
Hathway Cable
Hind. Media
HT Media
Jagran Prak.
Music Broadcast
PVR
Neutral
Buy
Buy
Buy
Neutral
Buy
Neutral
Neutral
Neutral
Buy
Neutral
Buy
Neutral
Buy
Buy
Buy
Buy
Buy
Buy
Buy
Buy
Neutral
444
1937
987
566
628
352
520
1136
1894
149
501
89
2368
668
780
449
736
4941
410
341
444
1336
500
2500
1560
820
600
555
600
1100
2575
185
550
175
2500
750
1110
586
865
5600
686
481
675
1400
13
29
58
45
-4
58
15
-3
36
25
10
97
6
12
42
31
18
13
67
41
52
5
21.9
65.4
53.0
43.8
6.2
16.0
21.6
32.9
67.1
1.5
30.6
6.3
38.3
21.4
45.6
15.8
46.8
141.7
13.3
11.3
13.2
48.0
25.2 28.2 2.5 14.9 12.0 20.3
89.5 110.6 -12.4 36.9 23.6 29.6
51.6 65.0 -7.5 -2.6 25.9 18.6
48.7 53.6 11.4 11.2 10.1 12.9
10.8 19.8 -39.2 73.9 83.3 101.1
20.1 23.3 12.7 25.5 15.9 22.0
26.2 32.0 35.7 21.3 22.3 24.1
44.0 52.7 -17.7 33.9 19.7 34.6
114.1 146.1 -7.6 70.0 28.0 28.2
2.8
7.3 -85.8 87.8 164.5 101.1
32.9 41.1 -22.2 7.7 24.7 16.4
7.9
11.0 -12.4 25.2 38.7 14.0
42.6 48.5 11.5 11.2 13.7 61.8
29.2 37.3 33.2 36.6 27.7 31.2
62.6 72.5 23.3 37.3 15.9 17.1
27.3 34.3 -10.9 72.1 25.8 28.3
36.2 48.0 -17.4 -22.5 32.5 15.7
161.8 186.9 9.8 14.2 15.5 34.9
24.3 30.6 -5.0 82.4 25.9 30.8
16.1 28.1 -65.1 42.6 75.0 30.3
21.5 27.7 -49.6 63.3 28.8 33.7
61.3 78.5 -12.9 27.6 28.0 27.8
-17.3 28.2 25.4 26.9
7.0
26.0
14.0
16.0
8.3
26.5
18.2
17.4
LP 238.0 18.1 118.1
17.5 9.0 1.9
9.4
41.2 -17.3 30.2 16.7
27.1 14.9 8.6 25.8
17.6
-16.5
12.5
-32.1
2.9
PL
-13.8
Loss
-37.2
Loss
-7.5
78.9
-5.3
29.9
29.9
38.6
52.1
109.0
52.3
LP
16.4
LP
113.8
LP
0.1
-20.8
30.5
62.3
42.4
16.3
21.0
14.4
19.8
109.9
21.6
5,545
86.9
161.9
10.2
10.4
21.5
31.4
34.7
15.2
39.5
36.0
35.1
Buy
Neutral
Buy
Buy
244
225
282
359
290
290
375
460
19
29
33
28
2.1
23.9
16.9
13.9
Buy
Buy
Buy
125 198
1386 1553
169 199
58
12
18
8.2
35.1
4.7
11.4
53.4
9.8
13.2
64.6
11.2
Buy
Buy
Neutral
Buy
Buy
Neutral
Neutral
Buy
Buy
Buy
70
265
95
637
27
216
76
164
334
1337
101
324
90
820
47
237
92
215
469
1760
44
22
-5
29
75
10
21
31
40
32
-0.3
17.6
-2.9
7.2
-0.2
23.9
13.2
10.1
8.3
26.7
1.6
20.5
0.1
15.3
0.8
23.9
10.5
13.1
13.5
38.0
3.4
24.9
4.0
28.7
2.0
26.3
11.5
16.0
17.8
51.2
NM
43.8 16.7 12.1 -7.8 32.1
15.1
12.9 2.5 2.2 18.4 18.2
NM 1,338.6 2.2 2.1 -6.3 0.2
88.9
41.6 3.4 3.2 3.9 7.9
NM
35.3 1.9 1.8 -1.2 5.2
9.0
9.0
1.2 1.1 14.0 12.4
5.8
7.3
0.7 0.6 12.8 9.1
16.2
12.4 2.6 2.3 14.9 18.5
40.0
24.7 3.2 2.8 8.3 12.2
50.1
35.2 5.8 5.0 12.2 15.3
22 May 2018
30
 Motilal Oswal Financial Services
Click excel icon
for detailed
valuation guide
CMP
(INR)
82
14
939
555
TP % Upside
EPS (INR)
(INR) Downside FY18E FY19E FY20E
130
59
2.5
5.8
7.9
27
93
-0.9
0.1
0.6
1200
28
27.7 35.0 40.6
690
24
14.5 16.5 19.7
EPS Gr. YoY (%)
FY18E FY19E FY20E
100.6 137.5 36.4
Loss LP 411.6
11.6 26.2 15.9
8.4 14.1 19.0
15.3 33.0 28.1
Valuation snapshot
P/E (x)
P/B (x)
ROE (%)
FY18E FY19E FY18E FY19E FY18E FY19E
33.4
14.1 3.4 2.2 11.6 18.9
NM 110.8 2.7 2.6 -15.8 2.4
33.8
26.8 8.0 7.3 25.2 28.4
38.3
33.6 7.1 6.1 19.6 19.4
35.8 26.9 5.1 4.5 14.2 16.6
12.1
13.7
NM
13.3
16.9
8.3
NM
9.4
12.5
8.0
13.6
40.8
9.9
15.5
40.2
13.7
7.9
8.0
27.6
15.0
7.8
13.0
11.1
15.1
15.3
11.2
85.0
10.8
72.7
55.3
20.0
14.3
25.7
18.3
20.1
23.0
29.9
24.6
23.0
19.8
30.0
26.9
17.2
14.0
23.1
20.8
8.8
10.8
37.6
10.2
7.4
8.1
16.6
6.3
9.4
6.4
9.7
26.8
9.6
14.2
25.4
13.1
9.6
9.4
23.5
15.6
8.9
8.8
8.5
13.2
13.3
10.2
61.1
8.5
56.5
42.8
18.1
13.4
22.5
16.9
18.6
20.8
23.6
19.8
18.8
17.0
25.8
23.6
16.2
13.8
18.2
19.7
1.4
3.4
0.8
2.7
1.5
1.4
0.8
1.9
1.7
1.2
1.6
11.2
2.2
1.8
6.3
1.9
2.1
1.4
5.3
4.0
1.6
0.9
1.0
3.3
1.9
1.5
1.3
2.8
0.8
2.2
1.3
1.3
0.8
1.5
1.5
1.0
1.4
8.4
1.9
1.7
5.3
1.7
1.9
1.3
4.5
3.6
1.4
0.9
1.0
2.8
1.6
1.3
12.8
26.7
-2.7
22.5
8.4
18.2
-1.0
22.9
13.3
17.8
11.7
30.7
24.1
11.9
16.7
15.0
28.2
18.5
20.7
28.0
21.3
7.4
9.6
23.7
13.0
13.2
15.5
28.6
2.1
23.9
18.3
17.2
4.8
26.3
17.1
17.4
14.7
35.9
21.6
12.0
22.7
14.0
20.6
14.4
20.8
24.4
16.8
10.5
12.0
22.9
13.2
13.1
Company
Prime Focus
Siti Net.
Sun TV
Zee Ent.
Aggregate
Metals
Hindalco
Hind. Zinc
JSPL
JSW Steel
Nalco
NMDC
SAIL
Rain Industries
Vedanta
Tata Steel
Aggregate
Oil & Gas
Aegis Logistics
BPCL
GAIL
Gujarat Gas
Gujarat St. Pet.
HPCL
IOC
IGL
Mahanagar Gas
MRPL
Oil India
ONGC
PLNG
Reliance Ind.
Aggregate
Retail
Jubilant Food
PC Jeweller
Titan Co.
Aggregate
Technology
Cyient
HCL Tech.
Hexaware
Infosys
KPIT Tech
L&T Infotech
Mindtree
Mphasis
NIIT Tech
Persistent Sys
Tata Elxsi
TCS
Tech Mah
Wipro
Zensar Tech
Aggregate
Reco
Buy
Neutral
Buy
Buy
Buy
Neutral
Buy
Buy
Buy
Buy
Sell
Buy
Buy
Neutral
229
290
240
309
73
113
72
222
266
577
371
336
349
394
120
215
71
426
345
705
62
16
45
27
64
90
-1
92
30
22
18.9
21.1
-8.5
23.3
4.3
13.6
-0.9
23.7
21.3
71.9
26.1
26.8
6.4
30.4
9.9
14.0
4.3
35.2
28.3
90.0
29.3 120.5 38.2 12.1
30.6 7.2 26.8 14.2
10.4 Loss LP 62.3
30.5 57.5 30.2 0.2
10.2 16.8 128.2 3.2
14.7 37.0 2.9 4.7
6.5 Loss LP 50.2
39.8 238.1 48.5 13.2
35.3 40.7 33.0 24.7
67.4 76.5 25.2 -25.1
72.9 40.6 7.0
12.3
46.5
24.6
41.6
13.9
37.8
21.7
12.5
54.6
12.3
28.1
23.5
18.8
74.9
74.2
-17.3
23.9
32.0
43.8
-2.9
-1.2
6.9
27.0
-13.3
-18.3
2.3
23.0
20.7
5.6
52.1
2.9
8.8
58.1
4.9
-17.8
-15.0
17.7
-3.6
-12.0
48.1
29.6
14.3
15.0
9.5
28.5
13.0
7.7
24.2
4.5
16.5
23.1
13.2
1.2
9.1
3.3
8.2
17.9
6.8
10.7
Buy
Buy
Sell
Buy
Neutral
Buy
Buy
Buy
Buy
Neutral
Buy
Buy
Buy
Buy
256 303
394 554
325 285
851 1122
174
187
313 536
165 261
260 416
841
-
100 120
239 260
186 222
211 320
932 1150
18
41
-12
32
8
71
58
60
-
20
9
20
52
23
6.3
40.0
21.0
21.2
12.7
39.5
20.7
9.4
55.9
12.8
18.3
16.8
14.0
60.9
9.5
41.2
22.9
33.5
13.3
32.5
17.6
11.1
53.9
11.3
27.2
21.8
16.0
70.1
Neutral
Buy
Buy
2528 2450
166 520
916 1125
-3
213
23
29.7
15.4
12.6
41.4
19.5
16.2
54.4 180.6 39.1 31.4
24.9 44.4 26.6 27.6
20.5 39.5 28.8 26.1
48.8 29.1 27.1
11.8
8.0
11.0
10.8
29.2
17.9
23.9
9.6
19.4
21.7
18.6
10.9
16.4
13.0
27.2
10.9
17.2 14.9 20.3 24.3
1.7 1.5 16.9 18.4
16.0 14.3 23.9 26.7
10.7 9.4 19.4 22.0
3.6
3.4
6.5
4.1
2.8
6.6
6.2
3.8
3.6
3.1
10.0
8.3
3.5
2.5
3.3
5.1
3.3
3.1
5.5
3.7
2.4
5.3
5.3
3.5
3.2
3.0
7.9
7.1
3.0
2.1
2.9
4.6
18.1
25.0
26.9
24.1
14.9
32.4
18.8
14.6
16.2
16.7
37.6
30.3
20.9
17.0
15.3
24.6
18.1
24.0
26.4
22.9
14.0
28.4
24.3
18.3
18.2
18.7
34.3
32.5
20.1
16.4
17.1
23.2
Neutral
Neutral
Sell
Buy
Neutral
Buy
Buy
Neutral
Neutral
Buy
Buy
Neutral
Buy
Neutral
Buy
764
896
427
1183
251
1525
1027
1081
1048
799
1161
3558
685
265
1220
800
1050
390
1330
250
1400
1000
960
1100
860
1400
3000
700
300
1400
5
17
-9
12
-1
-8
-3
-11
5
8
21
-16
2
13
15
38.2
62.6
16.6
64.8
12.5
66.3
34.4
44.0
45.6
40.4
38.7
132.1
39.8
18.9
52.8
42.2 47.1 24.8 10.3
66.9 72.2 4.5 6.9
18.9 21.0 21.2 14.2
70.1 77.7 3.1 8.3
13.5 17.5 5.1 7.8
73.3 86.3 19.5 10.5
43.5 53.9 38.0 26.7
54.6 59.8 13.2 23.9
55.7 66.6 19.8 22.3
47.0 57.2 7.2 16.4
45.0 53.4 37.7 16.2
150.5 166.9 -1.0 13.9
42.3 49.3 28.8 6.4
19.2 21.7 11.8 1.3
67.0 85.2 1.3 27.0
4.9 5.6
22 May 2018
31
 Motilal Oswal Financial Services
Click excel icon
for detailed
valuation guide
Valuation snapshot
Company
Telecom
Bharti Airtel
Bharti Infratel
Idea Cellular
Tata Comm
Aggregate
Utiltites
Coal India
CESC
JSW Energy
NHPC
NTPC
Power Grid
Tata Power
Aggregate
Others
Arvind
Avenue Supermarts
BSE
Castrol India
Coromandel Intl
Delta Corp
Interglobe
Indo Count
Info Edge
Kaveri Seed
Manpasand
MCX
Navneet Education
Oberoi Realty
Phoenix Mills
Quess Corp
PI Inds.
Piramal Enterp.
SRF
S H Kelkar
Tata Chemicals
Team Lease Serv.
Trident
TTK Prestige
UPL
V-Guard
Reco
Buy
Neutral
Buy
Buy
CMP TP % Upside
EPS (INR)
EPS Gr. YoY (%)
P/E (x)
P/B (x)
ROE (%)
(INR) (INR) Downside FY18E FY19E FY20E FY18E FY19E FY20E FY18E FY19E FY18E FY19E FY18E FY19E
360
320
53
609
581
346
85
730
61
8
61
20
4.1
13.6
-9.6
3.5
1.9
13.7
-12.3
7.5
5.6 -63.3 -53.8 197.1
14.2 -8.1 0.4 3.6
-10.5 Loss Loss Loss
21.1 -67.2 115.3 182.9
-98.8 PL
LP
88.4
23.5
NM
175.7
2,903.2
15.2
11.8
23.1
10.7
12.7
12.6
14.7
13.4
191.4 2.1 2.1 2.4 1.1
23.4 3.5 3.6 15.6 15.2
NM
0.8 1.1 -16.0 -21.9
81.6 34.8 24.4 9.4 35.1
-128 2.1 2.2 0.1 -1.7
10.2
9.9
16.8
8.7
10.8
10.3
12.4
10.4
26.3
79.1
17.0
24.5
18.9
32.1
16.1
10.7
45.1
11.9
31.1
25.5
14.1
10.3
35.0
38.5
25.1
20.2
18.8
25.4
16.0
39.9
7.8
32.6
14.6
37.8
7.2
1.2
1.0
0.9
1.3
2.0
1.4
2.0
6.7
1.1
1.0
0.9
1.2
1.7
1.1
1.8
47.4
10.3
4.6
8.6
10.6
16.6
10.7
14.7
65.8
11.1
6.1
10.3
11.6
17.7
9.7
17.5
Buy
Buy
Sell
Buy
Buy
Buy
Sell
270
1011
70
26
164
213
79
397
1440
61
36
214
287
77
47
42
-13
38
30
35
-2
17.8 26.4 30.8 19.2 48.4 16.5
85.6 102.0 111.7 65.0 19.2 9.5
3.0
4.2
4.8 -21.2 37.9 16.1
2.4
3.0
3.2 -17.2 22.2 7.0
13.0 15.2 16.6 5.0 16.9 9.3
16.9 20.7 21.9 21.3 22.1 6.0
5.3
6.3
7.8
3.5 18.7 22.7
11.7 29.0 11.1
12.2
12.9
43.5
7.0
22.7
5.8
58.3
6.3
23.4
34.2
8.8
21.2
7.7
13.5
15.8
21.8
26.7
83.1
80.4
7.9
48.2
43.0
5.3
137.8
44.2
4.5
Neutral
Sell
Buy
Buy
Buy
Buy
Neutral
Neutral
Buy
Buy
Buy
Buy
Buy
Buy
Buy
Buy
Buy
Buy
Buy
Buy
Buy
Buy
Buy
Neutral
Buy
Neutral
391
1348
806
166
444
232
1133
79
1187
485
432
738
137
517
712
1108
844
2354
1877
246
734
2701
54
5736
682
225
460
900
1000
248
557
327
1318
95
1550
664
467
1050
195
654
737
1350
958
3500
2206
318
941
3400
83
5281
945
167
18
-33
24
49
25
41
16
20
31
37
8
42
42
26
4
22
14
49
18
29
28
26
52
-8
39
-26
14.8 20.3 -1.4 21.6 36.5 32.0
17.0 22.5 68.4 31.9 32.0 104.3
47.4 57.2 6.0 9.0 20.9 18.6
6.8
7.1
2.9 -2.8 4.0 23.8
23.5 27.9 38.8 3.7 18.4 19.6
7.2
10.2 89.8 24.5 41.4 40.0
70.2 94.1 35.1 20.4 34.1 19.4
7.4
8.7 -46.0 17.1 16.6 12.5
26.3 33.4 49.0 12.5 27.1 50.8
40.6 47.4 79.5 18.5 17.0 14.2
13.9 18.7 38.2 58.4 34.6 49.2
28.9 33.7 -14.6 36.5 16.6 34.8
9.8
11.5 4.7 27.4 17.6 17.9
50.3 48.6 21.4 271.7 -3.4 38.2
20.3 26.6 44.2 28.4 30.9 45.0
28.8 39.8 115.7 31.8 38.3 50.8
33.7 39.9 -20.2 26.3 18.5 31.7
116.4 147.9 14.5 40.0 27.1 28.3
99.6 129.8 -10.3 23.9 30.2 23.3
9.7
12.2 9.1 22.4 26.6 31.1
45.9 54.8 39.7 -4.8 19.5 15.2
67.6 98.6 28.0 57.1 45.8 62.8
7.0
8.3 -21.8 32.7 18.7 10.3
176.1 203.2 4.4 27.8 15.4 41.6
46.7 55.6 5.9 5.6 19.2 15.4
6.0
6.7 25.3 32.9 12.1 50.2
2.7 2.5 8.6 9.8
18.0 15.5 18.9 21.1
1.4 1.2 7.6 6.8
16.1 15.1 69.1 63.8
4.2 3.6 22.1 20.6
3.9 3.5 12.3 11.5
6.2 5.8 41.3 37.0
1.6 1.4 13.9 14.1
6.7 6.0 13.7 14.0
3.5 3.0 23.4 27.1
4.0 3.7 7.2 12.3
2.7 2.6 7.9 10.4
4.1 3.5 24.2 26.9
2.9 2.3 7.8 25.1
3.8 3.0 9.6 9.6
5.1 4.4 18.8 15.3
6.0 5.1 20.7 22.1
2.2 1.9 8.9 10.2
3.1 2.7 13.7 15.4
4.0 3.6 13.4 14.9
1.7 1.6 24.9 10.2
10.2 8.1 17.6 22.6
0.9 0.9 9.2 11.4
7.1 6.4 18.0 20.7
3.8 3.1 26.9 23.3
12.3 9.8 26.9 28.8
22 May 2018
32
 Motilal Oswal Financial Services
MOSL Universe stock performance
Company
Automobiles
Amara Raja
Ashok Ley.
Bajaj Auto
Bharat Forge
Bosch
CEAT
Eicher Mot.
Endurance Tech.
Escorts
Exide Ind
Hero Moto
M&M
Mahindra CIE
Maruti Suzuki
Motherson Sumi
Tata Motors
TVS Motor
Banks - Private
Axis Bank
DCB Bank
Equitas Hold.
Federal Bank
HDFC Bank
ICICI Bank
IDFC Bank
IndusInd
J&K Bank
Kotak Mah. Bk
RBL Bank
South Indian
Yes Bank
Banks - PSU
BOB
BOI
Canara
Indian Bk
PNB
SBI
Union Bk
NBFCs
Aditya Birla Cap
Bajaj Fin.
Capital First
Cholaman.Inv.&Fn
Dewan Hsg.
GRUH Fin.
HDFC
HDFC Stand. Life
Indiabulls Hsg
L&T Fin.Holdings
LIC Hsg Fin
M&M Fin.
Muthoot Fin
1 Day (%)
-2.2
-9.5
-2.1
-3.8
-0.5
-1.8
-2.3
-3.5
1.2
-2.9
-1.9
-0.9
-1.8
-1.0
-0.5
-2.9
-1.7
-0.8
-0.6
-3.1
-1.8
-1.0
1.1
-1.7
-0.3
-2.7
-1.6
-1.9
-3.9
-3.3
2.5
5.3
4.4
2.2
4.6
2.5
4.4
-2.7
-1.8
-1.2
-1.1
0.0
-2.4
-2.0
-0.9
-2.7
-3.7
-1.0
-0.7
-2.8
1M (%)
-4.9
-13.5
-4.7
-8.7
-9.4
-14.5
-5.5
-6.6
-8.2
1.7
-6.7
3.3
0.6
-6.7
-7.6
-11.8
-15.7
4.5
-7.2
6.3
-16.4
1.6
2.7
-17.1
5.9
-13.4
10.3
-1.3
-5.6
8.3
-9.6
-4.0
-4.9
1.4
-16.5
1.5
-5.2
-7.8
12.0
-14.3
-1.6
4.8
0.5
-0.6
-1.3
-18.2
1.5
-11.8
-9.2
-7.5
12M (%)
-9.3
58.1
-8.5
31.7
-23.5
-24.0
5.5
53.3
38.0
3.7
-2.2
24.0
-3.9
24.2
14.9
-33.1
7.1
5.6
-5.4
1.4
-28.0
27.7
3.8
-33.5
38.3
-40.4
35.9
-10.2
-6.3
16.8
-31.2
-45.0
-33.1
-10.8
-49.7
-20.5
-50.1
Company
MAS Financial Serv.
PNB Housing
Repco Home
Shriram City Union
Shriram Trans.
Capital Goods
ABB
Bharat Elec.
BHEL
Blue Star
CG Cons. Elec.
CG Power & Inds Sol.
Cummins
Engineers India
GE T&D
Havells
K E C Intl
L&T
Siemens
Solar Ind
Thermax
Va Tech Wab.
Voltas
Cement
Ambuja Cem.
ACC
Birla Corp.
Dalmia Bharat
Grasim Inds.
India Cem
JK Lakshmi Ce
Ramco Cem
Orient Cem
Prism Johnson
Sagar Cements
Sanghi Inds.
Shree Cem
Ultratech
Consumer
Asian Paints
Britannia
Colgate
Dabur
Emami
Future Consumer
Godrej Cons.
GSK Cons.
HUL
ITC
Jyothy Lab
Marico
Nestle
Page Inds
Pidilite Ind.
1 Day (%)
-1.8
-1.2
0.2
-1.0
-0.2
-1.1
-3.3
-1.8
-5.0
-2.1
-2.3
0.6
-2.8
-2.7
0.1
-4.3
-0.2
0.0
-2.9
-1.2
-0.3
-1.5
-1.7
-2.2
-2.1
1.6
-2.1
0.1
0.0
-3.2
-4.8
-4.0
-2.6
-1.6
-1.4
-0.2
-0.5
-1.1
-1.3
-0.7
-1.1
-4.9
-0.2
0.0
-1.6
0.0
0.4
-2.4
-2.2
-0.7
1.4
1M (%)
-5.2
-7.4
-5.5
-5.3
-10.4
-6.1
-11.0
-15.6
-11.2
4.2
-14.1
-2.2
-8.4
-5.8
-4.5
-15.2
-3.6
-3.8
6.4
2.3
-14.2
-14.5
-15.5
-14.1
-2.1
-5.6
-5.7
-13.9
-9.8
-3.7
-15.6
-15.8
-5.5
-15.1
-4.9
-5.6
12.2
3.7
9.9
5.1
-10.8
-7.1
-3.4
-0.7
7.7
2.2
18.1
-2.1
3.4
-5.6
3.0
12M (%)
-0.8
-23.3
0.3
40.8
-21.3
-25.7
-31.3
8.8
7.8
-21.9
-23.8
-15.6
0.2
8.1
49.2
14.3
-25.0
34.3
16.8
-32.3
30.8
-17.2
-19.9
-4.7
12.7
11.0
-37.7
-19.6
18.6
-21.4
-15.4
2.5
22.8
-13.9
-11.7
15.8
54.0
19.0
35.1
-7.9
72.0
20.1
12.1
56.7
-1.3
17.3
0.0
45.2
58.0
43.9
63.0
-21.0
48.8
51.3
66.1
19.6
6.4
31.7
-30.2
45.9
5.2
22 May 2018
33
 Motilal Oswal Financial Services
MOSL Universe stock performance
Company
P&G Hygiene
Prabhat Dairy
United Brew
United Spirits
Healthcare
Alembic Phar
Alkem Lab
Ajanta Pharma
Aurobindo
Biocon
Cadila
Cipla
Divis Lab
Dr Reddy’s
Fortis Health
Glenmark
Granules
GSK Pharma
IPCA Labs
Jubilant Life
Lupin
Laurus Labs
Sanofi India
Shilpa Medicare
Strides Shasun
Sun Pharma
Torrent Pharma
Infrastructure
Ashoka Buildcon
IRB Infra.Devl.
KNR Construct.
Sadbhav Engg.
Logistics
Allcargo Logistics
Concor
Gateway Distriparks
Media
Dish TV
D B Corp
Den Net.
Ent.Network
Hathway Cab.
Hind. Media
HT Media
Jagran Prak.
Music Broadcast
PVR
Prime Focus
Siti Net.
Sun TV
Zee Ent.
Metals
Hindalco
Hind. Zinc
JSPL
1 Day (%)
-1.1
-1.7
0.5
-1.1
-4.9
-1.3
-3.6
-2.1
-3.3
-4.8
-2.7
-1.6
-4.2
2.7
-0.4
-6.7
-1.0
-4.4
-4.7
-1.1
-2.2
0.5
-6.2
-11.9
-4.5
-0.5
-6.9
-5.2
-5.7
-2.6
-3.1
-0.5
1.5
0.4
6.1
-4.2
-3.4
-6.9
-0.7
-2.7
-0.5
-3.6
-2.5
-4.4
-5.4
-1.4
-2.0
-1.6
-2.6
-2.5
1M (%)
-5.5
-5.5
1.4
-9.8
-11.5
9.0
-27.8
-8.5
-1.6
-8.6
-11.6
-4.9
-10.7
-0.6
-12.5
-17.4
-2.7
-4.6
2.3
-7.8
-11.7
-1.2
-9.3
-46.3
-12.2
-4.3
-8.5
-14.6
-13.8
-9.8
-16.6
3.2
-5.9
-10.3
-15.4
-6.7
-7.9
-30.4
-4.6
-13.2
1.1
-13.5
1.4
-6.4
-12.2
5.9
-5.4
-12.8
-11.5
-4.6
12M (%)
21.4
42.5
47.5
62.3
-26.1
3.3
-41.1
-5.1
92.1
-23.4
-7.7
85.8
-28.7
-27.0
-24.1
-40.3
-3.0
26.2
11.1
-44.0
-18.3
21.4
-41.9
-64.4
-32.0
3.8
18.3
-5.6
38.1
10.1
-29.8
15.9
-31.2
-29.0
-27.8
-0.8
-19.1
-34.0
-21.8
-7.6
-12.2
-1.8
-12.0
-27.8
-55.8
10.1
8.7
19.6
17.9
114.8
Company
JSW Steel
Nalco
NMDC
Rain Industries
SAIL
Vedanta
Tata Steel
Oil & Gas
Aegis Logistics
BPCL
GAIL
Gujarat Gas
Gujarat St. Pet.
HPCL
IOC
IGL
Mahanagar Gas
MRPL
Oil India
ONGC
PLNG
Reliance Ind.
Retail
Jubilant Food
PC Jeweller
Titan Co.
Technology
Cyient
HCL Tech.
Hexaware
Infosys
KPIT Tech
L&T Infotech
Mindtree
Mphasis
NIIT Tech
Persistent Sys
Tata Elxsi
TCS
Tech Mah
Wipro
Zensar Tech
Telecom
Bharti Airtel
Bharti Infratel
Idea Cellular
Tata Comm
Utiltites
Coal India
CESC
JSW Energy
NHPC Ltd
NTPC
Power Grid
Tata Power
1 Day (%)
-3.3
3.7
-1.4
-7.9
-2.6
-1.7
-2.5
-2.6
2.1
1.3
-1.1
-3.3
0.4
0.9
-1.9
-2.3
-3.2
-2.0
0.3
-3.5
-0.2
1.2
1.5
-2.5
-3.7
0.6
0.3
-0.1
-3.7
-0.5
2.1
-3.9
1.1
0.4
0.7
1.6
-0.8
-1.7
-2.2
-0.5
1.7
1.3
0.0
1.3
-0.9
-2.9
-0.2
-1.2
0.1
-2.4
1M (%)
-4.1
-14.8
-7.9
-37.5
-10.0
-13.7
-4.9
-8.6
6.0
-1.4
-0.6
-7.6
4.8
3.0
-12.0
-7.3
-7.1
3.5
1.8
-11.9
0.4
3.4
-43.8
-4.2
7.8
-15.7
-1.8
0.4
3.6
8.7
5.1
19.8
5.6
9.3
1.6
4.4
-2.2
-11.2
19.9
-10.1
-3.4
-25.4
-3.1
-7.6
-1.7
-16.0
-7.3
-5.7
2.7
-8.4
12M (%)
59.9
8.5
-8.0
114.7
18.8
15.7
25.1
32.0
-15.8
8.1
8.8
0.1
-9.9
-24.0
29.9
-14.3
-25.4
13.1
3.1
-5.9
41.4
148.5
-26.2
94.5
49.1
5.9
68.7
23.5
98.9
97.2
106.6
86.1
110.2
38.6
49.8
41.9
64.7
2.0
36.8
-3.3
-15.6
-39.9
-9.7
-2.6
15.2
7.9
-15.0
3.6
3.4
-6.6
22 May 2018
34
 Motilal Oswal Financial Services
MOSL Universe stock performance
Company
Others
Arvind
Avenue Super.
BSE
Castrol India
Coromandel Intl
Delta Corp
Interglobe
Indo Count
Info Edge
Kaveri Seed
Manpasand
MCX
Navneet Educat.
Oberoi Realty
Phoenix Mills
PI Inds.
Piramal Enterp.
Quess Corp
SRF
S H Kelkar
Tata Chemicals
Team Lease Serv.
Trident
UPL
V-Guard
1 Day (%)
-2.1
-4.9
-1.0
-3.6
-1.6
-6.3
-0.9
-0.8
-2.0
-1.9
0.5
-1.5
-1.4
-1.4
2.1
-1.5
0.3
-4.5
-2.4
-1.4
2.2
-2.2
-6.5
-3.8
1.6
1M (%)
-7.5
-8.6
-1.5
-17.7
-16.5
-19.5
-24.7
-18.0
-1.5
-8.5
0.2
-5.9
-11.3
-0.7
12.6
-2.6
-8.4
5.2
-15.3
0.8
0.1
22.3
-23.5
-10.8
-9.9
12M (%)
3.7
86.8
-24.9
-23.8
8.7
51.7
6.4
-59.2
39.4
-9.8
8.9
-25.5
-15.8
31.6
77.2
4.1
-16.5
33.0
7.7
-15.0
18.7
131.1
-33.8
-13.9
10.3
22 May 2018
35
 Motilal Oswal Financial Services
NOTES
22 May 2018
36
 Motilal Oswal Financial Services
THEMATIC/STRATEGY RESEARCH GALLERY
 Motilal Oswal Financial Services
REPORT GALLERY
RECENT INITIATING COVERAGE REPORTS
.
Rs
 Motilal Oswal Financial Services
DIFFERENTIATED PRODUCT GALLERY
 Motilal Oswal Financial Services
Explanation of Investment Rating
Investment Rating
BUY
SELL
NEUTRAL
UNDER REVIEW
NOT RATED
Expected return (over 12-month)
>=15%
< - 10%
> - 10 % to 15%
Rating may undergo a change
We have forward looking estimates for the stock but we refrain from assigning recommendation
Telecom
*In case the recommendation given by the Research Analyst becomes inconsistent with the investment rating legend, the Research Analyst shall within 28 days of the inconsistency, take appropriate measures to make the recommendation consistent with the investment rating legend.
Disclosures:
The following Disclosures are being made in compliance with the SEBI Research Analyst Regulations 2014 (herein after referred to as the Regulations).
Motilal Oswal Securities Ltd. (MOSL) is a SEBI Registered Research Analyst having registration no. INH000000412. MOSL, the Research Entity (RE) as defined in the Regulations, is engaged in the business of providing Stock broking services,
Investment Advisory Services, Depository participant services & distribution of various financial products. MOSL is a subsidiary company of Motilal Oswal Financial Service Ltd. (MOFSL). MOFSL is a listed public company, the details in respect of
which are available on
www.motilaloswal.com.
MOSL is registered with the Securities & Exchange Board of India (SEBI) and is a registered Trading Member with National Stock Exchange of India Ltd. (NSE) and Bombay Stock Exchange Limited
(BSE), Metropolitan Stock Exchange Of India Ltd. (MSE) for its stock broking activities & is Depository participant with Central Depository Services Limited (CDSL) & National Securities Depository Limited (NSDL) and is member of Association of
Mutual Funds of India (AMFI) for distribution of financial products. Details of associate entities of Motilal Oswal Securities Limited are available on the website at
http://onlinereports.motilaloswal.com/Dormant/documents/Associate%20Details.pdf
Regulatory Enquiries against Motilal Oswal Securities Limited by SEBI:
SEBI pursuant to a complaint from client Shri C.R. Mohanraj alleging unauthorized trading, issued a letter dated 29th April 2014 to MOSL notifying appointment of an Adjudicating Officer as per SEBI regulations to hold inquiry and
adjudge violation of SEBI Regulations; MOSL requested SEBI to provide all documents, records, investigation report relied upon by SEBI which were referred in Show Cause Notice. The matter is closed and MOSL had to pay Rs. 2
lakhs towards penalty for misplacement of original POA of client.
MOSL, it’s associates, Research Analyst or their relative may have any financial interest in the subject company. MOSL and/or its associates and/or Research Analyst may have beneficial ownership of 1% or more securities in the subject company at
the end of the month immediately preceding the date of publication of the Research Report.
MOSL and its associate company(ies), their directors and Research Analyst and their relatives may; (a) from time to time, have a long or short position in, act
as principal in, and buy or sell the securities or derivatives thereof of companies mentioned herein. (b) be engaged in any other transaction involving such securities and earn brokerage or other compensation or act as a market maker in the financial
instruments of the company(ies) discussed herein or act as an advisor or lender/borrower to such company(ies) or may have any other potential conflict of interests with respect to any recommendation and other related information and opinions.;
however the same shall have no bearing whatsoever on the specific recommendations made by the analyst(s), as the recommendations made by the analyst(s) are completely independent of the views of the associates of MOSL even though there
might exist an inherent conflict of interest in some of the stocks mentioned in the research report.
Research Analyst may have served as director/officer, etc. in the subject company in the last 12 month period. MOSL and/or its associates may have
received any compensation from the subject company in the past 12 months.
In the last 12 months period ending on the last day of the month immediately preceding the date of publication of this research report, MOSL or any of its associates may have:
a)
managed or co-managed public offering of securities from subject company of this research report,
b)
received compensation for investment banking or merchant banking or brokerage services from subject company of this research report,
c)
received compensation for products or services other than investment banking or merchant banking or brokerage services from the subject company of this research report.
d)
Subject Company may have been a client of MOSL or its associates during twelve months preceding the date of distribution of the research report.
MOSL and it’s associates have not received any compensation or other benefits from the subject company or third party in connection with the research report. To enhance transparency, MOSL has incorporated a Disclosure of Interest Statement in
this document. This should, however, not be treated as endorsement of the views expressed in the report. MOSL and / or its affiliates do and seek to do business including investment banking with companies covered in its research reports. As a result,
the recipients of this report should be aware that MOSL may have a potential conflict of interest that may affect the objectivity of this report. Compensation of Research Analysts is not based on any specific merchant banking, investment banking or
brokerage service transactions.
Terms & Conditions:
This report has been prepared by MOSL and is meant for sole use by the recipient and not for circulation. The report and information contained herein is strictly confidential and may not be altered in any way, transmitted to, copied or distributed, in part
or in whole, to any other person or to the media or reproduced in any form, without prior written consent of MOSL. The report is based on the facts, figures and information that are considered true, correct, reliable and accurate. The intent of this report
is not recommendatory in nature. The information is obtained from publicly available media or other sources believed to be reliable. Such information has not been independently verified and no guaranty, representation of warranty, express or implied,
is made as to its accuracy, completeness or correctness. All such information and opinions are subject to change without notice. The report is prepared solely for informational purpose and does not constitute an offer document or solicitation of offer to
buy or sell or subscribe for securities or other financial instruments for the clients. Though disseminated to all the customers simultaneously, not all customers may receive this report at the same time. MOSL will not treat recipients as customers by
virtue of their receiving this report.
Analyst Certification
The views expressed in this research report accurately reflect the personal views of the analyst(s) about the subject securities or issues, and no part of the compensation of the research analyst(s) was, is, or will be directly or indirectly related to the
specific recommendations and views expressed by research analyst(s) in this report.
Disclosure of Interest Statement
Analyst ownership of the stock
Companies where there is interest
No
A graph of daily closing prices of securities is available at
www.nseindia.com, www.bseindia.com.
Research Analyst views on Subject Company may vary based on Fundamental research and Technical Research. Proprietary trading desk of MOSL or
its associates maintains arm’s length distance with Research Team as all the activities are segregated from MOSL research activity and therefore it can have an independent view with regards to subject company for which Research Team have
expressed their views.
Regional Disclosures (outside India)
This report is not directed or intended for distribution to or use by any person or entity resident in a state, country or any jurisdiction, where such distribution, publication, availability or use would be contrary to law, regulation or which would subject
MOSL & its group companies to registration or licensing requirements within such jurisdictions.
For Hong Kong:
This report is distributed in Hong Kong by Motilal Oswal capital Markets (Hong Kong) Private Limited, a licensed corporation (CE AYY-301) licensed and regulated by the Hong Kong Securities and Futures Commission (SFC) pursuant to the Securities
and Futures Ordinance (Chapter 571 of the Laws of Hong Kong) “SFO”. As per SEBI (Research Analyst Regulations) 2014 Motilal Oswal Securities (SEBI Reg No. INH000000412) has an agreement with Motilal Oswal capital Markets (Hong Kong)
Private Limited for distribution of research report in Hong Kong. This report is intended for distribution only to “Professional Investors” as defined in Part I of Schedule 1 to SFO. Any investment or investment activity to which this document relates is only
available to professional investor and will be engaged only with professional investors.” Nothing here is an offer or solicitation of these securities, products and services in any jurisdiction where their offer or sale is not qualified or exempt from
registration. The Indian Analyst(s) who compile this report is/are not located in Hong Kong & are not conducting Research Analysis in Hong Kong.
For U.S.
Motilal Oswal Securities Limited (MOSL) is not a registered broker - dealer under the U.S. Securities Exchange Act of 1934, as amended (the"1934 act") and under applicable state laws in the United States. In addition MOSL is not a registered
investment adviser under the U.S. Investment Advisers Act of 1940, as amended (the "Advisers Act" and together with the 1934 Act, the "Acts), and under applicable state laws in the United States. Accordingly, in the absence of specific exemption
under the Acts, any brokerage and investment services provided by MOSL, including the products and services described herein are not available to or intended for U.S. persons. This report is intended for distribution only to "Major Institutional
Investors" as defined by Rule 15a-6(b)(4) of the Exchange Act and interpretations thereof by SEC (henceforth referred to as "major institutional investors"). This document must not be acted on or relied on by persons who are not major institutional
investors. Any investment or investment activity to which this document relates is only available to major institutional investors and will be engaged in only with major institutional investors. In reliance on the exemption from registration provided by Rule
15a-6 of the U.S. Securities Exchange Act of 1934, as amended (the "Exchange Act") and interpretations thereof by the U.S. Securities and Exchange Commission ("SEC") in order to conduct business with Institutional Investors based in the U.S.,
MOSL has entered into a chaperoning agreement with a U.S. registered broker-dealer, Motilal Oswal Securities International Private Limited. ("MOSIPL"). Any business interaction pursuant to this report will have to be executed within the provisions of
this chaperoning agreement.
The Research Analysts contributing to the report may not be registered /qualified as research analyst with FINRA. Such research analyst may not be associated persons of the U.S. registered broker-dealer, MOSIPL, and therefore, may not be subject
to NASD rule 2711 and NYSE Rule 472 restrictions on communication with a subject company, public appearances and trading securities held by a research analyst account.
For Singapore
In Singapore, this report is being distributed by Motilal Oswal Capital Markets Singapore Pte Ltd (“MOCMSPL”) (Co.Reg. NO. 201129401Z) which is a holder of a capital markets services license and an exempt financial adviser in Singapore,
as per the approved agreement under Paragraph 9 of Third Schedule of Securities and Futures Act (CAP 289) and Paragraph 11 of First Schedule of Financial Advisors Act (CAP 110) provided to MOCMSPL by Monetary Authority of Singapore.
Persons in Singapore should contact MOCMSPL in respect of any matter arising from, or in connection with this report/publication/communication. This report is distributed solely to persons who qualify as “Institutional Investors”, of which some of
whom may consist of "accredited" institutional investors as defined in section 4A(1) of the Securities and Futures Act, Chapter 289 of Singapore (“the SFA”). Accordingly, if a Singapore person is not or ceases to be such an institutional investor, such
Singapore Person must immediately discontinue any use of this Report and inform MOCMSPL.
Disclaimer:
The report and information contained herein is strictly confidential and meant solely for the selected recipient and may not be altered in any way, transmitted to, copied or distributed, in part or in whole, to any other person or to the media or reproduced
in any form, without prior written consent. This report and information herein is solely for informational purpose and may not be used or considered as an offer document or solicitation of offer to buy or sell or subscribe for securities or other financial
instruments. Nothing in this report constitutes investment, legal, accounting and tax advice or a representation that any investment or strategy is suitable or appropriate to your specific circumstances. The securities discussed and opinions expressed in
this report may not be suitable for all investors, who must make their own investment decisions, based on their own investment objectives, financial positions and needs of specific recipient. This may not be taken in substitution for the exercise of
independent judgment by any recipient. Each recipient of this document should make such investigations as it deems necessary to arrive at an independent evaluation of an investment in the securities of companies referred to in this document
(including the merits and risks involved), and should consult its own advisors to determine the merits and risks of such an investment. The investment discussed or views expressed may not be suitable for all investors. Certain transactions -including
those involving futures, options, another derivative products as well as non-investment grade securities - involve substantial risk and are not suitable for all investors. No representation or warranty, express or implied, is made as to the accuracy,
completeness or fairness of the information and opinions contained in this document. The Disclosures of Interest Statement incorporated in this document is provided solely to enhance the transparency and should not be treated as endorsement of the
views expressed in the report. This information is subject to change without any prior notice. The Company reserves the right to make modifications and alternations to this statement as may be required from time to time without any prior approval.
MOSL, its associates, their directors and the employees may from time to time, effect or have effected an own account transaction in, or deal as principal or agent in or for the securities mentioned in this document. They may perform or seek to perform
investment banking or other services for, or solicit investment banking or other business from, any company referred to in this report. Each of these entities functions as a separate, distinct and independent of each other. The recipient should take this
into account before interpreting the document. This report has been prepared on the basis of information that is already available in publicly accessible media or developed through analysis of MOSL. The views expressed are those of the analyst, and
the Company may or may not subscribe to all the views expressed therein. This document is being supplied to you solely for your information and may not be reproduced, redistributed or passed on, directly or indirectly, to any other person or
published, copied, in whole or in part, for any purpose. This report is not directed or intended for distribution to, or use by, any person or entity who is a citizen or resident of or located in any locality, state, country or other jurisdiction, where such
distribution, publication, availability or use would be contrary to law, regulation or which would subject MOSL to any registration or licensing requirement within such jurisdiction. The securities described herein may or may not be eligible for sale in all
jurisdictions or to certain category of investors. Persons in whose possession this document may come are required to inform themselves of and to observe such restriction. Neither the Firm, not its directors, employees, agents or representatives shall
be liable for any damages whether direct or indirect, incidental, special or consequential including lost revenue or lost profits that may arise from or in connection with the use of the information.
The person accessing this information specifically agrees
to exempt MOSL or any of its affiliates or employees from, any and all responsibility/liability arising from such misuse and agrees not to hold MOSL or any of its affiliates or employees responsible for any such misuse and further agrees to hold MOSL
or any of its affiliates or employees free and harmless from all losses, costs, damages, expenses that may be suffered by the person accessing this information due to any errors and delays.
Registered Office Address: Motilal Oswal Tower, Rahimtullah Sayani Road, Opposite Parel ST Depot, Prabhadevi, Mumbai-400025; Tel No.: 022-3980 4263; www.motilaloswal.com. Correspondence Address: Palm Spring Centre, 2nd Floor, Palm
Court Complex, New Link Road, Malad (West), Mumbai- 400 064. Tel No: 022 3080 1000. Compliance Officer: Neeraj Agarwal, Email Id:
na@motilaloswal.com,
Contact No.:022-30801085.
Registration details of group entities.: MOSL: SEBI Registration: INZ000158836 (BSE/NSE/MSE); CDSL: IN-DP-16-2015; NSDL: IN-DP-NSDL-152-2000; Research Analyst: INH000000412. AMFI: ARN 17397. Investment Adviser: INA000007100.
Motilal Oswal Asset Management Company Ltd. (MOAMC): PMS (Registration No.: INP000000670) offers PMS and Mutual Funds products. Motilal Oswal Wealth Management Ltd. (MOWML): PMS (Registration No.: INP000004409) offers wealth
management solutions. *Motilal Oswal Securities Ltd. is a distributor of Mutual Funds, PMS, Fixed Deposit, Bond, NCDs, Insurance and IPO products. * Motilal Oswal Commodities Broker Pvt. Ltd. offers Commodities Products. * Motilal Oswal Real
Estate Investment Advisors II Pvt. Ltd. offers Real Estate products. * Motilal Oswal Private Equity Investment Advisors Pvt. Ltd. offers Private Equity products
15 May 2018
6